Embed Size (px)
Citation preview
May 2016
INVESTOR PRESENTATION
2
Safe Harbor / Disclaimer
This presentation includes forward-looking statements within the meaning of the Private Securities Litigation Reform
Act of 1995, which relate to future, not past, events and are subject to risks and uncertainties. The forward-looking
statements, which address the Company's expected business and financial performance and financial condition,
among other matters, contain words such as: “believe,” “could,” “opportunities,” “continue,” “expect,” “may,” “will,” or
“would” and other words and terms of similar meaning.
Forward-looking statements by their nature address matters that are, to different degrees, uncertain, such as
statements about expected income; earnings; revenues; and growth. Although the Company believes the
expectations reflected in such forward-looking statements are based upon reasonable assumptions, it can give no
assurance that the expectations will be attained or that any deviation will not be material. Readers are cautioned not to
place undue reliance on these forward-looking statements, which speak only as of the date on which they are made.
Factors that could cause actual results to differ materially from these forward-looking statements can be found in the
Company’s Annual Report on Form 10-K, Quarterly Reports on Form 10-Q and the Company’s other reports filed with
the Securities and Exchange Commission. These or other uncertainties may cause the Company’s actual future
results to be materially different than those expressed in any forward-looking statements. The Company undertakes
no obligation to update or revise any forward-looking statements.
This presentation also contains estimates and other statistical data made by independent parties and by us relating to
market size and growth and other data about our industry. This data involves a number of assumptions and limitations,
and you are cautioned not to give undue weight to such estimates. In addition, projections, assumptions and estimates
of our future performance and the future performance of the markets in which we operate are necessarily subject to a
high degree of uncertainty and risk.
This presentation also contains non-GAAP financial measures. You can find a reconciliation of the non-GAAP financial
measures to the most directly comparable GAAP financial measures in the appendix to this presentation.
Press Ganey Overview
Mission
To help healthcare organizations reduce patient and caregiver
suffering and improve clinical quality, safety and the overall
patient experience
Transformational Solutions
Patient Experience
Caregiver Engagement
Clinical Quality
Reliability & Safety
3
4
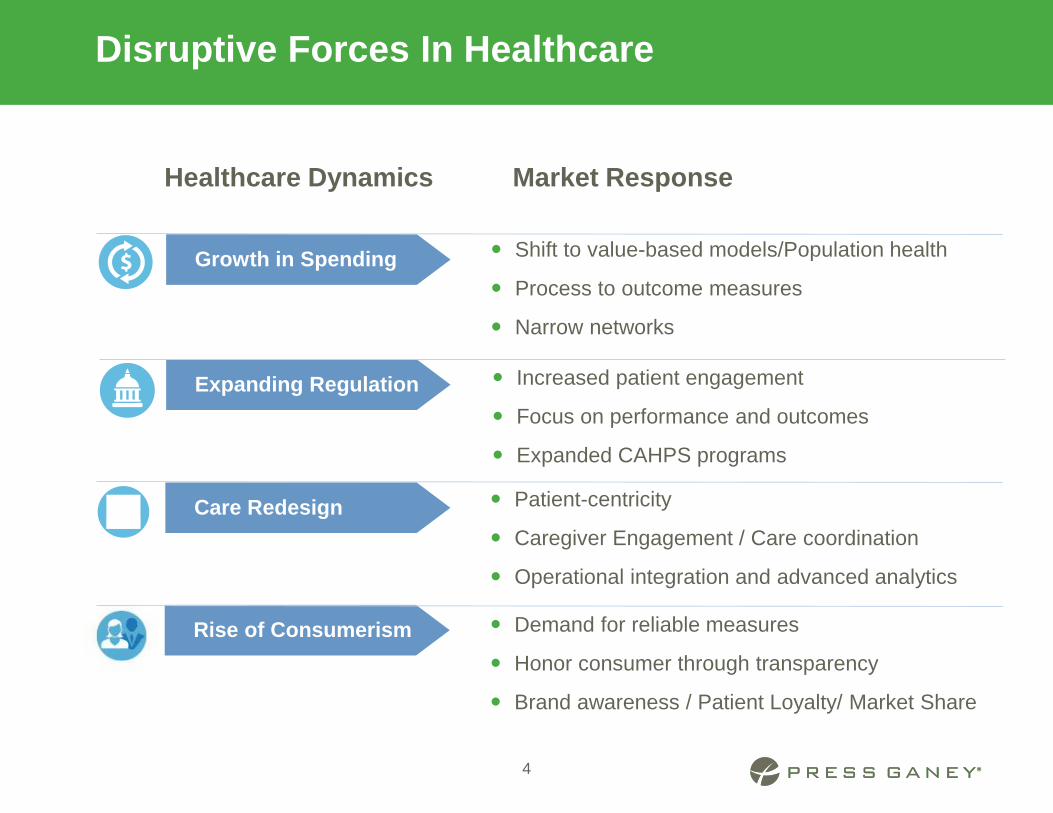
Disruptive Forces In Healthcare
Shift to value-based models/Population health
Process to outcome measures
Narrow networks
Growth in Spending
Patient-centricity
Caregiver Engagement / Care coordination
Operational integration and advanced analytics
Demand for reliable measures
Honor consumer through transparency
Brand awareness / Patient Loyalty/ Market Share
Increased patient engagement
Focus on performance and outcomes
Expanded CAHPS programs
Care Redesign
Market ResponseHealthcare Dynamics
Expanding Regulation
Rise of Consumerism
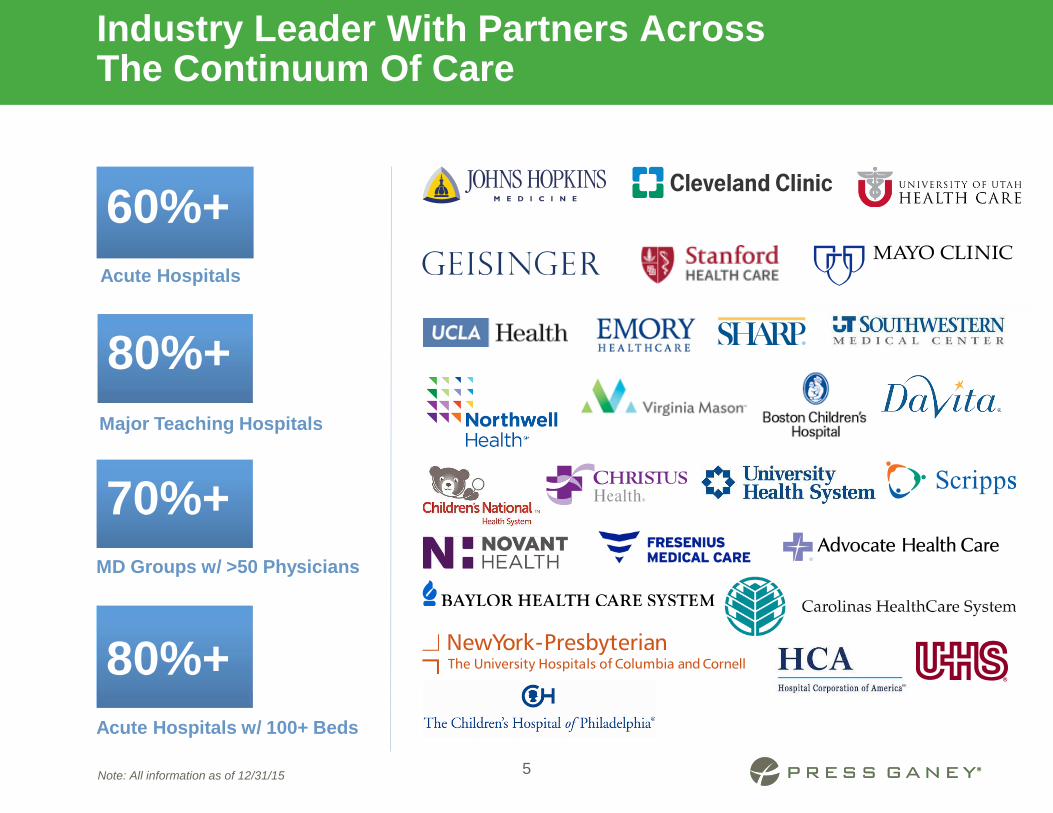
Industry Leader With Partners AcrossThe Continuum Of Care
80%+
60%+
80%+
70%+
Note: All information as of 12/31/155
Acute Hospitals
Major Teaching Hospitals
MD Groups w/ >50 Physicians
Acute Hospitals w/ 100+ Beds
6
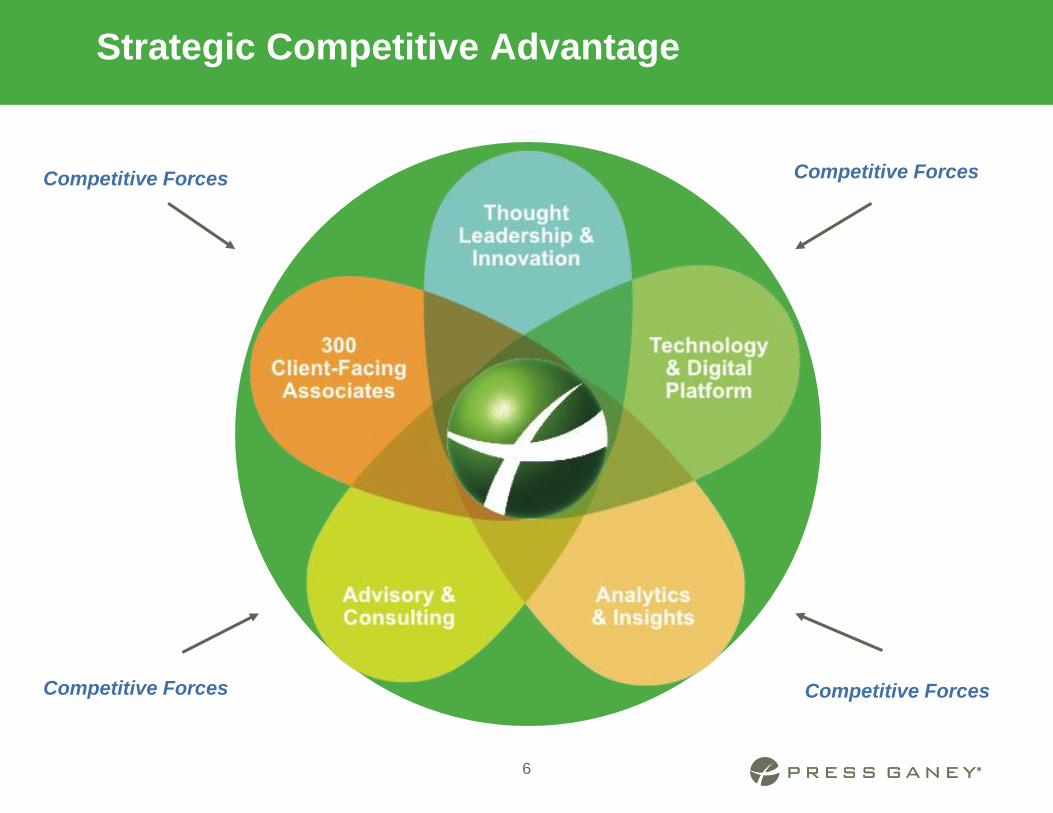
Strategic Competitive Advantage
Competitive Forces Competitive Forces
Competitive Forces Competitive Forces

OUR SOLUTIONS
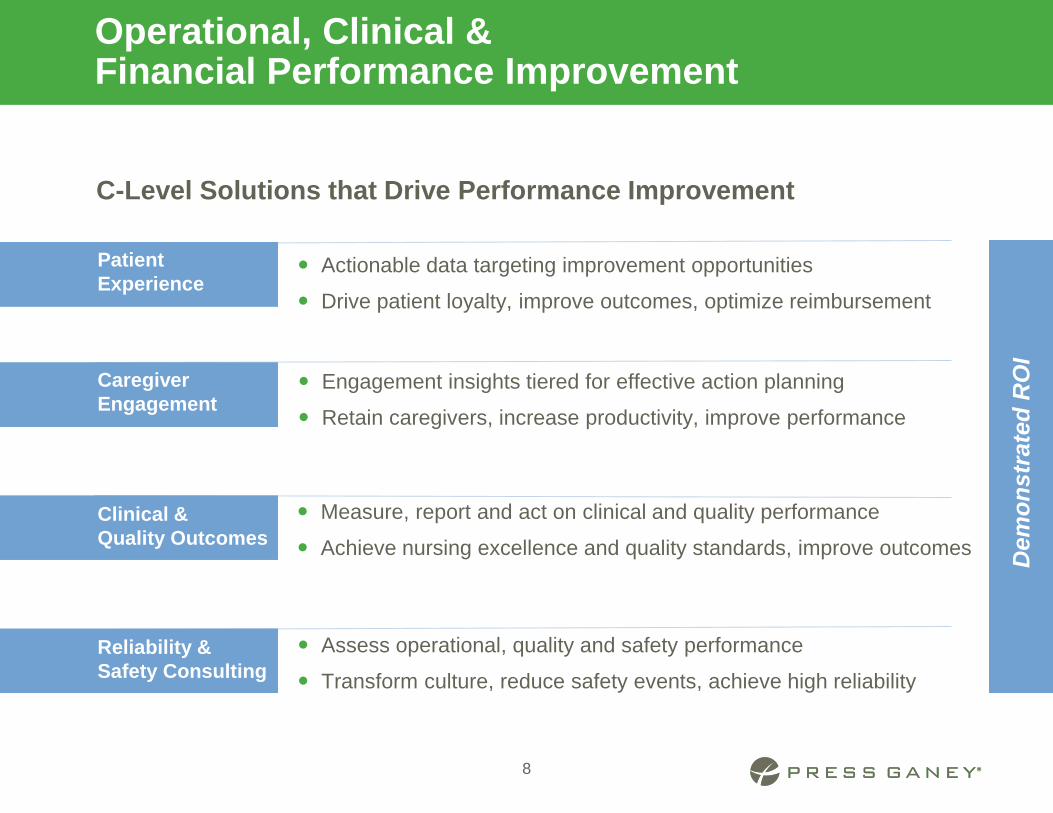
Actionable data targeting improvement opportunities
Drive patient loyalty, improve outcomes, optimize reimbursement
Operational, Clinical & Financial Performance Improvement
8
Engagement insights tiered for effective action planning
Retain caregivers, increase productivity, improve performance
Measure, report and act on clinical and quality performance
Achieve nursing excellence and quality standards, improve outcomes
Assess operational, quality and safety performance
Transform culture, reduce safety events, achieve high reliability
C-Level Solutions that Drive Performance Improvement
Patient
Experience
Dem
on
str
ate
d R
OI
Caregiver
Engagement
Clinical &
Quality Outcomes
Reliability &
Safety Consulting
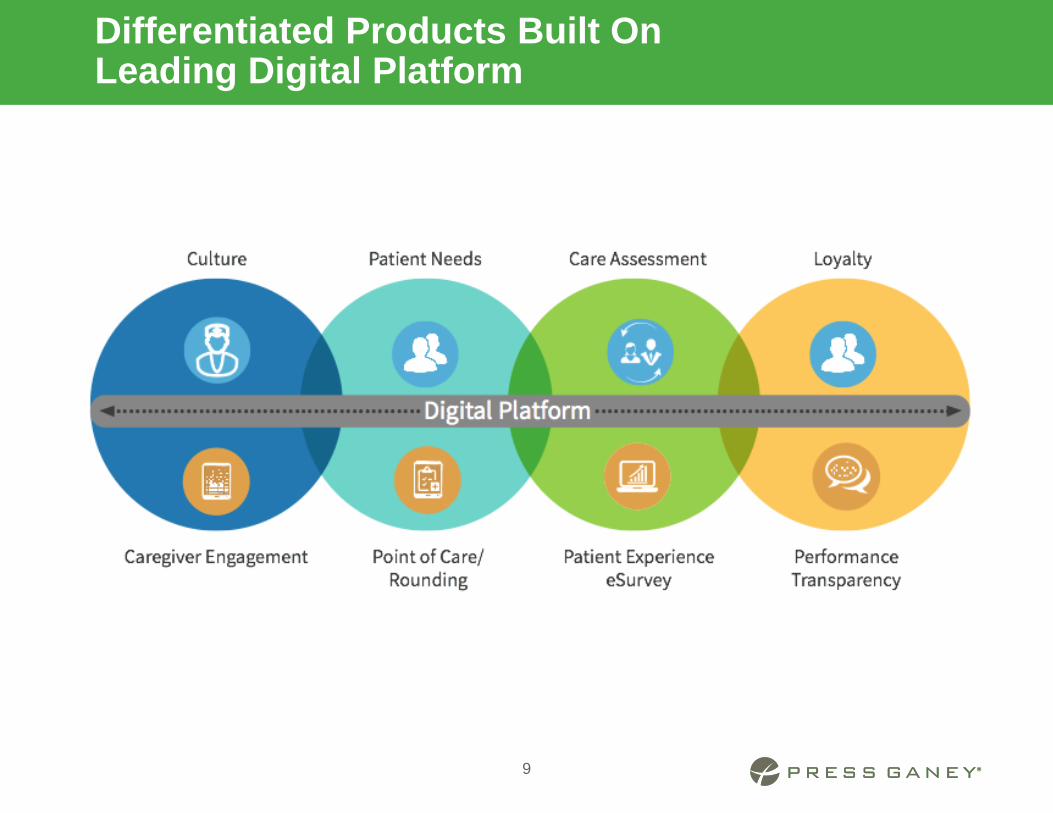
Differentiated Products Built On Leading Digital Platform
9
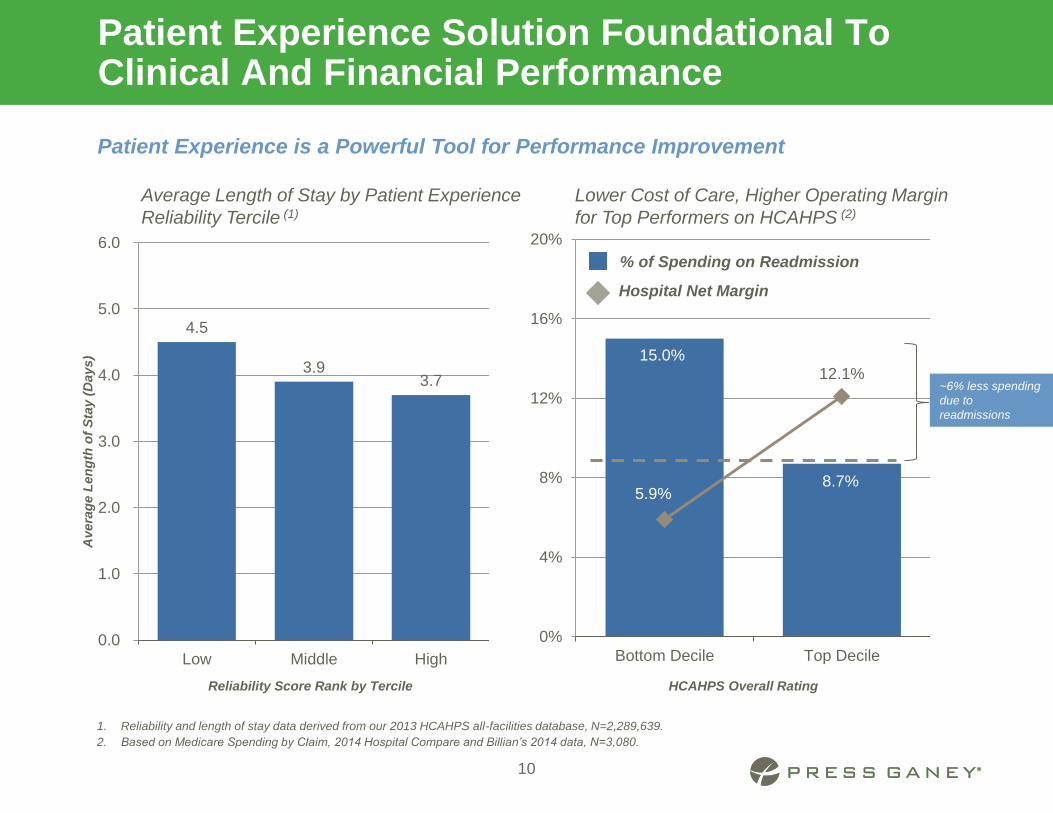
4.5
3.9 3.7
0.0
1.0
2.0
3.0
4.0
5.0
6.0
Low Middle High
Avera
ge L
en
gth
of
Sta
y (
Days)
Reliability Score Rank by Tercile
1. Reliability and length of stay data derived from our 2013 HCAHPS all-facilities database, N=2,289,639.
2. Based on Medicare Spending by Claim, 2014 Hospital Compare and Billian’s 2014 data, N=3,080.
15.0%
8.7%5.9%
12.1%
0%
4%
8%
12%
16%
20%
Bottom Decile Top Decile
~6% less spending
due to
readmissions
Patient Experience Solution Foundational To Clinical And Financial Performance
Average Length of Stay by Patient Experience
Reliability Tercile (1)
Lower Cost of Care, Higher Operating Margin
for Top Performers on HCAHPS (2)
Patient Experience is a Powerful Tool for Performance Improvement
Hospital Net Margin
10
% of Spending on Readmission
HCAHPS Overall Rating
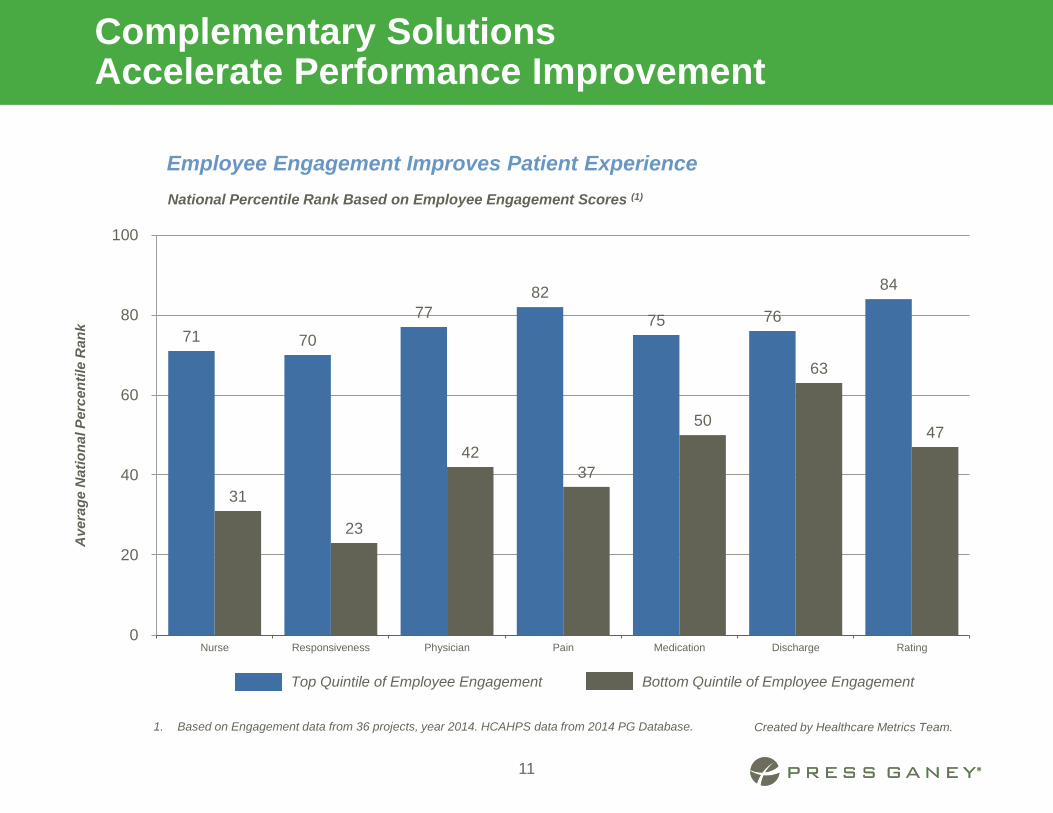
71 70
77
82
75 76
84
31
23
42
37
50
63
47
0
20
40
60
80
100
Nurse Responsiveness Physician Pain Medication Discharge Rating
Av
era
ge
Na
tio
na
l P
erc
en
tile
Ra
nk
Top Quintile of Employee Engagement Bottom Quintile of Employee Engagement
National Percentile Rank Based on Employee Engagement Scores (1)
Employee Engagement Improves Patient Experience
1. Based on Engagement data from 36 projects, year 2014. HCAHPS data from 2014 PG Database.
Complementary Solutions Accelerate Performance Improvement
11
Created by Healthcare Metrics Team.
12
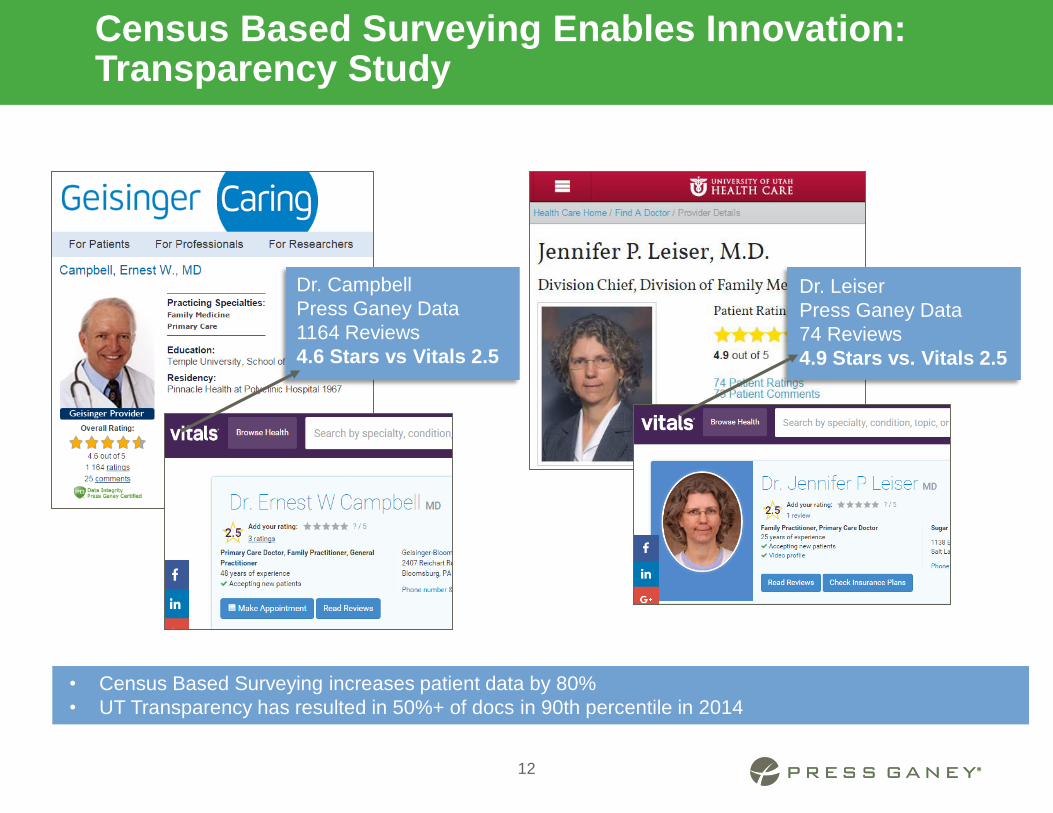
Census Based Surveying Enables Innovation: Transparency Study
• Census Based Surveying increases patient data by 80%
• UT Transparency has resulted in 50%+ of docs in 90th percentile in 2014
Dr. Campbell
Press Ganey Data
1164 Reviews
4.6 Stars vs Vitals 2.5
Dr. Leiser
Press Ganey Data
74 Reviews
4.9 Stars vs. Vitals 2.5
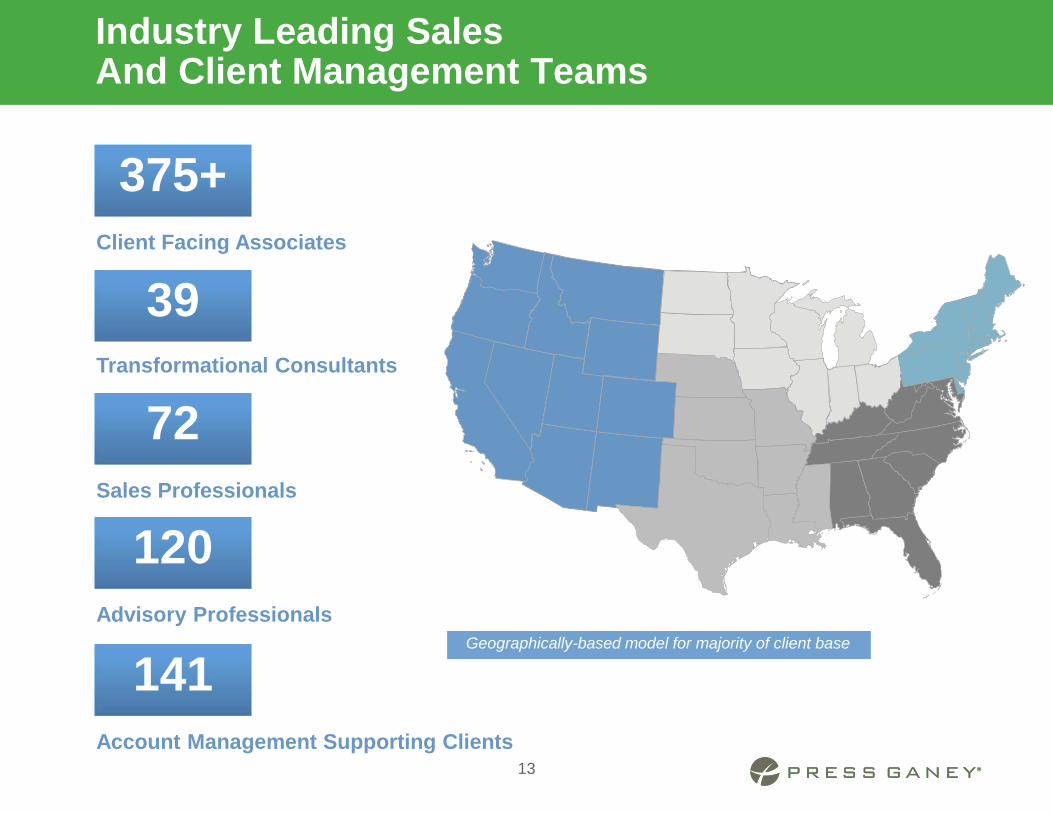
Industry Leading Sales And Client Management Teams
13
375+
Client Facing Associates
Transformational Consultants
Sales Professionals
Advisory Professionals
Account Management Supporting Clients
39
72
120
141Geographically-based model for majority of client base
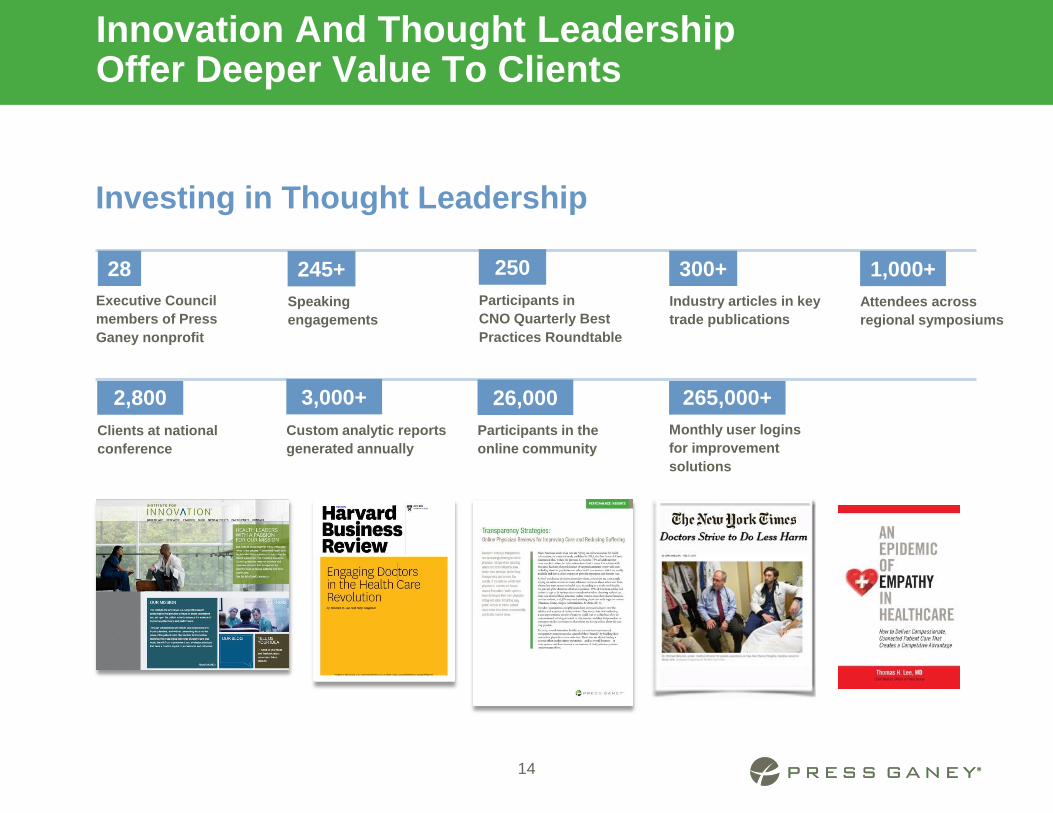
Innovation And Thought Leadership Offer Deeper Value To Clients
Executive Council
members of Press
Ganey nonprofit
Speaking
engagements
Clients at national
conference
Attendees across
regional symposiums
Monthly user logins
for improvement
solutions
14
Investing in Thought Leadership
28 245+
2,800
1,000+
265,000+
Industry articles in key
trade publications
Participants in the
online community
Custom analytic reports
generated annually
300+
26,0003,000+
Participants in
CNO Quarterly Best
Practices Roundtable
250

GROWTH STRATEGY / TOTAL ADDRESSABLE MARKET
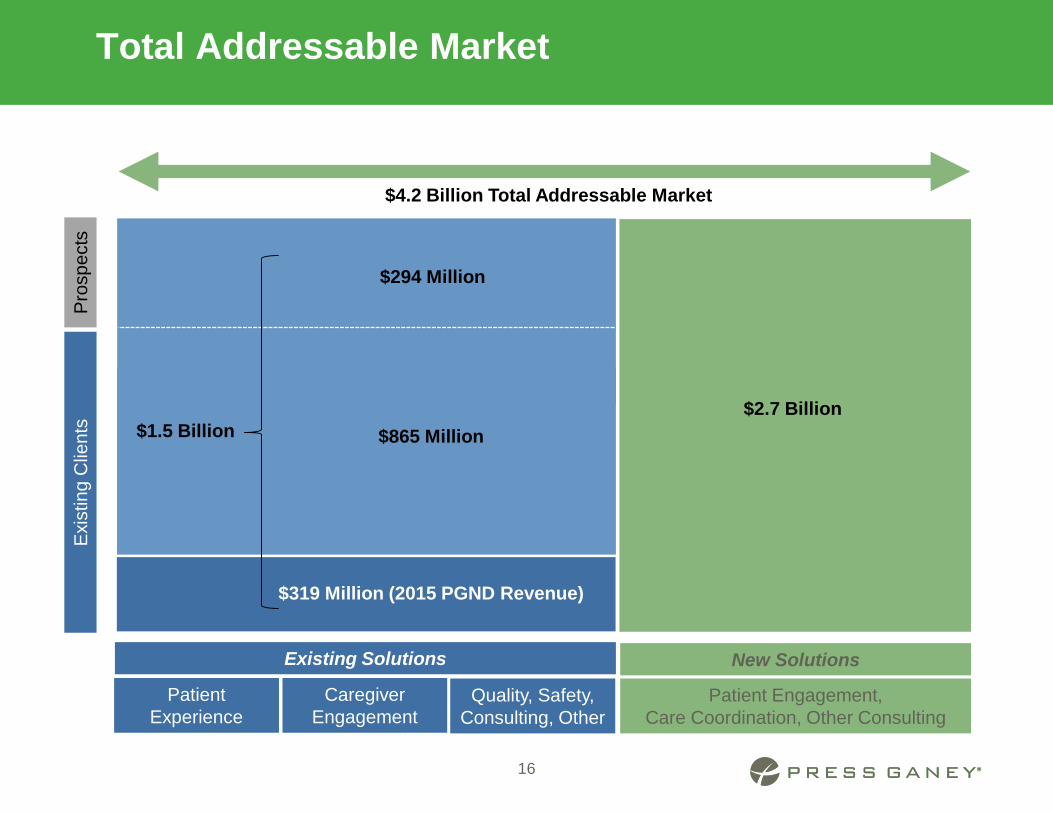
Total Addressable Market
16
Quality, Safety,
Consulting, Other
Exis
ting C
lients
Pro
spects
Patient
Experience
Caregiver
Engagement
$319 Million (2015 PGND Revenue)
Patient Engagement,
Care Coordination, Other Consulting
$865 Million
$294 Million
$2.7 Billion
New SolutionsExisting Solutions
$4.2 Billion Total Addressable Market
$1.5 Billion
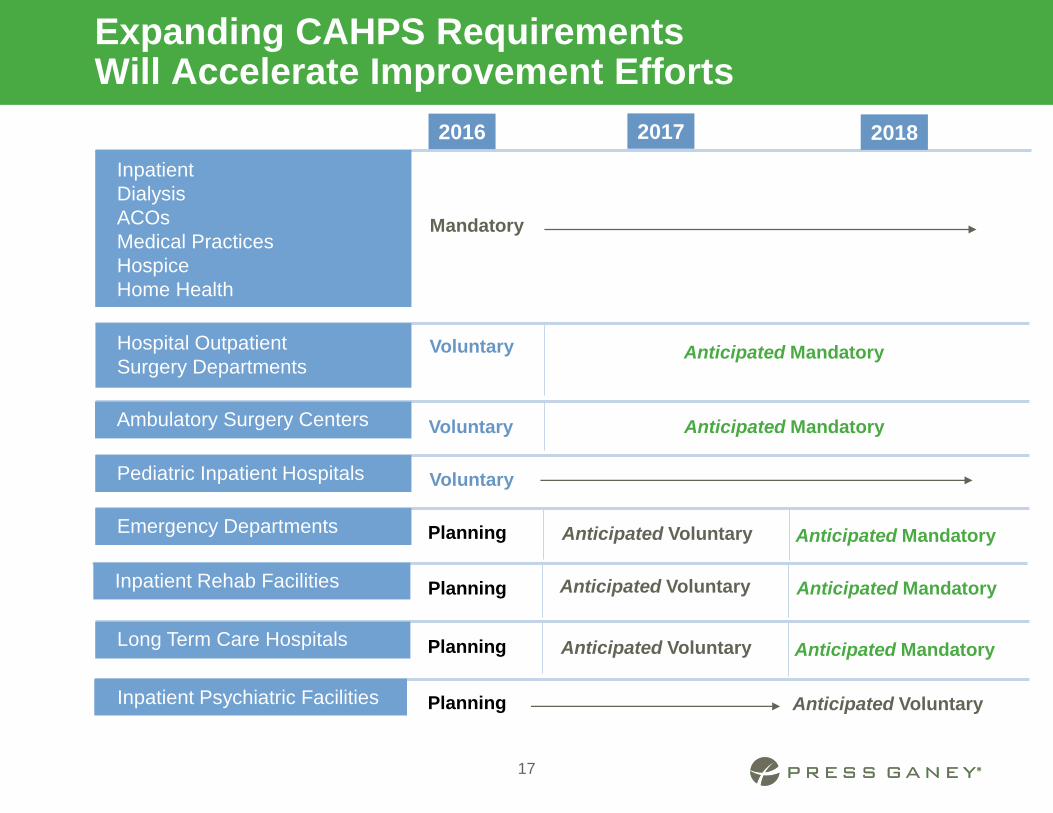
Expanding CAHPS Requirements Will Accelerate Improvement Efforts
2%17 2%2%
2%
Hospital Outpatient
Surgery DepartmentsVoluntary Anticipated Mandatory
2016 2017 2018
Ambulatory Surgery Centers Voluntary Anticipated Mandatory
Pediatric Inpatient Hospitals
Emergency Departments Planning Anticipated Voluntary Anticipated Mandatory
Long Term Care Hospitals Planning Anticipated Voluntary Anticipated Mandatory
Inpatient Psychiatric Facilities Planning Anticipated Voluntary
Inpatient
Dialysis
ACOs
Medical Practices
Hospice
Home Health
Mandatory
Inpatient Rehab Facilities Planning Anticipated Voluntary Anticipated Mandatory
Voluntary
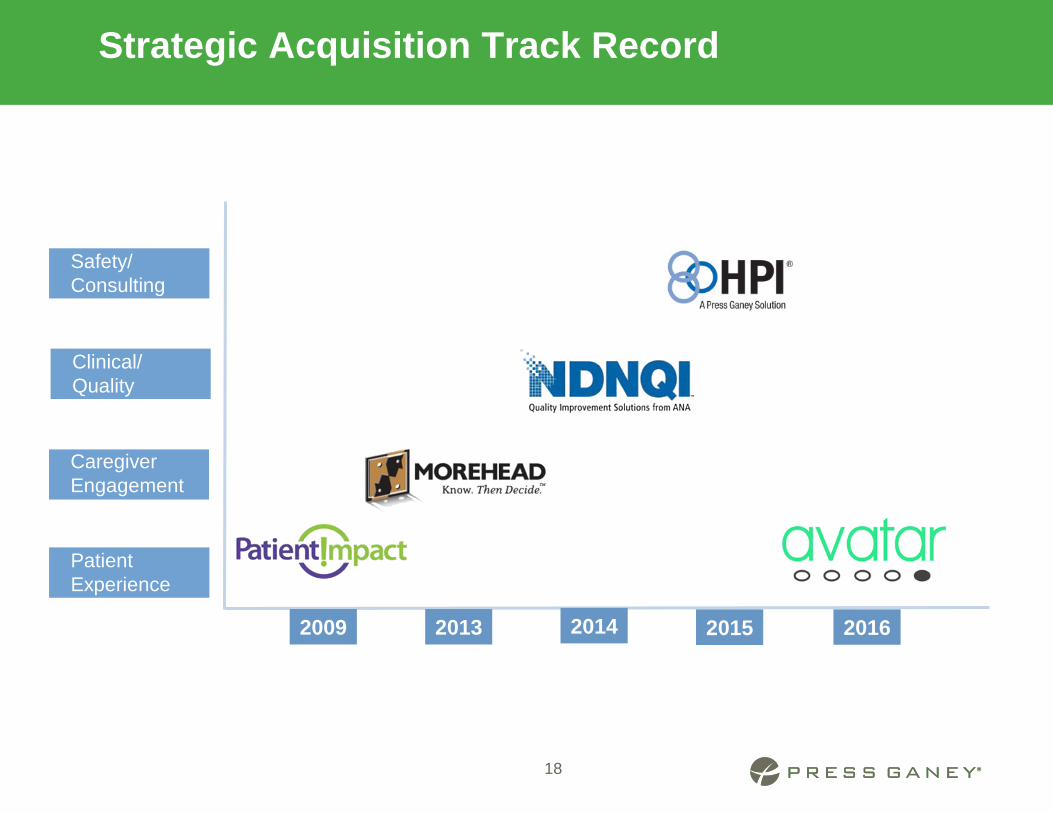
Strategic Acquisition Track Record
18
2009
Caregiver
Engagement
Safety/
Consulting
Clinical/
Quality
Patient
Experience
2013 2014 2015 2016
FINANCIAL REVIEW
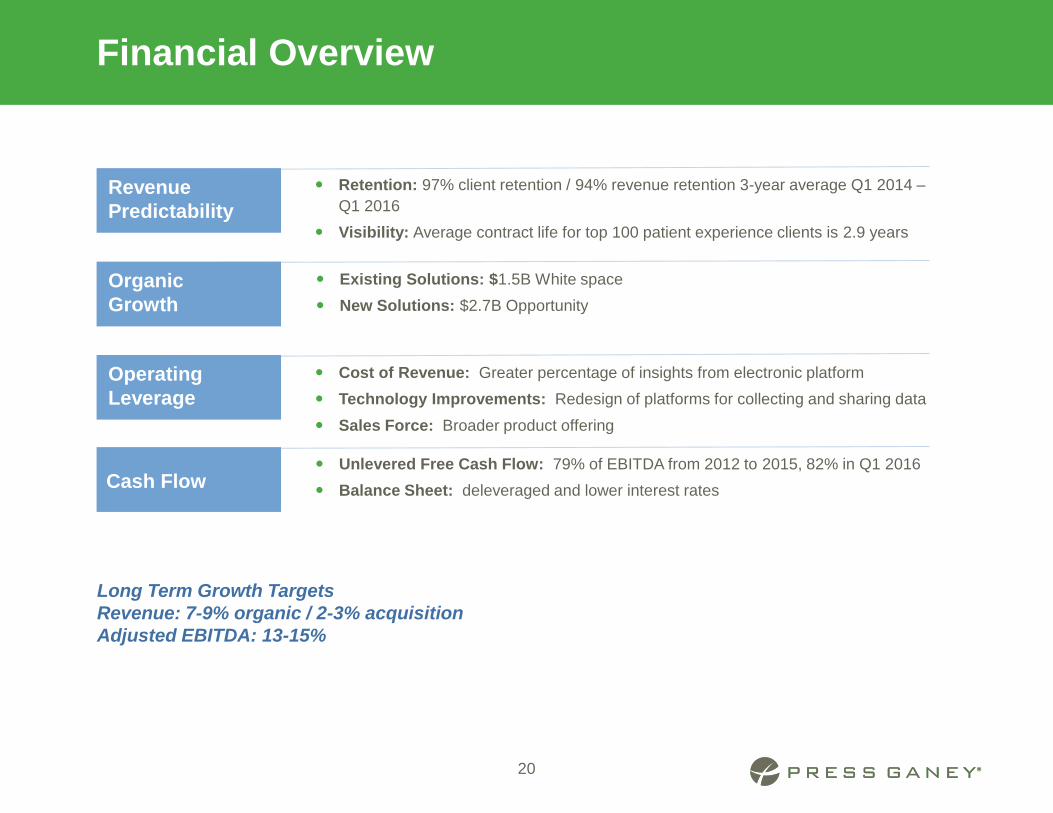
Financial Overview
20
Revenue
Predictability
Retention: 97% client retention / 94% revenue retention 3-year average Q1 2014 –
Q1 2016
Visibility: Average contract life for top 100 patient experience clients is 2.9 years
Existing Solutions: $1.5B White space
New Solutions: $2.7B Opportunity
Cost of Revenue: Greater percentage of insights from electronic platform
Technology Improvements: Redesign of platforms for collecting and sharing data
Sales Force: Broader product offering
Unlevered Free Cash Flow: 79% of EBITDA from 2012 to 2015, 82% in Q1 2016
Balance Sheet: deleveraged and lower interest rates
Organic
Growth
Operating
Leverage
Cash Flow
Long Term Growth Targets
Revenue: 7-9% organic / 2-3% acquisition
Adjusted EBITDA: 13-15%

$0
$50
$100
$150
$200
$250
$300
$350
2012 2013 2014 2015 1Q15 1Q16
Revenue
Growth Track Record
($ in millions)
$0
$25
$50
$75
$100
$125
2012 2013 2014 2015 1Q15 1Q16
Adjusted EBITDA
21
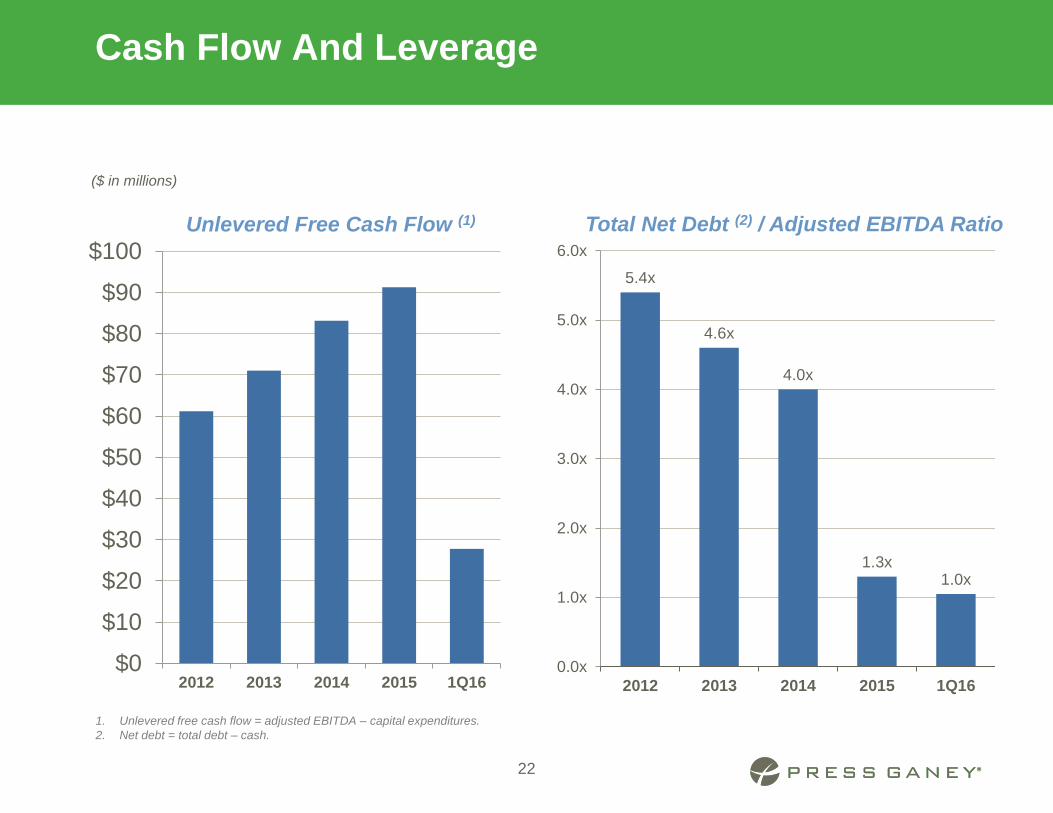
5.4x
4.6x
4.0x
1.3x1.0x
0.0x
1.0x
2.0x
3.0x
4.0x
5.0x
6.0x
2012 2013 2014 2015 1Q16
Total Net Debt (2) / Adjusted EBITDA Ratio
Cash Flow And Leverage
1. Unlevered free cash flow = adjusted EBITDA – capital expenditures.
2. Net debt = total debt – cash.
($ in millions)
$0
$10
$20
$30
$40
$50
$60
$70
$80
$90
$100
2012 2013 2014 2015 1Q16
Unlevered Free Cash Flow (1)
22
APPENDIX
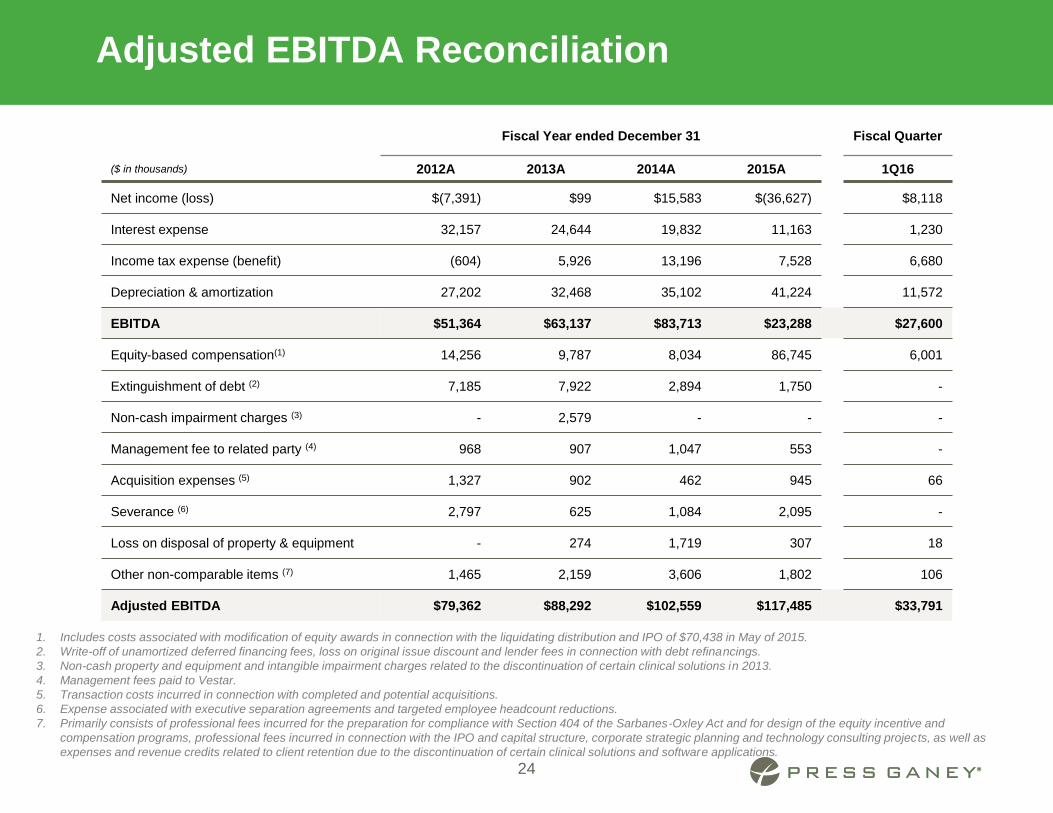
Adjusted EBITDA Reconciliation
1. Includes costs associated with modification of equity awards in connection with the liquidating distribution and IPO of $70,438 in May of 2015.
2. Write-off of unamortized deferred financing fees, loss on original issue discount and lender fees in connection with debt refinancings.
3. Non-cash property and equipment and intangible impairment charges related to the discontinuation of certain clinical solutions in 2013.
4. Management fees paid to Vestar.
5. Transaction costs incurred in connection with completed and potential acquisitions.
6. Expense associated with executive separation agreements and targeted employee headcount reductions.
7. Primarily consists of professional fees incurred for the preparation for compliance with Section 404 of the Sarbanes-Oxley Act and for design of the equity incentive and
compensation programs, professional fees incurred in connection with the IPO and capital structure, corporate strategic planning and technology consulting projects, as well as
expenses and revenue credits related to client retention due to the discontinuation of certain clinical solutions and software applications.
Fiscal Year ended December 31 Fiscal Quarter
($ in thousands) 2012A 2013A 2014A 2015A 1Q16
Net income (loss) $(7,391) $99 $15,583 $(36,627) $8,118
Interest expense 32,157 24,644 19,832 11,163 1,230
Income tax expense (benefit) (604) 5,926 13,196 7,528 6,680
Depreciation & amortization 27,202 32,468 35,102 41,224 11,572
EBITDA $51,364 $63,137 $83,713 $23,288 $27,600
Equity-based compensation(1) 14,256 9,787 8,034 86,745 6,001
Extinguishment of debt (2) 7,185 7,922 2,894 1,750 -
Non-cash impairment charges (3) - 2,579 - - -
Management fee to related party (4) 968 907 1,047 553 -
Acquisition expenses (5) 1,327 902 462 945 66
Severance (6) 2,797 625 1,084 2,095 -
Loss on disposal of property & equipment - 274 1,719 307 18
Other non-comparable items (7) 1,465 2,159 3,606 1,802 106
Adjusted EBITDA $79,362 $88,292 $102,559 $117,485 $33,791
24
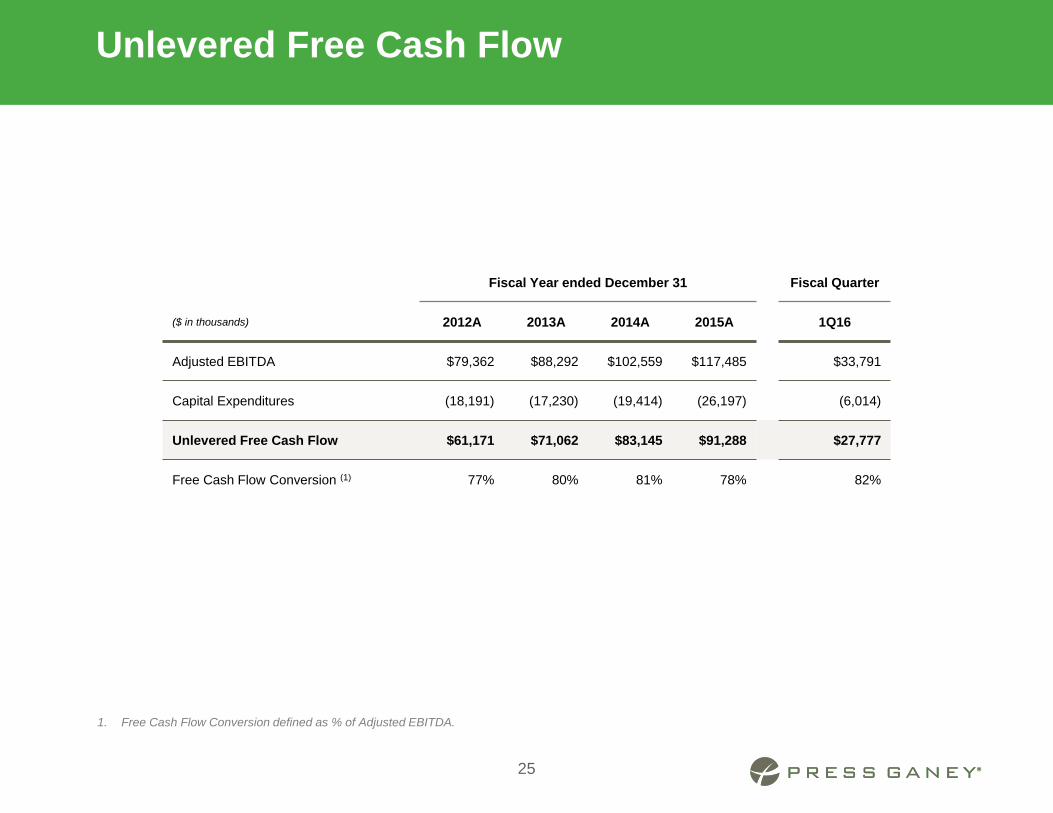
Unlevered Free Cash Flow
Fiscal Year ended December 31 Fiscal Quarter
($ in thousands) 2012A 2013A 2014A 2015A 1Q16
Adjusted EBITDA $79,362 $88,292 $102,559 $117,485 $33,791
Capital Expenditures (18,191) (17,230) (19,414) (26,197) (6,014)
Unlevered Free Cash Flow $61,171 $71,062 $83,145 $91,288 $27,777
Free Cash Flow Conversion (1) 77% 80% 81% 78% 82%
1. Free Cash Flow Conversion defined as % of Adjusted EBITDA.
25
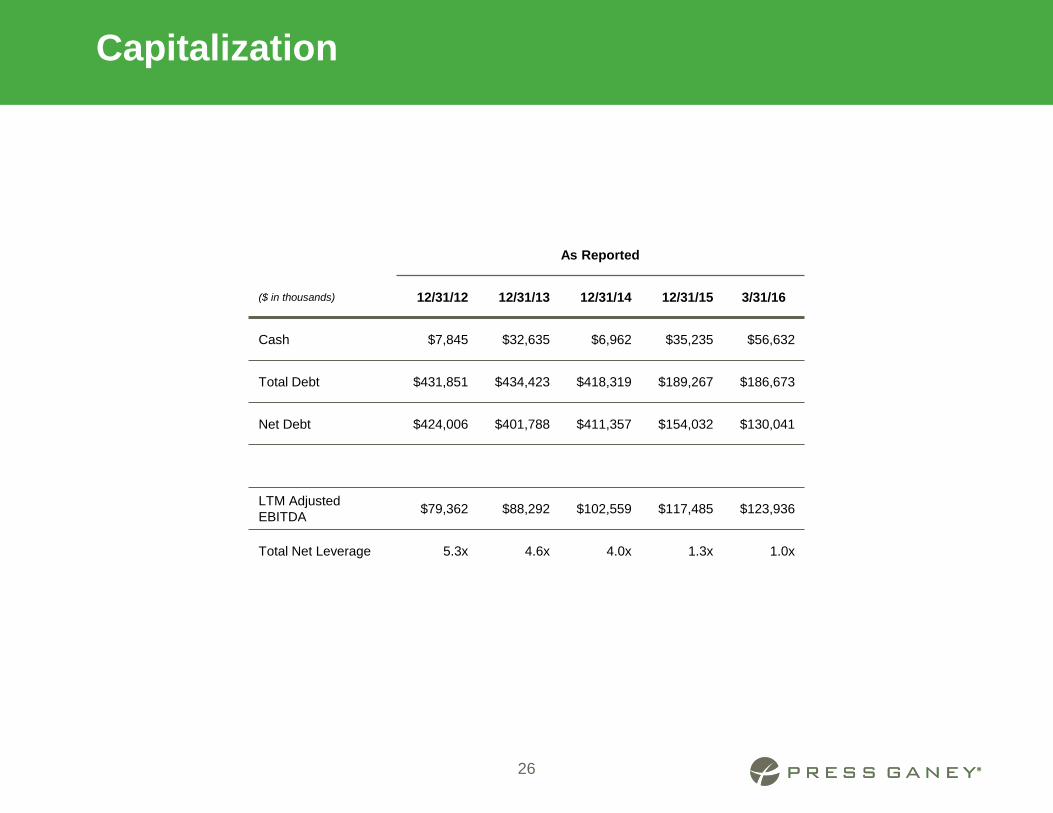
Capitalization
As Reported
($ in thousands) 12/31/12 12/31/13 12/31/14 12/31/15 3/31/16
Cash $7,845 $32,635 $6,962 $35,235 $56,632
Total Debt $431,851 $434,423 $418,319 $189,267 $186,673
Net Debt $424,006 $401,788 $411,357 $154,032 $130,041
LTM Adjusted
EBITDA $79,362 $88,292 $102,559 $117,485 $123,936
Total Net Leverage 5.3x 4.6x 4.0x 1.3x 1.0x
26


![Investor Relations - hanatourcompany.comhanatour]ir_presentation_june... · Investor Relations 1 Investor Relations Jun. 2009.(Korean) 2 ... (cf. 국내소비0.3% 증가, 자료:한국은행,2006)](https://img.dokumen.tips/doc/110x75/5a881d307f8b9a87368ecd91/investor-relations-hanatourirpresentationjuneinvestor-relations-1-investor.jpg)