Embed Size (px)
Citation preview
Presentation Title Presentation Subtitle
Crestwood Midstream Partners LP Crestwood Equity Partners LP
Connections for America’s Energy ™
™
Presentation Title Presentation Subtitle
Crestwood Midstream Partners LP Crestwood Equity Partners LP
Connections for America’s Energy ™
™
Presentation Title Presentation Subtitle
Crestwood Midstream Partners LP Crestwood Equity Partners LP
Connections for America’s Energy ™
™
11/17/2015
Presentation Title Presentation Subtitle
Crestwood Midstream Partners LP Crestwood Equity Partners LP
Connections for America’s Energy ™
™
Presentation Title Presentation Subtitle
Crestwood Midstream Partners LP Crestwood Equity Partners LP
Connections for America’s Energy ™
™ Connections for America’s Energy ™
™
Investor Presentation November 2015
Connections for America’s Energy ™ ™ ™ ™ ™ ™
The statements in this communication regarding future events, occurrences, circumstances, activities, performance, outcomes and results are forward-looking statements. Although these statements reflect the current views, assumptions and expectations of Crestwood’s management, the matters addressed herein are subject to numerous risks and uncertainties which could cause actual activities, performance, outcomes and results to differ materially from those indicated. Such forward-looking statements include, but are not limited to, statements about the benefits that may result from the merger and statements about the future financial and operating results, objectives, expectations and intentions and other statements that are not historical facts. Factors that could result in such differences or otherwise materially affect Crestwood’s financial condition, results of operations and cash flows include, without limitation, the possibility that expected cost reductions will not be realized, or will not be realized within the expected timeframe; fluctuations in crude oil, natural gas and NGL prices (including, without limitation, lower commodity prices for sustained periods of time); the extent and success of drilling efforts, as well as the extent and quality of natural gas and crude oil volumes produced within proximity of Crestwood assets; failure or delays by customers in achieving expected production in their oil and gas projects; competitive conditions in the industry and their impact on our ability to connect supplies to Crestwood gathering, processing and transportation assets or systems; actions or inactions taken or non-performance by third parties, including suppliers, contractors, operators, processors, transporters and customers; the ability of Crestwood to consummate acquisitions, successfully integrate the acquired businesses, realize any cost savings and other synergies from any acquisition; changes in the availability and cost of capital; operating hazards, natural disasters, weather-related delays, casualty losses and other matters beyond Crestwood’s control; timely receipt of necessary government approvals and permits, the ability of Crestwood to control the costs of construction, including costs of materials, labor and right-of-way and other factors that may impact Crestwood’s ability to complete projects within budget and on schedule; the effects of existing and future laws and governmental regulations, including environmental and climate change requirements; the effects of existing and future litigation; and risks related to the substantial indebtedness, of either company, as well as other factors disclosed in Crestwood’s filings with the U.S. Securities and Exchange Commission. You should read filings made by Crestwood with the U.S. Securities and Exchange Commission, including Annual Reports on Form 10-K and the most recent Quarterly Reports and Current Reports for a more extensive list of factors that could affect results. Readers are cautioned not to place undue reliance on forward-looking statements, which reflect management’s view only as of the date made. Crestwood does not assume any obligation to update these forward-looking statements.
Company Information
2
Forward-Looking Statements
Contact Information
Corporate Headquarters 700 Louisiana Street
Suite 2550
Houston, TX 77002
(1) Market price as of 11/16/2015. (2) Unit count and balance sheet data as of 9/30/2015.
Crestwood Equity Partners LP NYSE Ticker CEQP
Market Capitalization ($MM)(1,2) $1,584
Enterprise Value ($MM)(2) $4,629
Annualized Distribution $0.55
Investor Relations [email protected]
(713) 380-3081
Connections for America’s Energy ™ ™ ™ ™ ™ ™
Key Investor Highlights
3
Connections for America’s Energy ™ ™ ™ ™ ™ ™
• Simplified structure positions company for long-term success
• Solid execution continues to drive results; Adj. EBITDA above consensus in all three quarters in 2015
• YTD performance positions Crestwood to achieve 2015 guidance targets
• Diverse and balanced operations located in the most economic US shale plays
• Strong fixed-fee and take-or-pay contract portfolio
• Strong sponsorship from First Reserve
Key Investor Highlights
4
Connections for America’s Energy ™ ™ ™ ™ ™ ™
Simplified Structure
5
Key Items Post-Merger Structure
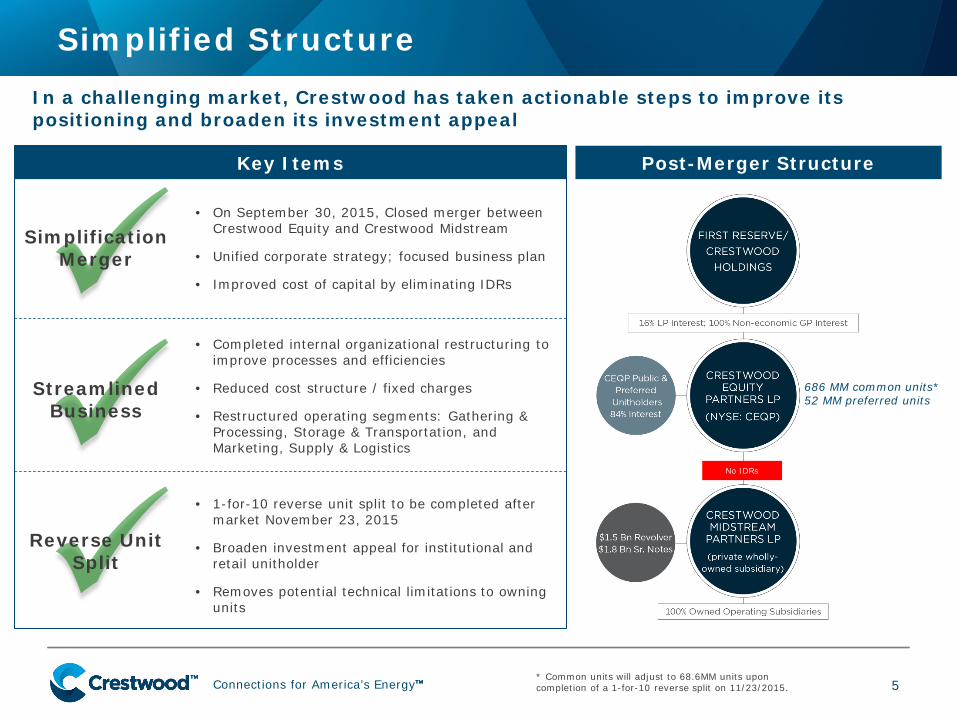
• On September 30, 2015, Closed merger between Crestwood Equity and Crestwood Midstream
• Unified corporate strategy; focused business plan
• Improved cost of capital by eliminating IDRs
686 MM common units* 52 MM preferred units
In a challenging market, Crestwood has taken actionable steps to improve its positioning and broaden its investment appeal
Streamlined Business
Reverse Unit Split
Simplification Merger
• Completed internal organizational restructuring to improve processes and efficiencies
• Reduced cost structure / fixed charges
• Restructured operating segments: Gathering & Processing, Storage & Transportation, and Marketing, Supply & Logistics
• 1-for-10 reverse unit split to be completed after market November 23, 2015
• Broaden investment appeal for institutional and retail unitholder
• Removes potential technical limitations to owning units
No IDRs
* Common units will adjust to 68.6MM units upon completion of a 1-for-10 reverse split on 11/23/2015.
Connections for America’s Energy ™ ™ ™ ™ ™ ™
Existing Scale and New Investment Opportunities in the Right Places
6
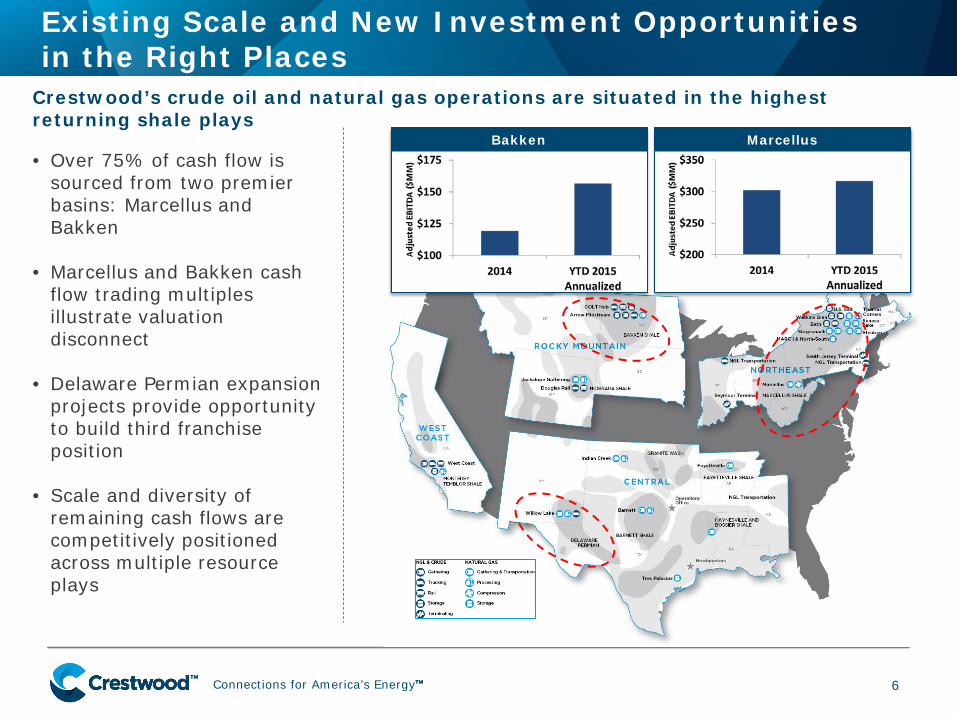
Bakken
• Over 75% of cash flow is sourced from two premier basins: Marcellus and Bakken
• Marcellus and Bakken cash flow trading multiples illustrate valuation disconnect
• Delaware Permian expansion projects provide opportunity to build third franchise position
• Scale and diversity of remaining cash flows are competitively positioned across multiple resource plays
Crestwood’s crude oil and natural gas operations are situated in the highest returning shale plays
Marcellus
Connections for America’s Energy ™ ™ ™ ™ ™ ™
Fixed-Fee Contracts Provide Safety Net
7
Contract Portfolio 2015E EBITDA
Variable Rate Contracts
10%
Take-or-Pay and Fixed-Fee Contracts
90%
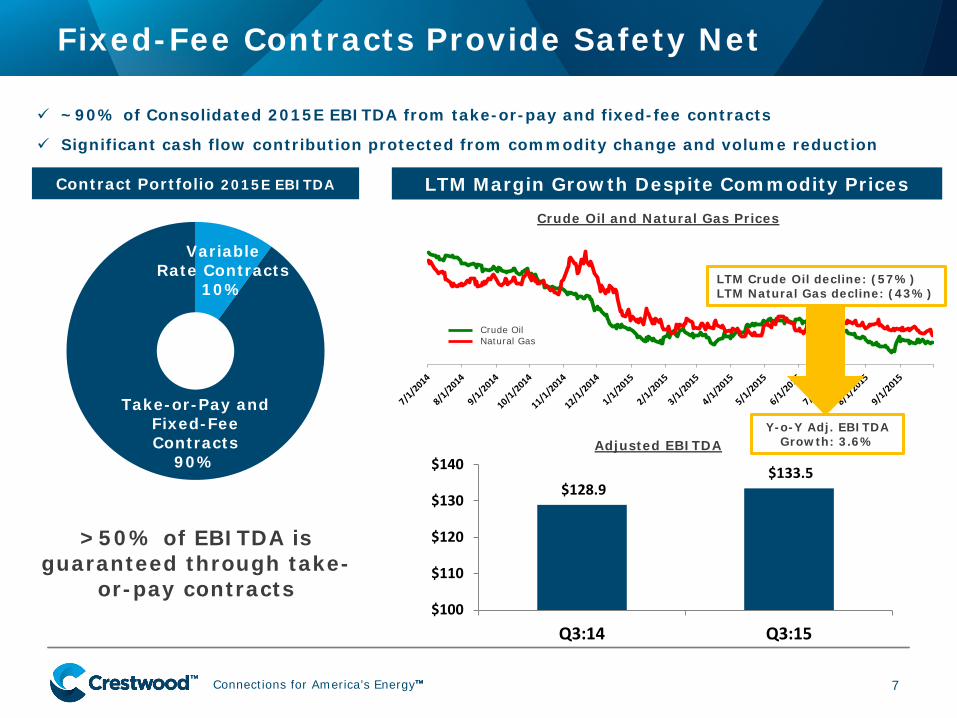
~90% of Consolidated 2015E EBITDA from take-or-pay and fixed-fee contracts
Significant cash flow contribution protected from commodity change and volume reduction
>50% of EBITDA is guaranteed through take-
or-pay contracts
LTM Margin Growth Despite Commodity Prices
Adjusted EBITDA
Crude Oil and Natural Gas Prices
Crude Oil Natural Gas
Y-o-Y Adj. EBITDA Growth: 3.6%
LTM Crude Oil decline: (57%) LTM Natural Gas decline: (43%)
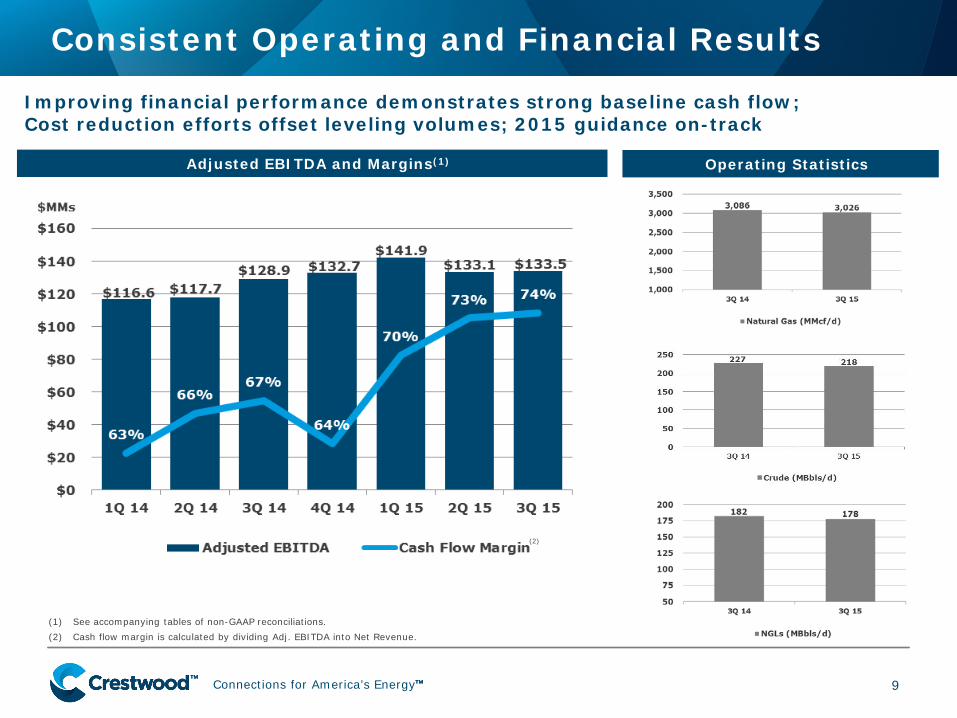
$128.9 $133.5
$100
$110
$120
$130
$140
Q3:14 Q3:15
Connections for America’s Energy ™ ™ ™ ™ ™ ™
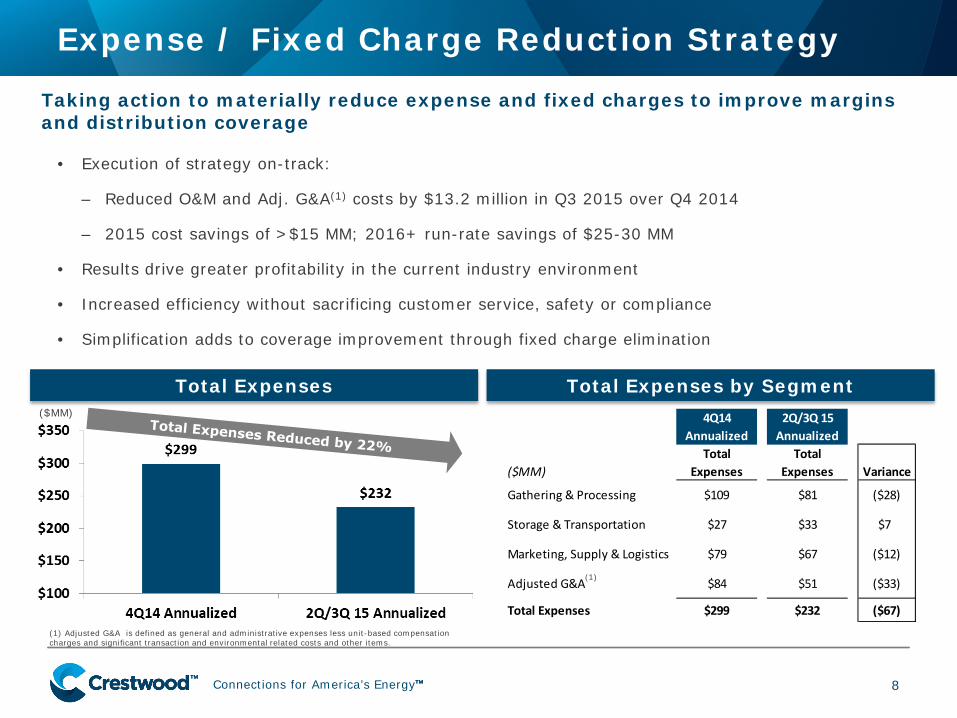
4Q14 Annualized
2Q/3Q 15 Annualized
($MM)Total
ExpensesTotal
Expenses Variance
Gathering & Processing $109 $81 ($28)
Storage & Transportation $27 $33 $7
Marketing, Supply & Logistics $79 $67 ($12)
Adjusted G&A $84 $51 ($33)
Total Expenses $299 $232 ($67)
Expense / Fixed Charge Reduction Strategy
8
($MM)
Total Expenses Total Expenses by Segment
Taking action to materially reduce expense and fixed charges to improve margins and distribution coverage
• Execution of strategy on-track:
– Reduced O&M and Adj. G&A(1) costs by $13.2 million in Q3 2015 over Q4 2014
– 2015 cost savings of >$15 MM; 2016+ run-rate savings of $25-30 MM
• Results drive greater profitability in the current industry environment
• Increased efficiency without sacrificing customer service, safety or compliance
• Simplification adds to coverage improvement through fixed charge elimination
(1) Adjusted G&A is defined as general and administrative expenses less unit-based compensation charges and significant transaction and environmental related costs and other items.
(1)
Connections for America’s Energy ™ ™ ™ ™ ™ ™
Consistent Operating and Financial Results
9
(1) See accompanying tables of non-GAAP reconciliations. (2) Cash flow margin is calculated by dividing Adj. EBITDA into Net Revenue.
Adjusted EBITDA and Margins(1) Operating Statistics
Improving financial performance demonstrates strong baseline cash flow; Cost reduction efforts offset leveling volumes; 2015 guidance on-track
(2)
Connections for America’s Energy ™ ™ ™ ™ ™ ™
Strong Liquidity Position
10
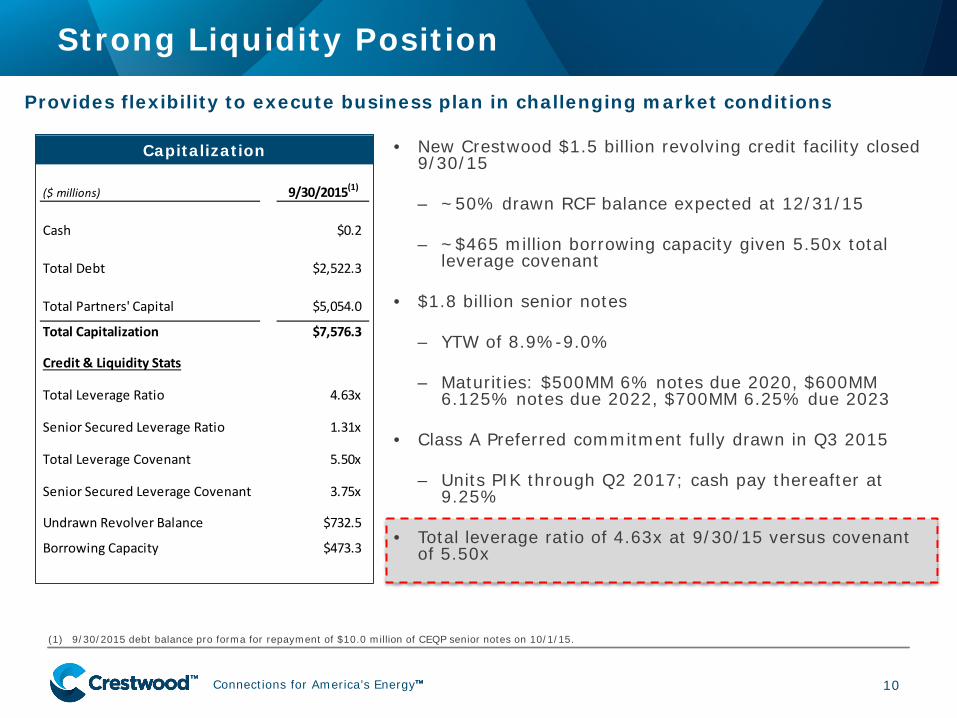
Capitalization
(1) 9/30/2015 debt balance pro forma for repayment of $10.0 million of CEQP senior notes on 10/1/15.
• New Crestwood $1.5 billion revolving credit facility closed 9/30/15
– ~50% drawn RCF balance expected at 12/31/15
– ~$465 million borrowing capacity given 5.50x total leverage covenant
• $1.8 billion senior notes
– YTW of 8.9%-9.0%
– Maturities: $500MM 6% notes due 2020, $600MM 6.125% notes due 2022, $700MM 6.25% due 2023
• Class A Preferred commitment fully drawn in Q3 2015
– Units PIK through Q2 2017; cash pay thereafter at 9.25%
• Total leverage ratio of 4.63x at 9/30/15 versus covenant of 5.50x
Provides flexibility to execute business plan in challenging market conditions
($ millions) 9/30/2015(1)
Cash $0.2
Total Debt $2,522.3
Total Partners' Capital $5,054.0
Total Capitalization $7,576.3
Credit & Liquidity Stats
Total Leverage Ratio 4.63x
Senior Secured Leverage Ratio 1.31x
Total Leverage Covenant 5.50x
Senior Secured Leverage Covenant 3.75x
Undrawn Revolver Balance $732.5
Borrowing Capacity $473.3
Connections for America’s Energy ™ ™ ™ ™ ™ ™
Core Operations Update
11
Connections for America’s Energy ™ ™ ™ ™ ™ ™
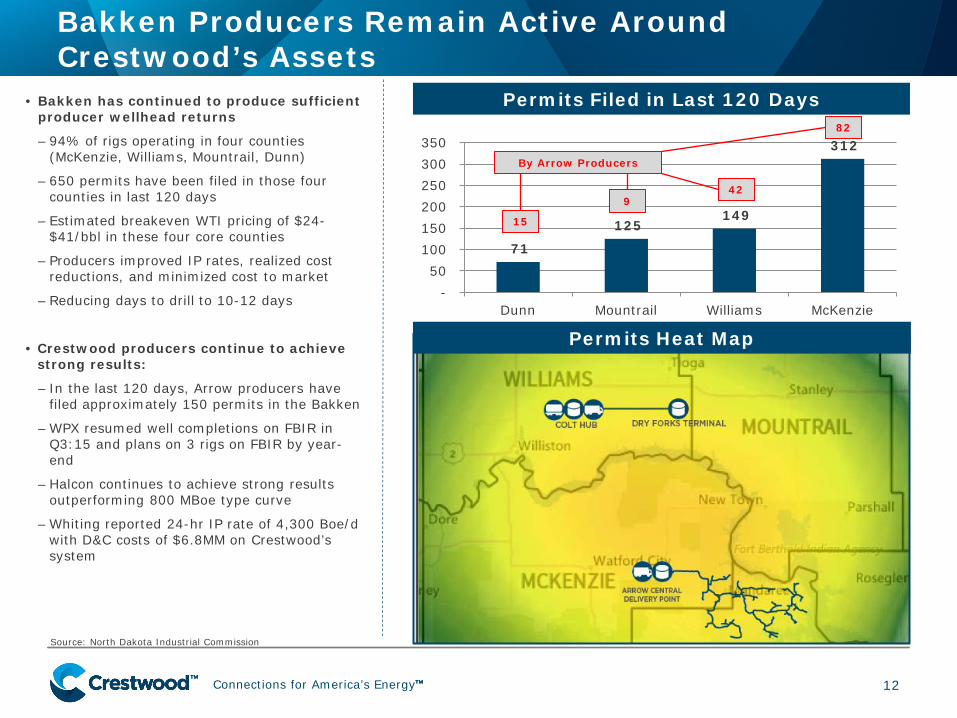
• Bakken has continued to produce sufficient producer wellhead returns
– 94% of rigs operating in four counties (McKenzie, Williams, Mountrail, Dunn)
– 650 permits have been filed in those four counties in last 120 days
– Estimated breakeven WTI pricing of $24-$41/bbl in these four core counties
– Producers improved IP rates, realized cost reductions, and minimized cost to market
– Reducing days to drill to 10-12 days
• Crestwood producers continue to achieve strong results:
– In the last 120 days, Arrow producers have filed approximately 150 permits in the Bakken
– WPX resumed well completions on FBIR in Q3:15 and plans on 3 rigs on FBIR by year-end
– Halcon continues to achieve strong results outperforming 800 MBoe type curve
– Whiting reported 24-hr IP rate of 4,300 Boe/d with D&C costs of $6.8MM on Crestwood’s system
Bakken Producers Remain Active Around Crestwood’s Assets
12
Permits Filed in Last 120 Days
71
125 149
312
- 50
100 150 200 250 300 350
Dunn Mountrail Williams McKenzie
Permits Heat Map
By Arrow Producers
15
9 42
82
Source: North Dakota Industrial Commission
Connections for America’s Energy ™ ™ ™ ™ ™ ™
Bakken Arrow Gathering System
13
Tier 1 acreage dedication with substantial long-term growth through system build out
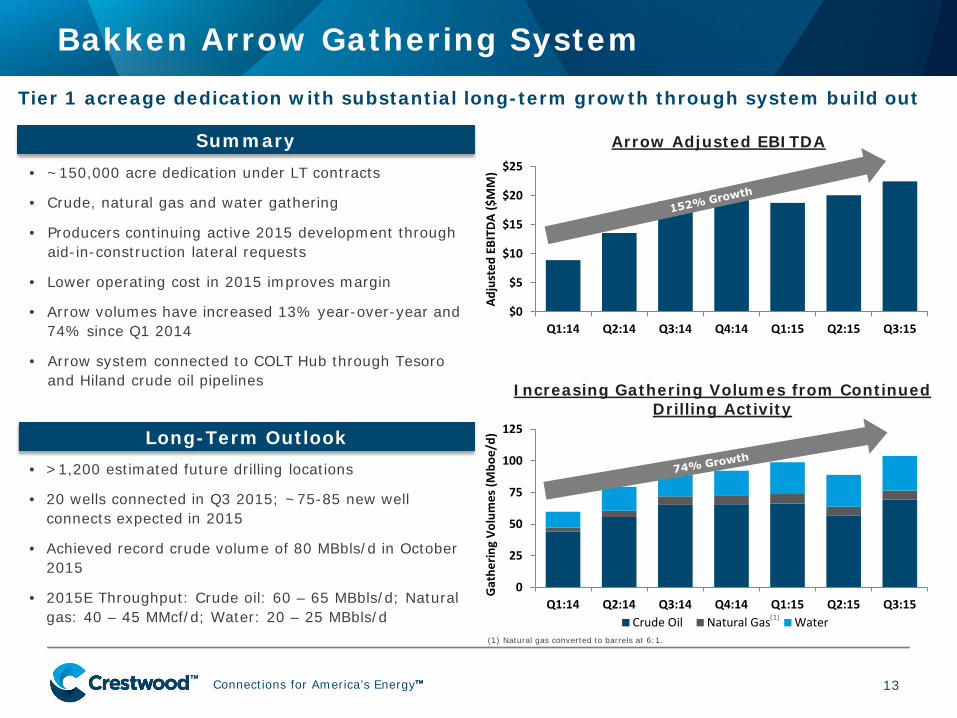
Summary • ~150,000 acre dedication under LT contracts
• Crude, natural gas and water gathering
• Producers continuing active 2015 development through aid-in-construction lateral requests
• Lower operating cost in 2015 improves margin
• Arrow volumes have increased 13% year-over-year and 74% since Q1 2014
• Arrow system connected to COLT Hub through Tesoro and Hiland crude oil pipelines
Long-Term Outlook • >1,200 estimated future drilling locations
• 20 wells connected in Q3 2015; ~75-85 new well connects expected in 2015
• Achieved record crude volume of 80 MBbls/d in October 2015
• 2015E Throughput: Crude oil: 60 – 65 MBbls/d; Natural gas: 40 – 45 MMcf/d; Water: 20 – 25 MBbls/d
(1) Natural gas converted to barrels at 6:1.
Arrow Adjusted EBITDA
Increasing Gathering Volumes from Continued Drilling Activity
(1)
0
25
50
75
100
125
Q1:14 Q2:14 Q3:14 Q4:14 Q1:15 Q2:15 Q3:15
Gat
herin
g Vo
lum
es (M
boe/
d)
Crude Oil Natural Gas Water
$0
$5
$10
$15
$20
$25
Q1:14 Q2:14 Q3:14 Q4:14 Q1:15 Q2:15 Q3:15
Adju
sted
EBI
TDA
($M
M)
Connections for America’s Energy ™ ™ ™ ™ ™ ™
Bakken COLT Hub and Connector
14
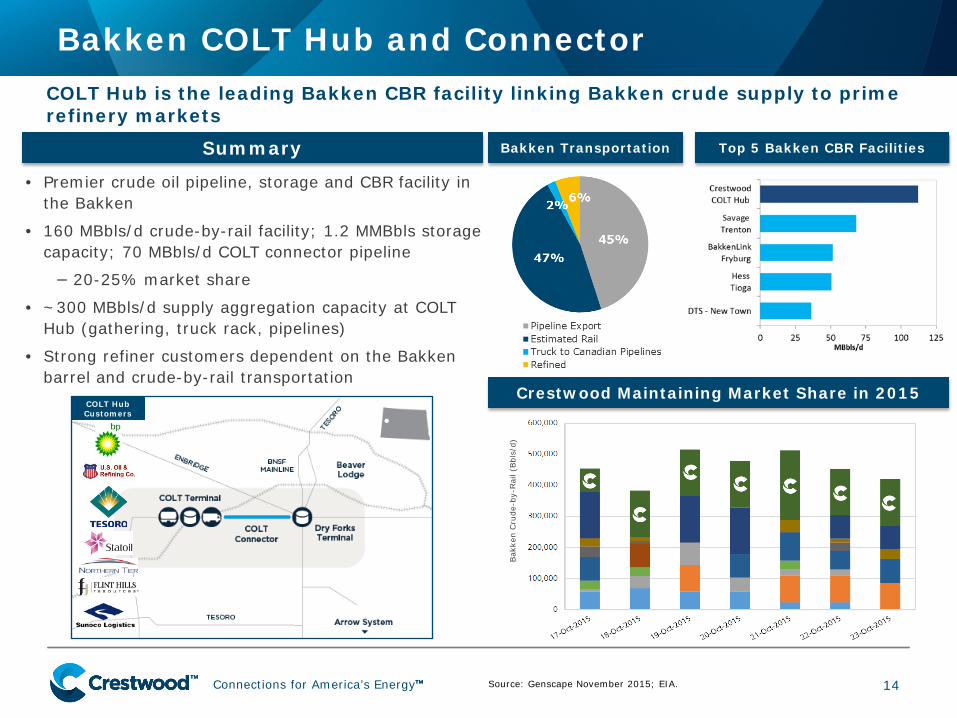
COLT Hub is the leading Bakken CBR facility linking Bakken crude supply to prime refinery markets
Source: Genscape November 2015; EIA.
Summary
• Premier crude oil pipeline, storage and CBR facility in the Bakken
• 160 MBbls/d crude-by-rail facility; 1.2 MMBbls storage capacity; 70 MBbls/d COLT connector pipeline
− 20-25% market share
• ~300 MBbls/d supply aggregation capacity at COLT Hub (gathering, truck rack, pipelines)
• Strong refiner customers dependent on the Bakken barrel and crude-by-rail transportation
Top 5 Bakken CBR Facilities Bakken Transportation
COLT Hub Customers
Crestwood Maintaining Market Share in 2015
Bak
ken
Cru
de-b
y-Rai
l (Bbl
s/d)
Connections for America’s Energy ™ ™ ™ ™ ™ ™
$10$15$20$25$30$35$40
Q1:14 Q2:14 Q3:14 Q4:14 Q1:15 Q2:15 Q3:15
Adju
sted
EBI
TDA
($M
M)
15
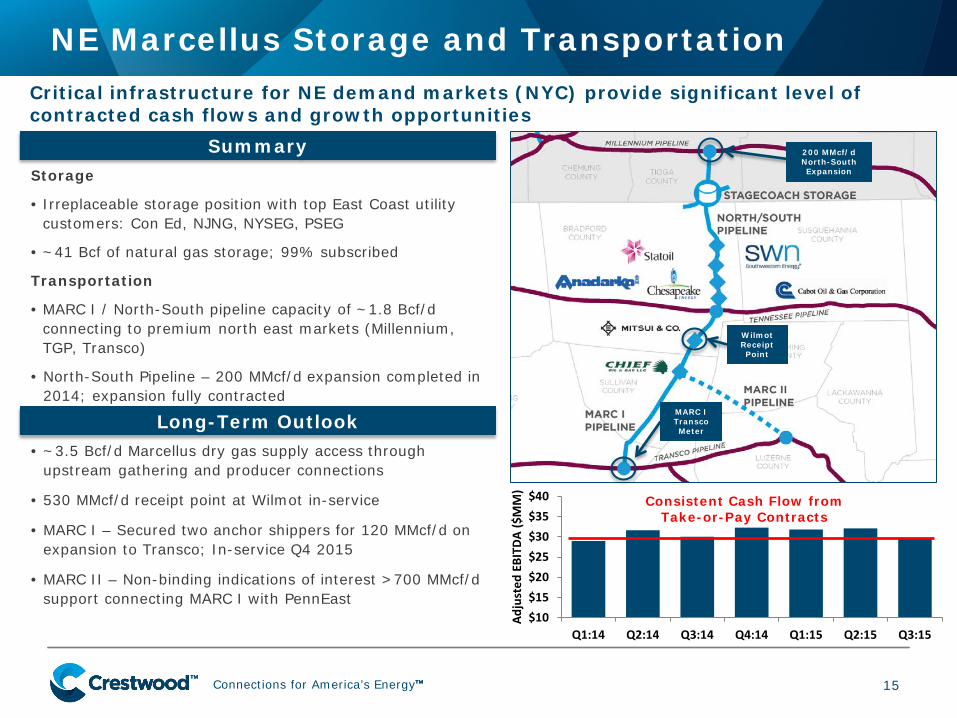
NE Marcellus Storage and Transportation
Summary 200 MMcf/d North-South Expansion
Wilmot Receipt Point
MARC I Transco Meter
Long-Term Outlook • ~3.5 Bcf/d Marcellus dry gas supply access through
upstream gathering and producer connections
• 530 MMcf/d receipt point at Wilmot in-service
• MARC I – Secured two anchor shippers for 120 MMcf/d on expansion to Transco; In-service Q4 2015
• MARC II – Non-binding indications of interest >700 MMcf/d support connecting MARC I with PennEast
Critical infrastructure for NE demand markets (NYC) provide significant level of contracted cash flows and growth opportunities
Storage
• Irreplaceable storage position with top East Coast utility customers: Con Ed, NJNG, NYSEG, PSEG
• ~41 Bcf of natural gas storage; 99% subscribed
Transportation
• MARC I / North-South pipeline capacity of ~1.8 Bcf/d connecting to premium north east markets (Millennium, TGP, Transco)
• North-South Pipeline – 200 MMcf/d expansion completed in 2014; expansion fully contracted
Consistent Cash Flow from Take-or-Pay Contracts
Connections for America’s Energy ™ ™ ™ ™ ™ ™
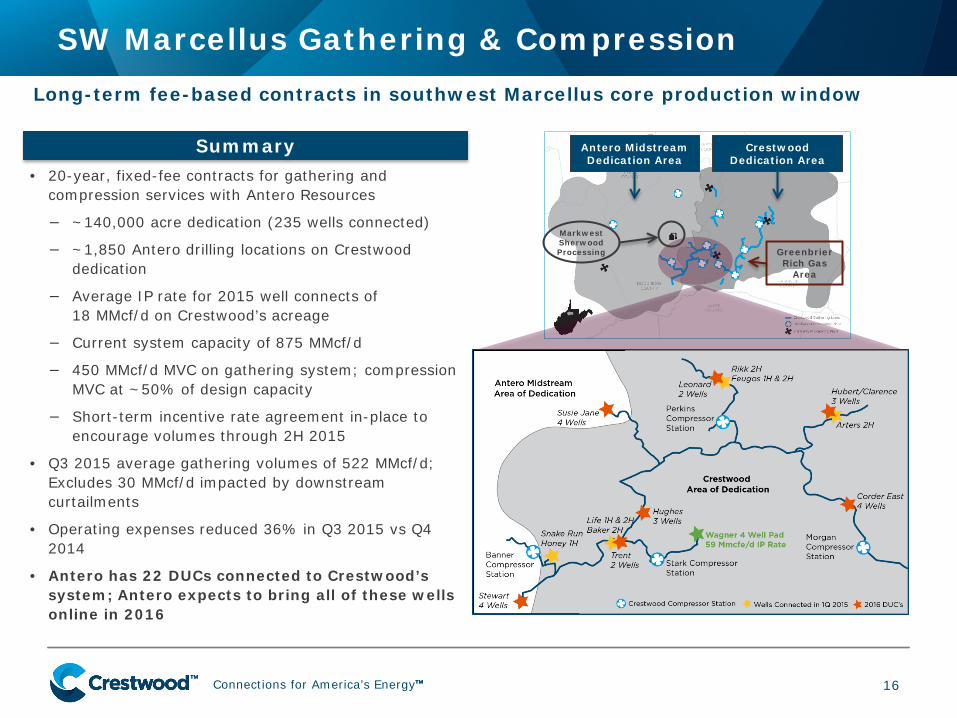
• 20-year, fixed-fee contracts for gathering and compression services with Antero Resources
− ~140,000 acre dedication (235 wells connected)
− ~1,850 Antero drilling locations on Crestwood dedication
− Average IP rate for 2015 well connects of 18 MMcf/d on Crestwood’s acreage
− Current system capacity of 875 MMcf/d
− 450 MMcf/d MVC on gathering system; compression MVC at ~50% of design capacity
− Short-term incentive rate agreement in-place to encourage volumes through 2H 2015
• Q3 2015 average gathering volumes of 522 MMcf/d; Excludes 30 MMcf/d impacted by downstream curtailments
• Operating expenses reduced 36% in Q3 2015 vs Q4 2014
• Antero has 22 DUCs connected to Crestwood’s system; Antero expects to bring all of these wells online in 2016
SW Marcellus Gathering & Compression
16
Long-term fee-based contracts in southwest Marcellus core production window
Summary
Markwest Sherwood Processing Greenbrier
Rich Gas Area
Crestwood Dedication Area
Antero Midstream Dedication Area
Connections for America’s Energy ™ ™ ™ ™ ™ ™
SW Marcellus Gathering Volume Expectations
17
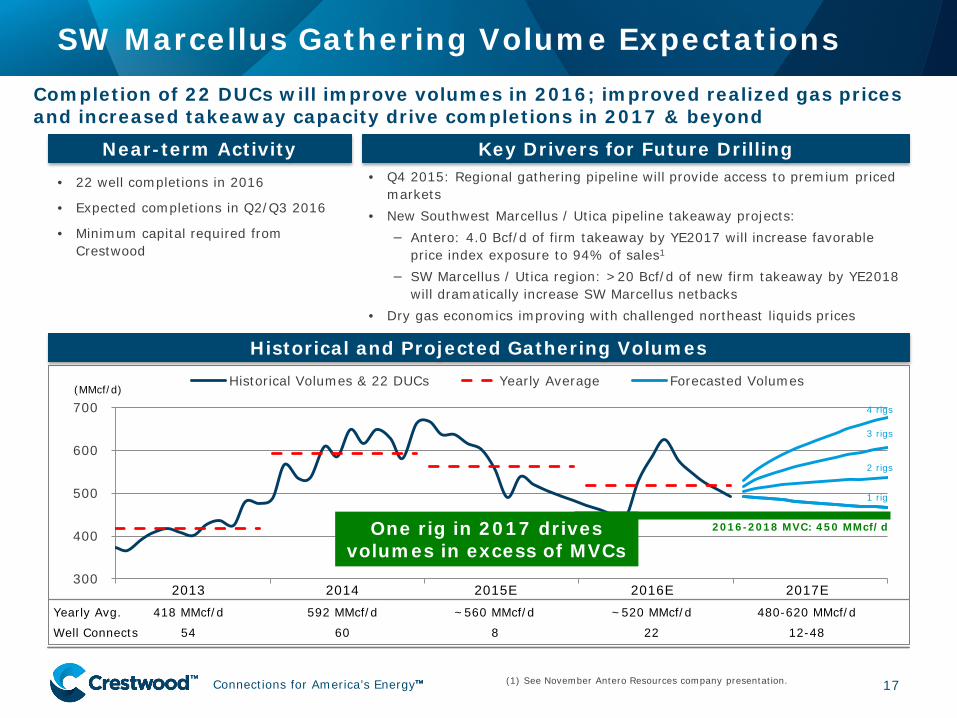
Completion of 22 DUCs will improve volumes in 2016; improved realized gas prices and increased takeaway capacity drive completions in 2017 & beyond
• 22 well completions in 2016
• Expected completions in Q2/Q3 2016
• Minimum capital required from Crestwood
(1) See November Antero Resources company presentation.
300
400
500
600
700
Jan-13 Jan-14 Jan-15 Jan-16 Jan-17 Dec-17
Historical Volumes & 22 DUCs Yearly Average Forecasted Volumes
300
400
500
600
700
Jan-13 Jan-14 Jan-15 Jan-16 Jan-17 Dec-17
Historical Volumes & 22 DUCs Yearly Average Forecasted Volumes
Well Connects
2013 2014 2015E 2016E 2017E
54 60 8 22 12-48
Yearly Avg. 418 MMcf/d 592 MMcf/d ~560 MMcf/d ~520 MMcf/d 480-620 MMcf/d
Historical and Projected Gathering Volumes
(MMcf/d)
Key Drivers for Future Drilling • Q4 2015: Regional gathering pipeline will provide access to premium priced
markets • New Southwest Marcellus / Utica pipeline takeaway projects:
− Antero: 4.0 Bcf/d of firm takeaway by YE2017 will increase favorable price index exposure to 94% of sales1
− SW Marcellus / Utica region: >20 Bcf/d of new firm takeaway by YE2018 will dramatically increase SW Marcellus netbacks
• Dry gas economics improving with challenged northeast liquids prices
Near-term Activity
2016-2018 MVC: 450 MMcf/d
1 rig
2 rigs
3 rigs
4 rigs
One rig in 2017 drives volumes in excess of MVCs
Connections for America’s Energy ™ ™ ™ ™ ™ ™
Delaware-Permian: Reservoir Overview
18
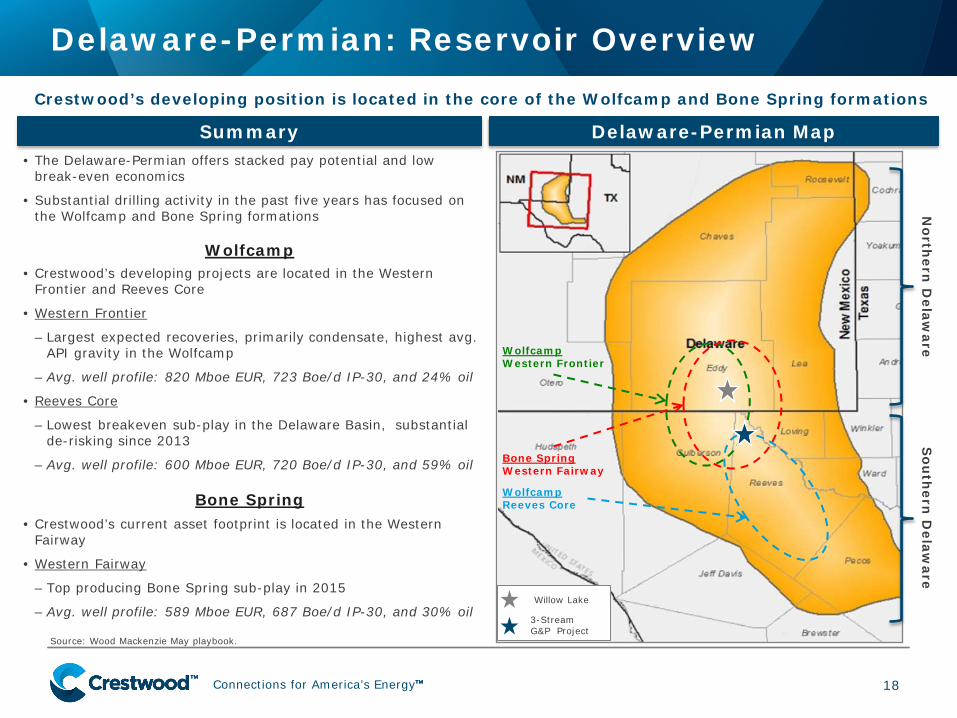
• The Delaware-Permian offers stacked pay potential and low break-even economics
• Substantial drilling activity in the past five years has focused on the Wolfcamp and Bone Spring formations
Wolfcamp Western Frontier
Bone Spring Western Fairway
Wolfcamp Reeves Core
North
ern D
elaware
Sou
thern
Delaw
are
Source: Wood Mackenzie May playbook.
Willow Lake
3-Stream G&P Project
Summary Delaware-Permian Map
Crestwood’s developing position is located in the core of the Wolfcamp and Bone Spring formations
Wolfcamp
Bone Spring
• Crestwood’s developing projects are located in the Western Frontier and Reeves Core
• Western Frontier
– Largest expected recoveries, primarily condensate, highest avg. API gravity in the Wolfcamp
– Avg. well profile: 820 Mboe EUR, 723 Boe/d IP-30, and 24% oil
• Reeves Core
– Lowest breakeven sub-play in the Delaware Basin, substantial de-risking since 2013
– Avg. well profile: 600 Mboe EUR, 720 Boe/d IP-30, and 59% oil
• Crestwood’s current asset footprint is located in the Western Fairway
• Western Fairway
– Top producing Bone Spring sub-play in 2015
– Avg. well profile: 589 Mboe EUR, 687 Boe/d IP-30, and 30% oil
Connections for America’s Energy ™ ™ ™ ™ ™ ™
Delaware-Permian: Expansion Projects
19
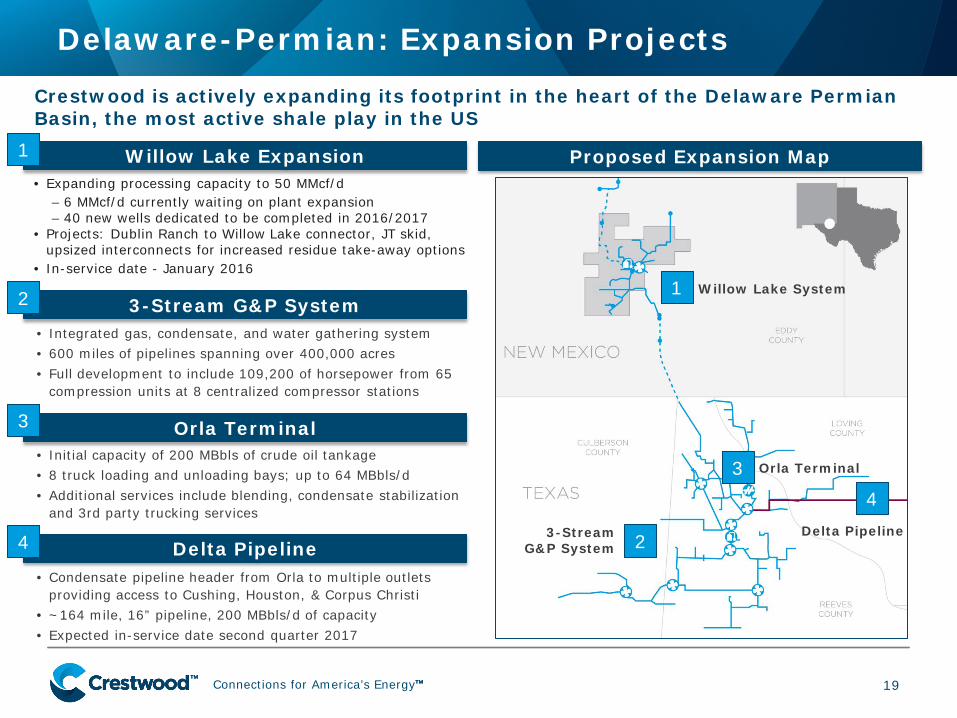
Crestwood is actively expanding its footprint in the heart of the Delaware Permian Basin, the most active shale play in the US
Orla Terminal
• Integrated gas, condensate, and water gathering system • 600 miles of pipelines spanning over 400,000 acres • Full development to include 109,200 of horsepower from 65
compression units at 8 centralized compressor stations
3-Stream G&P System
Delta Pipeline
Proposed Expansion Map
• Initial capacity of 200 MBbls of crude oil tankage • 8 truck loading and unloading bays; up to 64 MBbls/d • Additional services include blending, condensate stabilization
and 3rd party trucking services
• Condensate pipeline header from Orla to multiple outlets providing access to Cushing, Houston, & Corpus Christi
• ~164 mile, 16” pipeline, 200 MBbls/d of capacity • Expected in-service date second quarter 2017
2
3
4
3
2
1
Willow Lake Expansion • Expanding processing capacity to 50 MMcf/d
– 6 MMcf/d currently waiting on plant expansion – 40 new wells dedicated to be completed in 2016/2017
• Projects: Dublin Ranch to Willow Lake connector, JT skid, upsized interconnects for increased residue take-away options
• In-service date - January 2016
1
4
Willow Lake System
Delta Pipeline
Orla Terminal
3-Stream G&P System
Connections for America’s Energy ™ ™ ™ ™ ™ ™
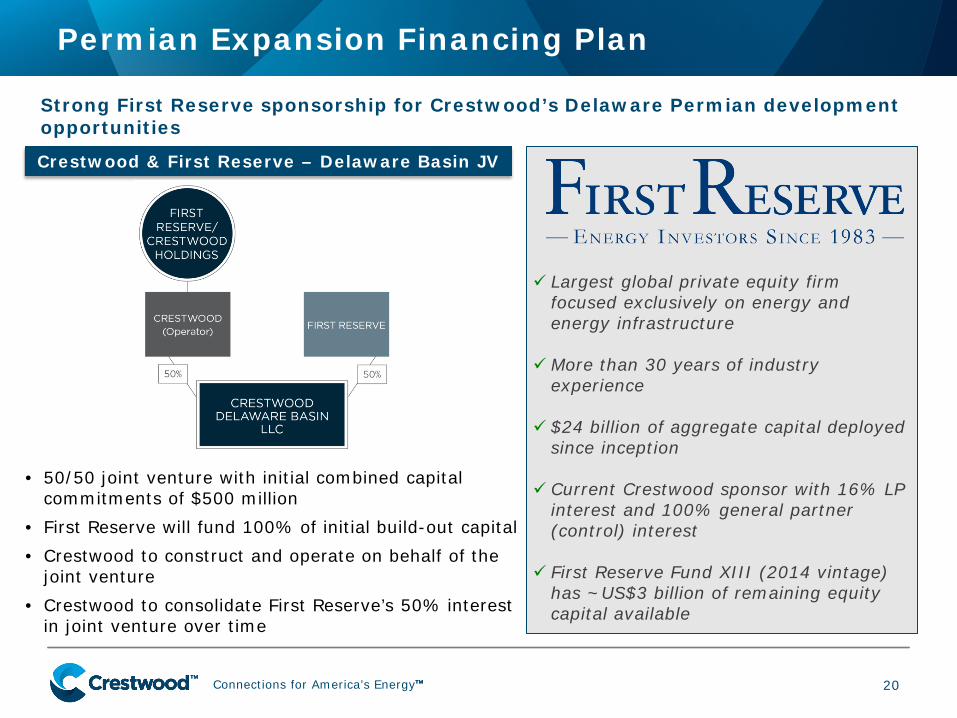
Permian Expansion Financing Plan
20
• 50/50 joint venture with initial combined capital commitments of $500 million
• First Reserve will fund 100% of initial build-out capital • Crestwood to construct and operate on behalf of the
joint venture • Crestwood to consolidate First Reserve’s 50% interest
in joint venture over time
Strong First Reserve sponsorship for Crestwood’s Delaware Permian development opportunities
Largest global private equity firm focused exclusively on energy and energy infrastructure
More than 30 years of industry
experience
$24 billion of aggregate capital deployed since inception
Current Crestwood sponsor with 16% LP interest and 100% general partner (control) interest
First Reserve Fund XIII (2014 vintage) has ~US$3 billion of remaining equity capital available
Crestwood & First Reserve – Delaware Basin JV
Connections for America’s Energy ™ ™ ™ ™ ™ ™
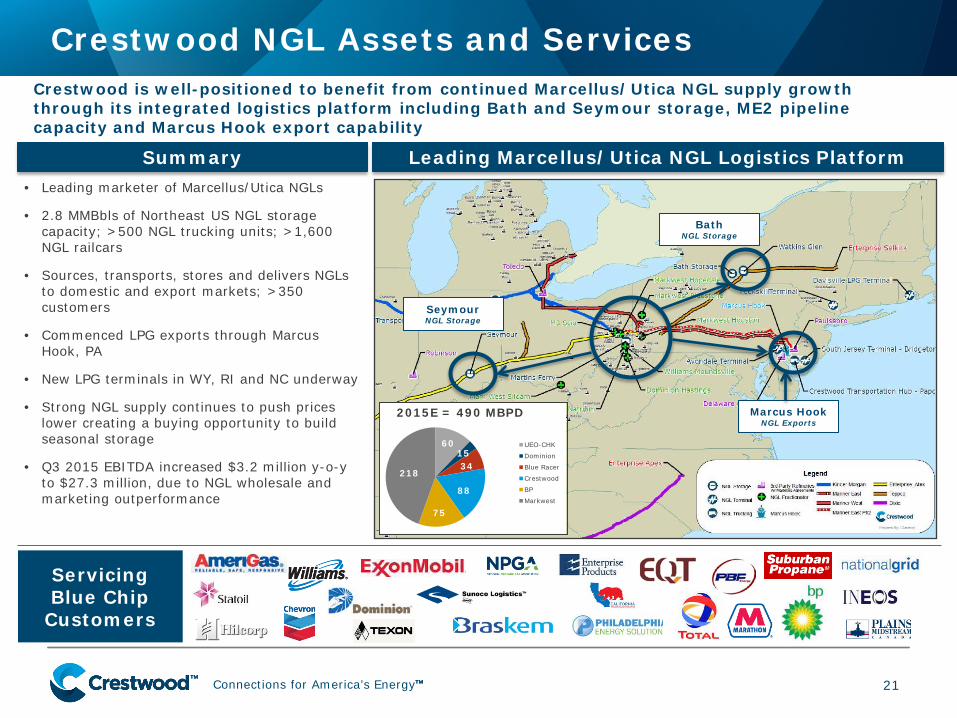
• Leading marketer of Marcellus/Utica NGLs
• 2.8 MMBbls of Northeast US NGL storage capacity; >500 NGL trucking units; >1,600 NGL railcars
• Sources, transports, stores and delivers NGLs to domestic and export markets; >350 customers
• Commenced LPG exports through Marcus Hook, PA
• New LPG terminals in WY, RI and NC underway
• Strong NGL supply continues to push prices lower creating a buying opportunity to build seasonal storage
• Q3 2015 EBITDA increased $3.2 million y-o-y to $27.3 million, due to NGL wholesale and marketing outperformance
21
Crestwood NGL Assets and Services
Servicing Blue Chip
Customers
Crestwood is well-positioned to benefit from continued Marcellus/Utica NGL supply growth through its integrated logistics platform including Bath and Seymour storage, ME2 pipeline capacity and Marcus Hook export capability
Summary Leading Marcellus/Utica NGL Logistics Platform
Marcus Hook NGL Exports
Bath NGL Storage
Seymour NGL Storage
601534
88
75
218
2015E = 490 MBPD
UEO-CHK
Dominion
Blue Racer
Crestwood
BP
Markwest
Connections for America’s Energy ™ ™ ™ ™ ™ ™
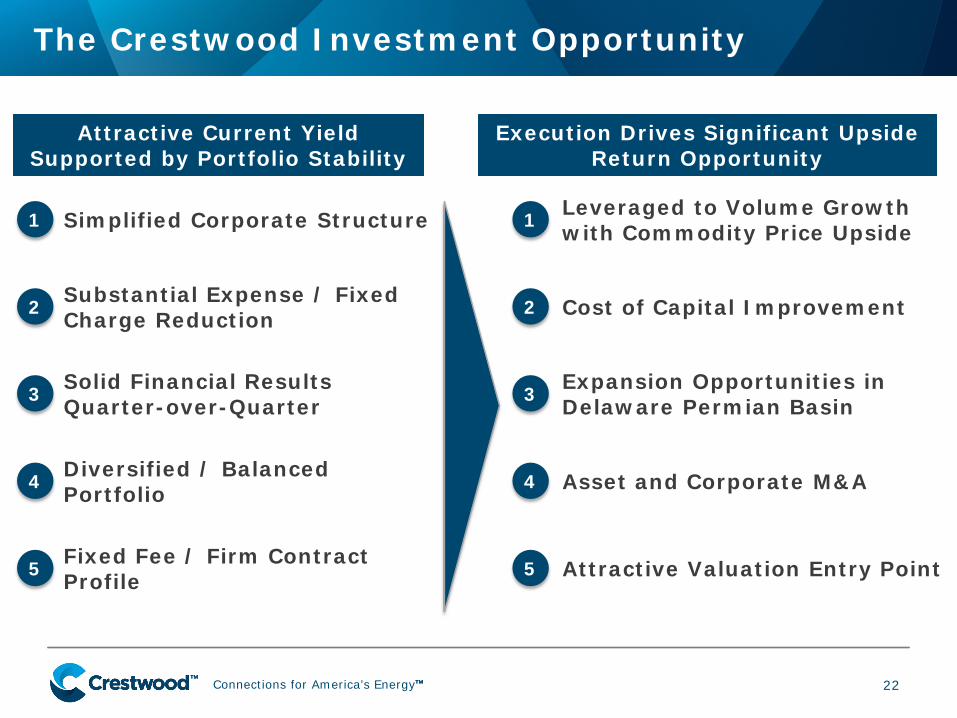
The Crestwood Investment Opportunity
Simplified Corporate Structure
22
1
Substantial Expense / Fixed Charge Reduction 2
Solid Financial Results Quarter-over-Quarter 3
Diversified / Balanced Portfolio 4
Fixed Fee / Firm Contract Profile 5
Attractive Current Yield Supported by Portfolio Stability
Leveraged to Volume Growth with Commodity Price Upside 1
Cost of Capital Improvement 2
Expansion Opportunities in Delaware Permian Basin 3
Asset and Corporate M&A 4
Attractive Valuation Entry Point 5
Execution Drives Significant Upside Return Opportunity
Connections for America’s Energy ™ ™ ™ ™ ™ ™
Non-GAAP Reconciliations
23
Connections for America’s Energy ™ ™ ™ ™ ™ ™
CEQP Non-GAAP Reconciliations
24
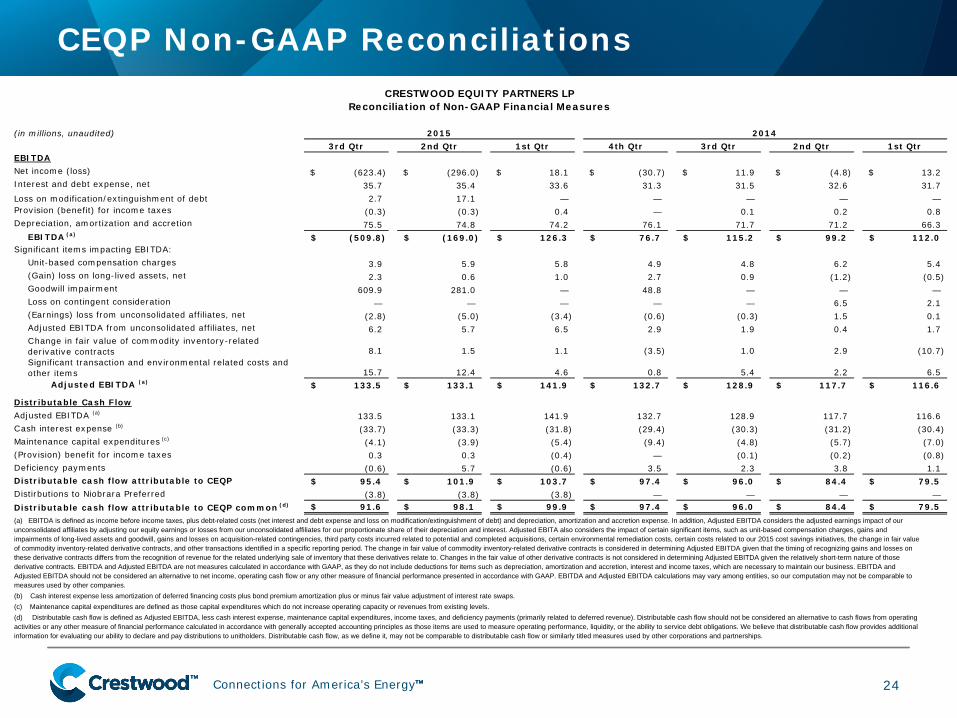
(in millions, unaudited) 3rd Qtr 2nd Qtr 1st Qtr 4th Qtr 3rd Qtr 2nd Qtr 1st QtrEBITDANet income (loss) (623.4)$ (296.0)$ 18.1$ (30.7)$ 11.9$ (4.8)$ 13.2$ Interest and debt expense, net 35.7 35.4 33.6 31.3 31.5 32.6 31.7Loss on modification/extinguishment of debt 2.7 17.1 — — — — —Provision (benefit) for income taxes (0.3) (0.3) 0.4 — 0.1 0.2 0.8Depreciation, amortization and accretion 75.5 74.8 74.2 76.1 71.7 71.2 66.3
EBITDA (a) (509.8)$ (169.0)$ 126.3$ 76.7$ 115.2$ 99.2$ 112.0$ Significant items impacting EBITDA:
Unit-based compensation charges 3.9 5.9 5.8 4.9 4.8 6.2 5.4(Gain) loss on long-lived assets, net 2.3 0.6 1.0 2.7 0.9 (1.2) (0.5)Goodwill impairment 609.9 281.0 — 48.8 — — —Loss on contingent consideration — — — — — 6.5 2.1(Earnings) loss from unconsolidated affiliates, net (2.8) (5.0) (3.4) (0.6) (0.3) 1.5 0.1Adjusted EBITDA from unconsolidated affiliates, net 6.2 5.7 6.5 2.9 1.9 0.4 1.7Change in fair value of commodity inventory-related derivative contracts 8.1 1.5 1.1 (3.5) 1.0 2.9 (10.7)Significant transaction and environmental related costs and other items 15.7 12.4 4.6 0.8 5.4 2.2 6.5
Adjusted EBITDA (a) 133.5$ 133.1$ 141.9$ 132.7$ 128.9$ 117.7$ 116.6$
Distributable Cash FlowAdjusted EBITDA (a) 133.5 133.1 141.9 132.7 128.9 117.7 116.6Cash interest expense (b) (33.7) (33.3) (31.8) (29.4) (30.3) (31.2) (30.4)Maintenance capital expenditures (c) (4.1) (3.9) (5.4) (9.4) (4.8) (5.7) (7.0)(Provision) benefit for income taxes 0.3 0.3 (0.4) — (0.1) (0.2) (0.8)Deficiency payments (0.6) 5.7 (0.6) 3.5 2.3 3.8 1.1Distributable cash flow attributable to CEQP 95.4$ 101.9$ 103.7$ 97.4$ 96.0$ 84.4$ 79.5$ Distirbutions to Niobrara Preferred (3.8) (3.8) (3.8) — — — — Distributable cash flow attributable to CEQP common (d) 91.6$ 98.1$ 99.9$ 97.4$ 96.0$ 84.4$ 79.5$
(c) Maintenance capital expenditures are defined as those capital expenditures which do not increase operating capacity or revenues from existing levels. (d) Distributable cash flow is defined as Adjusted EBITDA, less cash interest expense, maintenance capital expenditures, income taxes, and deficiency payments (primarily related to deferred revenue). Distributable cash flow should not be considered an alternative to cash flows from operating activities or any other measure of financial performance calculated in accordance with generally accepted accounting principles as those items are used to measure operating performance, liquidity, or the ability to service debt obligations. We believe that distributable cash flow provides additional information for evaluating our ability to declare and pay distributions to unitholders. Distributable cash flow, as we define it, may not be comparable to distributable cash flow or similarly titled measures used by other corporations and partnerships.
2015
CRESTWOOD EQUITY PARTNERS LP Reconciliation of Non-GAAP Financial Measures
(a) EBITDA is defined as income before income taxes, plus debt-related costs (net interest and debt expense and loss on modification/extinguishment of debt) and depreciation, amortization and accretion expense. In addition, Adjusted EBITDA considers the adjusted earnings impact of our unconsolidated affiliates by adjusting our equity earnings or losses from our unconsolidated affiliates for our proportionate share of their depreciation and interest. Adjusted EBITA also considers the impact of certain significant items, such as unit-based compensation charges, gains and impairments of long-lived assets and goodwill, gains and losses on acquisition-related contingencies, third party costs incurred related to potential and completed acquisitions, certain environmental remediation costs, certain costs related to our 2015 cost savings initiatives, the change in fair value of commodity inventory-related derivative contracts, and other transactions identified in a specific reporting period. The change in fair value of commodity inventory-related derivative contracts is considered in determining Adjusted EBITDA given that the timing of recognizing gains and losses on these derivative contracts differs from the recognition of revenue for the related underlying sale of inventory that these derivatives relate to. Changes in the fair value of other derivative contracts is not considered in determining Adjusted EBITDA given the relatively short-term nature of those derivative contracts. EBITDA and Adjusted EBITDA are not measures calculated in accordance with GAAP, as they do not include deductions for items such as depreciation, amortization and accretion, interest and income taxes, which are necessary to maintain our business. EBITDA and Adjusted EBITDA should not be considered an alternative to net income, operating cash flow or any other measure of financial performance presented in accordance with GAAP. EBITDA and Adjusted EBITDA calculations may vary among entities, so our computation may not be comparable to measures used by other companies. (b) Cash interest expense less amortization of deferred financing costs plus bond premium amortization plus or minus fair value adjustment of interest rate swaps.
2014