Embed Size (px)
Citation preview

the beautiful door
Fall 2016
Investor Presentation
NYSE: DOOR
2
Safe Harbor / Non-GAAP Financial Measures
SAFE HARBOR / FORWARD LOOKING STATEMENT
This investor presentation contains forward-looking information and other forward-looking statements within the meaning of applicable Canadian and/or U.S. securities laws, including our discussion of
improvements in the housing market and related markets and the effects of our pricing and other strategies. When used in this Investor Presentation, such forward-looking statements may be identified
by the use of such words as “may,” might, “could,” “will,” would,” “should,” “expect,” “believes,” “outlook,” “predict,” “forecast,” “framework,” “objective,” “remain,” “anticipate,” “estimate,” “potential,”
“continue,” “plan,” “project,” “targeting,” or the negative of these terms or other similar terminology.
Forward-looking statements involve significant known and unknown risks, uncertainties and other factors that may cause the actual results, performance or achievements of Masonite, or industry
results, to be materially different from any future plans, goals, targets, objectives, results, performance or achievements expressed or implied by such forward-looking statements. As a result, such
forward-looking statements should not be read as guarantees of future performance or results, should not be unduly relied upon, and will not necessarily be accurate indications of whether or not such
results will be achieved. Factors that could cause actual results to differ materially from the results discussed in the forward-looking statements include, but are not limited to, our ability to successfully
implement our business strategy; general economic, market and business conditions; levels of residential new construction, residential repair, renovation and remodeling and non-residential building
construction activity; competition; our ability to manage our operations including integrating our recent acquisitions and companies or assets we acquire in the future; our ability to generate sufficient
cash flows to fund our capital expenditure requirements and to meet our debt service obligations, including our obligations under our senior notes and our senior secured asset-backed credit facility;
labor relations (i.e., disruptions, strikes or work stoppages), labor costs, and availability of labor; increases in the costs of raw materials or any shortage in supplies; our ability to keep pace with
technological developments; the actions by, and the continued success of, certain key customers; our ability to maintain relationships with certain customers; new contractual commitments; our ability to
generate the benefits of our restructuring activities; retention of key management personnel; environmental and other government regulations; limitations on operating our business as a result of
covenant restrictions under our existing and future indebtedness, including our senior notes and senior secured asset-based credit facility; and other factors publicly disclosed by the company from time
to time.
NON-GAAP FINANCIAL MEASURES
Our management reviews net sales and Adjusted EBITDA (as defined below) to evaluate segment performance and allocate resources. Net assets are not allocated to the reportable segments.
Adjusted EBITDA is a non-GAAP financial measure which does not have a standardized meaning under GAAP and is unlikely to be comparable to similar measures used by other companies. Adjusted
EBITDA should not be considered as an alternative to either net income or operating cash flows determined in accordance with GAAP. Additionally, Adjusted EBITDA is not intended to be a measure of
free cash flow for management's discretionary use, as it does not include certain cash requirements such as interest payments, tax payments and debt service requirements. Beginning with the third
quarter of 2015, we revised our calculation of Adjusted EBITDA to separately exclude loss (gain) on disposal of subsidiaries. The revision to this definition had no impact on our reported Adjusted
EBITDA for the three months ended March 29, 2015. Adjusted EBITDA (as revised) is defined as net income (loss) attributable to Masonite adjusted to exclude the following items: depreciation;
amortization; share based compensation expense; loss (gain) on disposal of property, plant and equipment; registration and listing fees; restructuring costs; asset impairment; loss (gain) on disposal of
subsidiaries; interest expense (income), net; loss on extinguishment of debt; other expense (income), net; income tax expense (benefit); loss (income) from discontinued operations, net of tax; and net
income (loss) attributable to non-controlling interest. This definition of Adjusted EBITDA differs from the definitions of EBITDA contained in the indenture governing the 2023 Notes and the credit
agreement governing the ABL Facility. Adjusted EBITDA, as calculated under our ABL Facility or senior notes would also include, among other things, additional add-backs for amounts related to: cost
savings projected by us in good faith to be realized as a result of actions taken or expected to be taken prior to or during the relevant period; fees and expenses in connection with certain plant closures
and layoffs; and the amount of any restructuring charges, integration costs or other business optimization expenses or reserve deducted in the relevant period in computing consolidated net income,
including any one-time costs incurred in connection with acquisitions. The tables in the appendix to this presentation reconcile Adjusted EBITDA to net income (loss) attributable to Masonite for the
periods indicated. We are not providing a quantitative reconciliation of our Adjusted EBITDA outlook to the corresponding GAAP information because the GAAP measures that we exclude from our
Adjusted EBITDA outlook are difficult to predict and are primarily dependent on future uncertainties.

3
Company & Industry Update
the beautiful door

4
Company & Industry Update
Masonite Is a Leading Building Products Company
Company Overview
Net Sales of $1.9 billion and approximately
33 million doors sold in 2015.
Served more than 8,000 customers in 73
countries.
One of only two vertically integrated
residential molded door manufacturers and
the only vertically integrated architectural
door manufacturer in North America.
Established leadership positions in all
targeted product categories in North
America.
Leading value proposition, acquisition
activity and Lean Sigma efforts have
transformed Masonite into a better
positioned, more efficient operating
company

5
North American Residential, 64%
Europe, 17%
Architectural, 16%
Corp & Other, 4%
Company & Industry Update
Diversified End Markets
Primarily serves new residential
construction and residential
repair, renovation and remodel
(RRR) market Tied substantially to the UK new
residential construction and RRR
market.
Serves the North American
commercial construction market
Masonite’s diverse customer base and end markets provide multiple growth avenues
2015 Net Sales
6
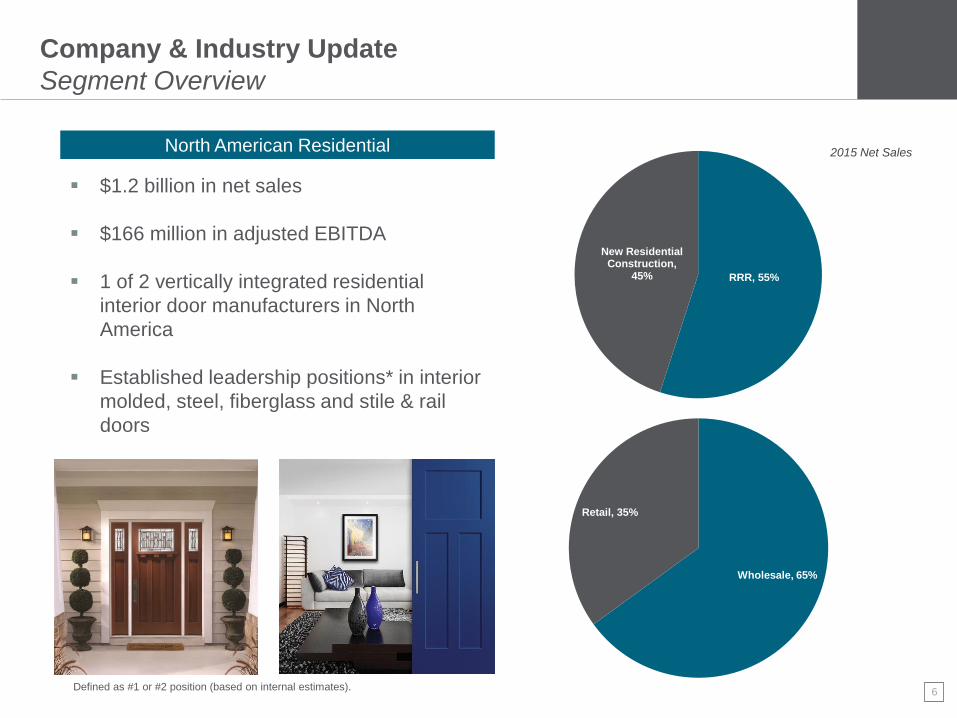
RRR, 55%
New Residential Construction,
45%
Company & Industry Update
Segment Overview
North American Residential
$1.2 billion in net sales
$166 million in adjusted EBITDA
1 of 2 vertically integrated residential
interior door manufacturers in North
America
Established leadership positions* in interior
molded, steel, fiberglass and stile & rail
doors
2015 Net Sales
Wholesale, 65%
Retail, 35%
Defined as #1 or #2 position (based on internal estimates).
7
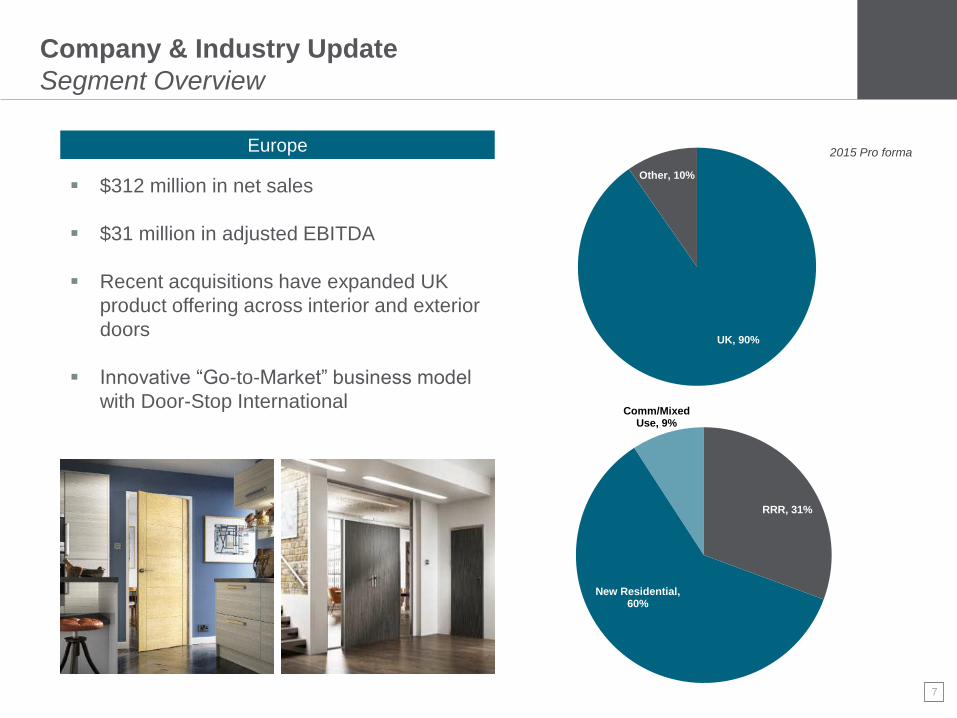
UK, 90%
Other, 10%
Company & Industry Update
Segment Overview
Europe
RRR, 31%
New Residential, 60%
Comm/Mixed Use, 9%
2015 Pro forma
$312 million in net sales
$31 million in adjusted EBITDA
Recent acquisitions have expanded UK
product offering across interior and exterior
doors
Innovative “Go-to-Market” business model
with Door-Stop International

8
Health Care
Education
Office
Stock
Lodging
Other
Commercial
Company & Industry Update
Segment Overview
Architectural 2015 Net Sales
$292 million in net sales
$23 million in adjusted EBITDA
ONLY vertically integrated Architectural
door manufacturer in North America
Established leadership positions* in interior
wood doors, door core and veneers
Institutional
Defined as #1 or #2 position (based on internal estimates).
9
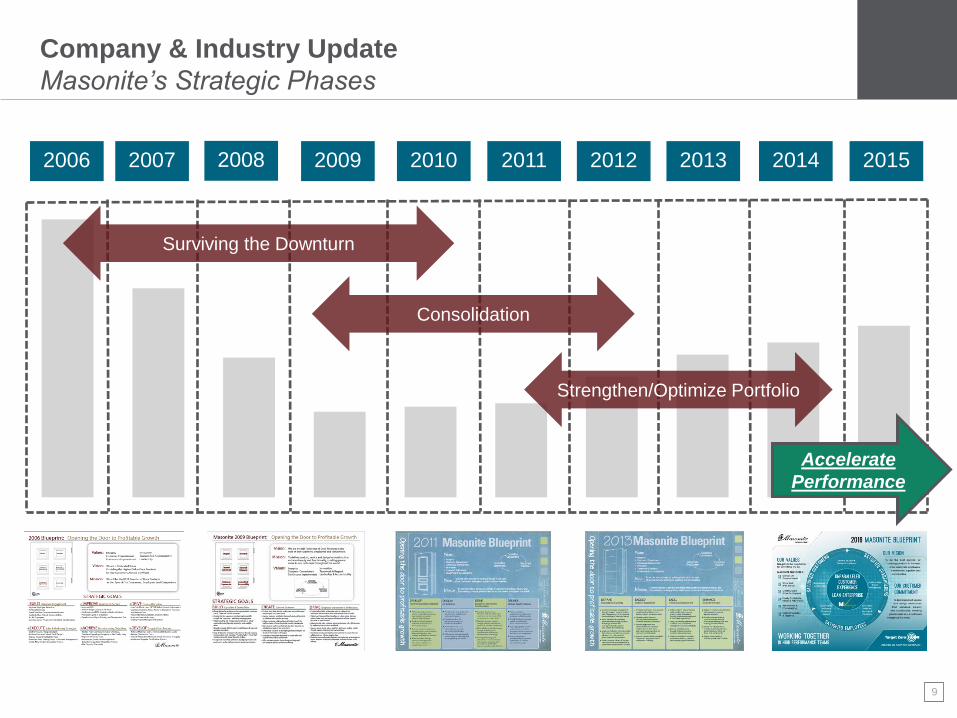
Company & Industry Update
Masonite’s Strategic Phases
2006 2007 2008 2009 2010 2011 2012 2013 2014 2015
Surviving the Downturn
Consolidation
Strengthen/Optimize Portfolio
Accelerate
Performance
10
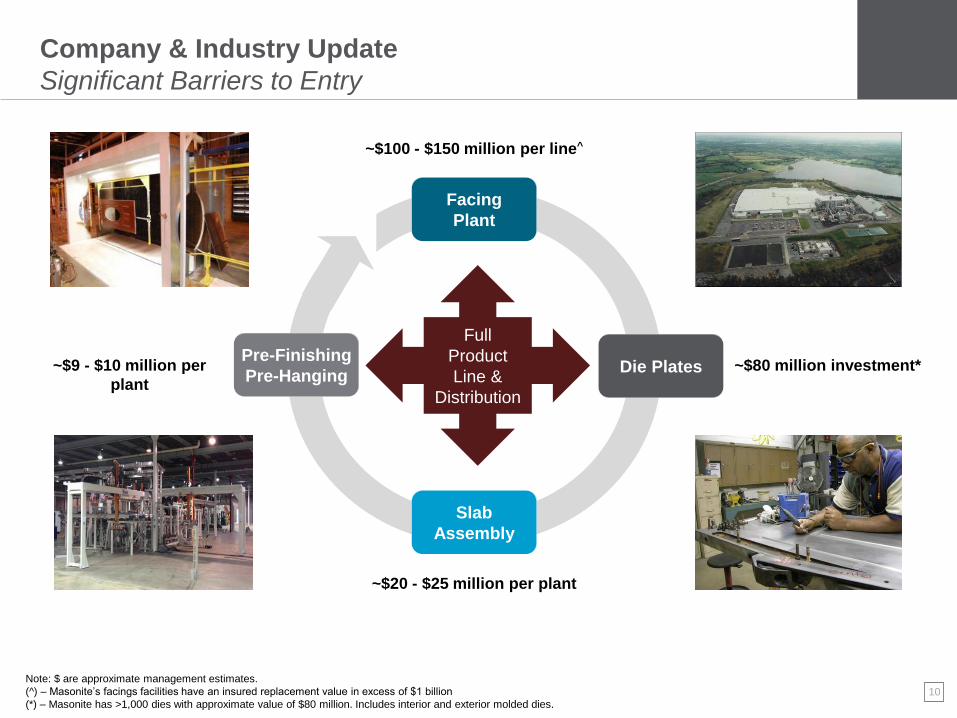
Company & Industry Update
Significant Barriers to Entry
Die Plates
Facing
Plant
Pre-Finishing
Pre-Hanging
Slab
Assembly
Full
Product
Line &
Distribution
~$100 - $150 million per line^
~$80 million investment*
~$20 - $25 million per plant
~$9 - $10 million per
plant
Note: $ are approximate management estimates.
(^) – Masonite’s facings facilities have an insured replacement value in excess of $1 billion
(*) – Masonite has >1,000 dies with approximate value of $80 million. Includes interior and exterior molded dies.

11
Company & Industry Update
Innovative Products to Drive Mix Shift Higher
Mix Shift Trade Up New Products
Hollow core to solid core Steel to fiberglass/wood Old styles to new styles
Average unit price increases through a combination of price and mix

12
Company & Industry Update
Driving Operational Efficiencies
Innovative products, services & processes
Cutting edge digital interactions
Automation, efficiency, simplicity & speed
Continuous Improvement / Lean Enterprise

13
Company & Industry Update
Acquisition Strategy Is a Key Growth Initiative
Value Added
Services
Niche Products
Components

14
U.S. Residential Doors Sold Architectural Door Spending UK Housing Starts
Company & Industry Update
Opportunity for Continued Growth Across End Markets
83.6
60.1
45.2
76.5
2003 2008 2013 2018F 2003 2008 2013 2018F
$3.6
$5.4
$4.5
$6.5
(in billions of $ spent on doors)
Source: Freedonia Group
(in millions of doors sold)
Source: Freedonia Group
133
144
166
185
2011 2013 2015 2018F
(in 000s of UK housing starts)
Source: Experian
Forecast 11% CAGR from
2013-2018
Forecast 5% CAGR from
2013-2018
Forecast 8% CAGR from
2013-2018
Growth projected across all segments
15
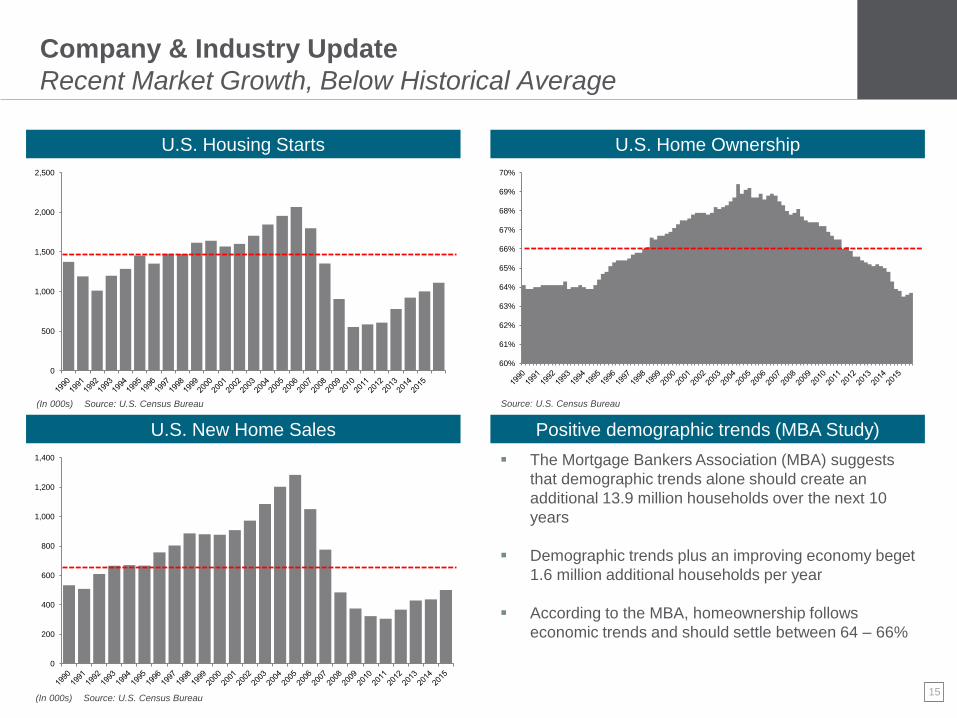
U.S. Housing Starts U.S. Home Ownership
60%
61%
62%
63%
64%
65%
66%
67%
68%
69%
70%
0
500
1,000
1,500
2,000
2,500
U.S. New Home Sales Positive demographic trends (MBA Study)
0
200
400
600
800
1,000
1,200
1,400
(In 000s) Source: U.S. Census Bureau Source: U.S. Census Bureau
The Mortgage Bankers Association (MBA) suggests
that demographic trends alone should create an
additional 13.9 million households over the next 10
years
Demographic trends plus an improving economy beget
1.6 million additional households per year
According to the MBA, homeownership follows
economic trends and should settle between 64 – 66%
(In 000s) Source: U.S. Census Bureau
Company & Industry Update
Recent Market Growth, Below Historical Average
16
the beautiful door
Financial Overview

17
Financial Overview
Leveraging Growth Into Free Cash Flow
$1,964.9#
Net Sales Gross Profit
Adjusted EBITDA* Free Cash Flow^
+4% 2 Year CAGR
+39% 2 Year CAGR +60% 2 Year CAGR
+25% 2 Year CAGR
(*) – See appendix for non-GAAP reconciliations.
(^) – Defined as Adjusted EBITDA less Capex.
$1,731
$1,838 $1,872
2013 2014 2015
$226
$265
$351
2013 2014 2015
$106
$137
$204
2013 2014 2015
$60
$87
$153
2013 2014 2015
18
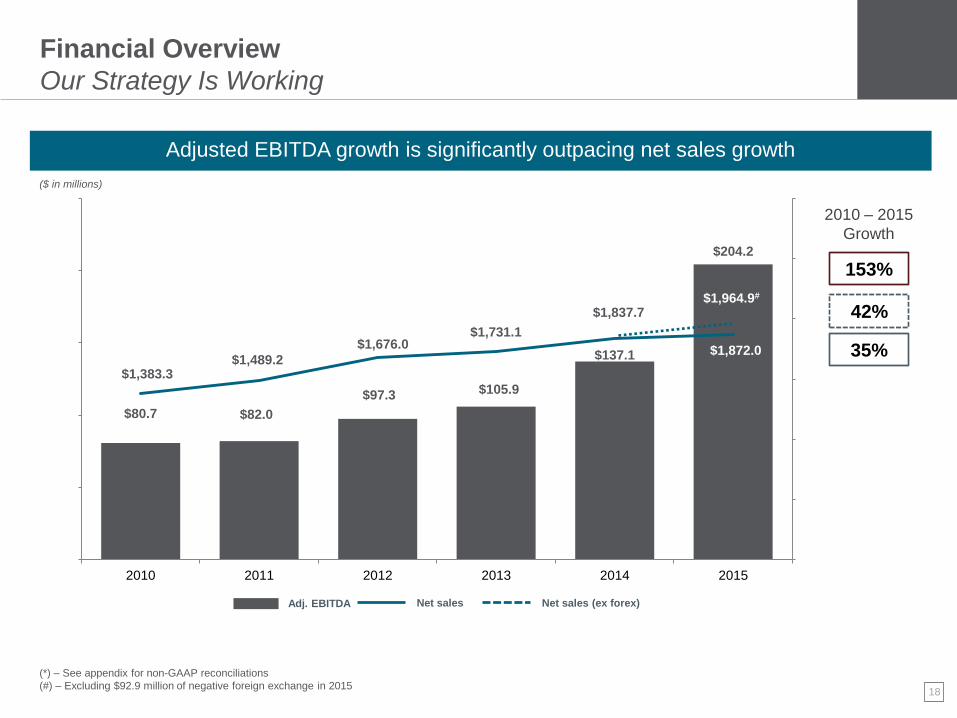
Financial Overview
Our Strategy Is Working
$1,964.9#
$80.7 $82.0
$97.3 $105.9
$137.1
$204.2
$1,383.3 $1,489.2
$1,676.0 $1,731.1
$1,837.7
$1,872.0
$0
$500
$1,000
$1,500
$2,000
$2,500
$3,000
$0
$50
$100
$150
$200
$250
2010 2011 2012 2013 2014 2015
(*) – See appendix for non-GAAP reconciliations
(#) – Excluding $92.9 million of negative foreign exchange in 2015
2010 – 2015
Growth
Adj. EBITDA
35%
Net sales
42%
Net sales (ex forex)
153%
($ in millions)
Adjusted EBITDA growth is significantly outpacing net sales growth
$1,964.9#
19
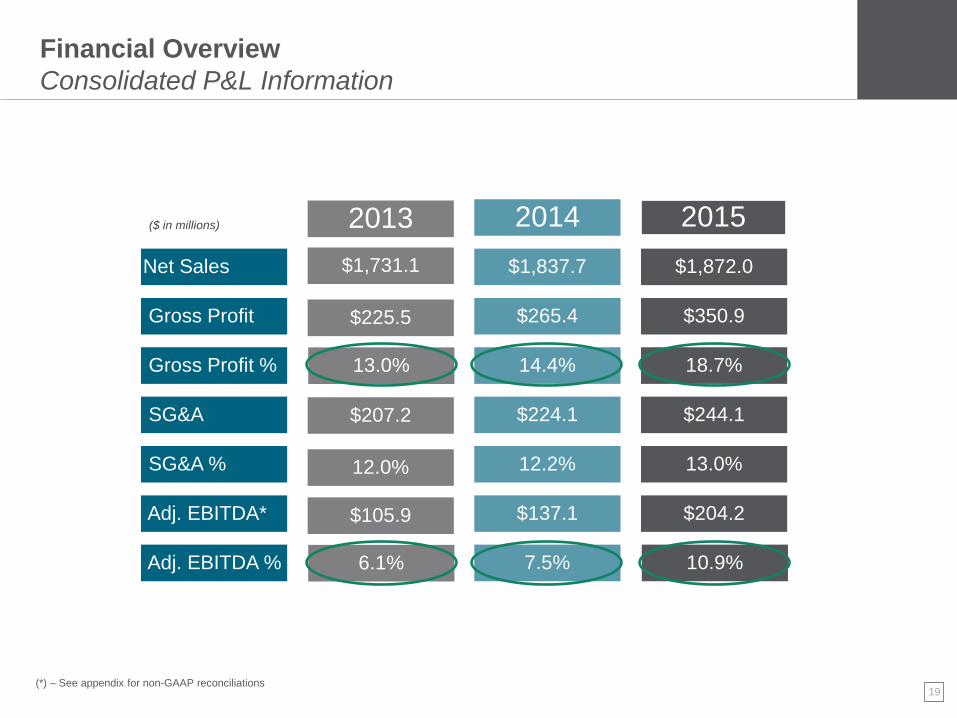
Financial Overview
Consolidated P&L Information
Net Sales
Gross Profit
Gross Profit %
SG&A
SG&A %
Adj. EBITDA*
Adj. EBITDA %
2013
$1,731.1
$225.5
13.0%
$207.2
12.0%
$105.9
6.1%
2014
$1,837.7
$265.4
14.4%
$224.1
12.2%
$137.1
7.5%
2015
$1,872.0
$350.9
18.7%
$244.1
13.0%
$204.2
10.9%
($ in millions)
(*) – See appendix for non-GAAP reconciliations

20
Financial Overview
2016 Macro Outlook
Headwinds
Continued U.S. housing market growth
Expect mid to high-single digit growth in
U.S. housing completions
Expect mid-single digit growth in the
U.S. RRR market
New product investments driving higher AUP
Benign commodities market
Tightening labor market in U.S.
“Brexit” risk impact in UK housing market
Weak and uneven housing market in Canada
due to lower commodities prices
Uncertain foreign exchange environment
Tailwinds

21
10.9%
0%
5%
10%
15%
20%
25%
2015 2018
$1.9
$0.0
$0.5
$1.0
$1.5
$2.0
$2.5
$3.0
2015 2018
Financial Overview
Long Term Growth Framework^
Net Sales
($ in billions)
Adjusted EBITDA* Margin
7% - 10%
CAGR
14% - 15%
( )̂ - Company long term growth framework is a forward-looking statement and subject to risks and uncertainties. See "Safe Harbor/Forward Looking Statement”
(*) – See definition of Adjusted EBITDA on page 2. We are not providing a quantitative reconciliation of our Adjusted EBITDA outlook to the corresponding GAAP information because the GAAP measures that we
exclude from our Adjusted EBITDA outlook are difficult to predict and are primarily dependent on future uncertainties.

22
Financial Overview
Cash Flow Deployment
1) Fund working capital
3) Strategic acquisitions
4) Return cash to shareholders
Continue to target Net Working Capital of
12-15% of net sales
Acquisitions to enhance portfolio and
value-added service offerings
Opportunistic share repurchases
2) Invest in growth initiatives Investment in new products and
technology enablers (~3% of Net Sales)
Cash Priorities
Strong liquidity allows simultaneous execution across all layers

23
Financial Overview
Liquidity, Credit and Debt Profile
Credit & Debt (millions of USD)
TTM Adj. EBITDA $234.1 $170.2
TTM Interest Expense $28.5 $39.5
Total Debt $471.0 $468.2
Net Debt* $408.6 $331.9
2Q16 2Q15
Six months
ended 7/3/2016
Six months
ended 6/28/2015
Unrestricted cash $62.4 $136.3
Total available liquidity $228.8 $278.3
Cash flow from operations $57.0 $40.2
Capital expenditures $38.1 $17.9
Liquidity & Cash Flow (millions of USD)
(*) – Net debt equals total debt less cash
24
Summary / Q&A
the beautiful door
25
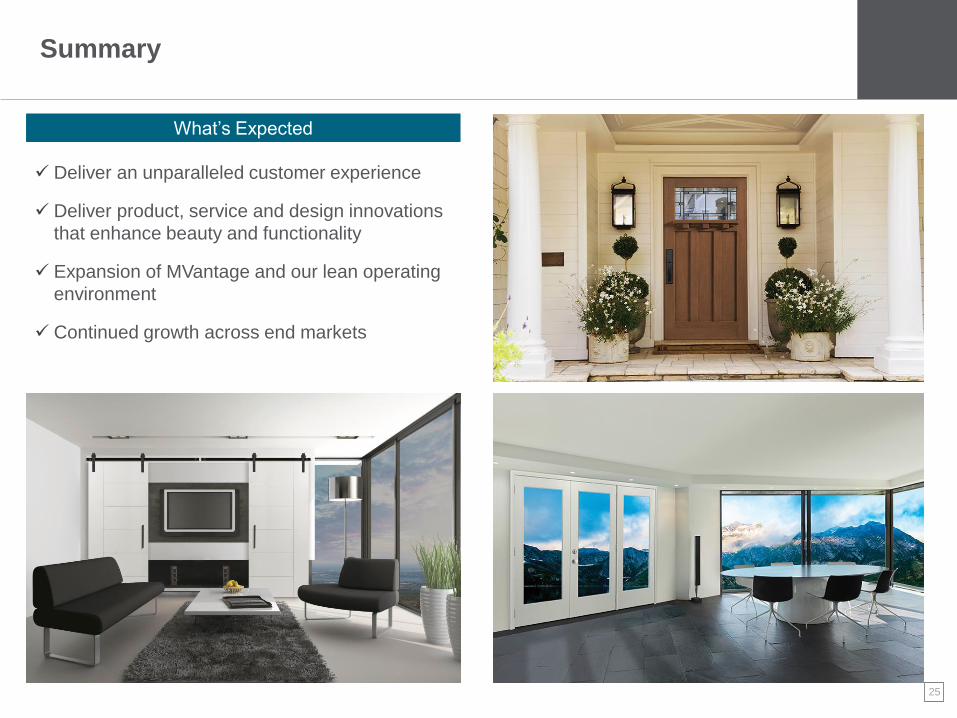
Summary
What’s Expected
Deliver an unparalleled customer experience
Deliver product, service and design innovations
that enhance beauty and functionality
Expansion of MVantage and our lean operating
environment
Continued growth across end markets

the beautiful door
Appendix
27
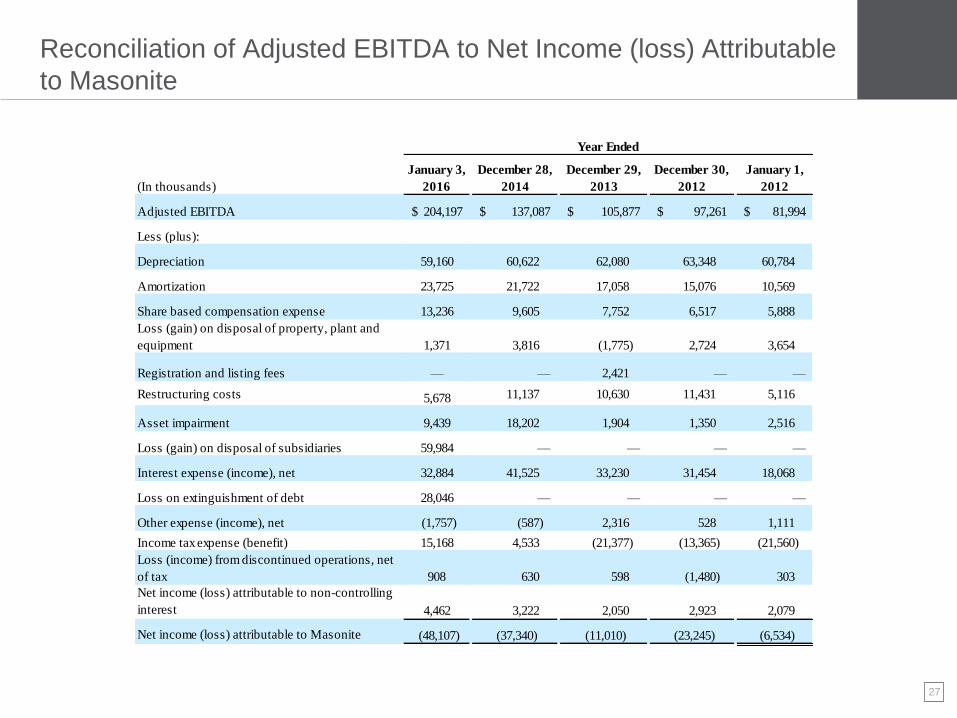
Reconciliation of Adjusted EBITDA to Net Income (loss) Attributable
to Masonite
(In thousands)
January 3,
2016
December 28,
2014
December 29,
2013
December 30,
2012
January 1,
2012
Adjusted EBITDA 204,197$ 137,087$ 105,877$ 97,261$ 81,994$
Less (plus):
Depreciation 59,160 60,622 62,080 63,348 60,784
Amortization 23,725 21,722 17,058 15,076 10,569
Share based compensation expense 13,236 9,605 7,752 6,517 5,888
Loss (gain) on disposal of property, plant and
equipment 1,371 3,816 (1,775) 2,724 3,654
Registration and listing fees — — 2,421 — —
Restructuring costs 5,678 11,137 10,630 11,431 5,116
Asset impairment 9,439 18,202 1,904 1,350 2,516
Loss (gain) on disposal of subsidiaries 59,984 — — — —
Interest expense (income), net 32,884 41,525 33,230 31,454 18,068
Loss on extinguishment of debt 28,046 — — — —
Other expense (income), net (1,757) (587) 2,316 528 1,111
Income tax expense (benefit) 15,168 4,533 (21,377) (13,365) (21,560)
Loss (income) from discontinued operations, net
of tax 908 630 598 (1,480) 303
Net income (loss) attributable to non-controlling
interest 4,462 3,222 2,050 2,923 2,079
Net income (loss) attributable to Masonite (48,107) (37,340) (11,010) (23,245) (6,534)
Year Ended

28
Reconciliation of Adjusted EBITDA to Net Income (loss) Attributable
to Masonite
Year Ended January 3, 2016
(In thousands)
North American
Residential Europe Architectural Corporate & Other Total
Adjusted EBITDA $ 165,560 $ 30,468 $ 23,281 $ (15,112 ) $ 204,197
Less (plus):
Depreciation 31,456 8,105 8,223 11,376 59,160
Amortization 4,954 6,860 8,428 3,483 23,725
Share based compensation expense — — — 13,236 13,236
Loss (gain) on disposal of property, plant and equipment 796
325
548
(298 ) 1,371
Restructuring costs 10 2,501 — 3,167 5,678
Asset impairment — 9,439 — — 9,439
Loss (gain) on disposal of subsidiaries — 29,721 — 30,263 59,984
Interest expense (income), net — — — 32,884 32,884
Loss on extinguishment of debt — — — 28,046 28,046
Other expense (income), net (50 ) 1,087 — (2,794 ) (1,757 )
Income tax expense (benefit) — — — 14,172 14,172
Loss (income) from discontinued operations, net of tax —
—
—
908
908
Net income (loss) attributable to non-controlling interest 3,323
—
—
1,139
4,462
Net income (loss) attributable to Masonite $ 125,071 $ (27,570 ) $ 6,082 $ (150,694 ) $ (47,111 )

29
the beautiful door


