Embed Size (px)
Citation preview

1"
COBRE DEL MAYO Investor Presentation Data as of 2Q15 (all amounts in USD unless otherwise noted)

COBRE DEL MAYO 2" 13
Disclaimer and Forward Looking Statements
The information contained herein has been prepared to assist interested parties in making their own evaluation of the Company and does not purport to be all inclusive or to contain all of the information that a prospective purchaser may desire. You should refer to the information in the Preliminary Offering Circular before making any investment decision to purchase the offered Notes. Forward Looking Statements This Investor Presentation and other communication with investors include forward-looking statements. These forward- looking statements include, without limitation, statements regarding our future financial position and results of operations, our strategy, plans, objectives, goals and targets, future developments in the markets in which we participate or are seeking to participate or anticipated regulatory changes in the markets in which we operate or intend to operate. In some cases, forward-looking statements can be identified by terminology such as “aim,” “anticipate,” “believe,” “continue,” “could,” “estimate,” “expect,” “forecast,” “guidance,” “intend,” “may,” “plan,” “potential,” “predict,” “project,” “should” or “will” or the negative of such terms or other comparable terminology.
By their nature, forward-looking statements involve risks and uncertainties because they relate to events and depend on circumstances that may or may not occur in the future. We caution potential investors that forward-looking statements are not guarantees of future performance and are based on numerous assumptions and that our actual results of operations, financial condition and liquidity may differ materially from (and be more negative than) those made in, or suggested by, the forward-looking statements contained in this Investor Presentation. In addition, even if our results of operations, financial condition and liquidity and the development of the industry in which we operate, are consistent with the forward-looking statements contained in this Investor Presentation, those results or developments may not be indicative of results or developments in subsequent periods. Important factors that could cause these differences include, but are not limited to: In light of these risks, uncertainties and assumptions, the forward-looking events described in this Investor Presentation may not occur. We undertake no obligation to update or revise any forward-looking statement, whether as a result of new information or future events or developments.
• risks related to our competitive position; • risks related to our strategy and expectations about growth in demand for copper
and business operations, financial condition and results of operations; • risks related to the revocation, expropriation or termination of our mining
concessions or our water concessions or of the agreements pursuant to which we explore or exploit mining concessions belonging to third parties;
• the inability to be compensated fairly in the event of termination of our mining concessions or our water concessions;
• the impact of fluctuations in the market price for copper; • the impact of changes in the prices of raw materials, labor and our products; • our relationship with unions and our ability to negotiate collective bargaining
agreements; • the availability of materials and equipment;
• our access to funding sources, and the cost of the funding; • changes in regulatory, administrative or economic conditions affecting the
mining industry, including government interpretations and policies; • the application and enforcement of environmental laws and regulations; • risks related to Mexico’s social, political or economic environment; • the impact of changes in the end uses of our products; • fluctuations in the value of the U.S. dollar against the Mexican peso; • risks associated with market demand for and liquidity of the notes; and • changes in the taxation of our business.

3"
COBRE DEL MAYO
Index
I. Company Overview
II. Industry and Commodity Overview
III. Operational Environment
IV. Historical Financial Performance V. Conclusion
4
14
18
20
23
3"

I. Company Overview

COBRE DEL MAYO 5" 13
Cobre del Mayo Snapshot
! Cobre del Mayo is a Mexican mining company that operates the Piedras Verdes (PV) open-pit copper mine in Sonora, Mexico
! PV is the third largest copper mine in Mexico as measured by production
! It began commercial production in 2006
! Purchased by Invecture in mid 2009
! During 2012 a flotation circuit operated by Kupari Metals with capacity of ~5,500 tons per day (“tpd”) was built and in April 2013 copper concentrate production began
! Produces LME Grade A copper cathode and sells refractory and vein type ore for processing into concentrate
! Mineral Reserves of 1.13 million tons of copper and 15+ year mine life
Piedras Verdes Advantaged Location and Access:
Huatabampo
Chihuahua
Sinaloa
PiedrasVerdes Alamos
Navojoa
Sonora
CiudadObregon
Guaymas
BajaCalifornia
P
C
Deep Water Port
Commercial Airport
Railway
Rail Station
Major Highway
Private Airport
C
P
! All infrastructure is in place
! Easily accessible by air, road, rail and ports
! Extremely competitive transportation costs for off-takers given PV’s location and nearby infrastructure
! Power: Connected to CFE (Federal Electricity Commission) grid to the mine owned and maintained substation with continuous capacity of 25 MW; CDM is CFE’s single largest customer in the area
! Water: CDM holds 7 titled water concessions for ~3.9 Mm³/yr while the requirement for the operation of the PV Mine is ~3.0 Mm³/yr

COBRE DEL MAYO 6" 13
Key Initiatives Implemented Since Invecture Acquisition
! In 2009, changed from contract mining to owner operation and purchased the former contractor’s equipment fleet. Purchased, re-engineered and installed a crushing, screening, conveying and stacking system
! Diversification of processes:
— Crush for Leach, Run of Mine (ROM) leach, and SX/EW produce copper cathode
• Installed capacity of 87 tpd, increasing to ~100 tpd in 2H15
— Sales of refractory and vein type ore for concentrate production
• Flotation plant current installed capacity of ~5.5 ktpd + ~1.7 ktpd of high clay slimes from the Fines Classification System1
Copper Cathode Monthly Production Evolution (t)
1. See slide 11 for further reference
!"!!!!
!500!!
!1,000!!
!1,500!!
!2,000!!
!2,500!!
!3,000!!
Jan!
Feb!
Mar!
Apr!
May!
Jun! Jul!
Aug!
Sep!
Oct!
Nov!
Dec!
Jan!
Feb!
Mar!
Apr!
May!
Jun! Jul!
Aug!
Sep!
Oct!
Nov!
Dec!
Jan!
Feb!
Mar!
Apr!
May!
Jun! Jul!
Aug!
Sep!
Oct!
Nov!
Dec!
Jan!
Feb!
Mar!
Apr!
May!
Jun! Jul!
Aug!
Sep!
Oct!
Nov!
Dec!
Jan!
Feb!
Mar!
Apr!
May!
Jun! Jul!
Aug!
Sep!
Oct!
Nov!
Dec!
Jan!
Feb!
Mar!
Apr!
May!
Jun! Jul!
Aug!
Sep!
Oct!
Nov!
Dec!
Jan!
Feb!
Mar!
Apr!
May!
Jun!
Tons!
2009! 2013!2012!2011!2010! 2014!
Acquisi'on*by*Invecture*
2015!
Acquisi'on*by*Invecture*
2,157"

COBRE DEL MAYO 7" 13
Stable Low Risk Operations and Processes
! $312.0 M in capex has been invested since 2009 with limited sustaining capex going forward of ~ $13 M/yr LOM ! Ore processing method is chosen according to grade, mineralization, and leaching and flotation characteristics to provide the
best overall allocation using: (i) ROM heap leach (ii) crushed ore heap leach (iii) ore for concentration

COBRE DEL MAYO 8" 13
Cobre del Mayo Today
! The PV Mine has been transformed into a high quality copper producing asset with strong operating metrics and competitive Cash Cost — Since January 2012, PV cathode production has averaged 80 tpd — 2Q15 LTM sales totaled $206.3 M
• Copper cathode production of 26,542 t generating $184.7 M of sales • Copper contained in ore totaled 14,693 t generating $21.6 M of sales1
— 2Q15 LTM EBITDA of $53.8 M — Credit metrics2:
• Leverage is 4.15x Net Debt / 2Q15 LTM EBITDA
• Debt / Total Capitalization is 40.9% (2Q15 LTM) — Strip Ratio has declined from 3.28x in FY 2012 to 2.01x during 2Q15 LTM
1. Pursuant to the agreement between Kupari Metals and Cobre del Mayo, the amount payable to the Company is dependent, among other variables, on the grade of the ore sold by Cobre del Mayo and on the grade of the concentrate produced by Kupari Metals.
2. Considering 2Q15 LTM total debt of $239.3 M (weighted average interest rate of 10.02%) and $16.3 M of Cash and Equivalents
Cu Cathode Production and Total Sales EBITDA and EBITDA Margin
$78.2 $197.7 $238.2 $225.2 $194.8 $184.7
$26.8 $31.1
$21.6
10.9
22.8
30.7 30.4 27.5 26.5
$0
$50
$100
$150
$200
$250
$300
0
6
12
18
24
30
36
FY 2010 FY 2011 FY 2012 FY 2013 FY 2014 2Q15 LTM
$M
kt
Cathode Sales ($M) Sales of Ore ($M) Cathode Production (Kt)
$26.0 $65.6 $105.7 $92.0 $67.4 $53.8
33% 33%
44%
37%
30% 26%
$0
$25
$50
$75
$100
$125
FY 2010 FY 2011 FY 2012 FY 2013 FY 2014 2Q15 LTM 0%
10%
20%
30%
40%
50%
$M
%
EBITDA ($M) EBITDA Margin (%)

COBRE DEL MAYO 9" 13
Kupari Acquisition
! During 4Q14, Cobre del Mayo acquired 40% of the common stock of Kupari Holdings, which owns the flotation plant adjacent to the Piedras Verdes Mine. As a result, Cobre del Mayo now accounts for its 40% participation in Kupari Holdings by using the equity method.
! Cobre del Mayo’s participation in Kupari Holdings:
— Simplifies and optimizes ore allocation among processes
— Facilitates process improvements that involve both heap leaching and flotation
— Diversifies operational risk across two processes and products
Adjusted 2Q15 EBITDA Adjusted 2Q15 C1 Cash Cost
4Q14 1Q15 2Q15
$12.6 $14.3
$10.0
$1.6
$1.7
$2.4
$14.3 $16.0
$12.4
$0
$2
$4
$6
$8
$10
$12
$14
$16
$18
EBITDA 40% KM Contribution
Adjusted EBITDA
EBITDA 40% KM Contribution
Adjusted EBITDA
EBITDA 40% KM Contribution
Adjusted EBITDA
$ M
4Q14 1Q15 2Q15
$2.59 $2.40 $2.40 -$0.09
-$0.11 -$0.10
$2.50 $2.30 $2.30
$0.00
$0.50
$1.00
$1.50
$2.00
$2.50
$3.00
C1 Cash Cost
40% KM Contribution
Adjusted C1 CC
C1 Cash Cost
40% KM Contribution
Adjusted C1 CC
C1 Cash Cost
40% KM Contribution
Adjusted C1 CC
$/lb

COBRE DEL MAYO 10" 13
!$0.50&
$0.00&
$0.50&
$1.00&
$1.50&
$2.00&
$2.50&
$3.00&
$3.50&
$4.00&
$4.50&
$5.00&
0%& 4%& 7%& 11%& 15%& 19%& 22%& 26%& 30%& 34%& 37%& 41%& 45%& 49%& 52%& 56%& 60%& 63%& 67%& 71%& 75%& 78%& 82%& 86%& 90%& 93%& 97%&
($/lb)'
Percen-le'of'Cumula-ve'Metal'
C1&Cash&Cost&
C1&CC&+&Sustaining&Capex&&
On a Path to Achieve a Competitive Cash Cost
1. Source: Wood Mackenzie
2Q15 Estimated Global Copper C1 Cash Cost Curve1
C1 CC < $1.22/lb C1 CC < $2.01/lb C1 CC < $3.78/lb
C1 Cash Cost + Sust. Capex:
2Q15 LTM $2.74
C1 CC < $1.67/lb
C1 Cash Cost: 2Q15 LTM $2.42
Cobre del Mayo Historical C1 Cash Cost
$3.63 $2.69 $2.08 $1.99 $2.22 $2.40 $0.00
$1.00
$2.00
$3.00
$4.00
FY 2010 FY 2011 FY 2012 FY 2013 FY 2014 2Q 2015
$/lb

COBRE DEL MAYO 11" 13
43 – 101 Reserves and Resources completed in 3Q14
! Updated 43-101 compliant Reserve Report released in August 2014 (published October 13, 2014)
! Reserve of 1.13 million tons of copper with a mine life of 15+ years
! Elaborated optimizing both copper cathode and copper concentrate production of the Piedras Verdes deposit
! Annual average production of ~30 kt/a of copper cathode and 8.2 ktpd of ore for copper concentrate
Summary Mineral Reserves and Resources
Ore$(kt) Grade$(%) Total$Cu$(t)!!!Ore!to!ROM 211,817 0.18 388,261!!!Ore!to!Crushing 151,375 0.30 454,283!!!Ore!for!Concentrate 57,148 0.51 292,374Proven$&$Probable 420,340 0.27 1,134,918!!!Waste 548,998!!!Strip!Ratio 1.31x
Ore$(kt) Grade$(%) Total$Cu$(t)!!!!!!Measured 304,970 0.26 792,922!!!!!!Indicated! 210,060 0.25 525,150!!!Total!M+I 515,030 0.26 1,318,072!!!Inferred 52,690 0.24 126,456Total$Resource 567,720 0.25 1,444,528
Estimated$Reserves
Resources
A"new"43*101"will"be"released"during"2H15"

COBRE DEL MAYO 12" 13
Relevant Agreements and Risk Management
Copper Cathode
! Agreement for sale of 100% of 2015 PV cathode production to two internationally renowned, credit-worthy commodity traders (50% of cathode production to each trader).
— Both agreements are valid from January 1, 2015 through and including December 31, 2015.
— Cathode sold FOB at the mine and paid twice weekly against holding certificates
Mining Concessions
! We have the exclusive right to explore and exploit 30 mining concessions with an initial term of 50 years which terminate between 2043 and 2062
— 25 mining concessions owned by PV
— 5 mining concessions owned by Grupo Rexgo. The right to exploit these concessions is governed by a contract subject to international arbitration
! Royalties: Grupo Rexgo charges PV a 3% net sales royalty for the copper mined from their underground resource concessions
! Land Ownership: PV owns all of the land at the mine in addition to a reserve for leach pad and waste dump expansion
Ore for Concentrate
! CDM sells copper ore to KM to produce copper concentrate
— Purchase Price of Ore: Purchase of the ore is a function of the copper recovered and the current LME copper price with certain freight, handling and operating charges
— Term: Initial fixed term of 10 years and provides for renewals
— Volume: Since April, 2013, CDM has sold an average of 5,219 tpd with 46 tpd of copper contained

COBRE DEL MAYO 13" 13
Relevant Agreements and Risk Management
Mining Tax
! Mexican government implemented a special duty on mining concessions roughly equivalent to 7.5% of EBITDA starting January, 2014
! As roughly 95% of CDM ore is derived from Grupo Rexgo mining concessions, tax is payable by the concession holder with respect to its EBITDA
Labor / Environmental
! Safety, environmental compliance and labor relations are key areas of focus ! Since Invecture’s acquisition, CDM has had a solid safety track record
— Lowest premium for “Riesgo de Trabajo” (worker risk) as classified by IMSS (Mexican Social Security Institute), demonstrating high safety standards
! Approx. 409 of our 918 employees are represented by the Confederación de Trabajadores de Mexico (“CTM”)
! Certified as a Socially Responsible company by the Mexican Center for Philanthropy (Centro Mexicano para la Filantropía) and certified as a Clean Industry by the Mexican Federal Attorney for Environmental Protection (Procuraduría Federal de Protección al Ambiente), the enforcement arm of the Mexican environmental ministry
Insurance Policy
! Insurance policy coverage for all risk with business interruption — Policy underwritten by Royal & SunAlliance with general coverage up to $200 M

II. Industry and Commodity Overview

COBRE DEL MAYO 15" 13
Copper Price Forecasts Over Time
! The market has consistently underestimated the copper price when forecasting long term prices
! Copper prices have been much higher due to continuing shortfalls in supply. Delays in new projects, supply interruption and declining production from existing mines have been the main drivers
Copper Historical Price vs. Forecasts
Source: Broker Research, Jefferies
$0.00
$0.50
$1.00
$1.50
$2.00
$2.50
$3.00
$3.50
$4.00
$4.50
2000 2001 2002 2003 2004 2005 2006 2007 2008 2009 2010 2011 2012 2013 2014 2015 2016 2017 2018 2019 2020 2021
2010
2009
2008
Actual
2010 LT
2009 LT
2008 LT
2007 LT
2006 LT
2005 LT 2004 LT 2003 LT 2002 LT 2001 LT 2000 LT
2011 LT
2011
2012
Current LT: US$3.06 / lb
Long Term Price (as forecast during Q4 of year indicated)
Actual Copper Price Broker Consensus (as forecast during Q4 of year indicated)
2012 LT
2014
2013 LT
2013 Current
2014 LT
($/lb
)

COBRE DEL MAYO 16" 13
Incentive Price Drives the Floor Value of Copper
" Investment in large projects is very capital intensive and is increasingly so as head grade declines " The incentive price required to justify investments in the expansion of existing mines and the construction of new ones is
estimated at $3.30/lb ($7,275/t) — Incentive price considers required Cu price to achieve specified rate of return on expansion capex(1)
— Incentive price has been adjusted downward by $0.20/lb from $3.50/lb ($7,716/t) to reflect the decline in oil driven input prices since 2Q14 and the USD strength.
" Although short term copper prices are unpredictable, we believe that long term prices must be driven by the increase over time of the incentive price (necessary to justify the investment in new production to maintain global output)
Incentive Prices for Major Projects
Source: Wood Mackenzie 1. Analysis based on long term price required to give a 12.0% risk adjusted IRR on a pre-tax 100% equity basis.
c / l
b
Paid Metal (M lbs)
Adjusted"incen;ve"price"$3.30/lb"

COBRE DEL MAYO 17" 13
Cu Pricing Considerations
! Copper has traded in the market at a premium to the 90th percentile of the C1 cash cost curve
— C1 cash cost as estimated by Wood Mackenzie
Source: Wood Mackenzie, LME 1. 90th percentile as estimated by Wood Mackenzie.
C1 90th Percentile Costs1 vs. Cu Price
$1.11 $1.62 $2.57 $2.55 $2.39 $2.42 $2.39
$1.67
$3.42
$4.00
$3.61 $3.32
$3.11 $2.90
$0.00
$1.00
$2.00
$3.00
$4.00
$5.00
2005 2010 2011 2012 2013 2014 2Q15 LTM
$/lb
C1 Cash Cost 90th Percentile ($/lb) Average LME Spot Cu Price ($/lb)

III. Operational Environment
COBRE DEL MAYO 19" 13
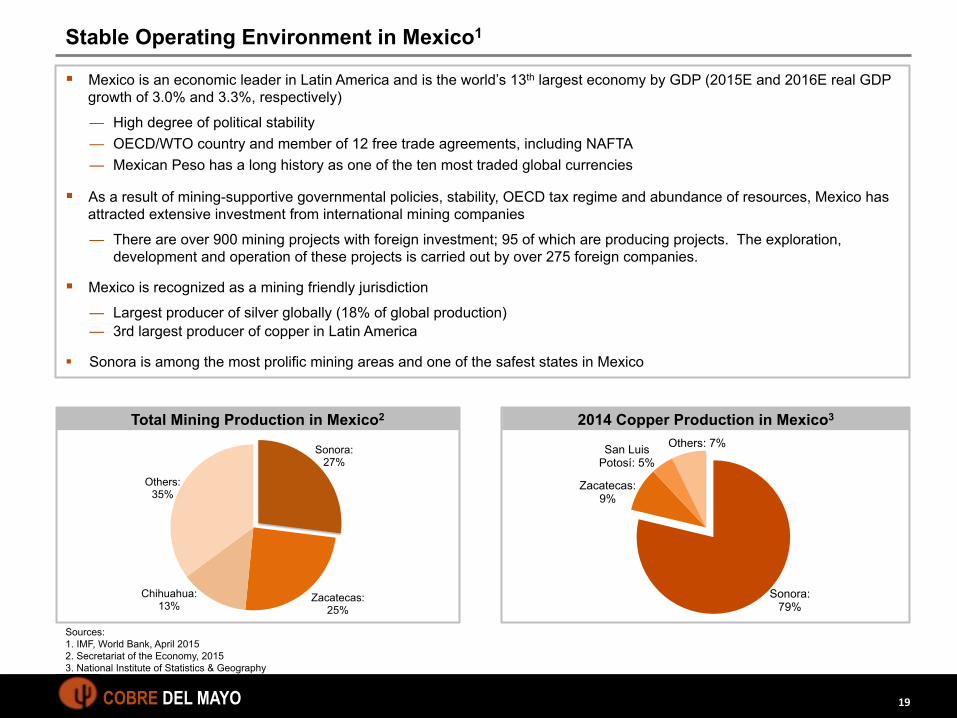
Stable Operating Environment in Mexico1
! Mexico is an economic leader in Latin America and is the world’s 13th largest economy by GDP (2015E and 2016E real GDP growth of 3.0% and 3.3%, respectively)
— High degree of political stability — OECD/WTO country and member of 12 free trade agreements, including NAFTA — Mexican Peso has a long history as one of the ten most traded global currencies
! As a result of mining-supportive governmental policies, stability, OECD tax regime and abundance of resources, Mexico has attracted extensive investment from international mining companies
— There are over 900 mining projects with foreign investment; 95 of which are producing projects. The exploration, development and operation of these projects is carried out by over 275 foreign companies.
! Mexico is recognized as a mining friendly jurisdiction
— Largest producer of silver globally (18% of global production) — 3rd largest producer of copper in Latin America
! Sonora is among the most prolific mining areas and one of the safest states in Mexico
Sonora: 27%
Zacatecas: 25%
Chihuahua: 13%
Others: 35%
Total Mining Production in Mexico2
Sonora: 79%
Zacatecas: 9%
San Luis Potosí: 5%
Others: 7%
2014 Copper Production in Mexico3
Sources: 1. IMF, World Bank, April 2015 2. Secretariat of the Economy, 2015 3. National Institute of Statistics & Geography

COBRE DEL MAYO 20" 13
IV. Historical Financial Performance

COBRE DEL MAYO 21" 13
Summary of Historical Financials
Cathode Produced & Copper Contained in Ore Sold
Operating Costs1 C1 Cash Costs
1. Operating cost exclude: Depreciation & amortization, change in Cu process inventory, ARO amortization, external exploration expenditure, and royalties
Total Sales and Realized Cu Price
29.8
62.6
84.1 83.3 75.5 72.7
36.7 45.4
40.3
0
20
40
60
80
100
FY 2010 FY 2011 FY 2012 FY 2013 FY 2014 2Q15 LTM
tpd
Cathode Production (tpd) Copper contained in ore sold (tpd)
$78.2 $197.7 $238.2 $225.2 $194.8 $184.7
$26.8 $31.1
$21.6
$3.28 $3.91 $3.57
$3.31 $3.21 $3.15
$0
$75
$150
$225
$300
FY 2010 FY 2011 FY 2012 FY 2013 FY 2014 2Q15 LTM $0.00
$1.00
$2.00
$3.00
$4.00
$M
$/lb
Cathode Sales ($M) Sales of Ore ($M) Cu Price ($/lb)
$87.3 $135.6 $141.1 $160.0 $166.2 $163.0 $0
$50
$100
$150
$200
FY 2010 FY 2011 FY 2012 FY 2013 FY 2014 2Q15 LTM
$M
$3.63 $2.69 $2.08 $1.99 $2.22 $2.42
29.8
62.6
84.1 83.3 75.5 72.7
0
10
20
30
40
50
60
70
80
90
$0.00
$0.50
$1.00
$1.50
$2.00
$2.50
$3.00
$3.50
$4.00
$4.50
FY 2010 FY 2011 FY 2012 FY 2013 FY 2014 2Q15 LTM
tpd
$/lb
Cu Price ($/lb) Cathode Production (tpd)

COBRE DEL MAYO 22" 13
Summary Historical Financials (cont’d) Capital Expenditures1 EBITDA and EBITDA Margin
EBITDA minus Capex
1. Capital expenditures: the acquisition of six CAT 789 trucks in 1Q14 and a CAT 6050 hydraulic mining shovel in 3Q14 did not have any significant impact on the cash flow as they were financed by capital lease agreements with Caterpillar Crédito S.A. de C.V.
$75.7
$16.1
$31.4
$41.6
$49.1
$39.4
$0
$10
$20
$30
$40
$50
$60
$70
$80
FY 2010 FY 2011 FY 2012 FY 2013 FY 2014 2Q15 LTM
$M
-$49.7
$49.5 $74.3 $50.4 $18.3 $14.4
-$60
-$40
-$20
$0
$20
$40
$60
$80
$100
FY 2010 FY 2011 FY 2012 FY 2013 FY 2014 2Q15 LTM
$M
$26.0 $65.6 $105.7 $92.0 $67.4 $53.8
33% 33%
44%
37%
30% 26%
$0
$25
$50
$75
$100
$125
FY 2010 FY 2011 FY 2012 FY 2013 FY 2014 2Q15 LTM 0%
10%
20%
30%
40%
50%
$M
%
EBITDA ($M) EBITDA Margin (%)

V. Conclusion

COBRE DEL MAYO 24" 13
Conclusion
! Operating mine without new project development risk ! Favorable logistics and infrastructure ! Good labour relations ! Long life of mine of 15+ years