Embed Size (px)
Citation preview

April 2015 1 - Group Communication & IR
HeidelbergCement Group presentation
Scantogo clinker plant in Togo
April 2015 2 - Group Communication & IR
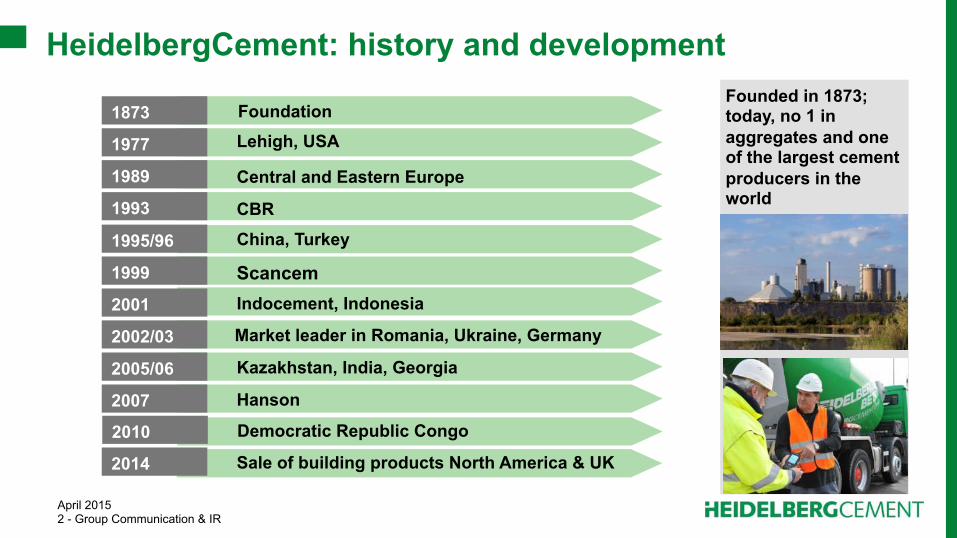
HeidelbergCement: history and development
1873 Foundation
1977 Lehigh, USA
1989 Central and Eastern Europe
1993 CBR
1995/96 China, Turkey
1999 Scancem
2001 Indocement, Indonesia 2002/03
2005/06 Kazakhstan, India, Georgia
2007 Hanson
2010 Democratic Republic Congo
Market leader in Romania, Ukraine, Germany
Founded in 1873; today, no 1 in aggregates and one of the largest cement producers in the world
2014 Sale of building products North America & UK
April 2015 3 - Group Communication & IR
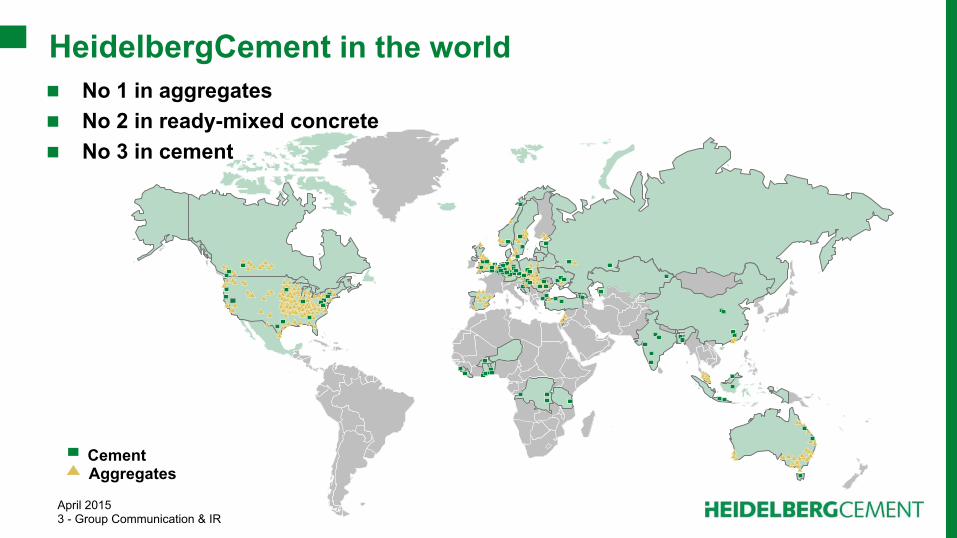
HeidelbergCement in the world
Cement Aggregates
No 1 in aggregates No 2 in ready-mixed concrete No 3 in cement
April 2015 4 - Group Communication & IR
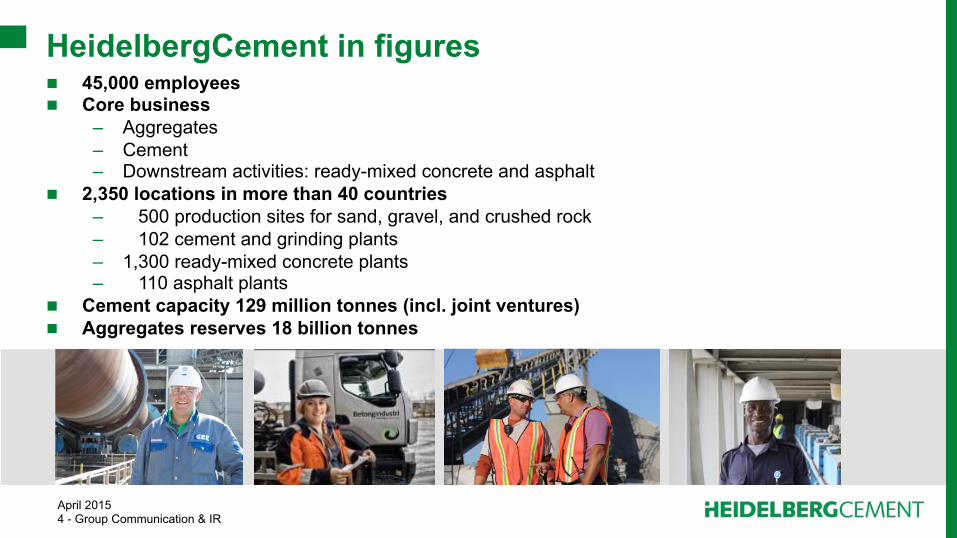
HeidelbergCement in figures 45,000 employees Core business
– Aggregates – Cement – Downstream activities: ready-mixed concrete and asphalt
2,350 locations in more than 40 countries – 500 production sites for sand, gravel, and crushed rock – 102 cement and grinding plants – 1,300 ready-mixed concrete plants – 110 asphalt plants
Cement capacity 129 million tonnes (incl. joint ventures) Aggregates reserves 18 billion tonnes
April 2015 5 - Group Communication & IR
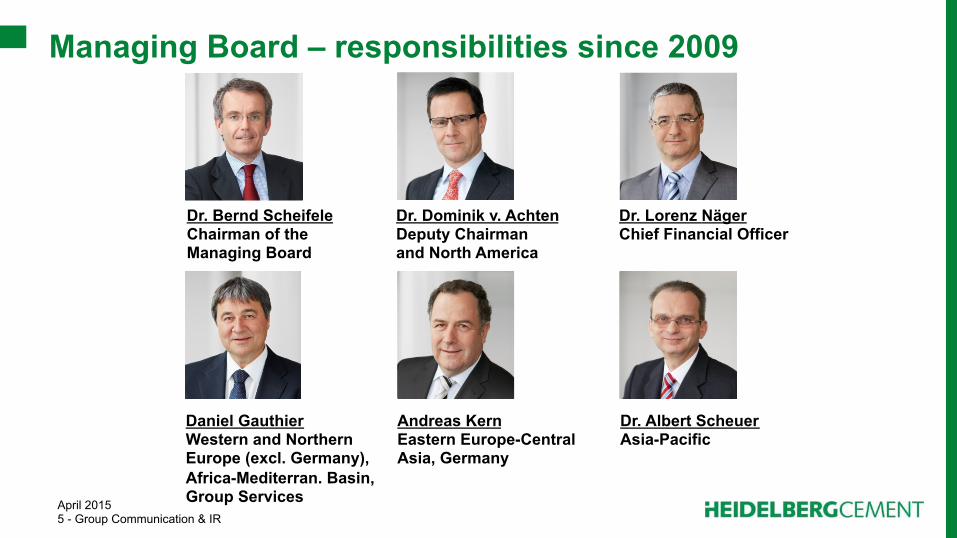
Managing Board – responsibilities since 2009
Dr. Bernd Scheifele Chairman of the Managing Board
Dr. Lorenz Näger Chief Financial Officer
Dr. Dominik v. Achten Deputy Chairman and North America
Daniel Gauthier Western and Northern Europe (excl. Germany), Africa-Mediterran. Basin, Group Services
Andreas Kern Eastern Europe-Central Asia, Germany
Dr. Albert Scheuer Asia-Pacific
April 2015 6 - Group Communication & IR
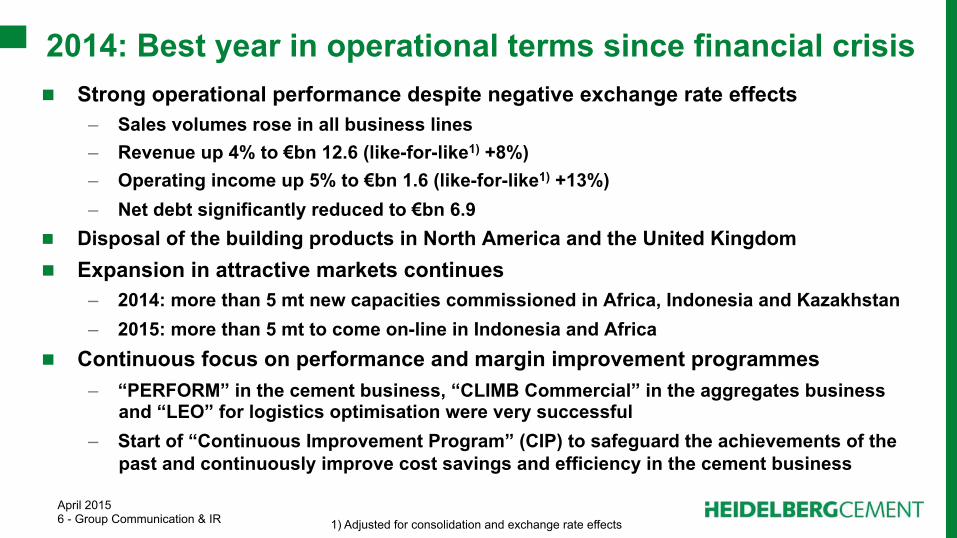
2014: Best year in operational terms since financial crisis
1) Adjusted for consolidation and exchange rate effects
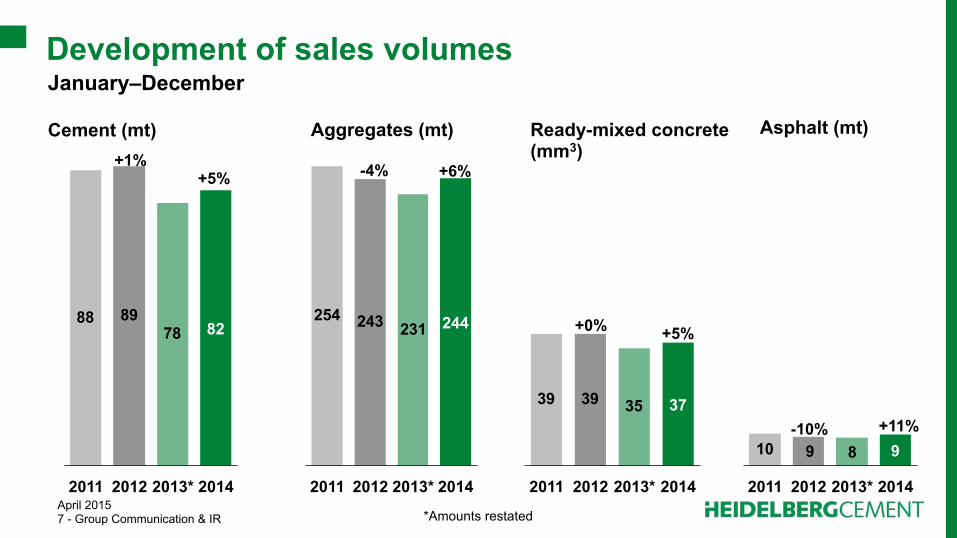
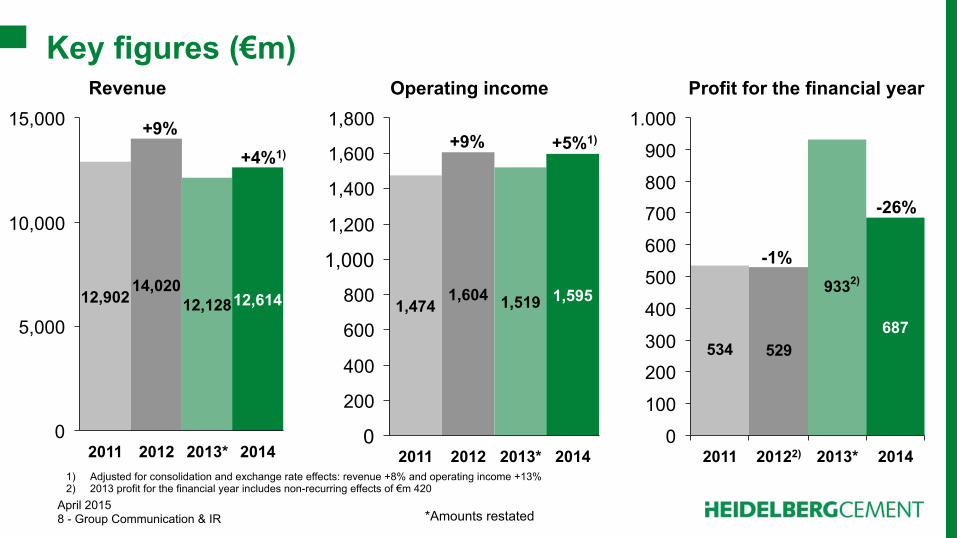
Strong operational performance despite negative exchange rate effects – Sales volumes rose in all business lines – Revenue up 4% to €bn 12.6 (like-for-like1) +8%) – Operating income up 5% to €bn 1.6 (like-for-like1) +13%) – Net debt significantly reduced to €bn 6.9
Disposal of the building products in North America and the United Kingdom Expansion in attractive markets continues
– 2014: more than 5 mt new capacities commissioned in Africa, Indonesia and Kazakhstan – 2015: more than 5 mt to come on-line in Indonesia and Africa
Continuous focus on performance and margin improvement programmes – “PERFORM” in the cement business, “CLIMB Commercial” in the aggregates business
and “LEO” for logistics optimisation were very successful – Start of “Continuous Improvement Program” (CIP) to safeguard the achievements of the
past and continuously improve cost savings and efficiency in the cement business
April 2015 7 - Group Communication & IR
88 8978
2013* 2012 2011 2014
82 254 243 231
2014
244
2012 2011 2013*
39 39 35
2014
37
2012 2011 2013*
10 89
2014
9
2012 2011 2013*
+1% +5% +6%
+0%
+11%
-4%
+5%
-10%
Ready-mixed concrete (mm3)
Cement (mt) Aggregates (mt) Asphalt (mt)
January–December Development of sales volumes
*Amounts restated
April 2015 8 - Group Communication & IR
534 529
933
0 2014
687
2013* 20122) 2011
400
200
300
100
1.000
900
800
700
600
500
5,000
0
12,128
2014 2012
12,614 14,020
2013* 2011
10,000
15,000
12,902
1,800
1,600
1,400
1,200
1,000
800
600
400
200
0 2014
1,595
2013*
1,519
2012
1,604
2011
1,474
+4%1)
+9% +5%1) +9%
-1%
Revenue Operating income Profit for the financial year
Key figures (€m)
-26%
1) Adjusted for consolidation and exchange rate effects: revenue +8% and operating income +13% 2) 2013 profit for the financial year includes non-recurring effects of €m 420
*Amounts restated
2)
April 2015 9 - Group Communication & IR
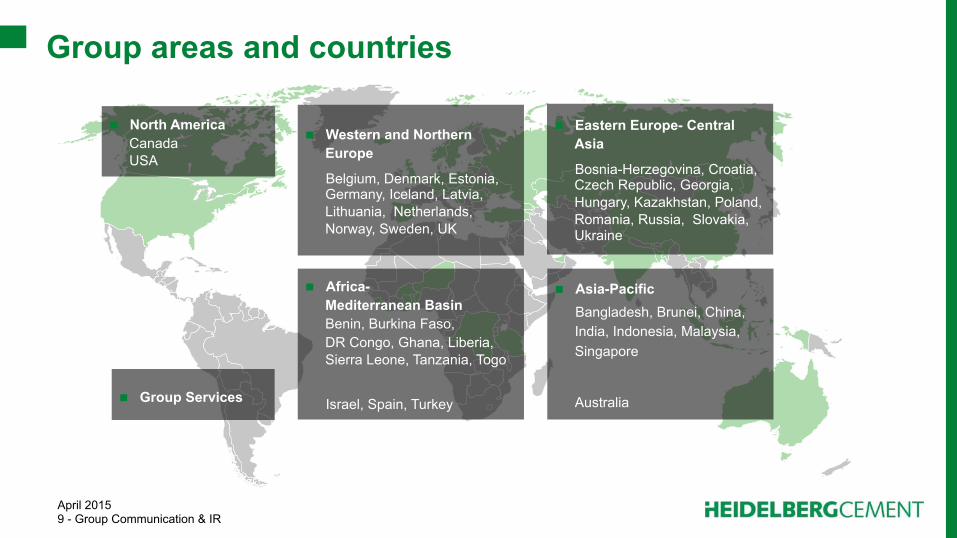
Eastern Europe- Central Asia
Bosnia-Herzegovina, Croatia, Czech Republic, Georgia, Hungary, Kazakhstan, Poland, Romania, Russia, Slovakia, Ukraine
Group areas and countries
North America Canada USA
Group Services
Asia-Pacific Bangladesh, Brunei, China, India, Indonesia, Malaysia, Singapore
Australia
Western and Northern Europe
Belgium, Denmark, Estonia, Germany, Iceland, Latvia, Lithuania, Netherlands, Norway, Sweden, UK
Africa- Mediterranean Basin Benin, Burkina Faso, DR Congo, Ghana, Liberia, Sierra Leone, Tanzania, Togo
Israel, Spain, Turkey
April 2015 10 - Group Communication & IR
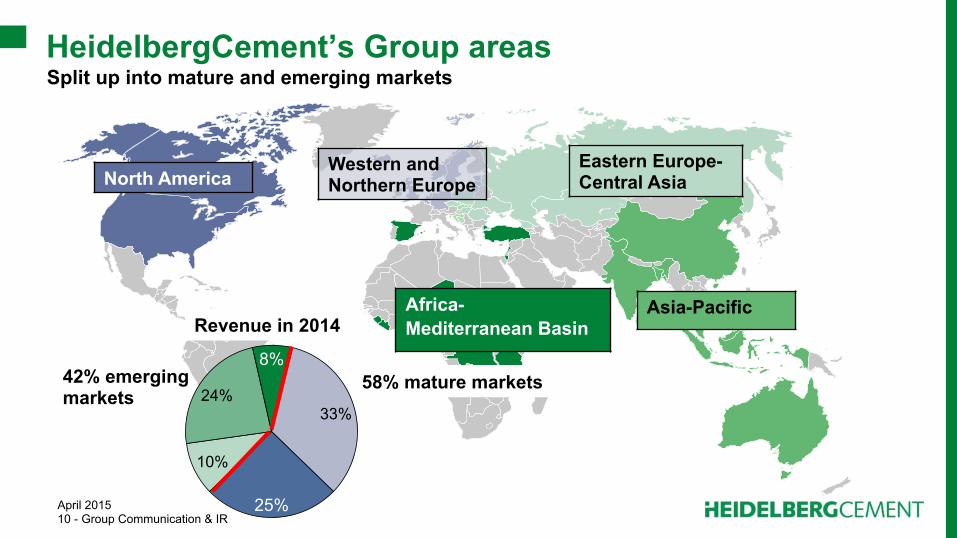
HeidelbergCement’s Group areas Split up into mature and emerging markets
North America Western and Northern Europe
Asia-Pacific
Eastern Europe-Central Asia
Africa- Mediterranean Basin
8%
24%
10%
25%
33%
Revenue in 2014
42% emerging markets
58% mature markets
April 2015 11 - Group Communication & IR
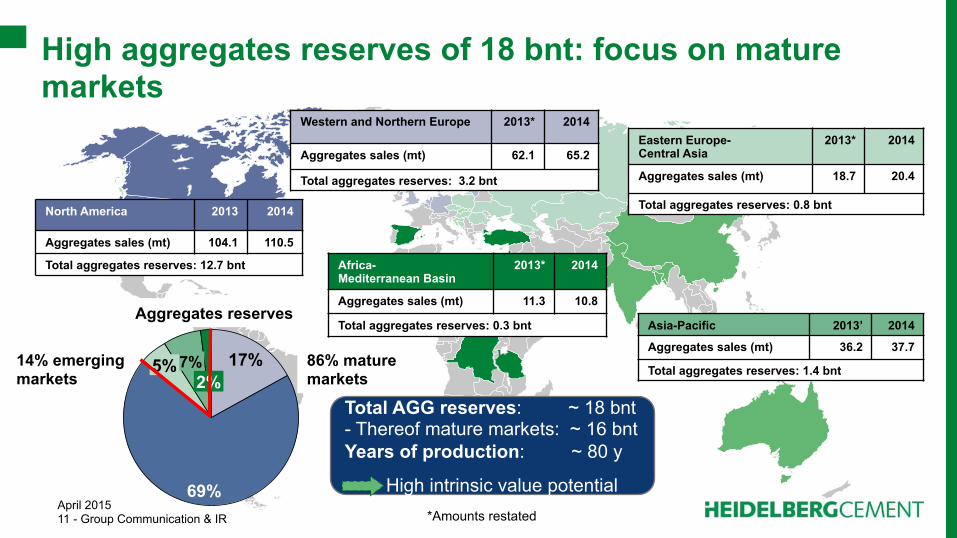
High aggregates reserves of 18 bnt: focus on mature markets
North America 2013 2014
Aggregates sales (mt) 104.1 110.5
Total aggregates reserves: 12.7 bnt
Western and Northern Europe 2013* 2014
Aggregates sales (mt) 62.1 65.2
Total aggregates reserves: 3.2 bnt
Eastern Europe- Central Asia
2013* 2014
Aggregates sales (mt) 18.7 20.4
Total aggregates reserves: 0.8 bnt
Africa- Mediterranean Basin
2013* 2014
Aggregates sales (mt) 11.3 10.8
Total aggregates reserves: 0.3 bnt Asia-Pacific 2013’ 2014
Aggregates sales (mt) 36.2 37.7
Total aggregates reserves: 1.4 bnt 2%
17% 7% 5%
69%
14% emerging markets
86% mature markets
Aggregates reserves
Total AGG reserves: ~ 18 bnt - Thereof mature markets: ~ 16 bnt Years of production: ~ 80 y
High intrinsic value potential *Amounts restated

April 2015 12 - Group Communication & IR
Cement capacity of 113 mt: focus on emerging markets
GDP prognosis 2012–2017 in % by International Monetary Fund
+2.9%
+1.6% +3.4%
+5.5% +7.8%
Africa- Mediterranean Basin
2013* 2014
Cement sales (mt) 6.6 6.4
Cement capacity: 9.5 mt p.a. (Additional capacity of JV: 3.8 mt p.a.)
Western and Northern Europe
2013 2014
Cement sales (mt) 20.9 21.6
Cement capacity: 32.8 mt p.a.
Eastern Europe-Central Asia
2013* 2014
Cement sales (mt) 16.0 17.1
Cement capacity: 28.4 mt p.a. (Additional capacity of JV: 2.1 mt p.a.)
Asia-Pacific 2013* 2014
Cement sales (mt) 23.4 24.6
Cement capacity: 29.0 mt p.a. (Additional capacity of JV: 10.1 mt p.a.)
North America 2013* 2014
Cement sales (mt) 11.6 12.1
Cement capacity: 12.9 mt p.a. (Additional capacity of JV: 0.6 mt p.a.)
10%
30%
24%
11%
25% 64% emerging markets
36% mature markets
Total cement capacity incl. JV
Total cement capacity incl. joint ventures: 129 mt
*Amounts restated
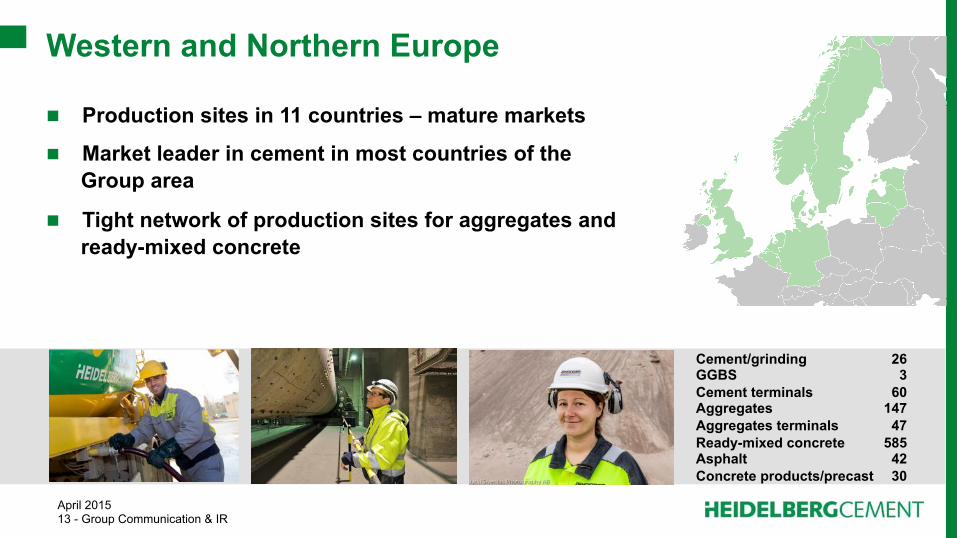
April 2015 13 - Group Communication & IR
Production sites in 11 countries – mature markets
Market leader in cement in most countries of the Group area
Tight network of production sites for aggregates and ready-mixed concrete
Western and Northern Europe
Cement/grinding 26 GGBS 3 Cement terminals 60 Aggregates 147 Aggregates terminals 47 Ready-mixed concrete 585 Asphalt 42 Concrete products/precast 30
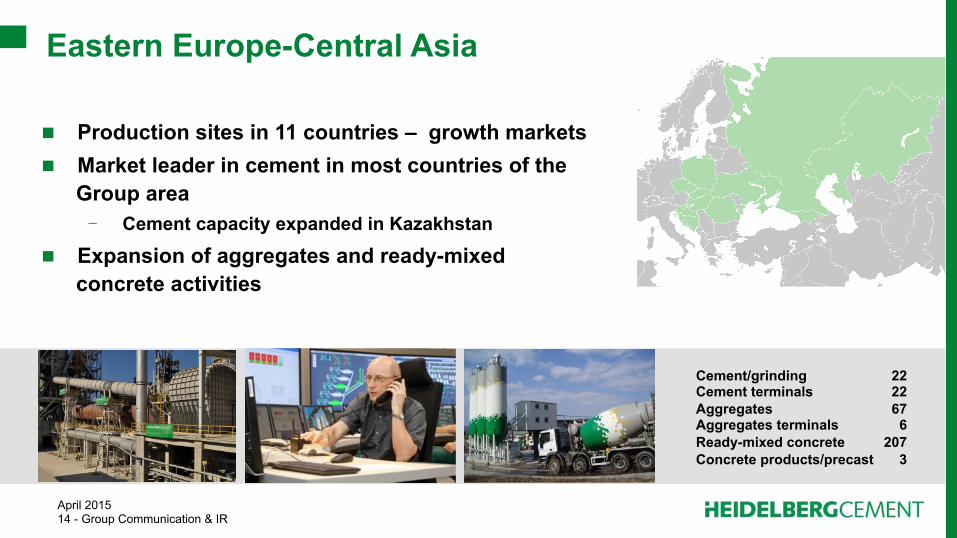
April 2015 14 - Group Communication & IR
Eastern Europe-Central Asia
Production sites in 11 countries – growth markets Market leader in cement in most countries of the
Group area - Cement capacity expanded in Kazakhstan
Expansion of aggregates and ready-mixed concrete activities
Cement/grinding 22 Cement terminals 22 Aggregates 67 Aggregates terminals 6 Ready-mixed concrete 207 Concrete products/precast 3
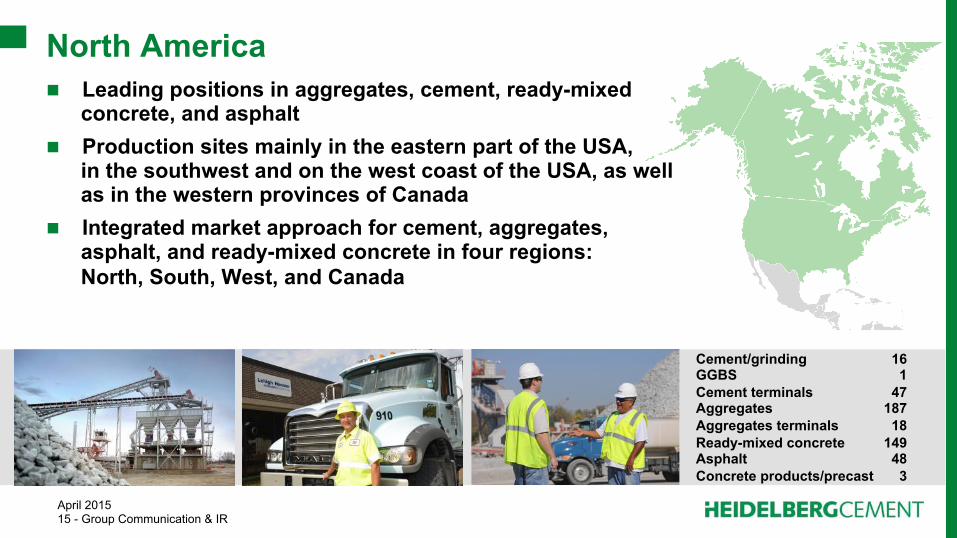
April 2015 15 - Group Communication & IR
Leading positions in aggregates, cement, ready-mixed concrete, and asphalt
Production sites mainly in the eastern part of the USA, in the southwest and on the west coast of the USA, as well as in the western provinces of Canada
Integrated market approach for cement, aggregates, asphalt, and ready-mixed concrete in four regions: North, South, West, and Canada
North America
Cement/grinding 16 GGBS 1 Cement terminals 47 Aggregates 187 Aggregates terminals 18 Ready-mixed concrete 149 Asphalt 48 Concrete products/precast 3
April 2015 16 - Group Communication & IR
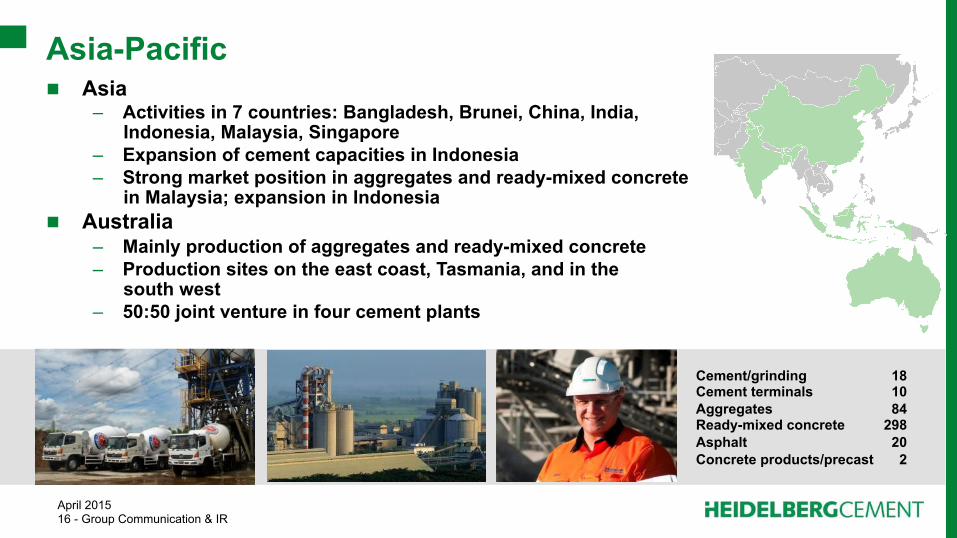
Asia – Activities in 7 countries: Bangladesh, Brunei, China, India,
Indonesia, Malaysia, Singapore – Expansion of cement capacities in Indonesia – Strong market position in aggregates and ready-mixed concrete
in Malaysia; expansion in Indonesia Australia
– Mainly production of aggregates and ready-mixed concrete – Production sites on the east coast, Tasmania, and in the
south west – 50:50 joint venture in four cement plants
Asia-Pacific
Cement/grinding 18 Cement terminals 10 Aggregates 84 Ready-mixed concrete 298 Asphalt 20 Concrete products/precast 2
April 2015 17 - Group Communication & IR
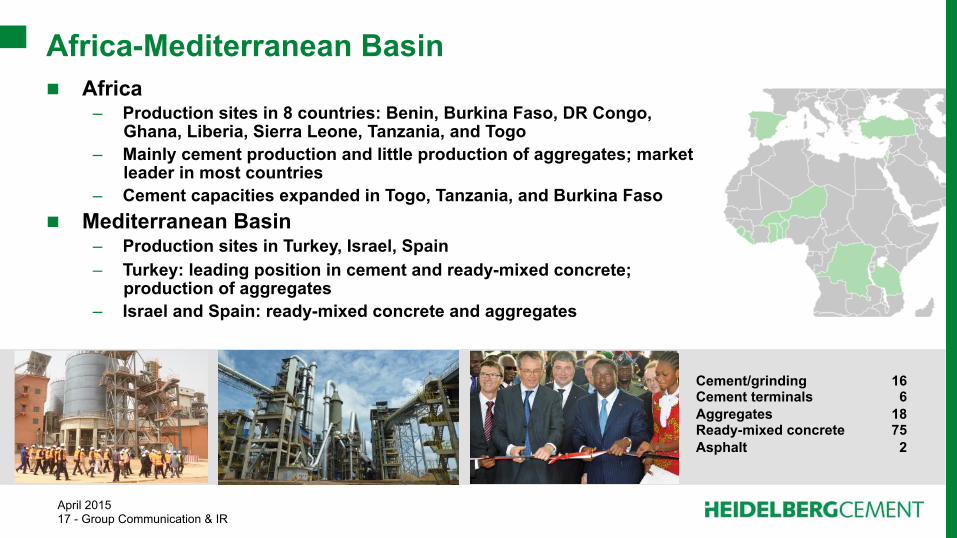
Africa-Mediterranean Basin Africa
– Production sites in 8 countries: Benin, Burkina Faso, DR Congo, Ghana, Liberia, Sierra Leone, Tanzania, and Togo
– Mainly cement production and little production of aggregates; market leader in most countries
– Cement capacities expanded in Togo, Tanzania, and Burkina Faso Mediterranean Basin
– Production sites in Turkey, Israel, Spain – Turkey: leading position in cement and ready-mixed concrete;
production of aggregates – Israel and Spain: ready-mixed concrete and aggregates
Cement/grinding 16 Cement terminals 6 Aggregates 18 Ready-mixed concrete 75 Asphalt 2
April 2015 18 - Group Communication & IR
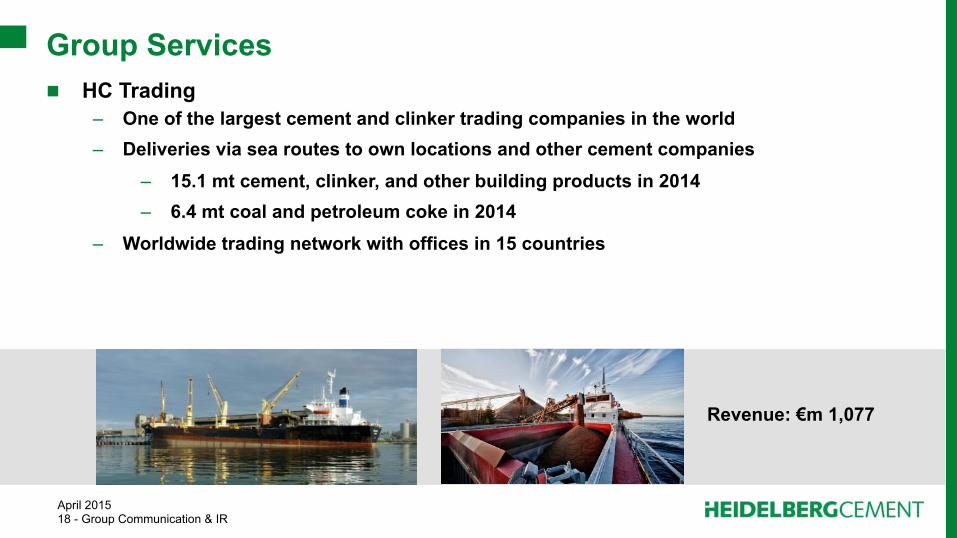
Revenue: €m 1,077
Group Services HC Trading
– One of the largest cement and clinker trading companies in the world – Deliveries via sea routes to own locations and other cement companies
– 15.1 mt cement, clinker, and other building products in 2014 – 6.4 mt coal and petroleum coke in 2014
– Worldwide trading network with offices in 15 countries
April 2015 19 - Group Communication & IR
Vancouver
San Francisco Los Angeles Dallas
Atlanta New York
Toronto
Chicago London Frankfurt
St. Petersburg Moscow
Istanbul Delhi
Mumbai Bangalore
Guangzhou Hong Kong
Singapore
Kuala Lumpur
Jakarta
Perth
Edmonton
Seattle
San Diego Houston
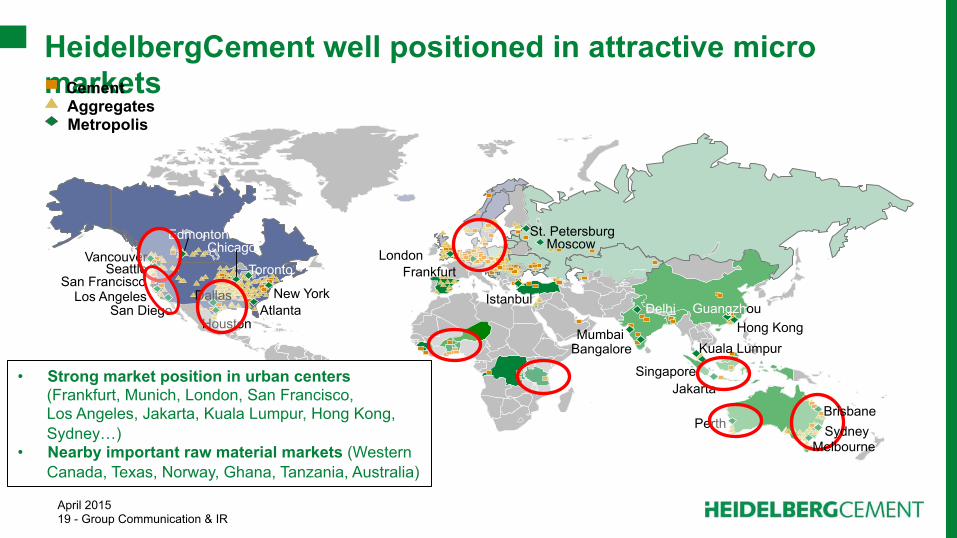
HeidelbergCement well positioned in attractive micro markets Cement
Aggregates Metropolis
• Strong market position in urban centers (Frankfurt, Munich, London, San Francisco, Los Angeles, Jakarta, Kuala Lumpur, Hong Kong, Sydney…)
• Nearby important raw material markets (Western Canada, Texas, Norway, Ghana, Tanzania, Australia)
Brisbane Sydney
Melbourne
April 2015 20 - Group Communication & IR
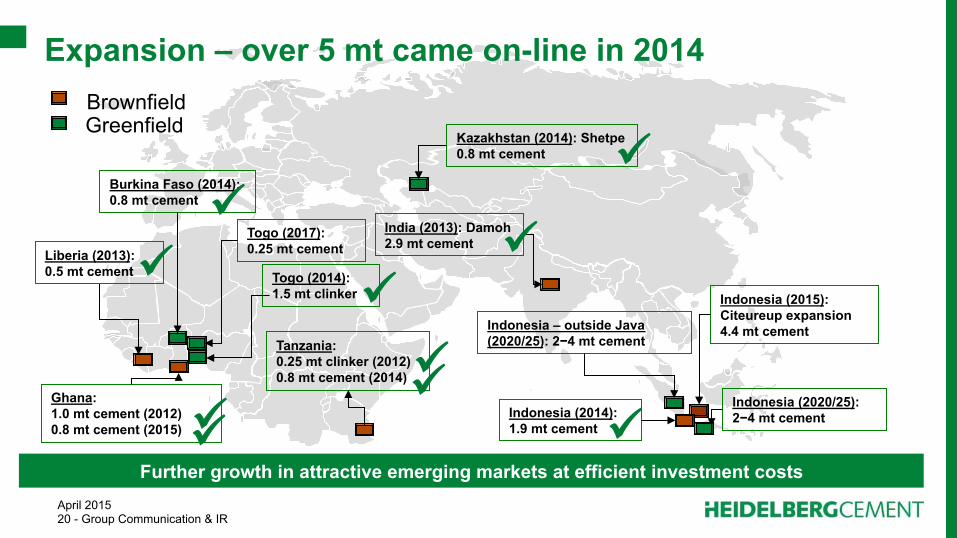
Kazakhstan (2014): Shetpe 0.8 mt cement
India (2013): Damoh 2.9 mt cement
Indonesia (2020/25): 2−4 mt cement
Brownfield Greenfield
Burkina Faso (2014): 0.8 mt cement
Ghana: 1.0 mt cement (2012) 0.8 mt cement (2015)
Indonesia – outside Java (2020/25): 2−4 mt cement
Indonesia (2015): Citeureup expansion 4.4 mt cement
Togo (2014): 1.5 mt clinker
Indonesia (2014): 1.9 mt cement
Togo (2017): 0.25 mt cement
Tanzania: 0.25 mt clinker (2012) 0.8 mt cement (2014) "
"
" "
Liberia (2013): 0.5 mt cement
Expansion – over 5 mt came on-line in 2014
Further growth in attractive emerging markets at efficient investment costs
"
"
"
"
"

April 2015 21 - Group Communication & IR
HeidelbergCement strategy Dual external growth strategy
– Cement in emerging markets – Aggregates and ready-mixed concrete in mature markets and North America
Focus on continuing increase in efficiency in all areas and cost leadership
Performance and result-oriented corporate culture Proximity to operating business Openness and fairness as soft factors of success
April 2015 22 - Group Communication & IR
Building on sustainability Economy
– Long-term prospects to everyone connected with our economic activities
Ecology – Climate protection, saving natural resources,
minimising environmental impacts Social responsibility towards our employees and
communities – Opportunities for personal and professional
development – Open dialogue with local communities – Involvement in numerous local social activities
April 2015 23 - Group Communication & IR
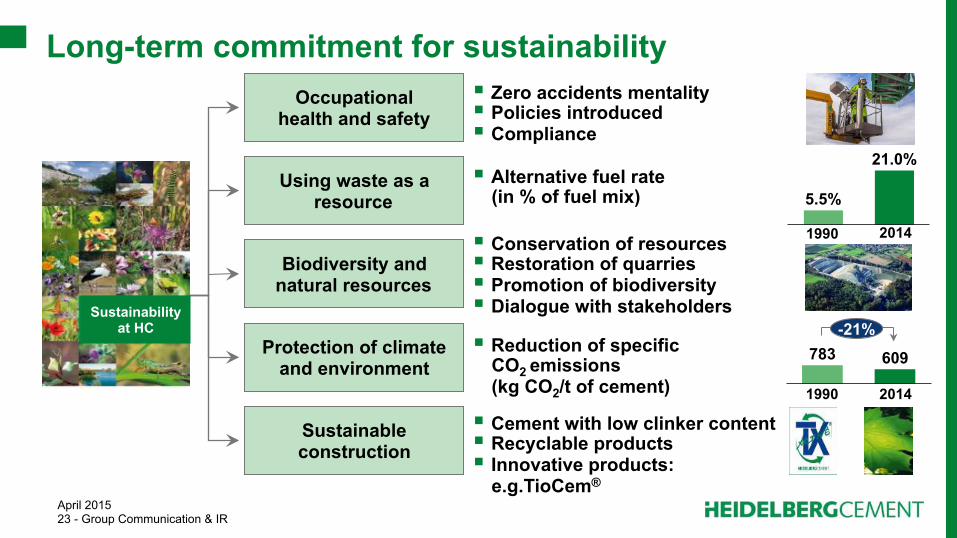
5.5%
21.0%
1990 2014
783 609
1990 2014
-21%
Biodiversity and natural resources
Alternative fuel rate (in % of fuel mix)
Cement with low clinker content Recyclable products Innovative products:
e.g.TioCem®
Occupational health and safety
Using waste as a resource
Protection of climate and environment
Sustainable construction
Zero accidents mentality Policies introduced Compliance
Conservation of resources Restoration of quarries Promotion of biodiversity Dialogue with stakeholders
Reduction of specific CO2 emissions (kg CO2/t of cement)
Long-term commitment for sustainability
Sustainability at HC
April 2015 24 - Group Communication & IR
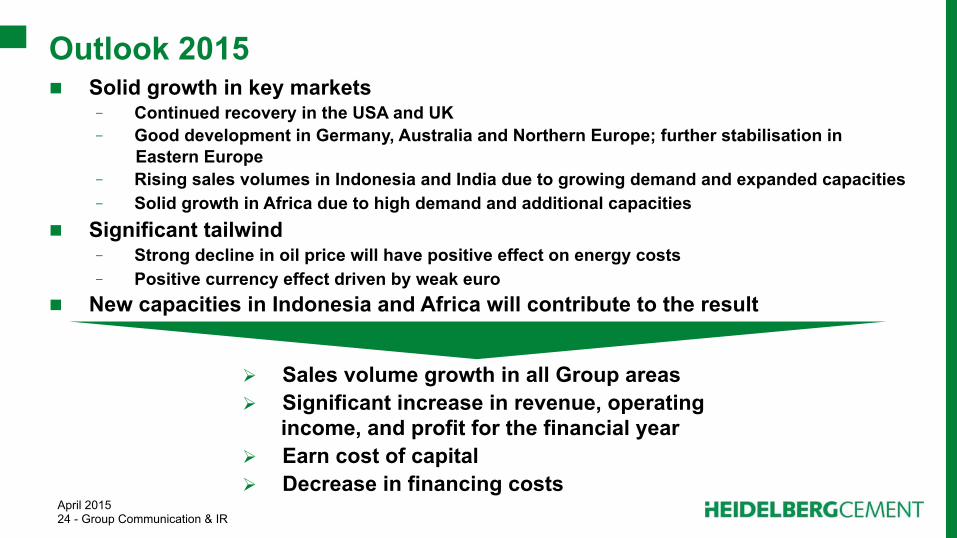
Solid growth in key markets - Continued recovery in the USA and UK - Good development in Germany, Australia and Northern Europe; further stabilisation in
Eastern Europe - Rising sales volumes in Indonesia and India due to growing demand and expanded capacities - Solid growth in Africa due to high demand and additional capacities
Significant tailwind - Strong decline in oil price will have positive effect on energy costs - Positive currency effect driven by weak euro
New capacities in Indonesia and Africa will contribute to the result
Outlook 2015
Sales volume growth in all Group areas Significant increase in revenue, operating
income, and profit for the financial year Earn cost of capital Decrease in financing costs
April 2015 25 - Group Communication & IR
Conclusion
HeidelbergCement is a company with
– excellent market position and attractive product portfolio
– strong corporate culture with strict focus on costs
HeidelbergCement focuses on increasing liquidity and deleveraging with the clear goal to return to investment grade
Disciplined investment policy: focus on emerging markets
HeidelbergCement is well positioned to benefit over-proportionally from economic recovery
April 2015 26 - Group Communication & IR
for better building