Embed Size (px)
Citation preview

Making Impact an
December Investor Presentation
December 9, 2016 Ameren Missouri underground grid reliability project in Downtown St. Louis
2
Cautionary Statements
Use of Non-GAAP Financial Measures
In this presentation, Ameren has presented core earnings, which is a non-GAAP measure and may not be comparable to those of other companies. A reconciliation of GAAP
to non-GAAP results is included either on the slide where the non-GAAP measure appears or on another slide referenced in this presentation. Generally, core earnings or
losses include earnings or losses attributable to Ameren common shareholders and exclude income or loss from discontinued operations and income or loss from significant
discrete items that management does not consider representative of ongoing earnings, such as the second quarter 2015 provision for discontinuing pursuit of a construction
and operating license for a second nuclear unit at the Callaway Energy Center. Ameren uses core earnings internally for financial planning and for analysis of performance.
Ameren also uses core earnings as the primary performance measurement when communicating with analysts and investors regarding our earnings results and outlook, as
the company believes that core earnings allow the company to more accurately compare its ongoing performance across periods. In providing core earnings guidance, there
could be differences between core earnings and earnings prepared in accordance with GAAP as a result of our treatment of certain items, such as those described above.
Ameren is unable to estimate the impact, if any, on GAAP earnings of any such future items.
Forward-looking Statements
Statements in this presentation not based on historical facts are considered "forward-looking" and, accordingly, involve risks and uncertainties that could cause actual results
to differ materially from those discussed. Although such forward-looking statements have been made in good faith and are based on reasonable assumptions, there is no
assurance that the expected results will be achieved. These statements include (without limitation) statements as to future expectations, beliefs, plans, strategies, objectives,
events, conditions, and financial performance. In connection with the "safe harbor" provisions of the Private Securities Litigation Reform Act of 1995, Ameren is providing this
cautionary statement to identify important factors that could cause actual results to differ materially from those anticipated. In addition to factors discussed in this
presentation, Ameren’s Annual Report on Form 10-K for the year ended December 31, 2015, and its other reports filed with the SEC under the Securities Exchange Act of
1934 contain a list of factors and a discussion of risks which could cause actual results to differ materially from management expectations suggested in such “forward-
looking” statements. All “forward-looking” statements included in this presentation are based upon information presently available, and Ameren, except to the extent required
by the federal securities laws, undertakes no obligation to update or revise publicly any “forward-looking” statements to reflect new information or current events.
Earnings Guidance and Growth Expectations
In this presentation, Ameren has presented 2016 earnings guidance that was issued and effective as of November 4, 2016, and growth expectations that were issued and
effective as of February 19, 2016. The 2016 earnings guidance assumes normal temperatures for the last three months of this year and is subject to the effects of, among
other things, changes in 30-year U.S. Treasury bond yields; regulatory, judicial and legislative actions; energy center and energy distribution operations; energy, economic,
capital and credit market conditions; severe storms; unusual or otherwise unexpected gains or losses; and other risks and uncertainties outlined, or referred to, in the
Forward-looking Statements section of this presentation and in Ameren’s periodic reports filed with the SEC.

3
Company Description
Fully rate-regulated electric and gas utility • 2.4 million electric and 0.9 million gas customers
• 10,200 MW of regulated electric generation capability
• 4,600 circuit miles of FERC-regulated electric transmission
• Electric generation, transmission and
distribution and gas distribution
business
• Serves 1.2 million electric and 0.1
million gas customers
• 10,200 MW of total generation capability
• Regulated by MoPSC
Ameren Missouri Ameren Illinois
• Electric and gas distribution business
regulated by ICC
• Serves 1.2 million electric and 0.8
million gas customers
• Electric transmission business
regulated by FERC
Electric Transmission
• ATXI invests in regional multi-value
projects
• Ameren Illinois invests in local
reliability projects
• Regulated by FERC
Ameren Corporation

4
Our Value Proposition to Investors
Strong long-term growth outlook
• Expect ~6.5% compound annual rate base growth from 2015 through 20201
– Sustainable infrastructure investment pipeline
• Expect 5% to 8% compound annual EPS growth from 2016 through 20201
– Based on Feb. 2016 adjusted 2016 EPS guidance of $2.632
Attractive dividend • Recently increased quarterly dividend to annualized equivalent rate of $1.76 per share
– Reflects confidence in long-term strategy
– Expect payout ratio to range between 55% to 70% of annual earnings
• Recently increased dividend rate provides 3.5%3 yield
– Above average yield compared to regulated utility peers
Attractive total return potential
• Superior combined earnings growth outlook and yield compared with regulated utility peers
• Committed to executing our strategy that we believe will deliver superior long-term value to
both customers and shareholders
1 Issued and effective as of Feb. 19, 2016 Earnings Conference Call. 2 Which was Feb. 19, 2016 guidance mid-point of $2.50 excluding then-
estimated $0.13 temporary net effect of lower sales to New Madrid smelter. 3 Based on Dec. 8, 2016 closing share price.

Solid Operating Performance
#
Average Residential Electricity Prices1
Electric rates are low Safety has improved Delivery system reliability
has improved Generating plant
performance remains strong
BE
TT
ER
BE
TT
ER
BE
TT
ER
BE
TT
ER
BE
TT
ER
0
50
100
150
0
200
400
600
Lo
st
Wo
rkd
ay
Cas
es
Rec
ord
ab
le C
as
es
Recordable Cases Lost Workday Away Cases
60
120
180
0.6
1.0
1.4
1.8
Ou
tag
e d
ura
tio
n
(min
.)
Ou
tag
e f
req
ue
nc
y
(ye
ar)
SAIFI SAIDI
0%
20%
40%
60%
80%
100%
Net Capacity Factor Equivalent Availability Factor
Distribution System Reliability2 Baseload Energy Center Performance
Safety Performance
5
1 Source: EEI Typical Bills and Average Rates Report for the twelve month period ending June 30, 2016. Includes major U.S. metropolitan areas for which EEI data is available. 2 As measured by System Average Interruption Frequency Index (SAIFI), which measures total number of interruptions per customer served and System Average Interruption
Duration Index (SAIDI), which measures the average outage duration for each customer served.
05
1015202530
¢/K
Wh
6
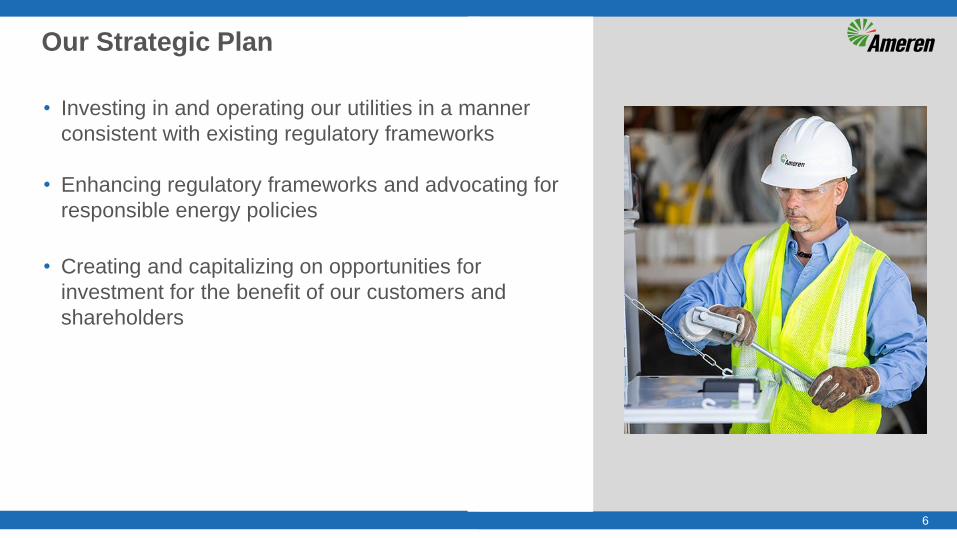
Our Strategic Plan
• Investing in and operating our utilities in a manner
consistent with existing regulatory frameworks
• Enhancing regulatory frameworks and advocating for
responsible energy policies
• Creating and capitalizing on opportunities for
investment for the benefit of our customers and
shareholders

7
Our Regulatory Frameworks1
FERC-regulated electric transmission service
• Formula ratemaking; nearly eliminates regulatory lag
– Current allowed ROE is 10.82%, which includes the 50 basis points adder for MISO participation
– Rates reset each Jan. 1 based on forward-looking calculation with annual reconciliation
– Constructive rate treatment for ATXI’s three MISO-approved multi-value projects, including construction
work in progress in rate base and 56% hypothetical equity ratio during development
Illinois electric delivery service
• Formula ratemaking currently extends through 2019; nearly eliminates regulatory lag
– Allowed ROE is 580 basis points above annual average yield of 30-year U.S. Treasury
– Provides recovery of prudently incurred actual costs; based on year-end rate base
Illinois gas delivery service
• Future test year ratemaking with infrastructure rider; minimizes regulatory lag
– Allowed ROE is 9.6%
– Volume balancing adjustment for residential and small nonresidential customers
Missouri electric service • Historical test year ratemaking; results in regulatory lag
– Allowed ROE is 9.53%
– Fuel adjustment clause recovery mechanism; pension and other postretirement benefits cost tracking
mechanism; constructive energy efficiency framework
1 See updates on pending developments for FERC on page 26, Illinois on page 12, and Missouri on pages 13 and 14.

Investing Strategically, Consistent with Regulatory Frameworks1
8
1 Issued and effective as of Feb. 19, 2016 Earnings Conference Call. 2 Reflects year-end rate base except for FERC-regulated transmission, which is average rate base. Includes
construction work in progress for ATXI multi-value projects. 3 Ameren Illinois and ATXI. Excludes Ameren Missouri transmission, which is included in bundled Missouri rates.
2015 to 2020E Regulated
Infrastructure Rate Base2
'15-'20E
20%
11%
6%
2%
~6.5%
5-Yr Rate
Base CAGR
Ameren Missouri
$4.1 B 37%
Ameren Illinois Gas
Delivery $1.4 B 13%
Ameren Illinois Electric Delivery $2.6 B 23%
Ameren Illinois
Transmission $2.0 B 18%
ATXI $1.0 B
9%
$11.1 Billion of Regulated Infrastructure
Investment 2016-2020
$7.1 $7.9
$2.4 $3.3 $1.2
$2.0 $12.1
$16.7
2015 2020E
($ B
illio
ns)
FERC-Regulated TransmissionAmeren Illinois Gas DeliveryAmeren Illinois Electric DeliveryAmeren Missouri
$3.5
$1.4
% of
Total
3
53%
41%
47% 59%
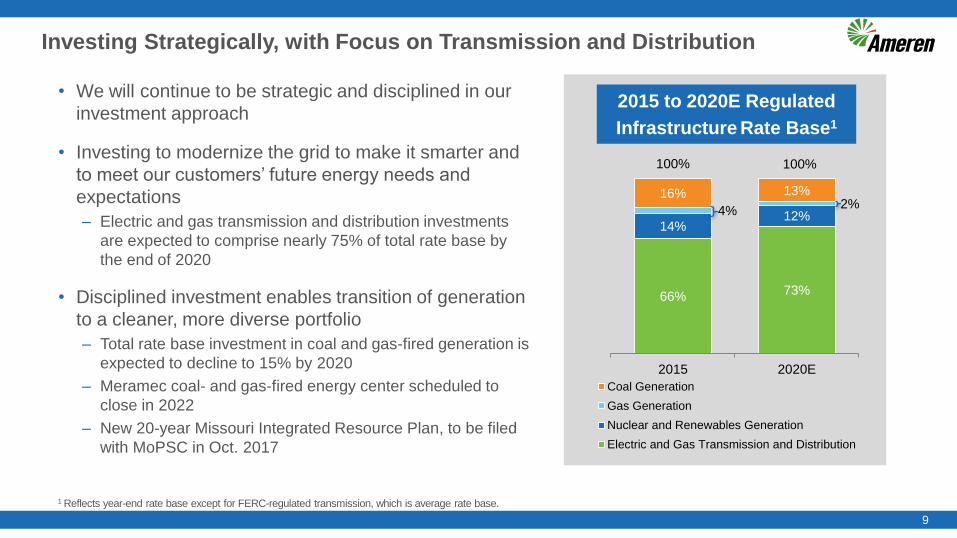
Investing Strategically, with Focus on Transmission and Distribution
9
2015 to 2020E Regulated
Infrastructure Rate Base1
66% 73%
14% 12% 4%
2% 16% 13%
100% 100%
2015 2020E
Coal Generation
Gas Generation
Nuclear and Renewables Generation
Electric and Gas Transmission and Distribution
• We will continue to be strategic and disciplined in our
investment approach
• Investing to modernize the grid to make it smarter and
to meet our customers’ future energy needs and
expectations
– Electric and gas transmission and distribution investments
are expected to comprise nearly 75% of total rate base by
the end of 2020
• Disciplined investment enables transition of generation
to a cleaner, more diverse portfolio
– Total rate base investment in coal and gas-fired generation is
expected to decline to 15% by 2020
– Meramec coal- and gas-fired energy center scheduled to
close in 2022
– New 20-year Missouri Integrated Resource Plan, to be filed
with MoPSC in Oct. 2017
1 Reflects year-end rate base except for FERC-regulated transmission, which is average rate base.

10 10
2016-2020 Capital Expenditure Funding Plan1
• Return of capital through depreciation in rates
• Retained earnings
• ~$2.5-$2.6 billion of income tax deferrals and assets
– Income tax deferrals driven primarily by capital expenditures
• ~$930 million due to extension of bonus tax depreciation
– Includes ~$680 million of tax assets at Sept. 30, 2016
• Net operating losses, tax credit carryforwards, expected tax refunds and state over-
payments
• Parent company portion of tax assets was ~$420 million
• Expected to be realized into 2021
• No equity issuances expected
• Debt financing
• Capitalization target: ~50% equity
1 Issued and effective as of Feb. 19, 2016 Earnings Conference Call unless otherwise noted.
11
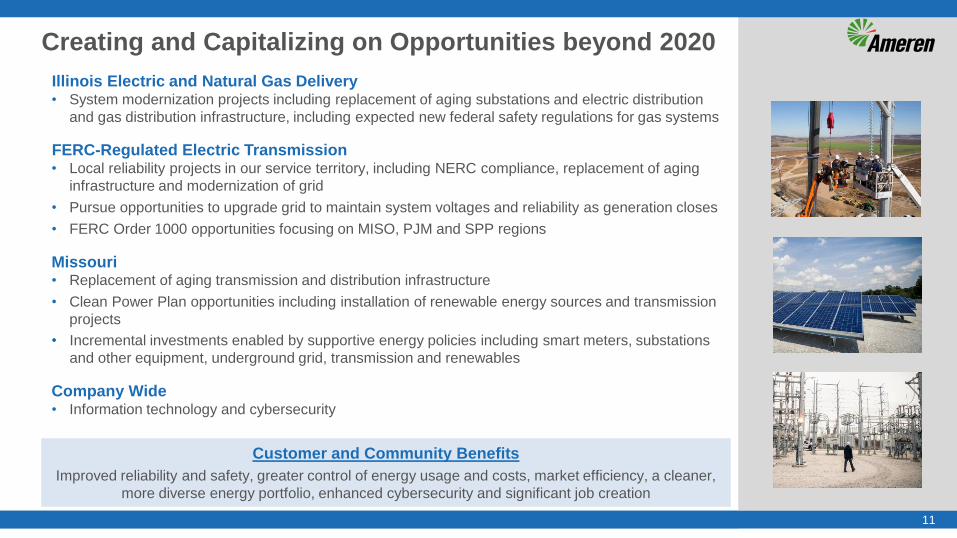
Creating and Capitalizing on Opportunities beyond 2020
Illinois Electric and Natural Gas Delivery • System modernization projects including replacement of aging substations and electric distribution
and gas distribution infrastructure, including expected new federal safety regulations for gas systems
FERC-Regulated Electric Transmission • Local reliability projects in our service territory, including NERC compliance, replacement of aging
infrastructure and modernization of grid
• Pursue opportunities to upgrade grid to maintain system voltages and reliability as generation closes
• FERC Order 1000 opportunities focusing on MISO, PJM and SPP regions
Missouri • Replacement of aging transmission and distribution infrastructure
• Clean Power Plan opportunities including installation of renewable energy sources and transmission
projects
• Incremental investments enabled by supportive energy policies including smart meters, substations
and other equipment, underground grid, transmission and renewables
Company Wide • Information technology and cybersecurity
Customer and Community Benefits
Improved reliability and safety, greater control of energy usage and costs, market efficiency, a cleaner,
more diverse energy portfolio, enhanced cybersecurity and significant job creation

12 12
• General Assembly passed Future Energy Jobs Bill, SB 2814, Dec. 1
– Governor Rauner signed bill on Dec. 7; becomes effective June 1, 2017
• Enhances and extends Ameren Illinois’ electric distribution framework
– Extends constructive formula ratemaking through 2022
• Enables continuation of Ameren Illinois’ strong rate base growth plan
– Allows capitalization of and ability to earn return on energy efficiency spend
• Previously expensed as incurred; expect spend to average ~$110 million/year
– Provides revenue decoupling
• Eliminates margin erosion due to, among other things, energy efficiency
• Ensures consistent ability to earn allowed return on equity
– Deems common equity ratio of up to and including 50% as prudent
Illinois Energy Legislation
Customer and Community Benefits Strong customer rate impact protections; enables greater investment, incl. in energy efficiency; creates
more reliable, smarter grid; retains cleaner energy sources; and preserves jobs

13
Efforts to Enhance Missouri Regulatory Framework
• MoPSC - opened case to consider policies to improve way it regulates electric utilities
– Ameren Missouri and other electric investor-owned utilities identified several approaches to enhance
regulatory framework to support investment
– In Sept. 23 filing, Ameren Missouri outlined potential incremental investments in detail
• $1 billion over five years ending 2022, with more than $4 billion over ten years
• Smart meters, aging substations and other equipment, underground grid, transmission and renewables
– In Oct. 17 report, MoPSC Staff stated it was not opposed to several approaches for supporting
targeted investments which would continue to include strong MoPSC oversight
– In Dec. 6 report, MoPSC stated it generally agreed with and supported the Oct. Staff report and
recommended General Assembly consider certain principles in drafting any legislation that encourages
utility investment in grid modernization
• Senate Interim Committee - evaluating ways to modernize utility regulatory process
– Public hearings provided forum for stakeholders and outside experts to provide perspectives
– Committee to issue report no later than Dec. 31, 2016
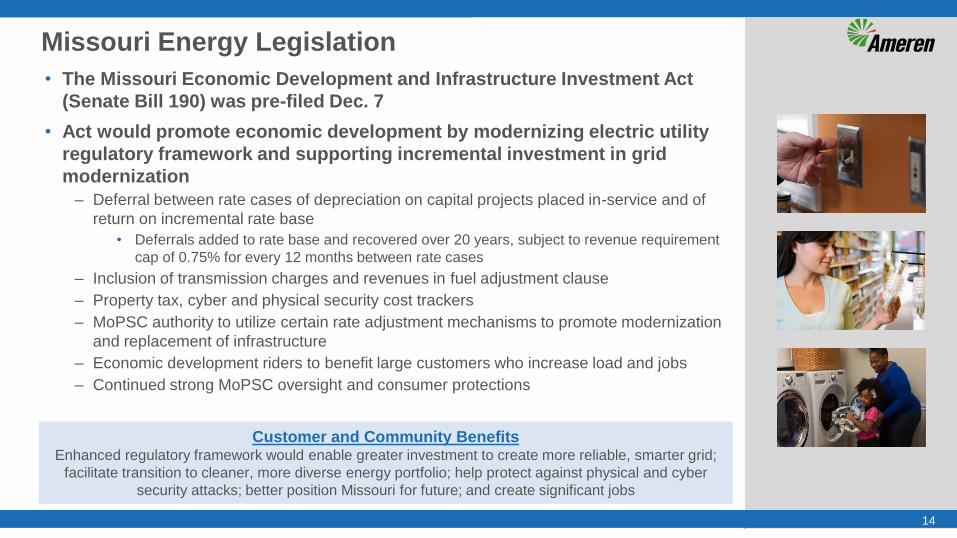
• The Missouri Economic Development and Infrastructure Investment Act
(Senate Bill 190) was pre-filed Dec. 7
– Would promote economic development by modernizing electric utility regulatory framework and
supporting incremental investment in grid modernization
Customer and Community Benefits
Enhanced regulatory framework would enable greater investment to create more reliable, smarter grid;
facilitate transition to cleaner, more diverse energy portfolio; help protect against physical and cyber security
attacks; better position Missouri for future; and create significant jobs
14 14
• The Missouri Economic Development and Infrastructure Investment Act
(Senate Bill 190) was pre-filed Dec. 7
• Act would promote economic development by modernizing electric utility
regulatory framework and supporting incremental investment in grid
modernization
– Deferral between rate cases of depreciation on capital projects placed in-service and of
return on incremental rate base
• Deferrals added to rate base and recovered over 20 years, subject to revenue requirement
cap of 0.75% for every 12 months between rate cases
– Inclusion of transmission charges and revenues in fuel adjustment clause
– Property tax, cyber and physical security cost trackers
– MoPSC authority to utilize certain rate adjustment mechanisms to promote modernization
and replacement of infrastructure
– Economic development riders to benefit large customers who increase load and jobs
– Continued strong MoPSC oversight and consumer protections
Missouri Energy Legislation
Customer and Community Benefits Enhanced regulatory framework would enable greater investment to create more reliable, smarter grid;
facilitate transition to cleaner, more diverse energy portfolio; help protect against physical and cyber
security attacks; better position Missouri for future; and create significant jobs
15
Select Regulatory Proceedings and Potential Tax Reform
Illinois electric delivery service
• On Dec. 6, the ICC approved a $14 million net annual decrease in electric delivery formula rates
effective Jan. 2017, in line with Ameren Illinois’ request
– Each year’s electric distribution service earnings are a function of the rate formula and are not directly determined
by that year’s rate update filing
Missouri electric service
• $206 million annual electric revenue increase request filed July 1 with MoPSC
– Includes recovery of, and return on, new infrastructure investments
– Removes prospectively the negative earnings effects of lower sales to New Madrid smelter
– Seeks implementation of a new transmission cost tracker
– MoPSC order expected in late Apr. 2017 with new rates effective in late May 2017
FERC-regulated electric transmission service
• Second MISO ROE complaint case seeks to reduce Ameren Illinois’ and ATXI’s transmission service
allowed base ROE, which is now 10.32%
– FERC final order on first complaint case adopted ALJ’s recommended 10.32% base ROE
– FERC final order on second complaint case expected in Q2 2017; ALJ recommended 9.70% base ROE
– Ameren Illinois and ATXI transmission service receive FERC-approved adder of up to 50 basis points to base
ROE for MISO participation, resulting in current FERC allowed ROE of 10.82%
Potential federal corporate tax reform
• Ameren working with utility industry to analyze and shape reform proposals
– Areas of focus include: tax rate, key deductions and return of excess deferred taxes to customers

16
Our Value Proposition to Investors
Strong long-term growth outlook
• Expect ~6.5% compound annual rate base growth from 2015 through 20201
– Sustainable infrastructure investment pipeline
• Expect 5% to 8% compound annual EPS growth from 2016 through 20201
– Based on Feb. 2016 adjusted 2016 EPS guidance of $2.632
Attractive dividend • Recently increased quarterly dividend to annualized equivalent rate of $1.76 per share
– Reflects confidence in long-term strategy
– Expect payout ratio to range between 55% to 70% of annual earnings
• Recently increased dividend rate provides 3.5%3 yield
– Above average yield compared to regulated utility peers
Attractive total return potential
• Superior combined earnings growth outlook and yield compared with regulated utility peers
• Committed to executing our strategy that we believe will deliver superior long-term value to
both customers and shareholders
1 Issued and effective as of Feb. 19, 2016 Earnings Conference Call. 2 Which was Feb. 19, 2016 guidance mid-point of $2.50 excluding then-
estimated $0.13 temporary net effect of lower sales to New Madrid smelter. 3 Based on Dec. 8, 2016 closing share price.

Financial Update
18
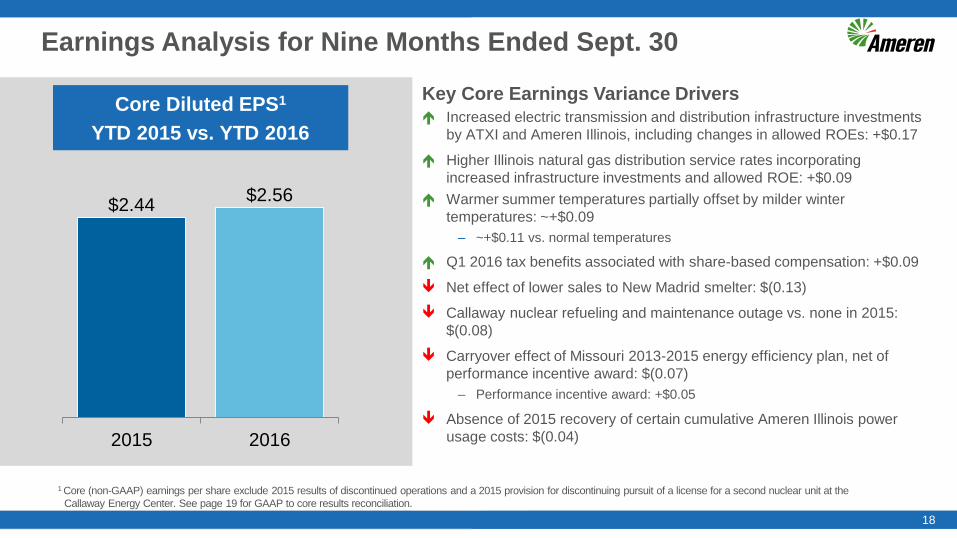
Earnings Analysis for Nine Months Ended Sept. 30
Key Core Earnings Variance Drivers
Increased electric transmission and distribution infrastructure investments
by ATXI and Ameren Illinois, including changes in allowed ROEs: +$0.17
Higher Illinois natural gas distribution service rates incorporating
increased infrastructure investments and allowed ROE: +$0.09
Warmer summer temperatures partially offset by milder winter
temperatures: ~+$0.09
– ~+$0.11 vs. normal temperatures
Q1 2016 tax benefits associated with share-based compensation: +$0.09
Net effect of lower sales to New Madrid smelter: $(0.13)
Callaway nuclear refueling and maintenance outage vs. none in 2015:
$(0.08)
Carryover effect of Missouri 2013-2015 energy efficiency plan, net of
performance incentive award: $(0.07)
– Performance incentive award: +$0.05
Absence of 2015 recovery of certain cumulative Ameren Illinois power
usage costs: $(0.04)
Core Diluted EPS1
YTD 2015 vs. YTD 2016
$2.44 $2.56
2015 2016
1 Core (non-GAAP) earnings per share exclude 2015 results of discontinued operations and a 2015 provision for discontinuing pursuit of a license for a second nuclear unit at the
Callaway Energy Center. See page 19 for GAAP to core results reconciliation.

19
GAAP to Core Earnings Reconciliation
(In millions, except per share
amounts)
Nine Months Ended Sept. 30,
2015 2016
GAAP Earnings / Diluted EPS $ 601 $ 2.47 $ 621 $ 2.56
Results from discontinued operations
Operating income before income tax (3) (0.01) — —
Income tax benefit (49) (0.20) — —
Income from discontinued operations, net of taxes (52) (0.21) — —
Provision for discontinuing pursuit of license for
second nuclear unit at Callaway Energy Center
Provision before income tax 69 0.29 — —
Income tax expense (26) (0.11) — —
Provision, net of taxes 43 0.18 — —
Core Earnings / Diluted EPS $ 592 $ 2.44 $ 621 $ 2.56
20
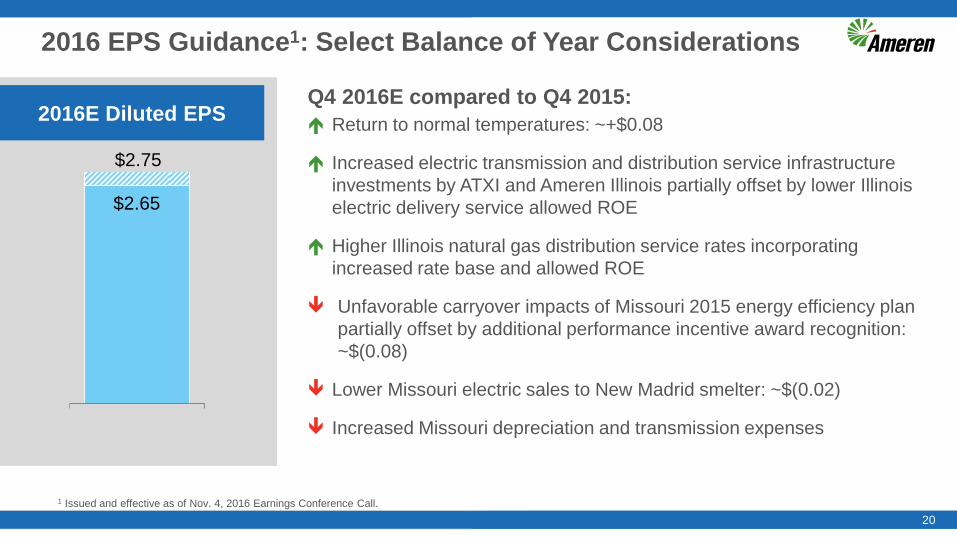
2016 EPS Guidance1: Select Balance of Year Considerations
Q4 2016E compared to Q4 2015:
Return to normal temperatures: ~+$0.08
Increased electric transmission and distribution service infrastructure
investments by ATXI and Ameren Illinois partially offset by lower Illinois
electric delivery service allowed ROE
Higher Illinois natural gas distribution service rates incorporating
increased rate base and allowed ROE
Unfavorable carryover impacts of Missouri 2015 energy efficiency plan
partially offset by additional performance incentive award recognition:
~$(0.08)
Lower Missouri electric sales to New Madrid smelter: ~$(0.02)
Increased Missouri depreciation and transmission expenses
2016E Diluted EPS
$2.65
$2.75
1 Issued and effective as of Nov. 4, 2016 Earnings Conference Call.

21
Select 2017 Earnings Considerations1
1 Issued and effective as of Nov. 4, 2016 Earnings Conference Call. 2 Estimated FERC-regulated average rate base for Ameren Illinois and ATXI are $1.4 billion and $1.1 billion for
2017, respectively, compared to $1.2 billion and $0.9 billion for 2016, respectively.
FERC-Regulated
Electric Transmission
Higher average estimated rate base: ~$2.52 billion compared to estimated ~$2.12 billion in 2016
reflecting infrastructure investments made under formula ratemaking • Expect lower projected weighted average allowed ROE vs. 2016
Ameren Illinois
Electric and Gas
Delivery
Higher year-end rate base for electric delivery reflecting infrastructure investments made under
formula ratemaking • Allowed ROE will be 2017 average 30-year Treasury yield plus 5.8%
Gas distribution infrastructure investments qualifying for rider treatment
Ameren Missouri
Increased electric service rates expected in late May 2017 • Reflecting new infrastructure investments, as well as more recent sales and cost levels
• Removal of negative effect of lower sales to New Madrid smelter: ~+$0.12
Increased depreciation, transmission and property tax expenses
Absence of 2016 performance incentive award related to 2013-2015 energy efficiency plan: $(0.07) ▬ Callaway refueling and maintenance outage scheduled for fall 2017 vs. spring 2016
Parent and Other Lower tax benefits associated with share-based compensation
Return to normal temperatures:
~($0.11) through Sept. 30, 2016

Appendix

Significant FERC-Regulated Transmission Investment
Planned $3.0 billion investment – 2016-20201
• $1.0 billion of regional multi-value projects at ATXI
• $2.0 billion of local reliability and connecting portions of regional multi-
value projects at Ameren Illinois
Total Multi-Value Project Costs2
• Illinois Rivers Project - $1.4 billion
– ATXI ~$1.3 billion; Ameren Illinois ~$100 million
– Under construction; expect to complete in 2019
• Spoon River Project - $150 million
– ATXI ~$145 million; Ameren Illinois ~$5 million
– ICC issued CPCN in Sept. 2015; line clearing has begun and significant line
construction expected to begin in Jan. 2017 with completion in 2018
• Mark Twain Project - $225 million
– 100% ATXI project
• CCN for Mark Twain approved by MoPSC; pursuing county assents for
road crossings
– Anticipate construction to begin in 2017 with completion in 2018/2019
Regional
Multi-Value Projects
23
1 Issued and effective as of Feb. 19, 2016 Earnings Conference Call. 2 Includes pre-2016 expenditures.

24
Pending 2016 Missouri Electric Rate Case Filing
PROCEDURAL SCHEDULE
KEY DATES:
Dec. 9, 2016 Revenue requirement testimony
of MoPSC Staff and intervenors
due
Feb. 24, 2017 MoPSC Staff reconciliation of
parties’ positions due
Feb. 27, 2017 Evidentiary hearings begin
Late April 2017 MoPSC order expected
May 28, 2017 New rates effective by this date
• $206 million annual electric revenue increase request filed July 1, 2016
with MoPSC, which would result in an average 7.8% increase in base
rates
– ROE: 9.9% vs. 9.53% in April 2015 order
– Equity ratio: 51.8% (Dec. 31, 2016 estimate) vs. same ratio in April 2015 order
– Rate base: $7.2 billion (Dec. 31, 2016 estimate) vs. $7.0 billion in April 2015 order
– Test year ended Mar. 31, 2016, with certain pro-forma adjustments through Dec. 31,
20161
• Continuation of fuel adjustment clause
– Continued 95%/5% sharing of variances from net energy costs included in base rates
• Cost tracking mechanisms
– Continuation of pension and OPEB tracker
– Continuation of uncertain income tax positions tracker
– Implementation of a new transmission tracker
1 Through Jan. 1, 2017 for fuel, transportation, MISO multi-value transmission project expenses and payroll costs.

25 25
Pending 2016 Missouri Electric Rate Case Filing, cont’d
• Key drivers of requested $206 million annual revenue increase
– New electric infrastructure investments: +$74 million
• Depreciation: $39 million; return on rate base: $25 million; and property taxes1: $10 million
– Reduced customer sales, less related net energy costs2: +$51 million
• Removes prospectively the negative earnings effects of lower sales to New Madrid smelter
– Recovery of increased transmission expenses: +$34 million
• Includes Jan. 1, 2017 rates for MISO multi-value projects
– Changes to tracked pension/OPEB and solar rebate expenses: $(24) million and
$(15) million, respectively
– Increased net energy costs, excluding reduced New Madrid smelter and other sales:
+$23 million
– Increased income taxes: +$15 million
– Amortization over 10 years of estimated $81 million of lost fixed costs due to lower sales
to New Madrid smelter: +$8 million
– Other, net - largely to recover increased expenses: +$40 million
1 On new investments and from higher property tax rates. 2 Net energy costs, as defined in the FAC, include fuel and purchased power costs, including transportation but excluding transmission
revenues and substantially all transmission charges, net of off-system sales revenues.
26 26
• Cases sought to reduce Ameren Illinois’ and ATXI’s transmission service allowed
base ROE
– In first case, FERC final order issued Sept. 28, 2016 confirmed ALJ initial
recommendation of a 10.32% base ROE
• Maximum ROE including incentives not to exceed 11.35%
– In second case, ALJ initial decision issued June 30, 2016 recommended a 9.70%
base ROE
• FERC final order expected in Q2 2017
• Reserve for potential refunds
• FERC approved adder of up to 50 basis points to base ROE, effective Jan. 6, 2015,
for MISO participation
– Subject to “zone of reasonableness”
– Results in current FERC allowed ROE of 10.82%
FERC MISO Complaint Cases Regarding MISO base ROE

27
Select Regulatory and Legislative Matters
Illinois Commerce Commission • Electric distribution rate update: Docket No. 16-0262
• Website: http://www.icc.illinois.gov
Missouri General Assembly / Missouri Public Service Commission • Senate Bill 190: http://www.senate.mo.gov/17info/BTS_Web/Bill.aspx?SessionType=R&BillID=57121066
• 2016 electric rate case: Docket No. ER-2016-0179
• Order granting CCN for ATXI’s Mark Twain transmission project: Docket No. EA-2015-0146
• Working case to consider policies to improve electric utility regulation: Docket No. EW-2016-0313
• Website: https://www.efis.psc.mo.gov/mpsc/DocketSheet.html
Federal Energy Regulatory Commission • Complaint challenging MISO base ROE: Docket No. EL15-45
• Website: http://elibrary.ferc.gov/idmws/search/fercadvsearch.asp
Other Filings • Ameren Illinois & ATXI 2016 Projected Attachment O: http://www.oasis.oati.com/AMRN/. Includes effect of
Dec. 2015 federal legislation extending bonus tax depreciation.

Investor Relations Calendar
DECEMBER 2016
SUN. MON. TUES. WED. THUR. FRI. SAT.
1 2 3
4 5 6 7 8 9 10
Wolfe
Investor Meeting
11 12 13 14 15 16 17
Barclays
Utilities Conf.
18 19 20 21 22 23 24
25 26 27 28 29 30 31
• Jan 12 Evercore ISI Utility Conference
• Jan 14 Q4 quiet period begins
28
• Dec. 7 Wolfe Investor Meeting
• Dec. 13 Barclays Colorado Utilities
Conference
JANUARY 2017
SUN. MON. TUES. WED. THUR. FRI. SAT.
1 2 3 4 5 6 7
8 9 10 11 12 13 14
Evercore
ISI Utility Conf.
Q4 Quiet
Period
begins
15 16 17 18 19 20 21
22 23 24 25 26 27 28
29 30 31
29
Glossary of Terms and Abbreviations
ALJ – Administrative Law Judge.
AMI – Automated Meter Infrastructure.
ATXI – Ameren Transmission Company of Illinois.
B – Billion.
CAGR – Compound annual growth rate.
CCN – Certificate of Convenience and Necessity.
Core – (Non-GAAP) earnings exclude income or loss from
discontinued operations and income or loss from significant
discrete items that management does not consider
representative of ongoing earnings. See page 19 for GAAP to
core results reconciliations for the nine months ended
September 30, 2015.
CPCN – Certificate of Public Convenience and Necessity.
E – Estimated.
EPS – Earnings per share.
FAC – Fuel adjustment clause.
FERC – Federal Energy Regulatory Commission.
GAAP – Generally Accepted Accounting Principles.
ICC – Illinois Commerce Commission.
M – Million.
MISO – Midcontinent Independent System Operator, Inc.
MoPSC – Missouri Public Service Commission.
MWh – Megawatthour.
NERC – North American Electricity Reliability Corporation.
New Madrid smelter – New Madrid, Missouri aluminum smelter,
(formerly owned by Noranda).
Noranda – Noranda Aluminum, Inc.
OPEB – Other Post-Employment Benefits.
PJM – PJM Interconnection.
ROE – Return on Equity.
SEC – U.S. Securities and Exchange Commission.
SPP – Southwest Power Pool.