Embed Size (px)
Citation preview
Corporate PresentationJanuary 2017
Cautionary statements
2
ALL AMOUNTS IN U.S. DOLLARS UNLESS OTHERWISE STATED
CAUTIONARY NOTE REGARDING FORWARD-LOOKING STATEMENTSCertain information contained in this presentation, including any information relating to New Gold’s future financial or operating performance are “forward looking”. All statements in thispresentation, other than statements of historical fact, which address events, results, outcomes or developments that New Gold expects to occur are “forward-looking statements”.Forward-looking statements are statements that are not historical facts and are generally, but not always, identified by the use of forward-looking terminology such as “plans”, “expects”,“is expected”, “budget”, “scheduled”, “targeted”, “estimates”, “forecasts”, “intends”, “anticipates”, “projects”, “potential”, “believes” or variations of such words and phrases or statementsthat certain actions, events or results “may”, “could”, “would”, “should”, “might” or “will be taken”, “occur” or “be achieved” or the negative connotation of such terms. Forward-lookingstatements in this presentation include, among others, statements with respect to: guidance for production; mineral reserve and resource estimates; planned design for the Rainy Riverproject; construction activities at the Rainy River project and their expected progress and timelines, including the timing for, and duration of, underground development and its impact andtiming for power energization; expected capital costs and contingency amounts and timing for incurring costs in the future; planned preparations for operations, including the mining rate,removal of overburden and waste and storage of water prior to commissioning and availability of ore; the expected production, costs, economics, grade, mining and milling rate, stripratio, milling and mill feed schedule, recovery rates and mine life and other operating parameters of the Rainy River project; planned staffing levels; future exploration activities andexploration potential; the capacity of the starter dam; targeted timing for permits; targeted timing for commissioning, start-up, production and ramp-up; statements with respect to thecompany’s future compliance with its leverage ratio covenants; statements regarding future free cash flow and after-tax cash flow; and statements with respect to the payment of theremaining $75 million from Royal Gold and the percentage of future revenue represented by the total payments from Royal Gold.
All forward-looking statements in this presentation are based on the opinions and estimates of management as of the date such statements are made and are subject to important riskfactors and uncertainties, many of which are beyond New Gold’s ability to control or predict. Certain material assumptions regarding such forward-looking statements are discussed in thispresentation, New Gold’s annual and quarterly management’s discussion and analysis (“MD&A”), its Annual Information Form and its Technical Reports filed at www.sedar.com. Inaddition to, and subject to, such assumptions discussed in more detail elsewhere, the forward-looking statements in this presentation are also subject to the following assumptions: (1)there being no significant disruptions affecting New Gold’s operations; (2) political and legal developments in jurisdictions where New Gold operates being consistent with New Gold’scurrent expectations; (3) the accuracy of New Gold’s current mineral reserve and mineral resource estimates; (4) the exchange rate between the Canadian dollar and U.S. dollar beingapproximately consistent with current levels; (5) prices for diesel, natural gas, fuel oil, electricity and other key supplies being approximately consistent with current levels; (6) equipment,labour and materials costs increasing on a basis consistent with New Gold’s current expectations; (7) arrangements with Indigenous groups in respect of the Rainy River project beingconsistent with New Gold’s current expectations; (8) all required permits, licenses and authorizations being obtained from the relevant governments and other relevant stakeholders withinthe expected timelines; (9) the results of the feasibility study for the Rainy River project being realized; (10) conditions to the payment of the remaining $75 million from Royal Gold beingsatisfied later in 2016; and (11) with respect to guidance for 2016 AISC, refer to “2016 Guidance” in New Gold’s news release dated February 17, 2016 for the key assumptions.
Forward-looking statements are necessarily based on estimates and assumptions that are inherently subject to known and unknown risks, uncertainties and other factors that may causeactual results, level of activity, performance or achievements to be materially different from those expressed or implied by such forward-looking statements. Such factors include, withoutlimitation: significant capital requirements and the availability and management of capital resources; additional funding requirements; price volatility in the spot and forward markets formetals and other commodities; fluctuations in the international currency markets and in the rates of exchange of the currencies of Canada and the United States; discrepancies betweenactual and estimated production, between actual and estimated mineral reserves and mineral resources and between actual and estimated metallurgical recoveries; changes in nationaland local government legislation; taxation; controls, regulations and political or economic developments in the countries in which New Gold does or may carry on business; thespeculative nature of mineral exploration and development, including the risks of obtaining and maintaining the validity and enforceability of the necessary licenses and permits andcomplying with the permitting requirements of each jurisdiction in which New Gold operates, including, but not limited to: in Canada, obtaining the necessary permits for the Rainy Riverproject; the uncertainties inherent to current and future legal challenges New Gold is or may become a party to; diminishing quantities or grades of reserves and resources; competition;loss of key employees; rising costs of labour, supplies, fuel and equipment; actual results of current exploration or reclamation activities; uncertainties inherent to mining economic studiesincluding the feasibility study for the Rainy River project; changes in project parameters as plans continue to be refined; accidents; labour disputes; defective title to mineral claims orproperty or contests over claims to mineral properties; unexpected delays and costs inherent to consulting and accommodating rights of Indigenous groups; risks, uncertainties andunanticipated delays associated with obtaining and maintaining necessary licenses, permits and authorizations and complying with permitting requirements. In addition, there are risksand hazards associated with the business of mineral exploration, development and mining, including environmental events and hazards, industrial accidents, unusual or unexpectedformations, pressures, cave-ins, flooding and gold bullion losses (and the risk of inadequate insurance or inability to obtain insurance to cover these risks) as well as “Risk Factors”included in New Gold’s disclosure documents filed on and available at www.sedar.com. Forward-looking statements are not guarantees of future performance, and actual results andfuture events could materially differ from those anticipated in such statements. All of the forward-looking statements contained in this presentation are qualified by these cautionarystatements. New Gold expressly disclaims any intention or obligation to update or revise any forward-looking statements whether as a result of new information, events or otherwise,except in accordance with applicable securities laws.
The footnotes, endnotes and appendix to this presentation contain important information. The endnotes and appendix are found at the end of the presentation.
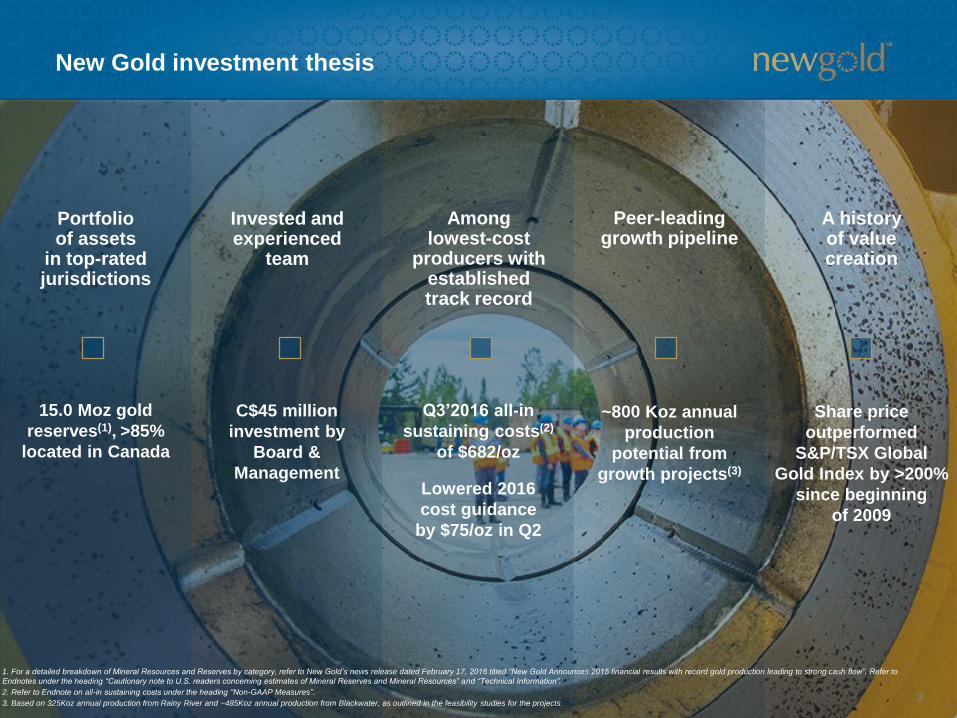
Portfolio of assets
in top-ratedjurisdictions
Invested and experienced
team
Amonglowest-cost
producers with established track record
Peer-leading growth pipeline
A history of value creation
New Gold investment thesis
15.0 Moz gold
reserves(1), >85%
located in Canada
C$45 million
investment by
Board &
Management
Q3’2016 all-in
sustaining costs(2)
of $682/oz
Lowered 2016
cost guidance
by $75/oz in Q2
~800 Koz annual
production
potential from
growth projects(3)
Share price
outperformed
S&P/TSX Global
Gold Index by >200%
since beginning
of 2009
1. For a detailed breakdown of Mineral Resources and Reserves by category, refer to New Gold’s news release dated February 17, 2016 titled “New Gold Announces 2015 financial results with record gold production leading to strong cash flow”. Refer to
Endnotes under the heading “Cautionary note to U.S. readers concerning estimates of Mineral Reserves and Mineral Resources” and “Technical Information”.
2. Refer to Endnote on all-in sustaining costs under the heading “Non-GAAP Measures”.
3. Based on 325Koz annual production from Rainy River and ~485Koz annual production from Blackwater, as outlined in the feasibility studies for the projects.3
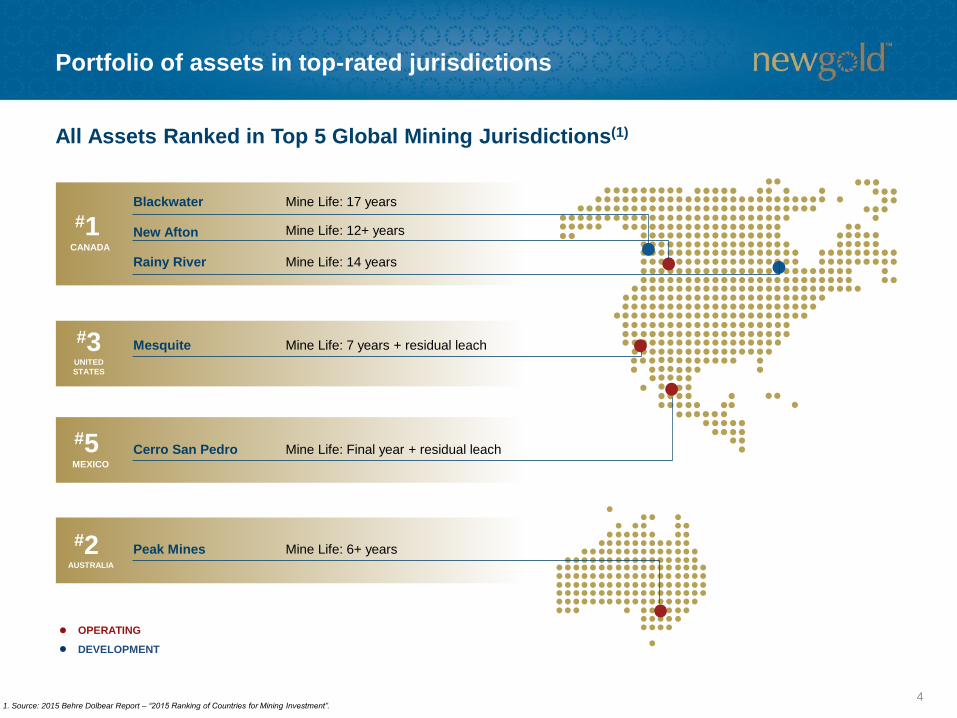
Portfolio of assets in top-rated jurisdictions
41. Source: 2015 Behre Dolbear Report – “2015 Ranking of Countries for Mining Investment”.
Blackwater
New Afton
Rainy River
Mesquite
Cerro San Pedro
Peak Mines
Mine Life: 17 years
Mine Life: 12+ years
Mine Life: 14 years
Mine Life: 7 years + residual leach
Mine Life: Final year + residual leach
Mine Life: 6+ years
#1CANADA
#3UNITED
STATES
#5MEXICO
#2AUSTRALIA
OPERATING
DEVELOPMENT
All Assets Ranked in Top 5 Global Mining Jurisdictions(1)Mineral Reserves(2)
5
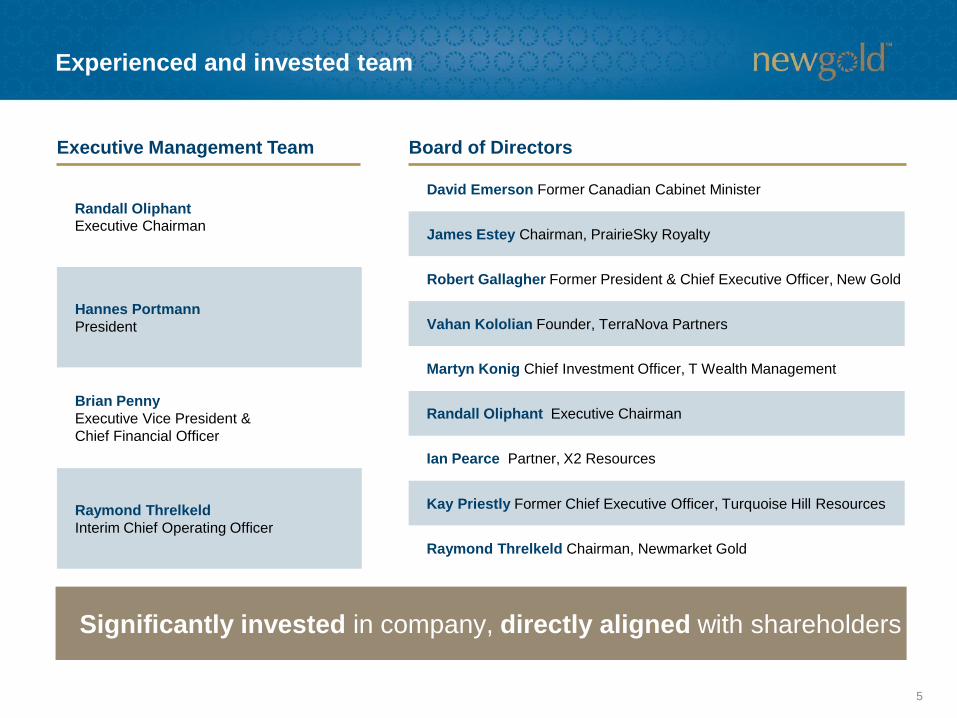
Experienced and invested team
David Emerson Former Canadian Cabinet Minister
James Estey Chairman, PrairieSky Royalty
Robert Gallagher Former President & Chief Executive Officer, New Gold
Vahan Kololian Founder, TerraNova Partners
Martyn Konig Chief Investment Officer, T Wealth Management
Randall Oliphant Executive Chairman
Ian Pearce Partner, X2 Resources
Kay Priestly Former Chief Executive Officer, Turquoise Hill Resources
Raymond Threlkeld Chairman, Newmarket Gold
Randall Oliphant
Executive Chairman
Hannes Portmann
President
Brian Penny
Executive Vice President &
Chief Financial Officer
Raymond Threlkeld
Interim Chief Operating Officer
Executive Management Team Board of Directors
Significantly invested in company, directly aligned with shareholders
6
GOLD
PRODUCTION (Koz)
COPPER
PRODUCTION (Mlbs)
TOTAL CASH
COSTS(1) ($/oz)
ALL-IN SUSTAINING
COSTS(2) ($/oz)
SILVER
PRODUCTION (Moz)
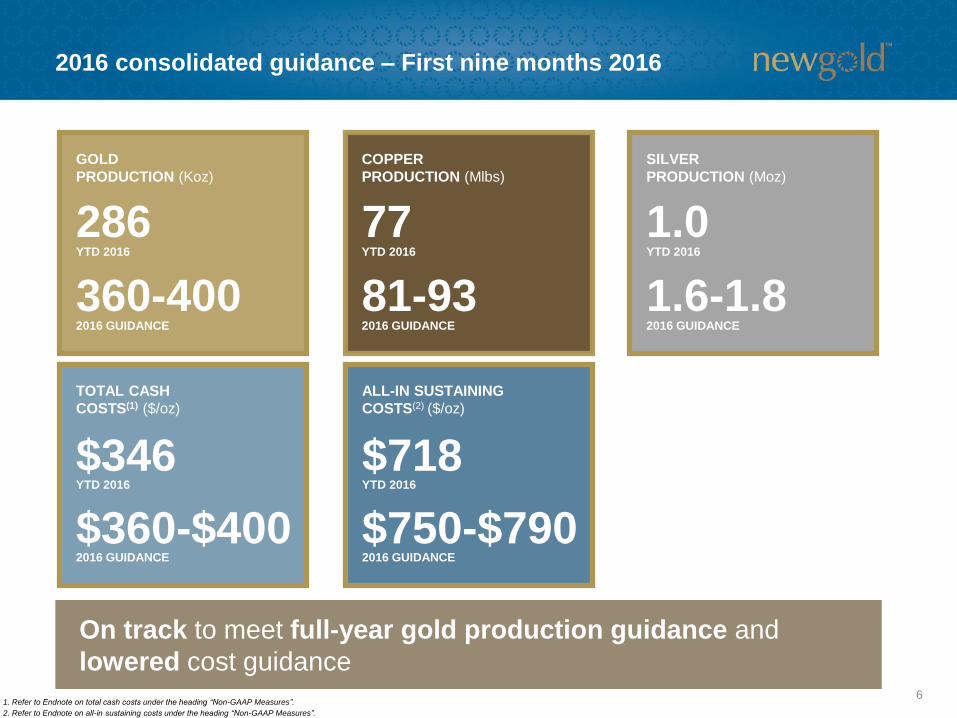
2016 consolidated guidance – First nine months 2016
On track to meet full-year gold production guidance and
lowered cost guidance
286
360-400
YTD 2016
2016 GUIDANCE
77
81-93
YTD 2016
2016 GUIDANCE
1.0
1.6-1.8
YTD 2016
2016 GUIDANCE
$346
$360-$400
$718
$750-$790
YTD 2016
2016 GUIDANCE
YTD 2016
2016 GUIDANCE
1. Refer to Endnote on total cash costs under the heading “Non-GAAP Measures”.
2. Refer to Endnote on all-in sustaining costs under the heading “Non-GAAP Measures”.
$105
$136
7
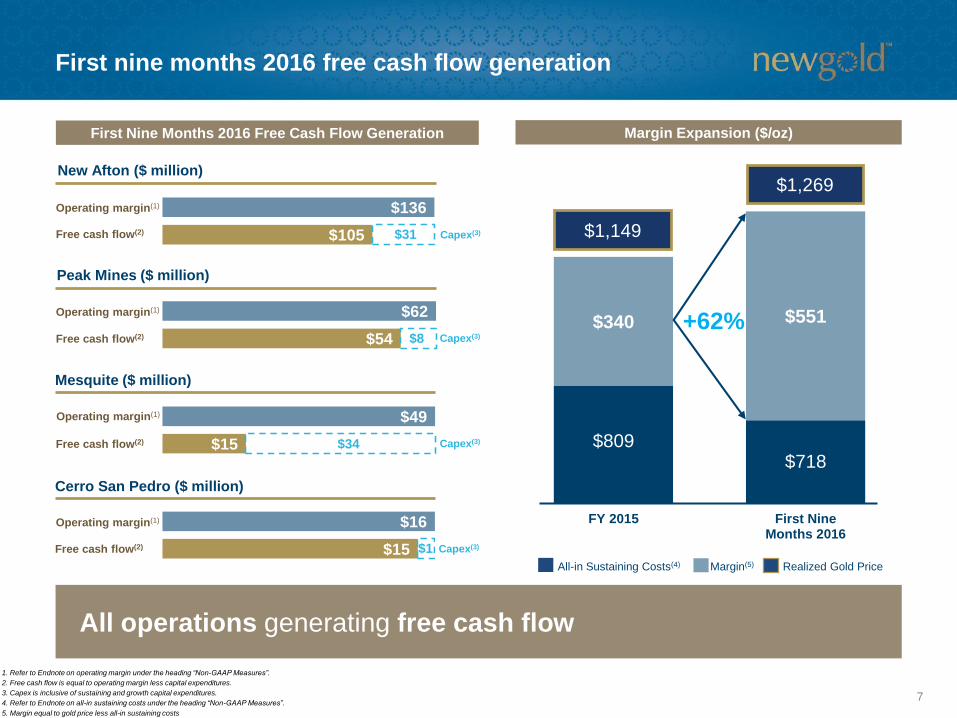
First nine months 2016 free cash flow generation
New Afton ($ million)
Peak Mines ($ million)
Mesquite ($ million)
Cerro San Pedro ($ million)
All operations generating free cash flow
$15
$49Operating margin(1)
Free cash flow(2) $34
$54
$62Operating margin(1)
Free cash flow(2) Capex(3)
$15
$16Operating margin(1)
Free cash flow(2) Capex(3)
$809$718
$340 $551
FY 2015 First NineMonths 2016
$1,149
$1,269
+62%
First Nine Months 2016 Free Cash Flow Generation Margin Expansion ($/oz)
All-in Sustaining Costs(4) Margin(5) Realized Gold Price
$8
$1
1. Refer to Endnote on operating margin under the heading “Non-GAAP Measures”.
2. Free cash flow is equal to operating margin less capital expenditures.
3. Capex is inclusive of sustaining and growth capital expenditures.
4. Refer to Endnote on all-in sustaining costs under the heading “Non-GAAP Measures”.
5. Margin equal to gold price less all-in sustaining costs
Capex(3)
Operating margin(1)
Free cash flow(2) Capex(3)$31
8
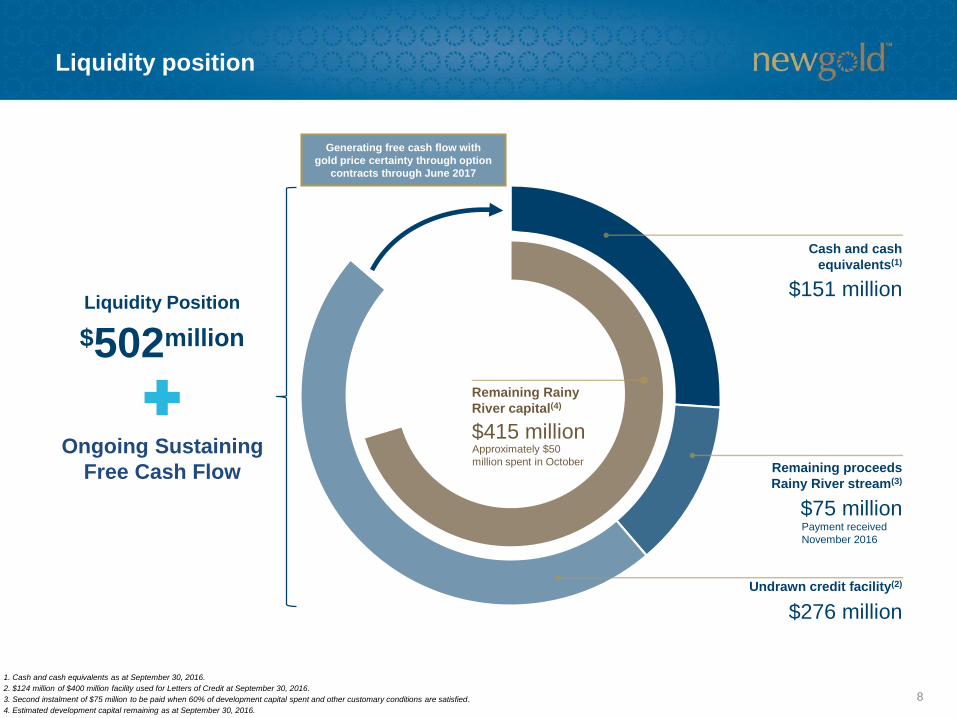
Liquidity position
Remaining proceeds
Rainy River stream(3)
Remaining Rainy
River capital(4)
Liquidity Position
$502million
Cash and cash
equivalents(1)
$151 million
$276 million
Undrawn credit facility(2)
$415 million
1. Cash and cash equivalents as at September 30, 2016.
2. $124 million of $400 million facility used for Letters of Credit at September 30, 2016.
3. Second instalment of $75 million to be paid when 60% of development capital spent and other customary conditions are satisfied.
4. Estimated development capital remaining as at September 30, 2016.
$75 million
Ongoing Sustaining
Free Cash Flow
Generating free cash flow with
gold price certainty through option
contracts through June 2017
Payment received
November 2016
Approximately $50
million spent in October
Reinvesting free cash flow generation
91. Refer to Endnote on margin under the heading “Non-GAAP Measures”.
2. Refer to Endnote on all-in sustaining costs under the heading “Non-GAAP Measures”.
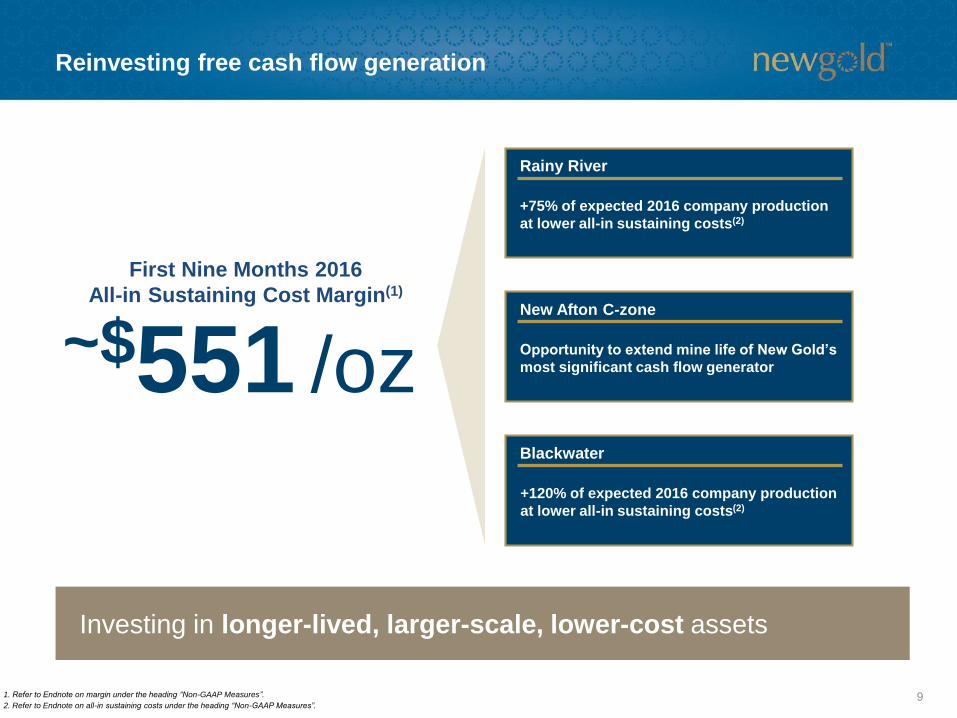
First Nine Months 2016
All-in Sustaining Cost Margin(1)
~$551 /oz
+75% of expected 2016 company production
at lower all-in sustaining costs(2)
Rainy River
Opportunity to extend mine life of New Gold’s
most significant cash flow generator
New Afton C-zone
+120% of expected 2016 company production
at lower all-in sustaining costs(2)
Blackwater
Investing in longer-lived, larger-scale, lower-cost assets
10
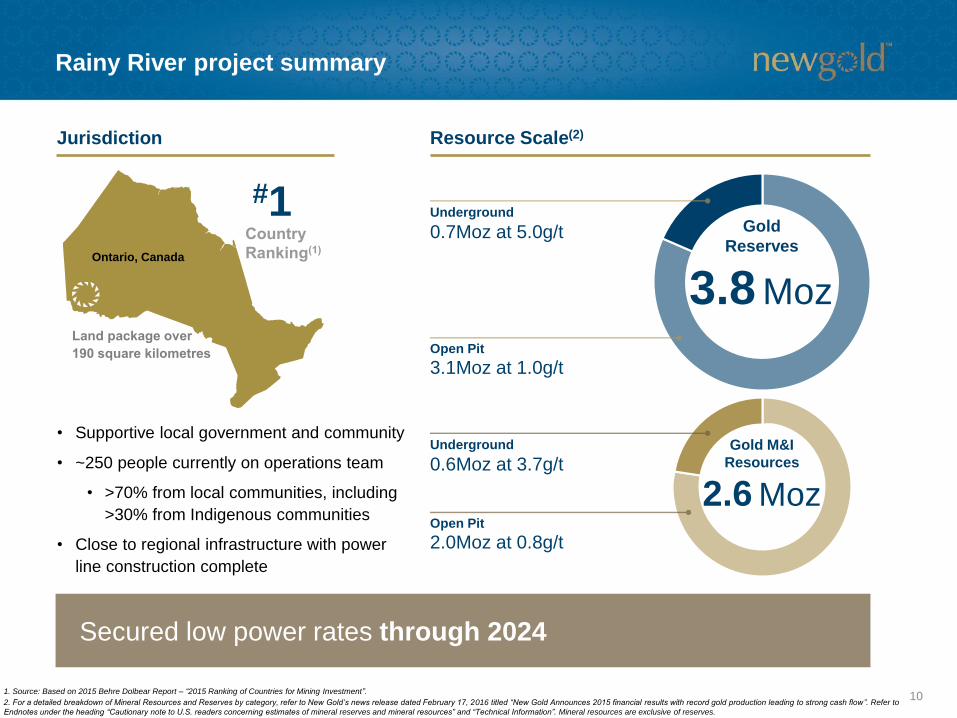
Rainy River project summary
1. Source: Based on 2015 Behre Dolbear Report – “2015 Ranking of Countries for Mining Investment”.
2. For a detailed breakdown of Mineral Resources and Reserves by category, refer to New Gold’s news release dated February 17, 2016 titled “New Gold Announces 2015 financial results with record gold production leading to strong cash flow”. Refer to
Endnotes under the heading “Cautionary note to U.S. readers concerning estimates of mineral reserves and mineral resources” and “Technical Information”. Mineral resources are exclusive of reserves.
• Supportive local government and community
• ~250 people currently on operations team
• >70% from local communities, including
>30% from Indigenous communities
• Close to regional infrastructure with power
line construction complete
Ontario, Canada
Gold
Reserves
3.1Moz at 1.0g/tOpen Pit
Underground
0.7Moz at 5.0g/t
3.8 Moz
#1
Gold M&I
Resources
2.0Moz at 0.8g/tOpen Pit
Underground
0.6Moz at 3.7g/t
2.6 Moz
Jurisdiction Resource Scale(2)
Secured low power rates through 2024
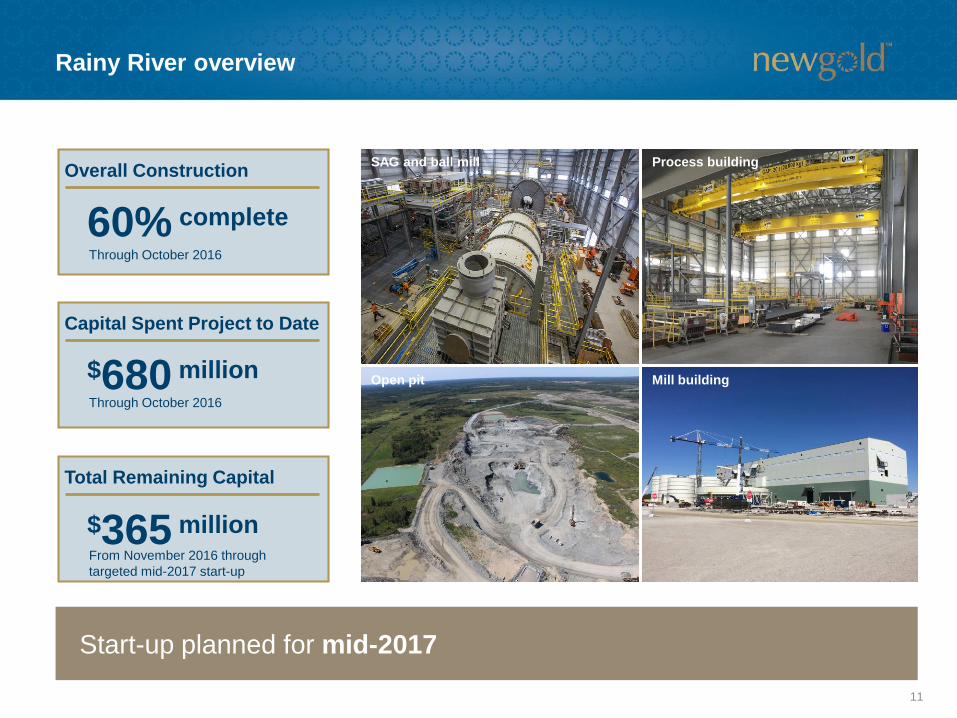
Rainy River overview
11
Start-up planned for mid-2017
Overall Construction
60% complete
Through October 2016
Capital Spent Project to Date
$680 millionThrough October 2016
Total Remaining Capital
$365 million
Process building
Mill building
SAG and ball mill
Open pit
From November 2016 through
targeted mid-2017 start-up
12
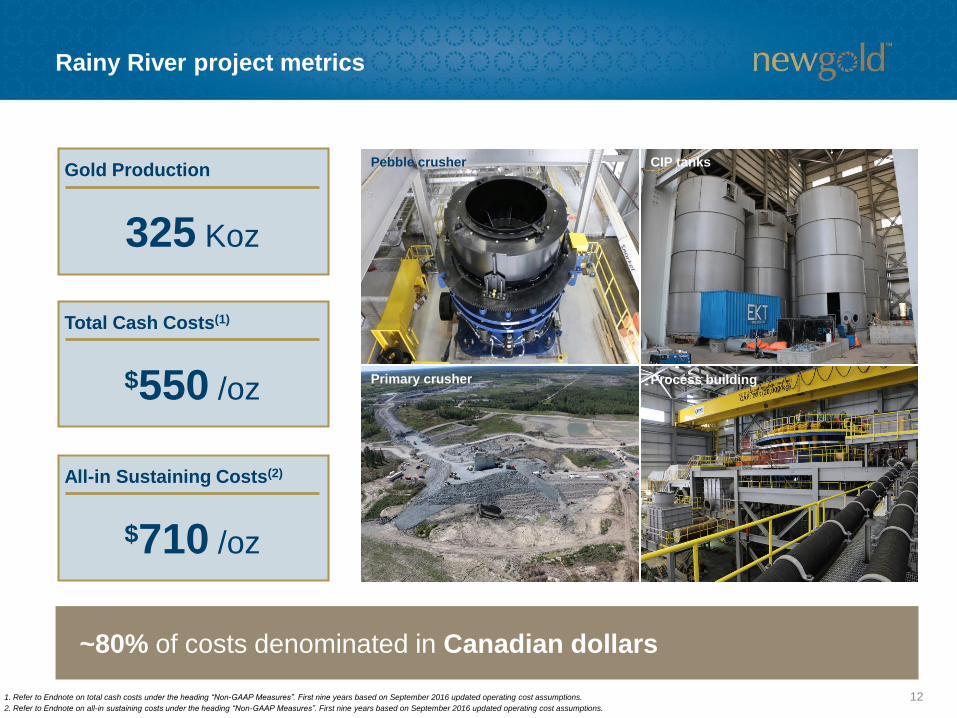
Rainy River project metrics
Pebble crusher
Primary crusher
CIP tanks
Process building
325 Koz
$550 /oz
$710 /oz
Gold Production
Total Cash Costs(1)
All-in Sustaining Costs(2)
~80% of costs denominated in Canadian dollars
1. Refer to Endnote on total cash costs under the heading “Non-GAAP Measures”. First nine years based on September 2016 updated operating cost assumptions.
2. Refer to Endnote on all-in sustaining costs under the heading “Non-GAAP Measures”. First nine years based on September 2016 updated operating cost assumptions.
13
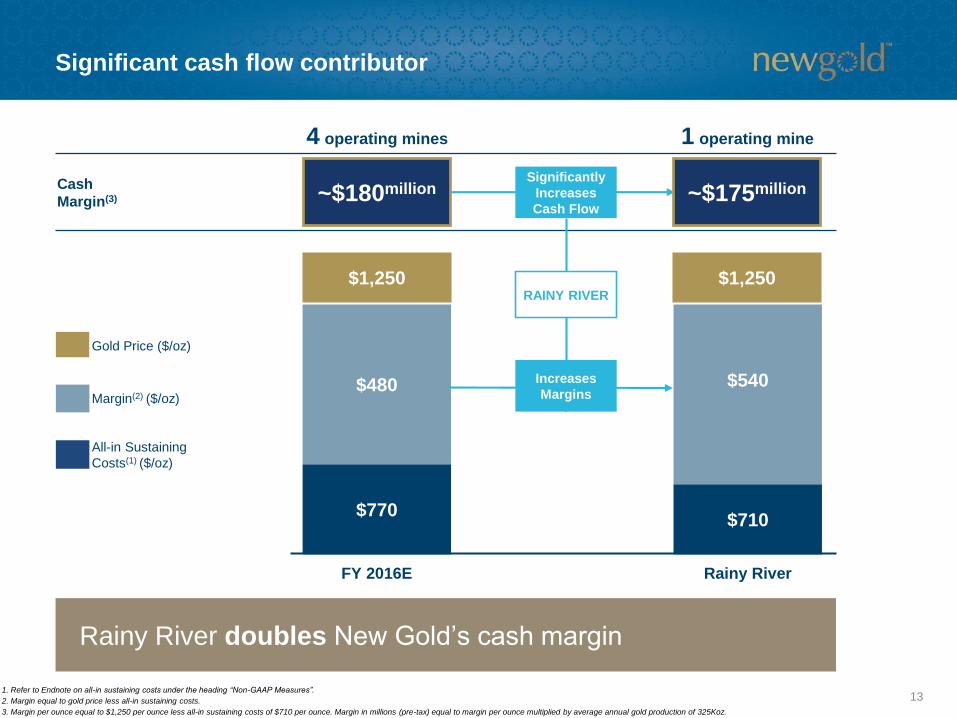
Significant cash flow contributor
$770 $710
$480 $540
FY 2016E Rainy River
$1,250 $1,250
1. Refer to Endnote on all-in sustaining costs under the heading “Non-GAAP Measures”.
2. Margin equal to gold price less all-in sustaining costs.
3. Margin per ounce equal to $1,250 per ounce less all-in sustaining costs of $710 per ounce. Margin in millions (pre-tax) equal to margin per ounce multiplied by average annual gold production of 325Koz.
Rainy River doubles New Gold’s cash margin
~$180million ~$175millionCash
Margin(3)
RAINY RIVER
4 operating mines 1 operating mine
Increases
Margins
Significantly
Increases
Cash Flow
All-in Sustaining
Costs(1) ($/oz)
Margin(2) ($/oz)
Gold Price ($/oz)
14
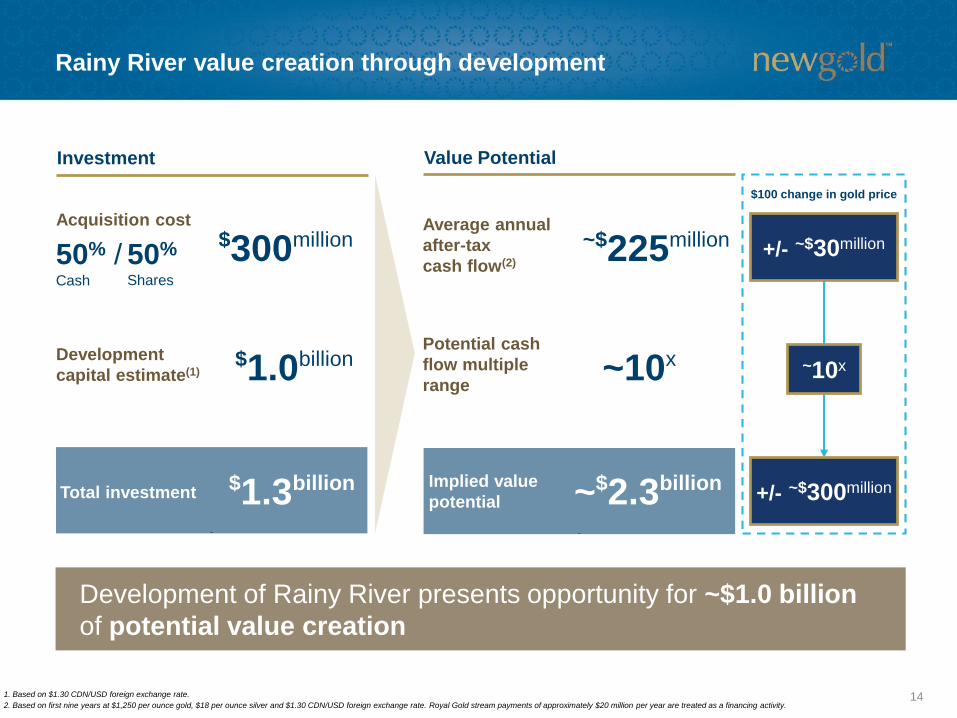
Rainy River value creation through development
Development of Rainy River presents opportunity for ~$1.0 billion
of potential value creation
UPSIDE
$300millionAcquisition cost
50% /Cash
50%
Shares
$1.0billionDevelopment
capital estimate(1)
$1.3billionTotal investment
Average annual
after-tax
cash flow(2)
Potential cash
flow multiple
range
Implied value
potential
~$225million
~10x
~$2.3billion
Investment Value Potential
1. Based on $1.30 CDN/USD foreign exchange rate.
2. Based on first nine years at $1,250 per ounce gold, $18 per ounce silver and $1.30 CDN/USD foreign exchange rate. Royal Gold stream payments of approximately $20 million per year are treated as a financing activity.
$100 change in gold price
+/- ~$30million
+/- ~$300million
~10x
15
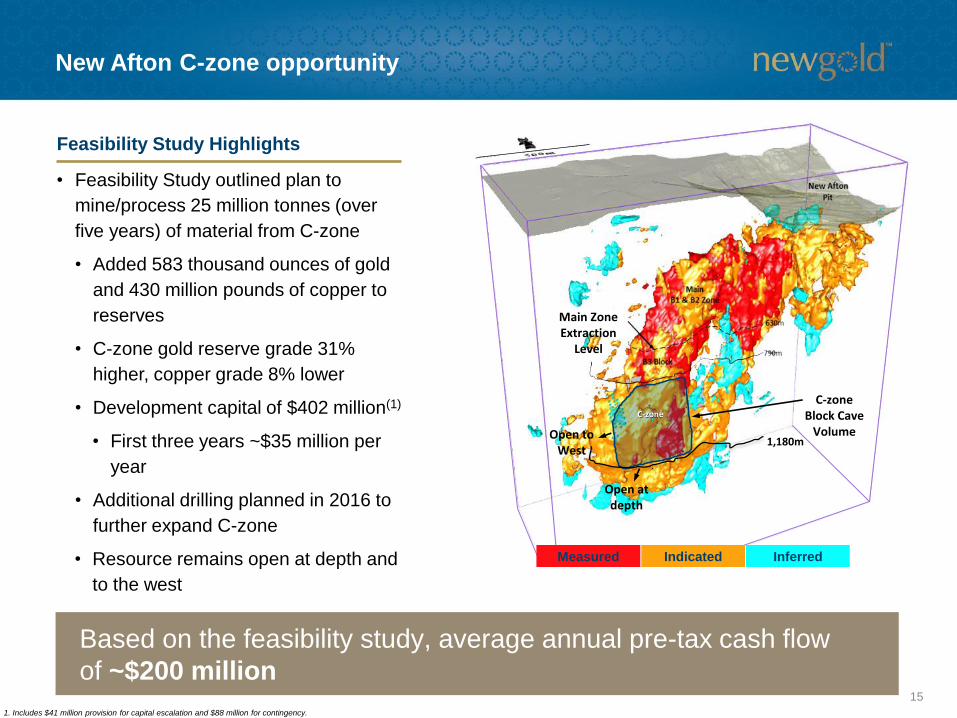
New Afton C-zone opportunity
Based on the feasibility study, average annual pre-tax cash flow
of ~$200 million
• Feasibility Study outlined plan to
mine/process 25 million tonnes (over
five years) of material from C-zone
• Added 583 thousand ounces of gold
and 430 million pounds of copper to
reserves
• C-zone gold reserve grade 31%
higher, copper grade 8% lower
• Development capital of $402 million(1)
• First three years ~$35 million per
year
• Additional drilling planned in 2016 to
further expand C-zone
• Resource remains open at depth and
to the west
Feasibility Study Highlights
1,180m
C-zone Block Cave
VolumeOpen to West
Open at depth
Main Zone Extraction
Level
C-zone
Measured Indicated Inferred
1. Includes $41 million provision for capital escalation and $88 million for contingency.
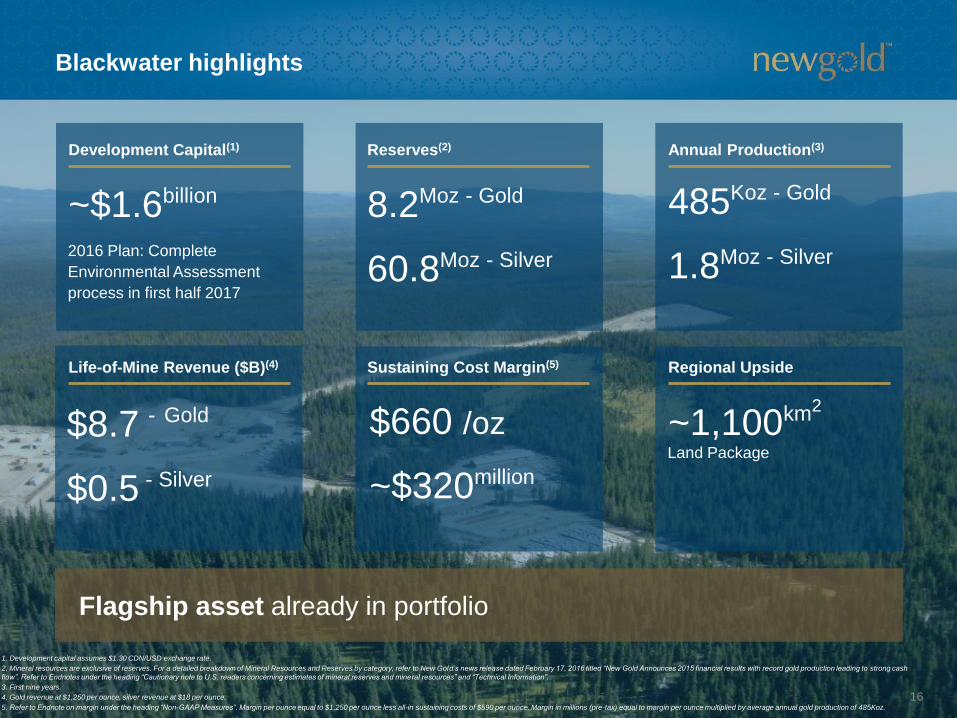
Blackwater highlights
16
1. Development capital assumes $1.30 CDN/USD exchange rate.
2. Mineral resources are exclusive of reserves. For a detailed breakdown of Mineral Resources and Reserves by category, refer to New Gold’s news release dated February 17, 2016 titled “New Gold Announces 2015 financial results with record gold production leading to strong cash
flow”. Refer to Endnotes under the heading “Cautionary note to U.S. readers concerning estimates of mineral reserves and mineral resources” and “Technical Information”.
3. First nine years.
4. Gold revenue at $1,250 per ounce, silver revenue at $18 per ounce.
5. Refer to Endnote on margin under the heading “Non-GAAP Measures”. Margin per ounce equal to $1,250 per ounce less all-in sustaining costs of $590 per ounce. Margin in millions (pre-tax) equal to margin per ounce multiplied by average annual gold production of 485Koz.
Development Capital(1)
~$1.6billion
Reserves(2)
8.2Moz - Gold
60.8Moz - Silver
Annual Production(3)
Life-of-Mine Revenue ($B)(4) Sustaining Cost Margin(5) Regional Upside
2016 Plan: Complete
Environmental Assessment
process in first half 2017
485Koz - Gold
1.8Moz - Silver
$660 /oz
~$320million
~1,100km2
Land Package
$8.7 - Gold
$0.5 - Silver
Flagship asset already in portfolio
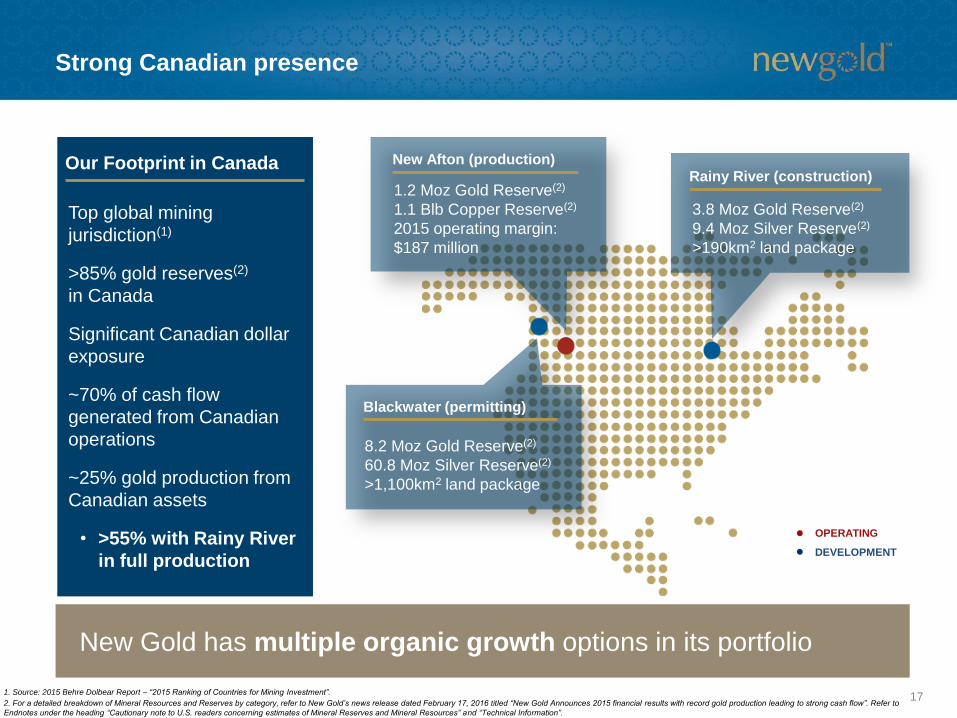
Strong Canadian presence
171. Source: 2015 Behre Dolbear Report – “2015 Ranking of Countries for Mining Investment”.
2. For a detailed breakdown of Mineral Resources and Reserves by category, refer to New Gold’s news release dated February 17, 2016 titled “New Gold Announces 2015 financial results with record gold production leading to strong cash flow”. Refer to
Endnotes under the heading “Cautionary note to U.S. readers concerning estimates of Mineral Reserves and Mineral Resources” and “Technical Information”.
OPERATING
DEVELOPMENT
1.2 Moz Gold Reserve(2)
1.1 Blb Copper Reserve(2)
2015 operating margin:
$187 million
New Afton (production)
3.8 Moz Gold Reserve(2)
9.4 Moz Silver Reserve(2)
>190km2 land package
Rainy River (construction)
8.2 Moz Gold Reserve(2)
60.8 Moz Silver Reserve(2)
>1,100km2 land package
Blackwater (permitting)
Top global mining
jurisdiction(1)
>85% gold reserves(2)
in Canada
Significant Canadian dollar
exposure
~70% of cash flow
generated from Canadian
operations
~25% gold production from
Canadian assets
• >55% with Rainy River
in full production
Our Footprint in Canada
New Gold has multiple organic growth options in its portfolio

18
New Gold looking forward
Organic Growth Projects(2)
Current Portfolio
15+ years ~$640 /oz
Average Annual Gold
Production Per Asset
All-in Sustaining
Costs(3) Weighted
Average
~7 years ~100 Koz ~$770 /oz
Average
Mine Life
Investing in longer-lived, larger-scale, lower-cost assets
~400 Koz
(1)
>2x 4x ($130)/oz
1. Based on 12 years at New Afton (including C-zone), seven years at Mesquite, six years at Peak Mines and one year at Cerro San Pedro.
2. Based on 325Koz annual production from Rainy River (first nine years) and ~485Koz annual production from Blackwater (first nine years) as outlined in the feasibility studies and all-in sustaining costs for the projects as outlined in the feasibility studies.
3. Refer to Endnote on all-in sustaining costs under the heading “Non-GAAP Measures”.
19
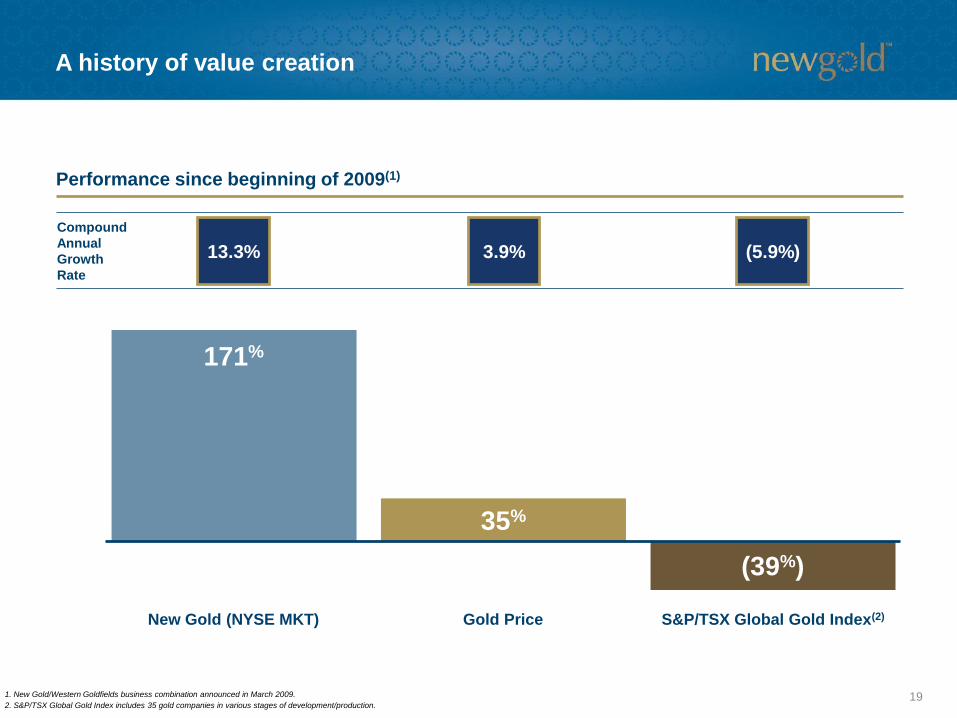
A history of value creation
New Gold (NYSE MKT)
171%
Gold Price
35%
S&P/TSX Global Gold Index(2)
(39%)
1. New Gold/Western Goldfields business combination announced in March 2009.
2. S&P/TSX Global Gold Index includes 35 gold companies in various stages of development/production.
13.3% 3.9% (5.9%)
Compound
Annual
Growth
Rate
Performance since beginning of 2009(1)
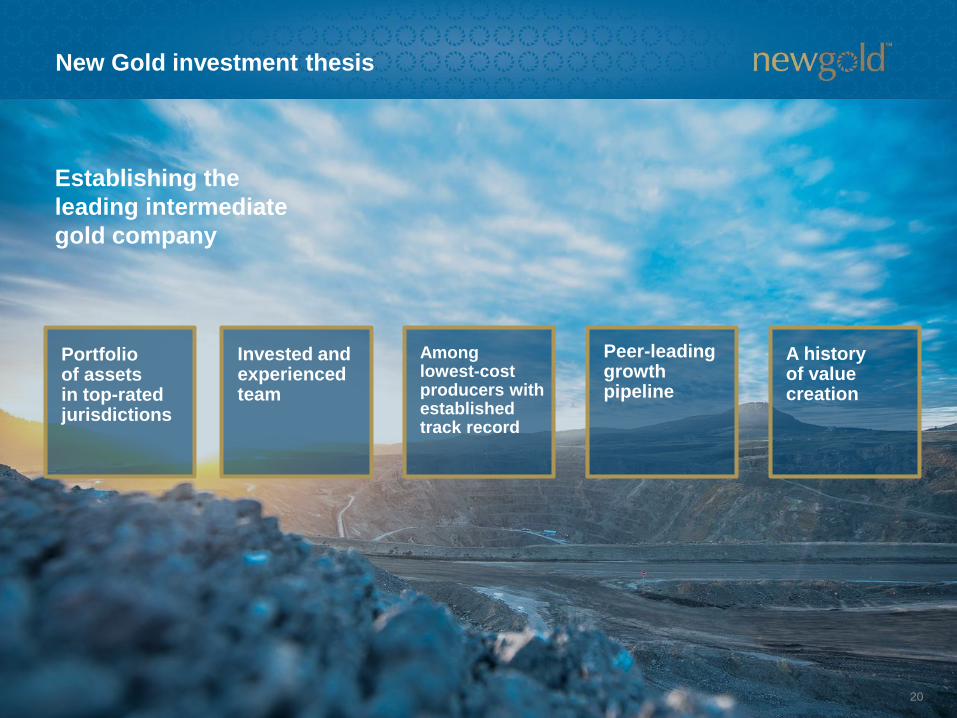
New Gold investment thesis
20
Establishing the
leading intermediate
gold company
Invested and experienced team
Portfolio of assetsin top-ratedjurisdictions
Peer-leading growth pipeline
A history of value creation
Amonglowest-cost producers with established track record
Appendices
21
Appendices
Page
1. Corporate 22
2. New Afton 35
3. Other Operations – Mesquite, Peak Mines, Cerro San Pedro 42
4. Rainy River 45
5. Blackwater 57
6. Exploration and Reserves and Resources 58
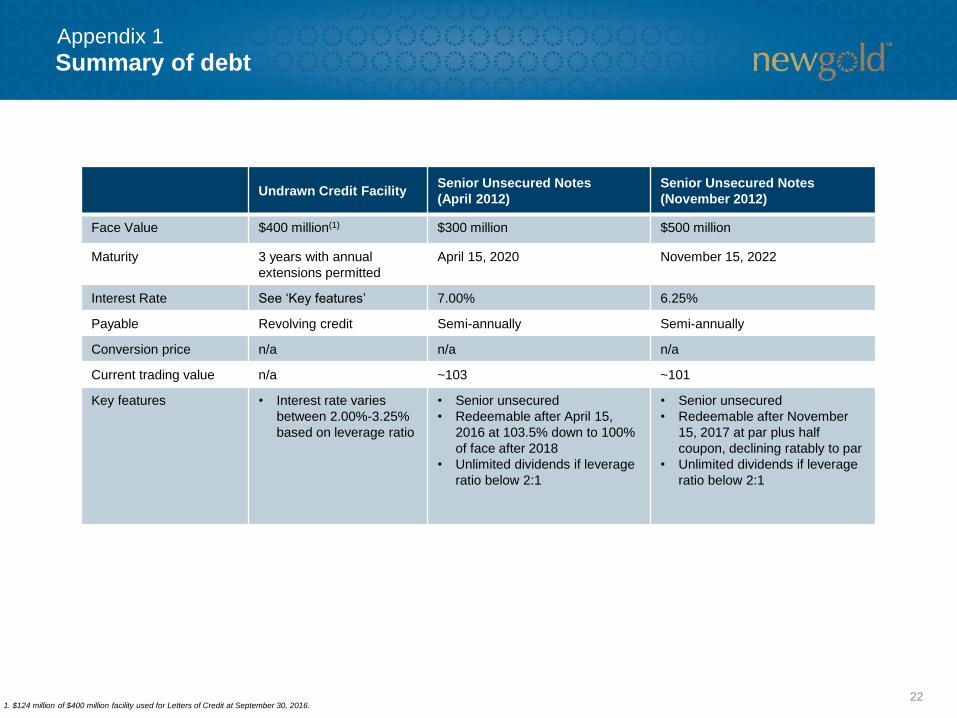
Summary of debt
22
Undrawn Credit FacilitySenior Unsecured Notes
(April 2012)
Senior Unsecured Notes
(November 2012)
Face Value $400 million(1) $300 million $500 million
Maturity 3 years with annual
extensions permitted
April 15, 2020 November 15, 2022
Interest Rate See ‘Key features’ 7.00% 6.25%
Payable Revolving credit Semi-annually Semi-annually
Conversion price n/a n/a n/a
Current trading value n/a ~103 ~101
Key features • Interest rate varies
between 2.00%-3.25%
based on leverage ratio
• Senior unsecured
• Redeemable after April 15,
2016 at 103.5% down to 100%
of face after 2018
• Unlimited dividends if leverage
ratio below 2:1
• Senior unsecured
• Redeemable after November
15, 2017 at par plus half
coupon, declining ratably to par
• Unlimited dividends if leverage
ratio below 2:1
1. $124 million of $400 million facility used for Letters of Credit at September 30, 2016.
Appendix 1
23
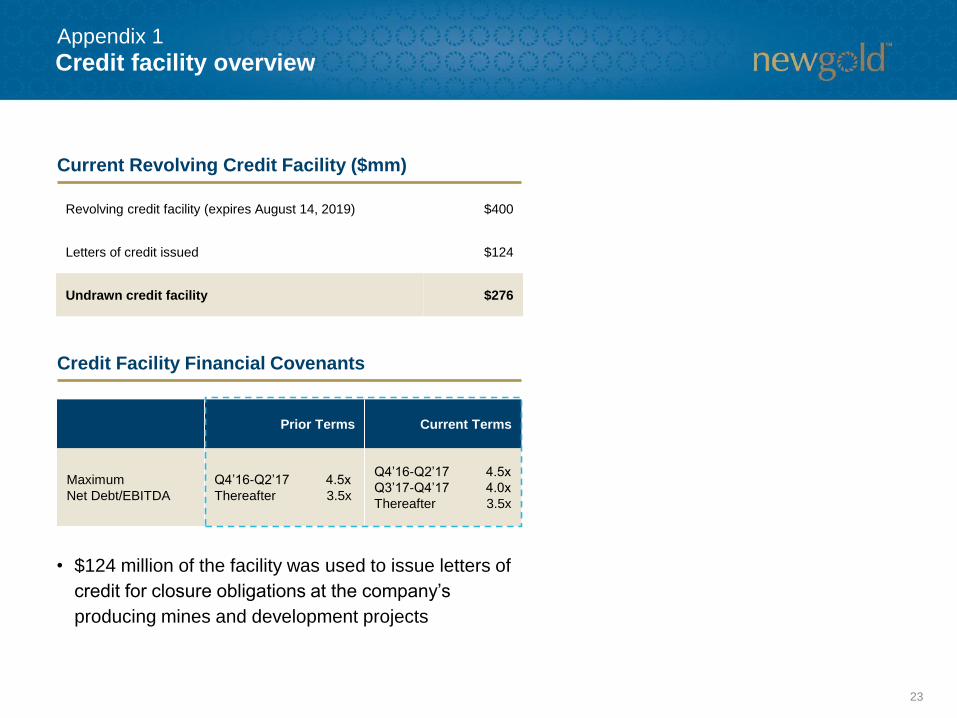
Credit facility overviewAppendix 1
• $124 million of the facility was used to issue letters of
credit for closure obligations at the company’s
producing mines and development projects
Revolving credit facility (expires August 14, 2019) $400
Letters of credit issued $124
Undrawn credit facility $276
Current Revolving Credit Facility ($mm)
Prior Terms Current Terms
Maximum
Net Debt/EBITDA
Q4’16-Q2’17 4.5x
Thereafter 3.5x
Q4’16-Q2’17 4.5x
Q3’17-Q4’17 4.0x
Thereafter 3.5x
Credit Facility Financial Covenants
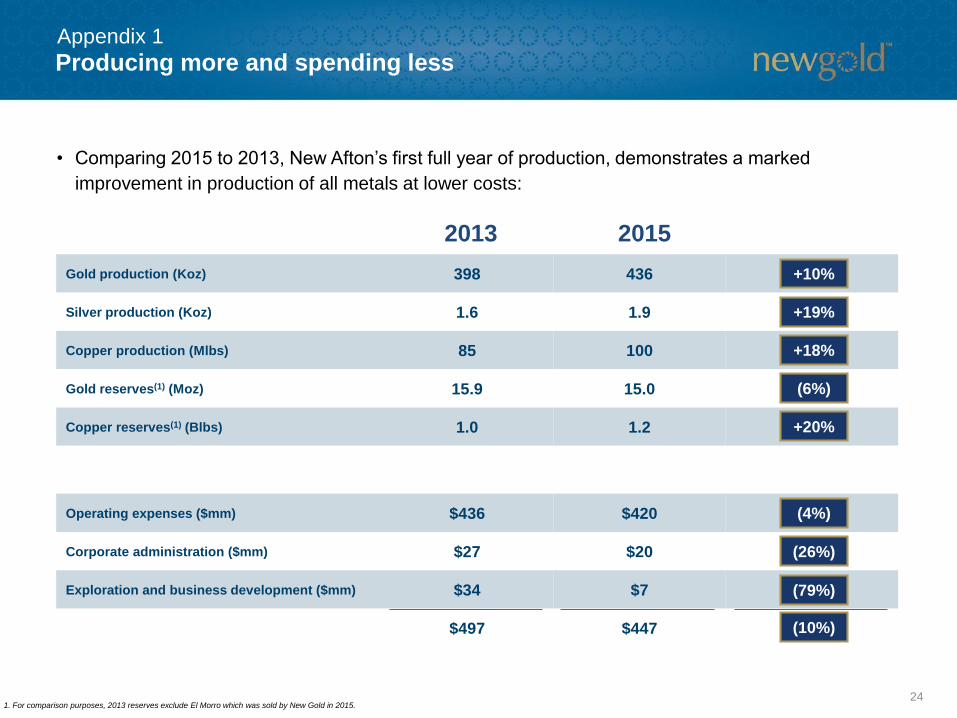
Gold production (Koz) 398 436
Silver production (Koz) 1.6 1.9
Copper production (Mlbs) 85 100
Gold reserves(1) (Moz) 15.9 15.0
Copper reserves(1) (Blbs) 1.0 1.2
Operating expenses ($mm) $436 $420
Corporate administration ($mm) $27 $20
Exploration and business development ($mm) $34 $7
$497 $447
24
Producing more and spending less
20152013
+10%
1. For comparison purposes, 2013 reserves exclude El Morro which was sold by New Gold in 2015.
+19%
+18%
(6%)
+20%
(4%)
(26%)
(79%)
(10%)
• Comparing 2015 to 2013, New Afton’s first full year of production, demonstrates a marked
improvement in production of all metals at lower costs:
Appendix 1
25
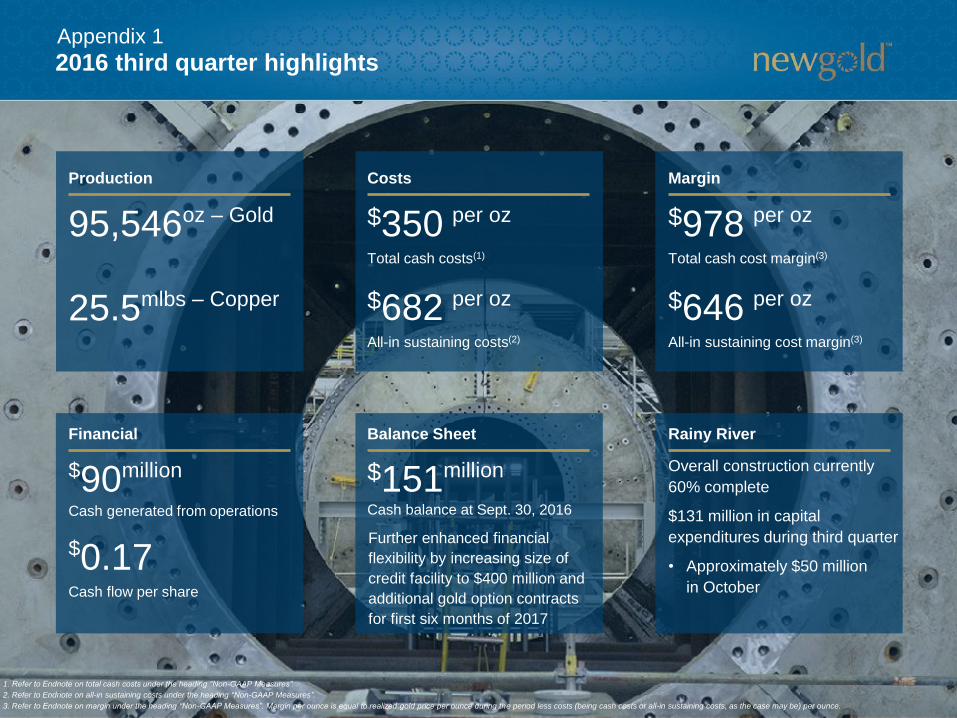
2016 third quarter highlights
1. Refer to Endnote on total cash costs under the heading “Non-GAAP Measures”.
2. Refer to Endnote on all-in sustaining costs under the heading “Non-GAAP Measures”.
3. Refer to Endnote on margin under the heading “Non-GAAP Measures”. Margin per ounce is equal to realized gold price per ounce during the period less costs (being cash costs or all-in sustaining costs, as the case may be) per ounce.
95,546oz – Gold $350 per oz
Total cash costs(1)
$682 per oz
All-in sustaining costs(2)
Production Costs Margin
Financial Balance Sheet Rainy River
25.5mlbs – Copper
Overall construction currently
60% complete
$131 million in capital
expenditures during third quarter
• Approximately $50 million
in October
$151million
Cash balance at Sept. 30, 2016
Further enhanced financial
flexibility by increasing size of
credit facility to $400 million and
additional gold option contracts
for first six months of 2017
$90million
Cash generated from operations
$0.17Cash flow per share
$978 per oz
Total cash cost margin(3)
$646 per oz
All-in sustaining cost margin(3)
Appendix 1
24
19
15
26
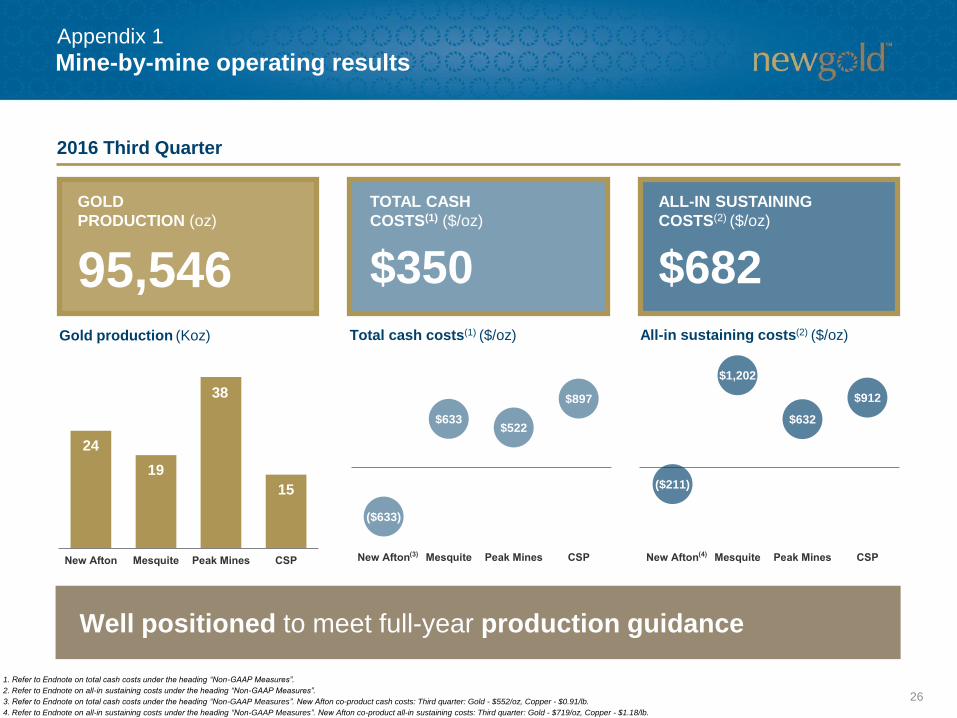
Mine-by-mine operating results
Total cash costs(1) ($/oz) All-in sustaining costs(2) ($/oz)
1. Refer to Endnote on total cash costs under the heading “Non-GAAP Measures”.
2. Refer to Endnote on all-in sustaining costs under the heading “Non-GAAP Measures”.
3. Refer to Endnote on total cash costs under the heading “Non-GAAP Measures”. New Afton co-product cash costs: Third quarter: Gold - $552/oz, Copper - $0.91/lb.
4. Refer to Endnote on all-in sustaining costs under the heading “Non-GAAP Measures”. New Afton co-product all-in sustaining costs: Third quarter: Gold - $719/oz, Copper - $1.18/lb.
2016 Third Quarter
Gold production (Koz)
($633)
$633$522
$897
($211)
$1,202
$632
$912
GOLD
PRODUCTION (oz)
95,546
TOTAL CASH
COSTS(1) ($/oz)
$350
ALL-IN SUSTAINING
COSTS(2) ($/oz)
$682
38
Well positioned to meet full-year production guidance
Appendix 1
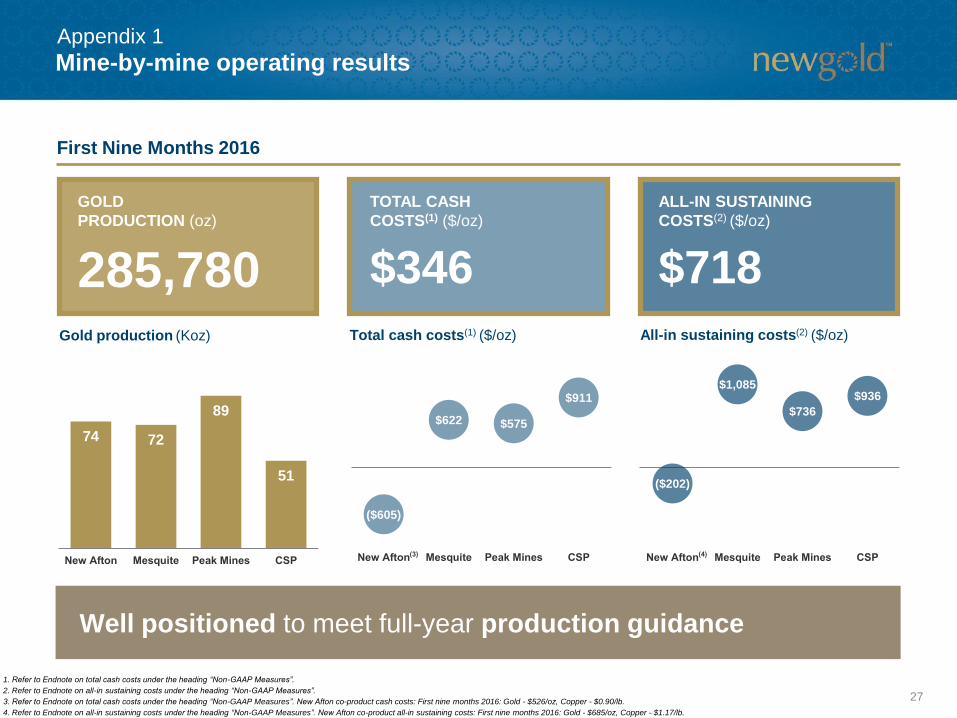
74 72
89
51
27
Mine-by-mine operating results
Total cash costs(1) ($/oz) All-in sustaining costs(2) ($/oz)
1. Refer to Endnote on total cash costs under the heading “Non-GAAP Measures”.
2. Refer to Endnote on all-in sustaining costs under the heading “Non-GAAP Measures”.
3. Refer to Endnote on total cash costs under the heading “Non-GAAP Measures”. New Afton co-product cash costs: First nine months 2016: Gold - $526/oz, Copper - $0.90/lb.
4. Refer to Endnote on all-in sustaining costs under the heading “Non-GAAP Measures”. New Afton co-product all-in sustaining costs: First nine months 2016: Gold - $685/oz, Copper - $1.17/lb.
First Nine Months 2016
Gold production (Koz)
($605)
$622 $575
$911
($202)
$1,085
$736
$936
GOLD
PRODUCTION (oz)
285,780
TOTAL CASH
COSTS(1) ($/oz)
$346
ALL-IN SUSTAINING
COSTS(2) ($/oz)
$718
Well positioned to meet full-year production guidance
Appendix 1
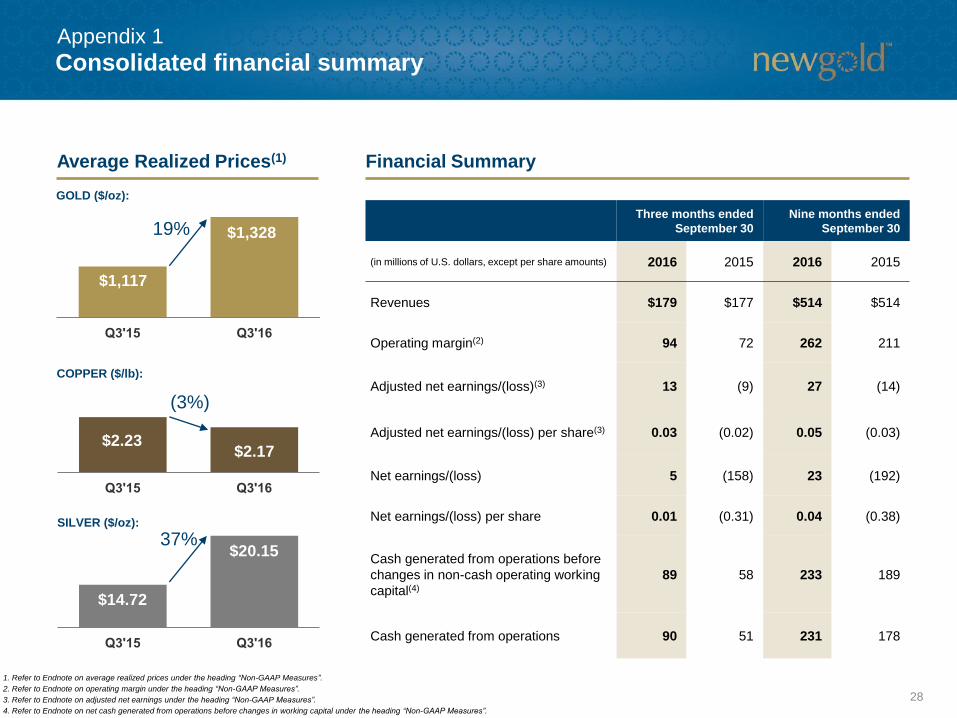
Consolidated financial summary
28
Three months ended
September 30
Nine months ended
September 30
(in millions of U.S. dollars, except per share amounts) 2016 2015 2016 2015
Revenues $179 $177 $514 $514
Operating margin(2) 94 72 262 211
Adjusted net earnings/(loss)(3) 13 (9) 27 (14)
Adjusted net earnings/(loss) per share(3) 0.03 (0.02) 0.05 (0.03)
Net earnings/(loss) 5 (158) 23 (192)
Net earnings/(loss) per share 0.01 (0.31) 0.04 (0.38)
Cash generated from operations before
changes in non-cash operating working
capital(4)
89 58 233 189
Cash generated from operations 90 51 231 178
1. Refer to Endnote on average realized prices under the heading “Non-GAAP Measures”.
2. Refer to Endnote on operating margin under the heading “Non-GAAP Measures”.
3. Refer to Endnote on adjusted net earnings under the heading “Non-GAAP Measures”.
4. Refer to Endnote on net cash generated from operations before changes in working capital under the heading “Non-GAAP Measures”.
Financial Summary
GOLD ($/oz):
19%
COPPER ($/lb):
(3%)
SILVER ($/oz):
37%
Average Realized Prices(1)
$1,117
$1,328
$2.23$2.17
$14.72
$20.15
Appendix 1
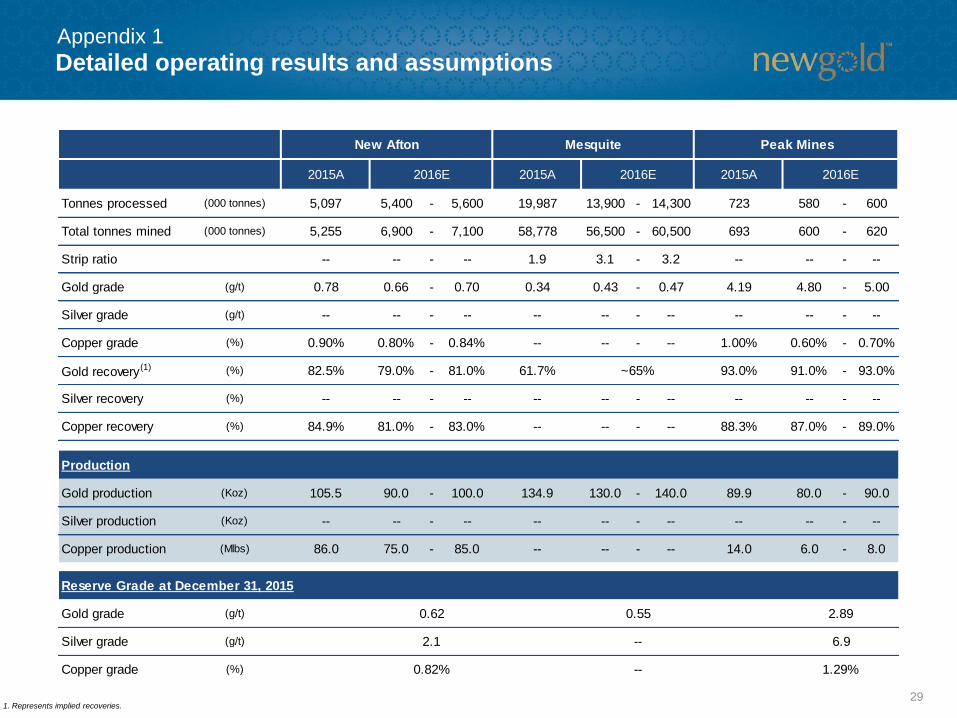
Detailed operating results and assumptions
29
Appendix 1
2015A 2015A 2015A
Tonnes processed (000 tonnes) 5,097 5,400 - 5,600 19,987 13,900 - 14,300 723 580 - 600
Total tonnes mined (000 tonnes) 5,255 6,900 - 7,100 58,778 56,500 - 60,500 693 600 - 620
Strip ratio -- -- - -- 1.9 3.1 - 3.2 -- -- - --
Gold grade (g/t) 0.78 0.66 - 0.70 0.34 0.43 - 0.47 4.19 4.80 - 5.00
Silver grade (g/t) -- -- - -- -- -- - -- -- -- - --
Copper grade (%) 0.90% 0.80% - 0.84% -- -- - -- 1.00% 0.60% - 0.70%
Gold recovery(1) (%) 82.5% 79.0% - 81.0% 61.7% 93.0% 91.0% - 93.0%
Silver recovery (%) -- -- - -- -- -- - -- -- -- - --
Copper recovery (%) 84.9% 81.0% - 83.0% -- -- - -- 88.3% 87.0% - 89.0%
Production
Gold production (Koz) 105.5 90.0 - 100.0 134.9 130.0 - 140.0 89.9 80.0 - 90.0
Silver production (Koz) -- -- - -- -- -- - -- -- -- - --
Copper production (Mlbs) 86.0 75.0 - 85.0 -- -- - -- 14.0 6.0 - 8.0
Reserve Grade at December 31, 2015
Gold grade (g/t)
Silver grade (g/t)
Copper grade (%) 1.29%
2.89
6.9
Mesquite
2016E 2016E
New Afton Peak Mines
2016E
~65%
0.82% --
0.62 0.55
2.1 --
1. Represents implied recoveries.
2016 all-in sustaining costs sensitivities
30
Appendix 1
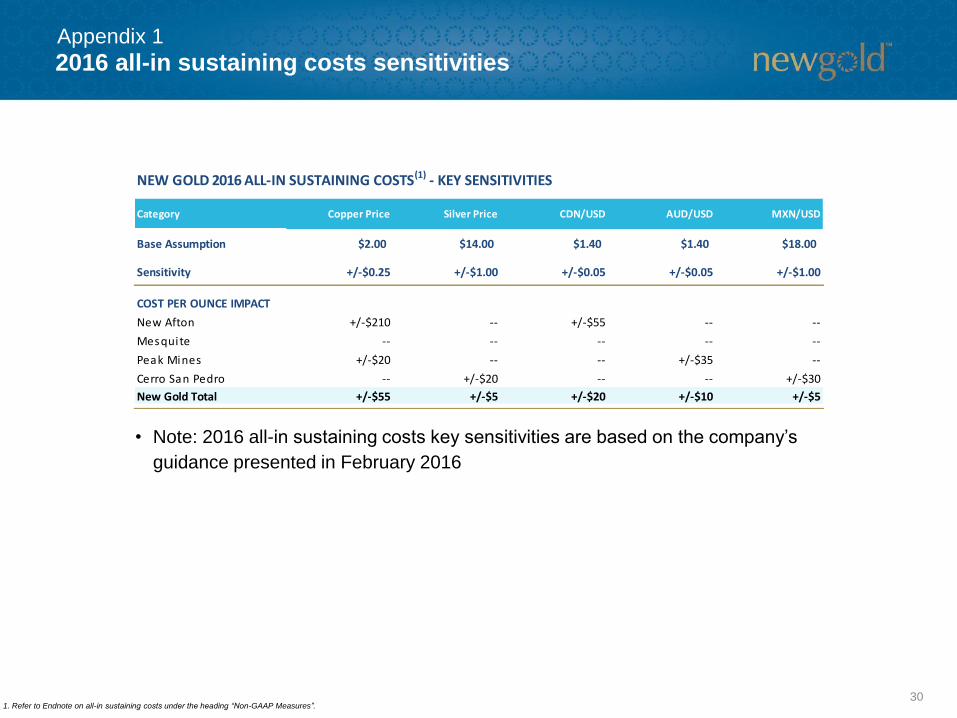
Category Copper Price Silver Price CDN/USD AUD/USD MXN/USD
Base Assumption $2.00 $14.00 $1.40 $1.40 $18.00
Sensitivity +/-$0.25 +/-$1.00 +/-$0.05 +/-$0.05 +/-$1.00
COST PER OUNCE IMPACT
New Afton +/-$210 -- +/-$55 -- --
Mesquite -- -- -- -- --
Peak Mines +/-$20 -- -- +/-$35 --
Cerro San Pedro -- +/-$20 -- -- +/-$30
New Gold Total +/-$55 +/-$5 +/-$20 +/-$10 +/-$5
NEW GOLD 2016 ALL-IN SUSTAINING COSTS(1) - KEY SENSITIVITIES
1. Refer to Endnote on all-in sustaining costs under the heading “Non-GAAP Measures”.
• Note: 2016 all-in sustaining costs key sensitivities are based on the company’s
guidance presented in February 2016
31
2016 guidance
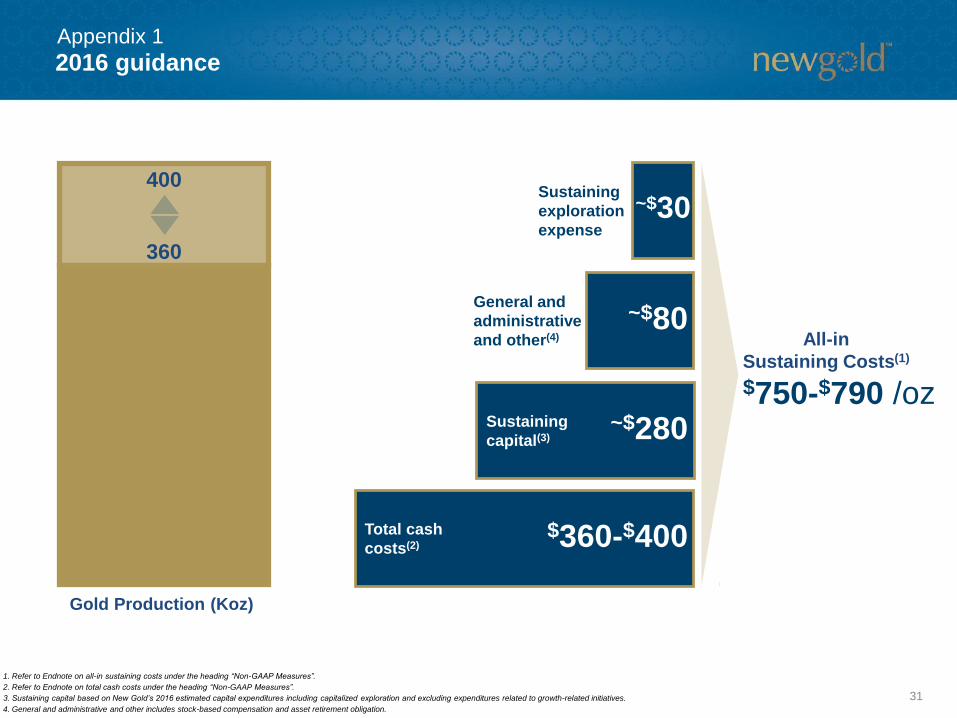
1. Refer to Endnote on all-in sustaining costs under the heading “Non-GAAP Measures”.
2. Refer to Endnote on total cash costs under the heading “Non-GAAP Measures”.
3. Sustaining capital based on New Gold’s 2016 estimated capital expenditures including capitalized exploration and excluding expenditures related to growth-related initiatives.
4. General and administrative and other includes stock-based compensation and asset retirement obligation.
All-in
Sustaining Costs(1)
$750-$790 /oz
Total cash
costs(2)
Sustaining
capital(3)
General and
administrative
and other(4)
Sustaining
exploration
expense
$360-$400
~$280
~$80
~$30
Gold Production (Koz)
400
360
Appendix 1
32
2016 capital expenditures by category
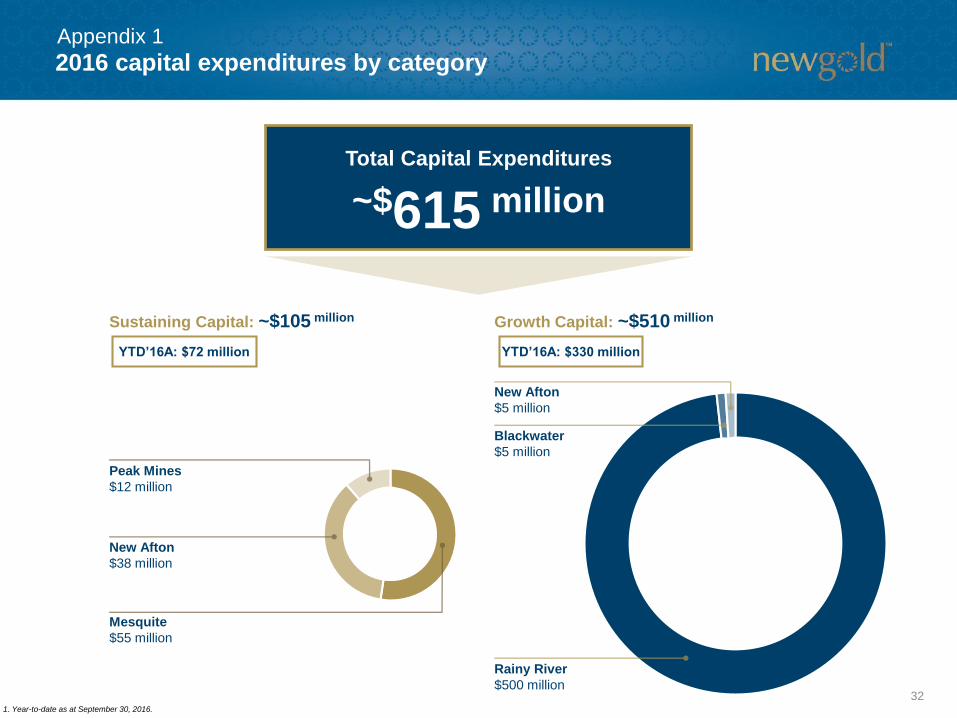
Sustaining Capital: ~$105 million Growth Capital: ~$510 million
Mesquite
$55 million
New Afton
$38 million
Peak Mines
$12 million
Rainy River
$500 million
Blackwater
$5 million
New Afton
$5 million
Total Capital Expenditures
~$615 million
Appendix 1
YTD’16A: $72 million YTD’16A: $330 million
1. Year-to-date as at September 30, 2016.
33
2016 capital expenditures by category (cont’d)
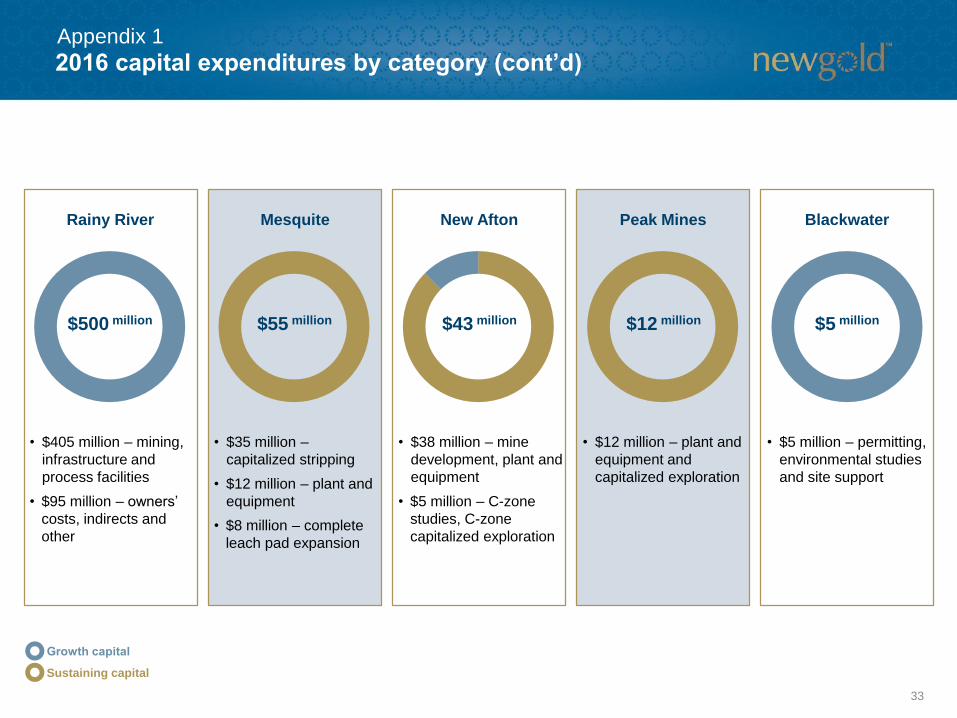
Rainy River Mesquite New Afton
• $405 million – mining,
infrastructure and
process facilities
• $95 million – owners’
costs, indirects and
other
• $35 million –
capitalized stripping
• $12 million – plant and
equipment
• $8 million – complete
leach pad expansion
• $38 million – mine
development, plant and
equipment
• $5 million – C-zone
studies, C-zone
capitalized exploration
Sustaining capital
Peak Mines Blackwater
• $12 million – plant and
equipment and
capitalized exploration
• $5 million – permitting,
environmental studies
and site support
$500 million $55 million $43 million $12 million $5 million
Appendix 1
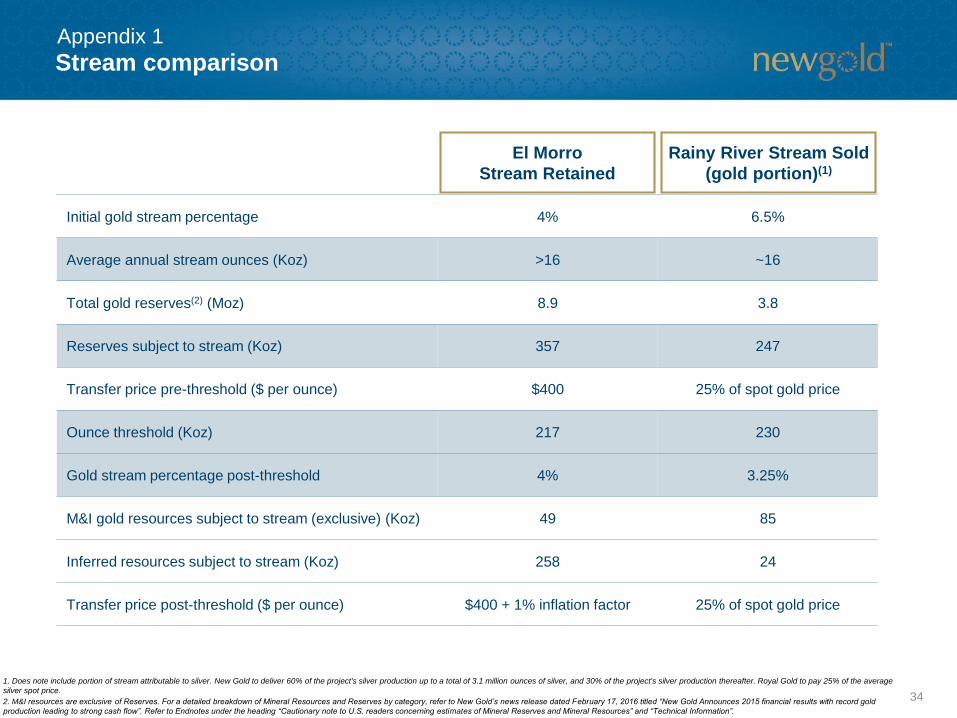
Stream comparison
34
1. Does note include portion of stream attributable to silver. New Gold to deliver 60% of the project's silver production up to a total of 3.1 million ounces of silver, and 30% of the project's silver production thereafter. Royal Gold to pay 25% of the average
silver spot price.
2. M&I resources are exclusive of Reserves. For a detailed breakdown of Mineral Resources and Reserves by category, refer to New Gold’s news release dated February 17, 2016 titled “New Gold Announces 2015 financial results with record gold
production leading to strong cash flow”. Refer to Endnotes under the heading “Cautionary note to U.S. readers concerning estimates of Mineral Reserves and Mineral Resources” and “Technical Information”.
Initial gold stream percentage 4% 6.5%
Average annual stream ounces (Koz) >16 ~16
Total gold reserves(2) (Moz) 8.9 3.8
Reserves subject to stream (Koz) 357 247
Transfer price pre-threshold ($ per ounce) $400 25% of spot gold price
Ounce threshold (Koz) 217 230
Gold stream percentage post-threshold 4% 3.25%
M&I gold resources subject to stream (exclusive) (Koz) 49 85
Inferred resources subject to stream (Koz) 258 24
Transfer price post-threshold ($ per ounce) $400 + 1% inflation factor 25% of spot gold price
El Morro
Stream Retained
Rainy River Stream Sold
(gold portion)(1)
Appendix 1
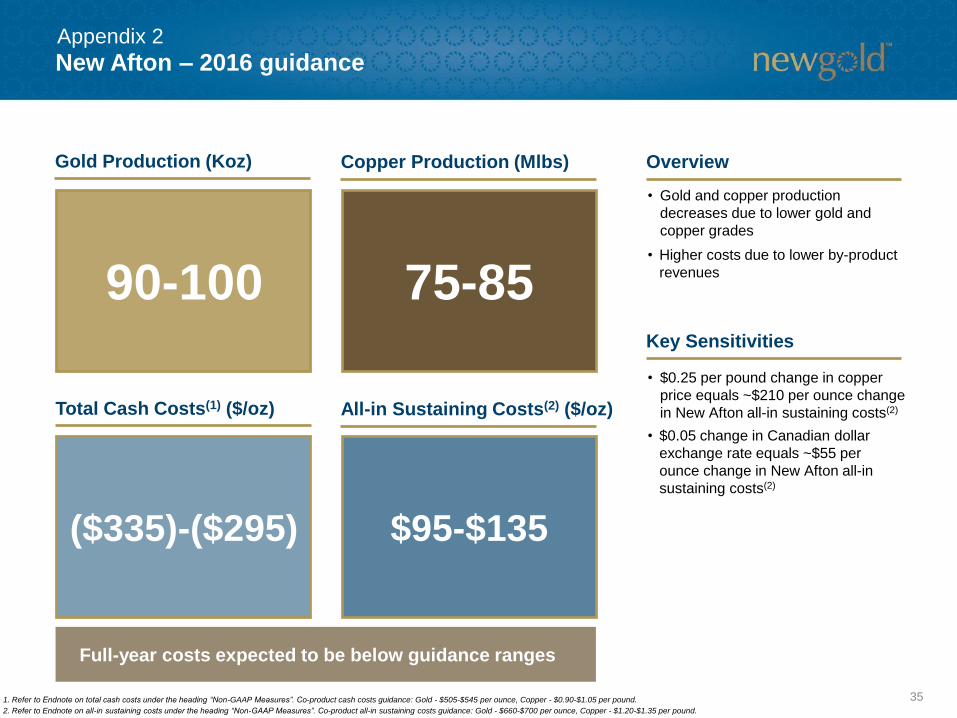
New Afton – 2016 guidance
35
($335)-($295) $95-$135
• Gold and copper production
decreases due to lower gold and
copper grades
• Higher costs due to lower by-product
revenues
• $0.25 per pound change in copper
price equals ~$210 per ounce change
in New Afton all-in sustaining costs(2)
• $0.05 change in Canadian dollar
exchange rate equals ~$55 per
ounce change in New Afton all-in
sustaining costs(2)
1. Refer to Endnote on total cash costs under the heading “Non-GAAP Measures”. Co-product cash costs guidance: Gold - $505-$545 per ounce, Copper - $0.90-$1.05 per pound.
2. Refer to Endnote on all-in sustaining costs under the heading “Non-GAAP Measures”. Co-product all-in sustaining costs guidance: Gold - $660-$700 per ounce, Copper - $1.20-$1.35 per pound.
Gold Production (Koz) Copper Production (Mlbs)
Total Cash Costs(1) ($/oz) All-in Sustaining Costs(2) ($/oz)
90-100 75-85
Overview
Key Sensitivities
Appendix 2
Full-year costs expected to be below guidance ranges
$219 $246
$305
$432
$596
$793
$90
$396
$441
$557
$466
$530
$336
$701
$873
$1,153
$1,259
Early 2010 Mid-2010 Early 2011 Mid-2011 Early 2012 Mid 2012 Sept 2016
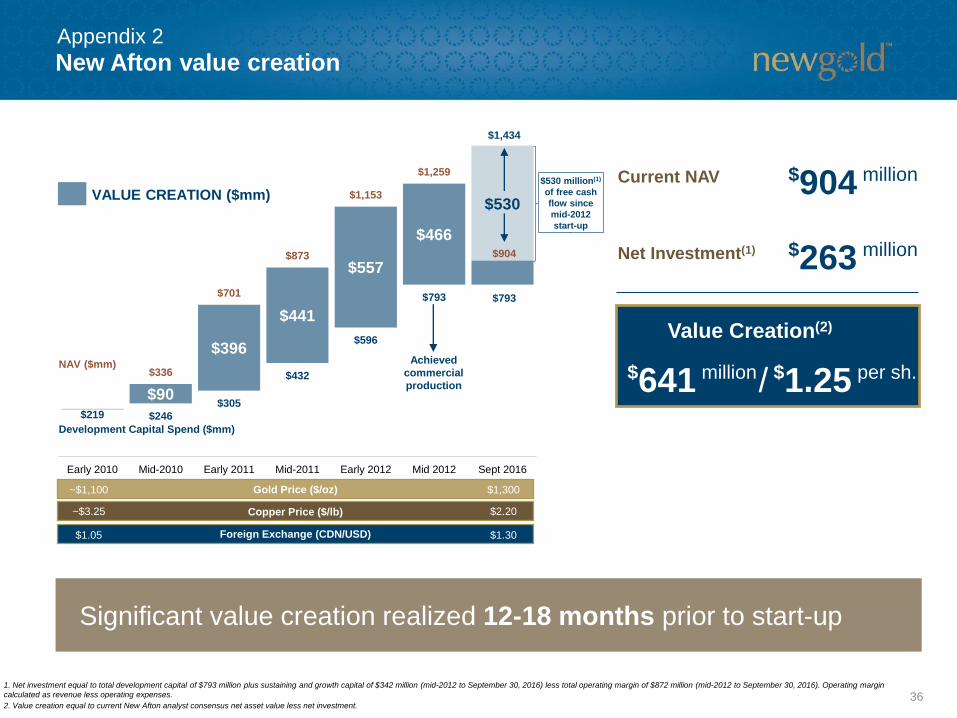
New Afton value creation
36
VALUE CREATION ($mm)
Development Capital Spend ($mm)
$11million
Value Creation(2)
$904 millionCurrent NAV
Net Investment(1)
$641 million/
$263 million
$1.25 per sh.
Significant value creation realized 12-18 months prior to start-up
1. Net investment equal to total development capital of $793 million plus sustaining and growth capital of $342 million (mid-2012 to September 30, 2016) less total operating margin of $872 million (mid-2012 to September 30, 2016). Operating margin
calculated as revenue less operating expenses.
2. Value creation equal to current New Afton analyst consensus net asset value less net investment.
Achieved
commercial
production
Copper Price ($/lb)
Gold Price ($/oz)
Foreign Exchange (CDN/USD)
~$1,100
~$3.25
$1.05
$1,300
$2.20
$1.30
NAV ($mm)
$1,434
$530 million(1)
of free cash
flow since
mid-2012
start-up
$793
$904
Appendix 2
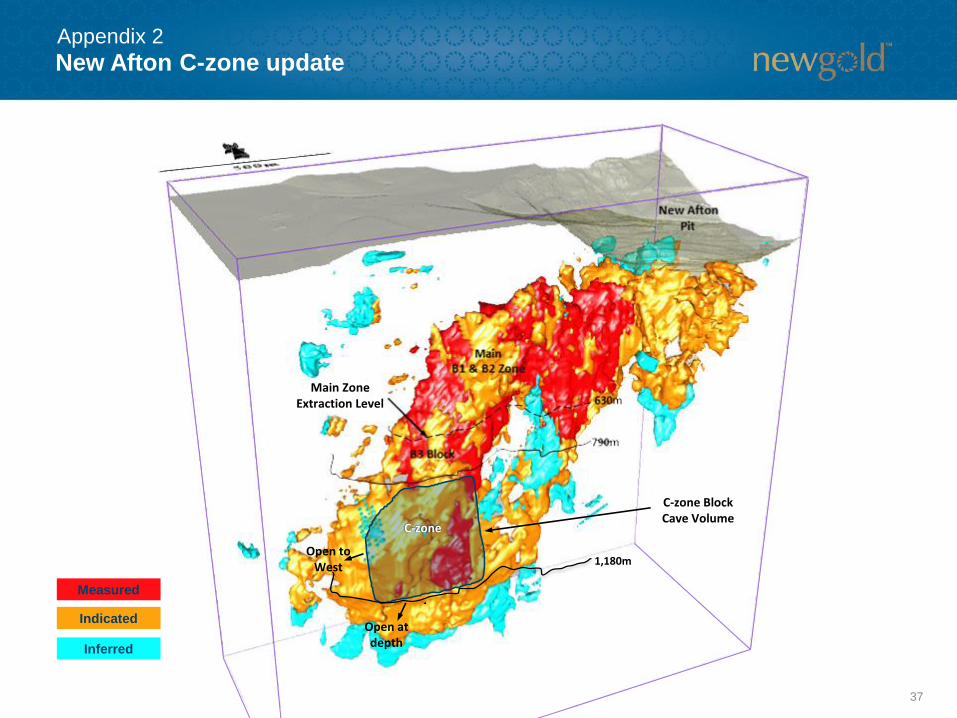
New Afton C-zone update
37
1,180m
C-zone Block Cave Volume
Open to West
Open at depth
Main Zone Extraction Level
C-zone
Measured
Indicated
Inferred
Appendix 2
381. M&I resources exclusive of reserves. For a detailed breakdown of Mineral Resources and Reserves by category, refer to New Gold’s news release dated February 17, 2016 titled “New Gold Announces 2015 financial results with record gold production
leading to strong cash flow”. Refer to Endnotes under the heading “Cautionary note to U.S. readers concerning estimates of mineral reserves and mineral resources” and “Technical Information”.
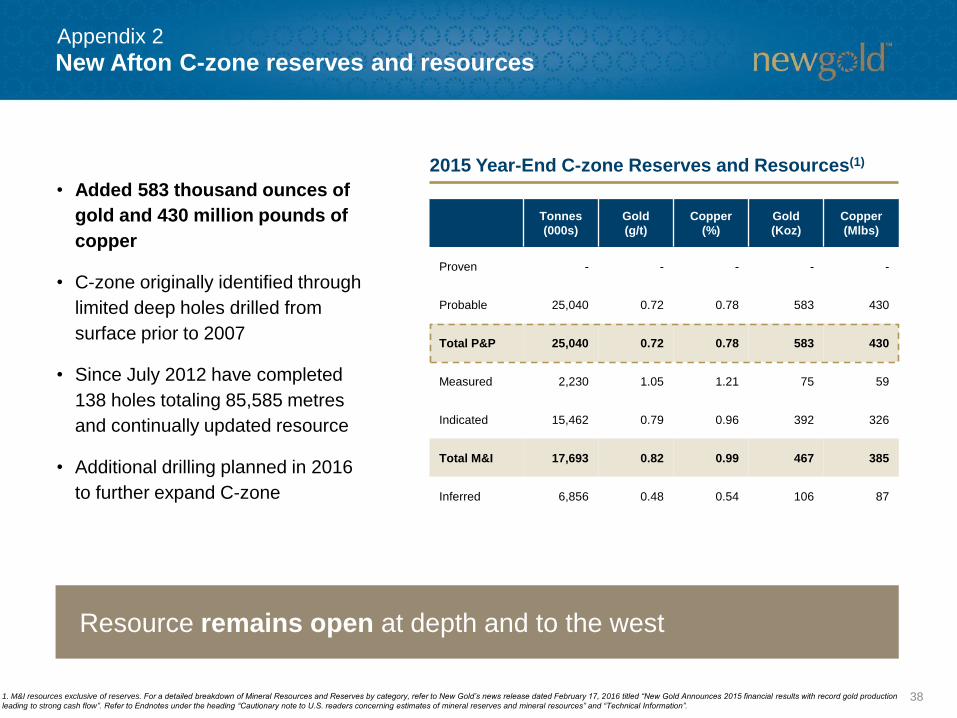
New Afton C-zone reserves and resources
Resource remains open at depth and to the west
• Added 583 thousand ounces of
gold and 430 million pounds of
copper
• C-zone originally identified through
limited deep holes drilled from
surface prior to 2007
• Since July 2012 have completed
138 holes totaling 85,585 metres
and continually updated resource
• Additional drilling planned in 2016
to further expand C-zone
Tonnes
(000s)
Gold
(g/t)
Copper
(%)
Gold
(Koz)
Copper
(Mlbs)
Proven - - - - -
Probable 25,040 0.72 0.78 583 430
Total P&P 25,040 0.72 0.78 583 430
Measured 2,230 1.05 1.21 75 59
Indicated 15,462 0.79 0.96 392 326
Total M&I 17,693 0.82 0.99 467 385
Inferred 6,856 0.48 0.54 106 87
2015 Year-End C-zone Reserves and Resources(1)
Appendix 2
New Afton C-zone – Scoping study versus feasibility study
39
2015 Scoping
Study
2016 Feasibility
Study
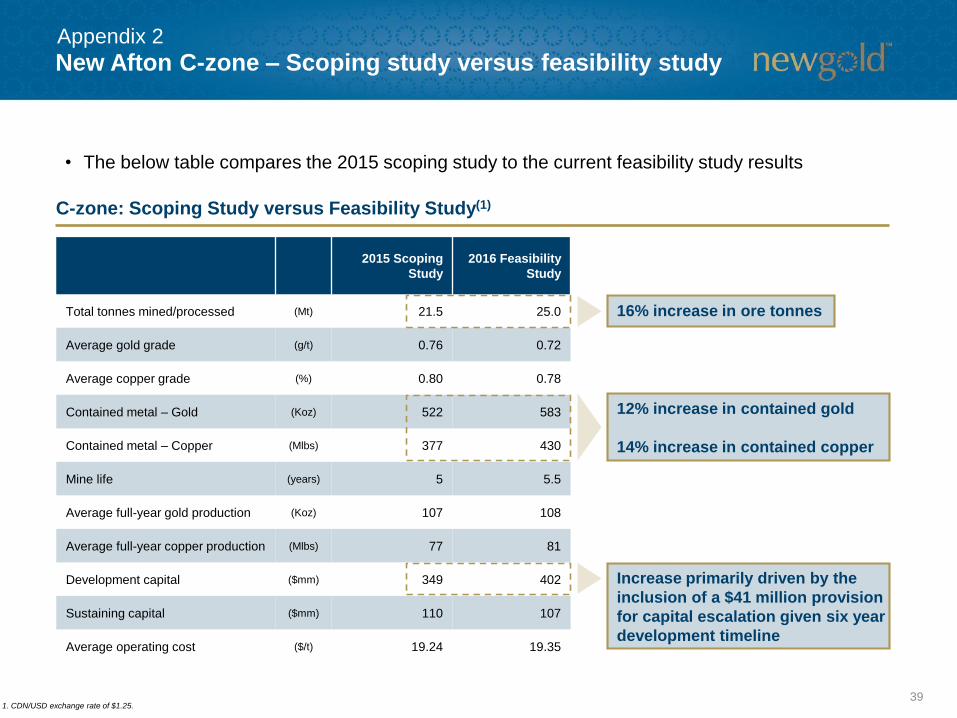
Total tonnes mined/processed (Mt) 21.5 25.0
Average gold grade (g/t) 0.76 0.72
Average copper grade (%) 0.80 0.78
Contained metal – Gold (Koz) 522 583
Contained metal – Copper (Mlbs) 377 430
Mine life (years) 5 5.5
Average full-year gold production (Koz) 107 108
Average full-year copper production (Mlbs) 77 81
Development capital ($mm) 349 402
Sustaining capital ($mm) 110 107
Average operating cost ($/t) 19.24 19.35
• The below table compares the 2015 scoping study to the current feasibility study results
C-zone: Scoping Study versus Feasibility Study(1)
16% increase in ore tonnes
Increase primarily driven by the
inclusion of a $41 million provision
for capital escalation given six year
development timeline
1. CDN/USD exchange rate of $1.25.
12% increase in contained gold
14% increase in contained copper
Appendix 2
New Afton C-zone indicative timeline
40
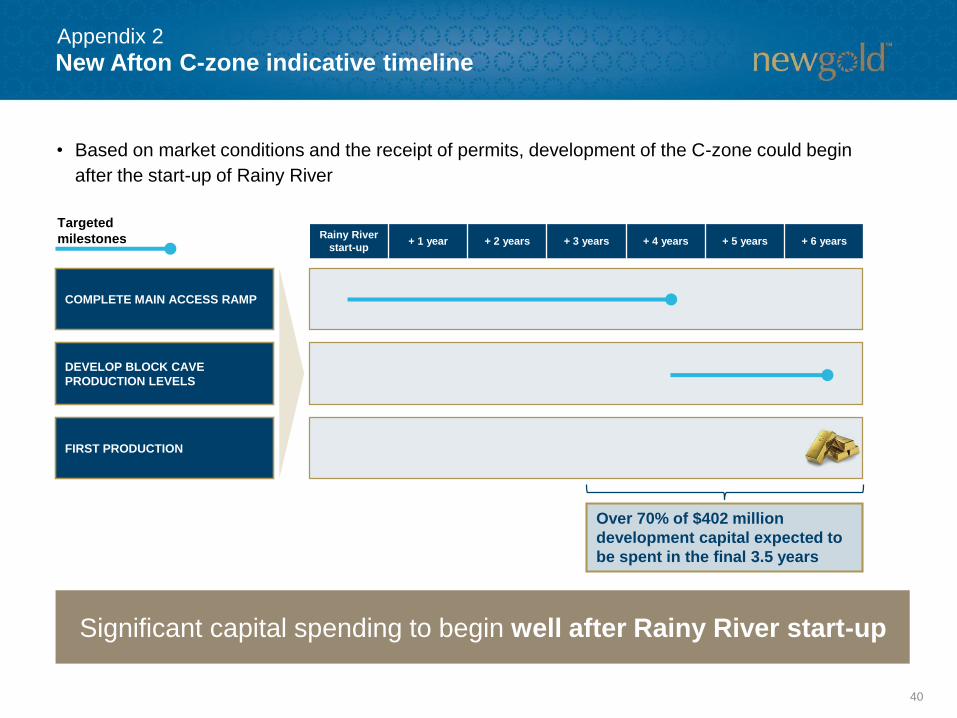
Significant capital spending to begin well after Rainy River start-up
Rainy River
start-up+ 1 year + 2 years + 3 years + 4 years + 5 years + 6 years
Targeted
milestones
FIRST PRODUCTION
DEVELOP BLOCK CAVE
PRODUCTION LEVELS
COMPLETE MAIN ACCESS RAMP
Over 70% of $402 million
development capital expected to
be spent in the final 3.5 years
• Based on market conditions and the receipt of permits, development of the C-zone could begin
after the start-up of Rainy River
Appendix 2
New Afton C-zone – Feasibility study economics
41
2015 Scoping
Study
2016 Feasibility
Study
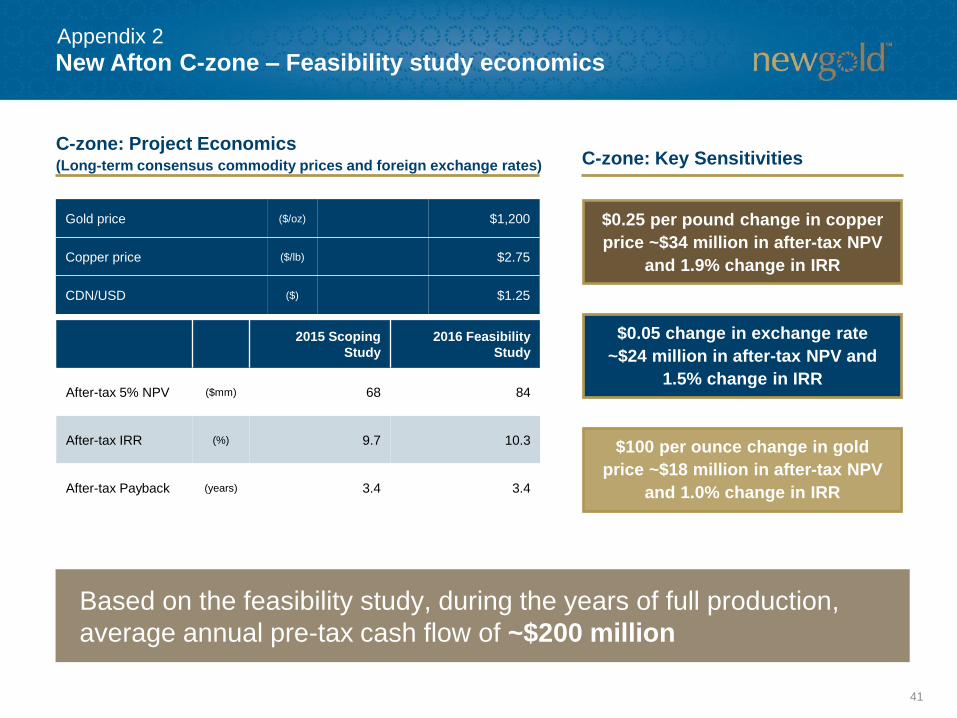
After-tax 5% NPV ($mm) 68 84
After-tax IRR (%) 9.7 10.3
After-tax Payback (years) 3.4 3.4
Gold price ($/oz) $1,200
Copper price ($/lb) $2.75
CDN/USD ($) $1.25
C-zone: Project Economics (Long-term consensus commodity prices and foreign exchange rates) C-zone: Key Sensitivities
Based on the feasibility study, during the years of full production,
average annual pre-tax cash flow of ~$200 million
$0.25 per pound change in copper
price ~$34 million in after-tax NPV
and 1.9% change in IRR
$100 per ounce change in gold
price ~$18 million in after-tax NPV
and 1.0% change in IRR
$0.05 change in exchange rate
~$24 million in after-tax NPV and
1.5% change in IRR
Appendix 2
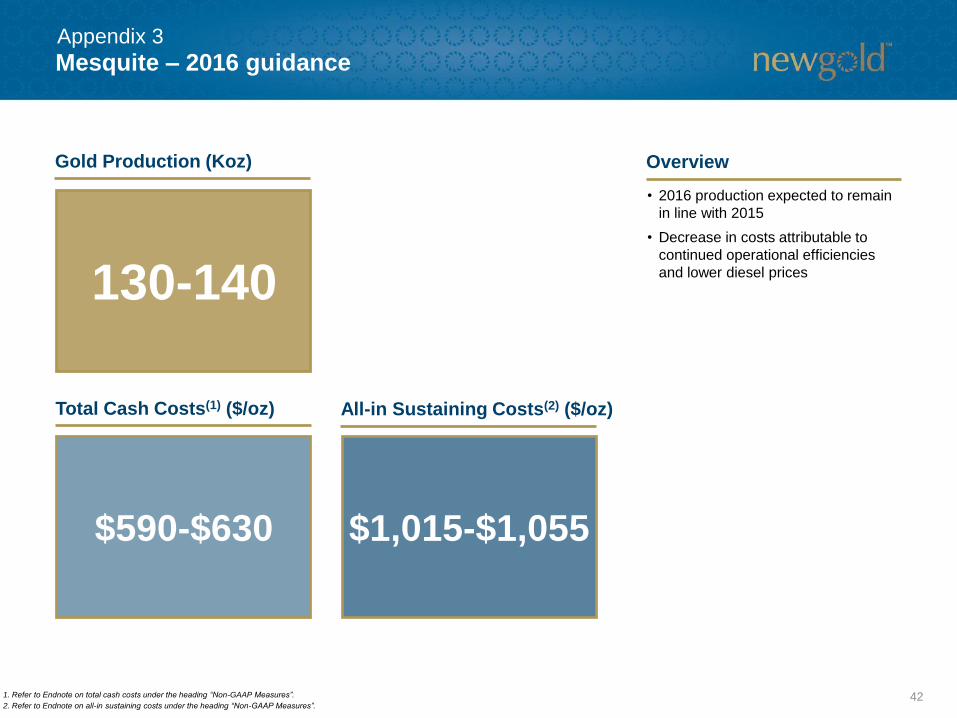
Mesquite – 2016 guidance
42
$590-$630 $1,015-$1,055
• 2016 production expected to remain
in line with 2015
• Decrease in costs attributable to
continued operational efficiencies
and lower diesel prices
1. Refer to Endnote on total cash costs under the heading “Non-GAAP Measures”.
2. Refer to Endnote on all-in sustaining costs under the heading “Non-GAAP Measures”.
Gold Production (Koz)
Total Cash Costs(1) ($/oz) All-in Sustaining Costs(2) ($/oz)
130-140
Overview
Appendix 3
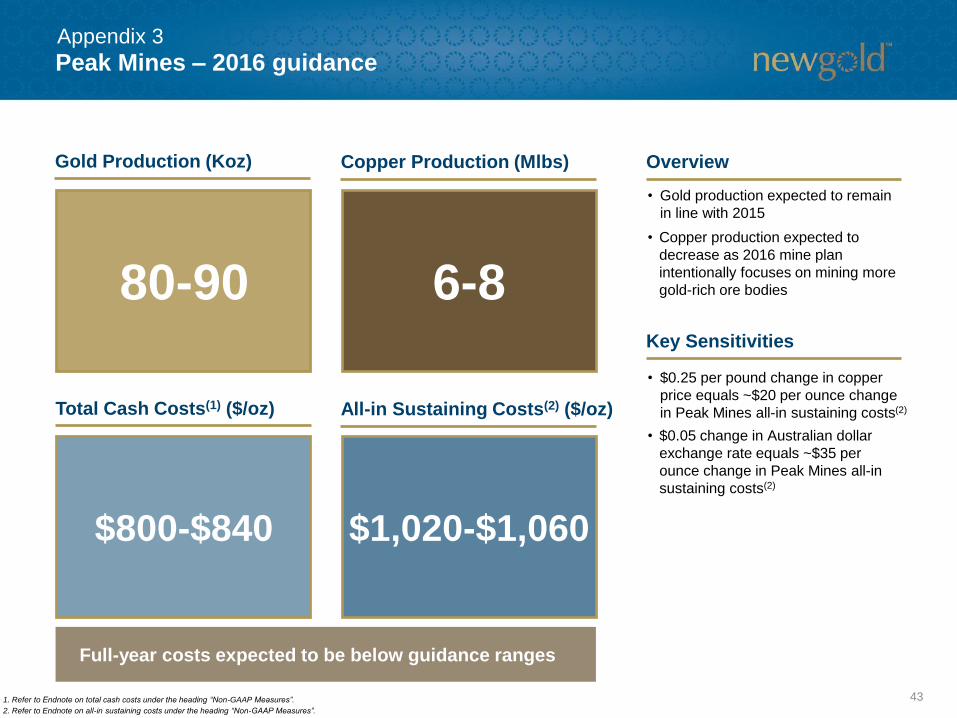
Peak Mines – 2016 guidance
43
$800-$840 $1,020-$1,060
• Gold production expected to remain
in line with 2015
• Copper production expected to
decrease as 2016 mine plan
intentionally focuses on mining more
gold-rich ore bodies
• $0.25 per pound change in copper
price equals ~$20 per ounce change
in Peak Mines all-in sustaining costs(2)
• $0.05 change in Australian dollar
exchange rate equals ~$35 per
ounce change in Peak Mines all-in
sustaining costs(2)
1. Refer to Endnote on total cash costs under the heading “Non-GAAP Measures”.
2. Refer to Endnote on all-in sustaining costs under the heading “Non-GAAP Measures”.
Gold Production (Koz) Copper Production (Mlbs)
Total Cash Costs(1) ($/oz) All-in Sustaining Costs(2) ($/oz)
80-90 6-8
Overview
Key Sensitivities
Appendix 3
Full-year costs expected to be below guidance ranges
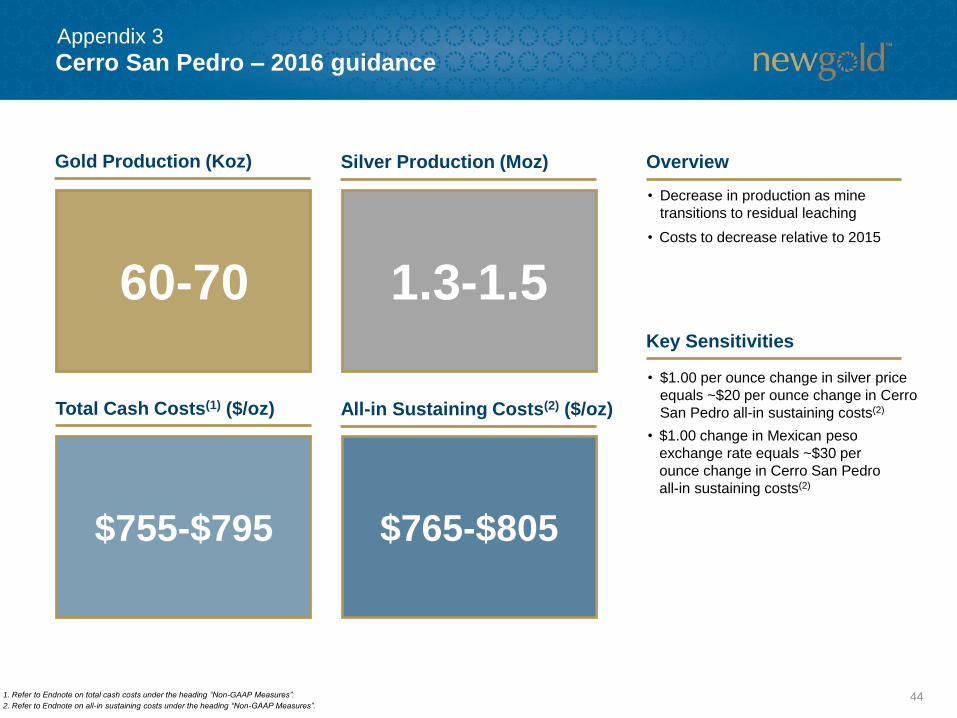
Cerro San Pedro – 2016 guidance
44
$755-$795 $765-$805
• Decrease in production as mine
transitions to residual leaching
• Costs to decrease relative to 2015
• $1.00 per ounce change in silver price
equals ~$20 per ounce change in Cerro
San Pedro all-in sustaining costs(2)
• $1.00 change in Mexican peso
exchange rate equals ~$30 per
ounce change in Cerro San Pedro
all-in sustaining costs(2)
1. Refer to Endnote on total cash costs under the heading “Non-GAAP Measures”.
2. Refer to Endnote on all-in sustaining costs under the heading “Non-GAAP Measures”.
Gold Production (Koz) Silver Production (Moz)
Total Cash Costs(1) ($/oz) All-in Sustaining Costs(2) ($/oz)
60-70 1.3-1.5
Overview
Key Sensitivities
Appendix 3

Rainy River site layout
45
Appendix 4
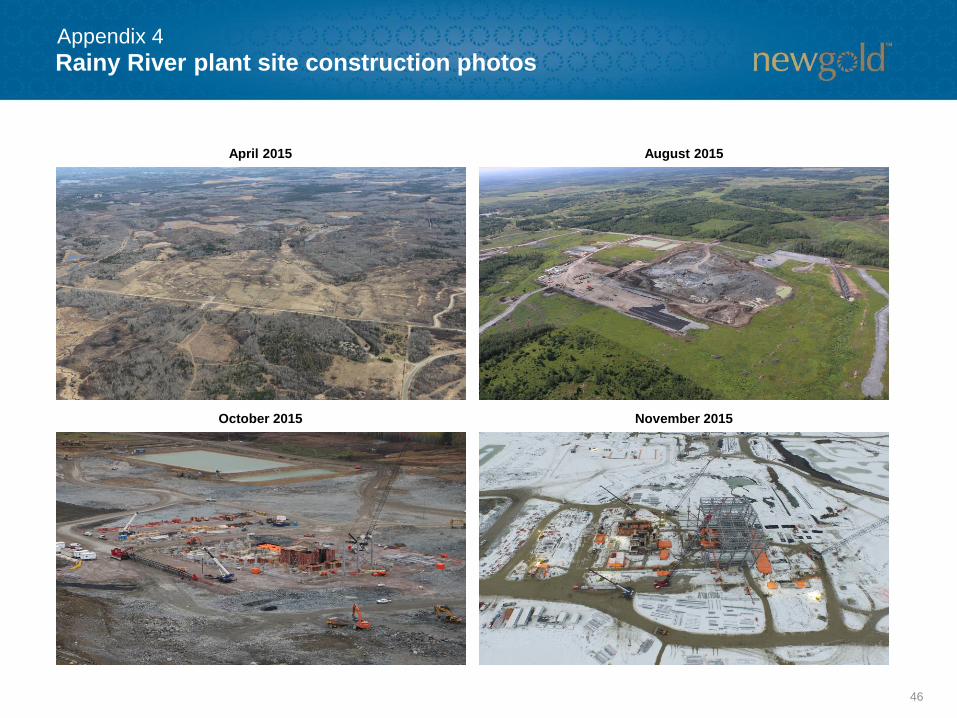
Rainy River plant site construction photos
46
August 2015April 2015
Appendix 4
November 2015October 2015
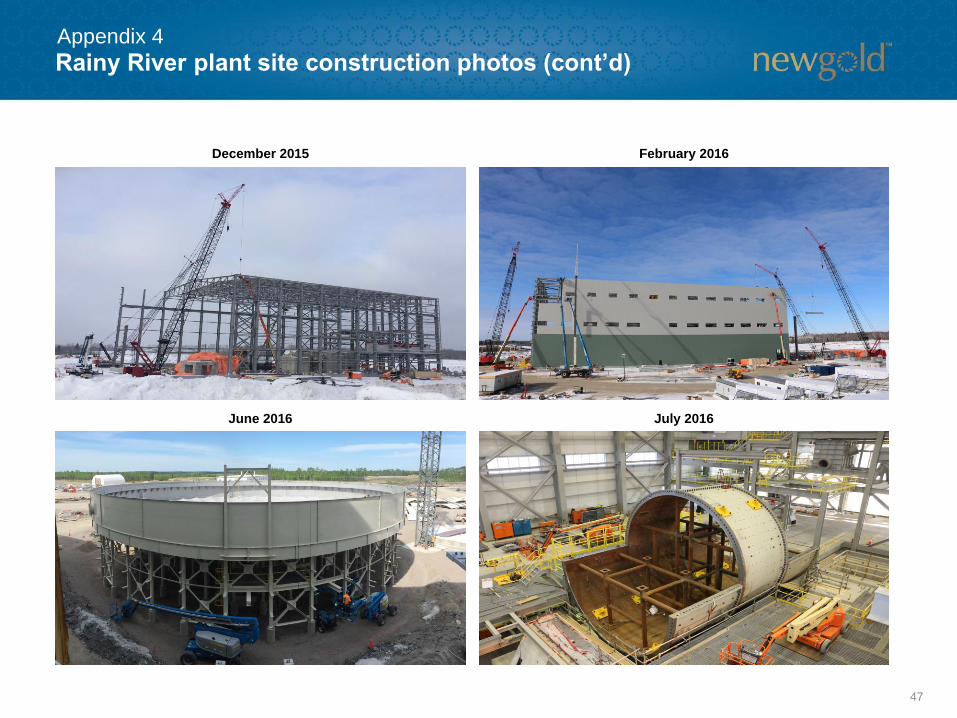
Rainy River plant site construction photos (cont’d)
47
February 2016December 2015
Appendix 4
July 2016June 2016
48
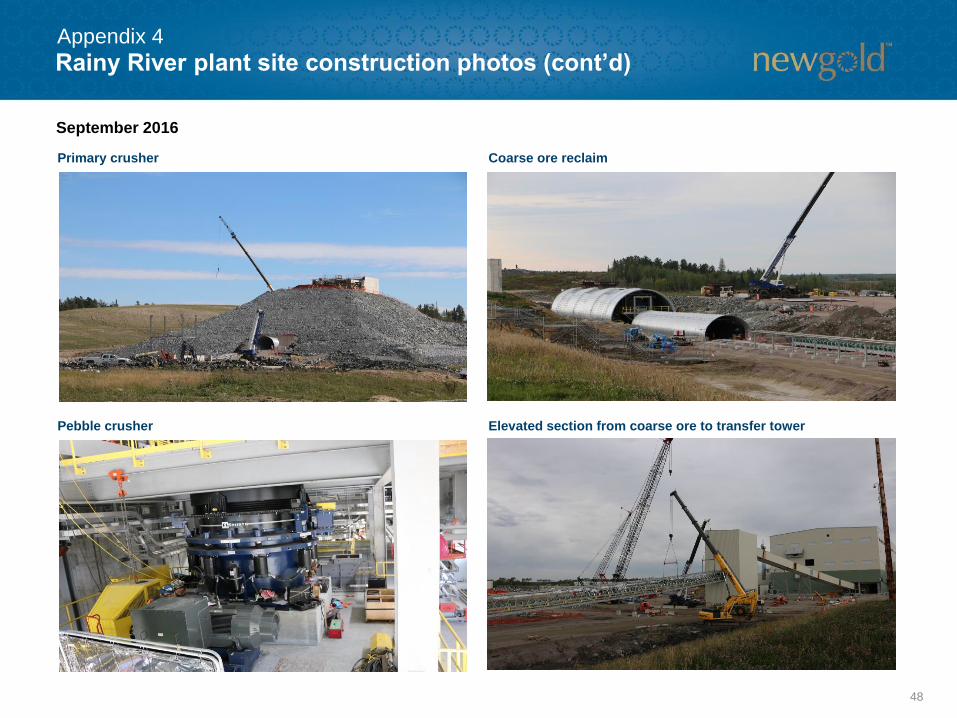
Rainy River plant site construction photos (cont’d)
Primary crusher Coarse ore reclaim
Pebble crusher Elevated section from coarse ore to transfer tower
September 2016
Appendix 4
49
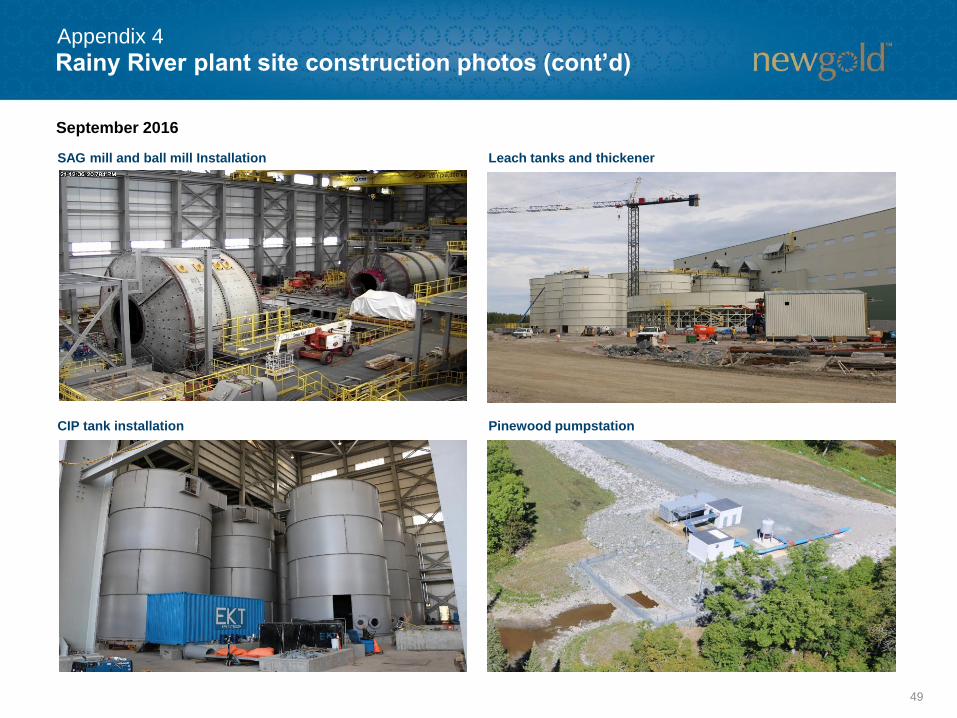
Rainy River plant site construction photos (cont’d)
SAG mill and ball mill Installation Leach tanks and thickener
CIP tank installation Pinewood pumpstation
September 2016
Appendix 4
50
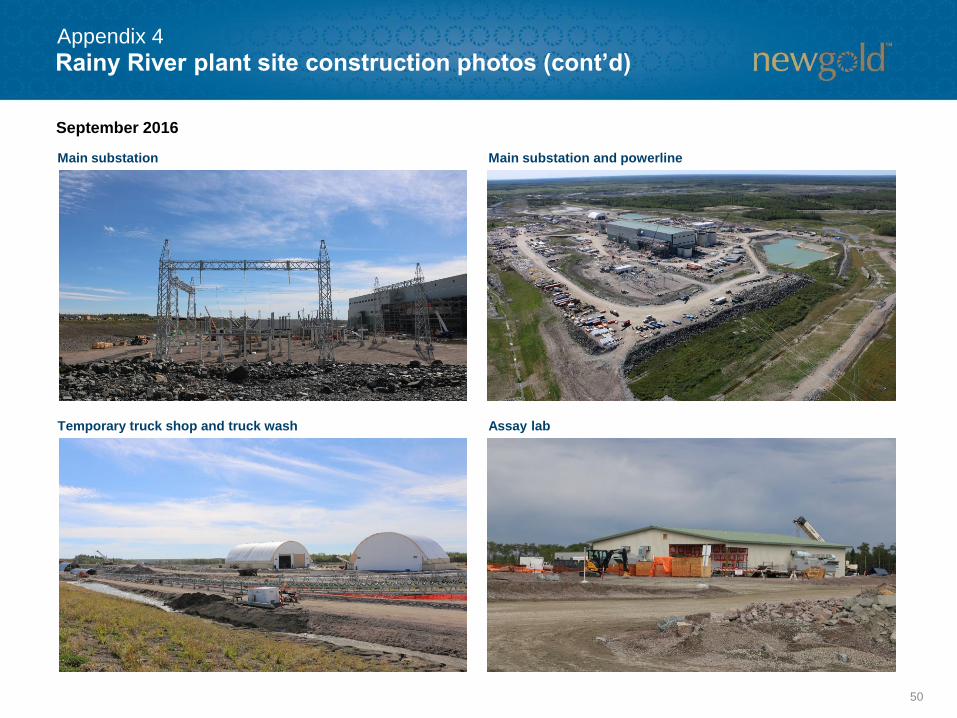
Rainy River plant site construction photos (cont’d)
Main substation Main substation and powerline
Temporary truck shop and truck wash Assay lab
September 2016
Appendix 4
51
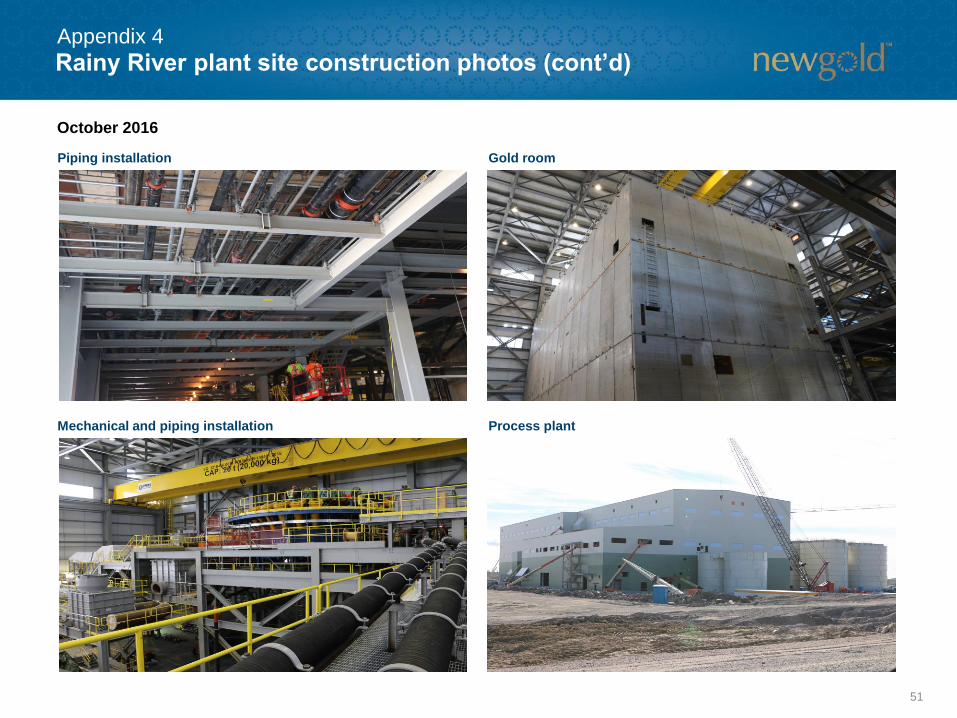
Rainy River plant site construction photos (cont’d)
Piping installation Gold room
Mechanical and piping installation Process plant
October 2016
Appendix 4
52
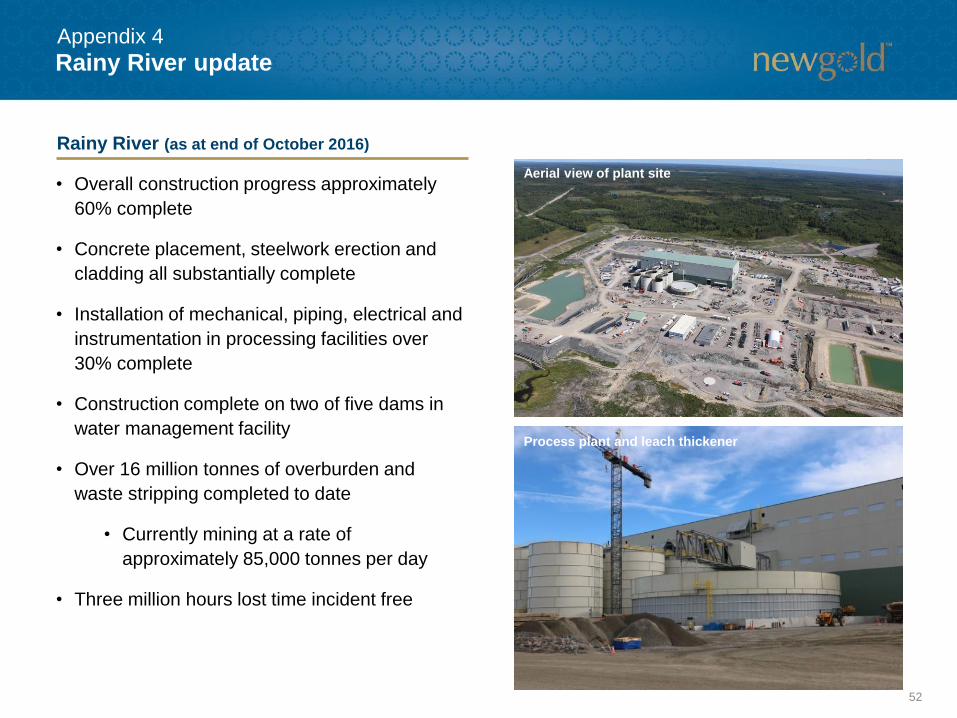
Rainy River update
• Overall construction progress approximately
60% complete
• Concrete placement, steelwork erection and
cladding all substantially complete
• Installation of mechanical, piping, electrical and
instrumentation in processing facilities over
30% complete
• Construction complete on two of five dams in
water management facility
• Over 16 million tonnes of overburden and
waste stripping completed to date
• Currently mining at a rate of
approximately 85,000 tonnes per day
• Three million hours lost time incident free
Rainy River (as at end of October 2016)
Process plant and leach thickener
Aerial view of plant site
Appendix 4
53
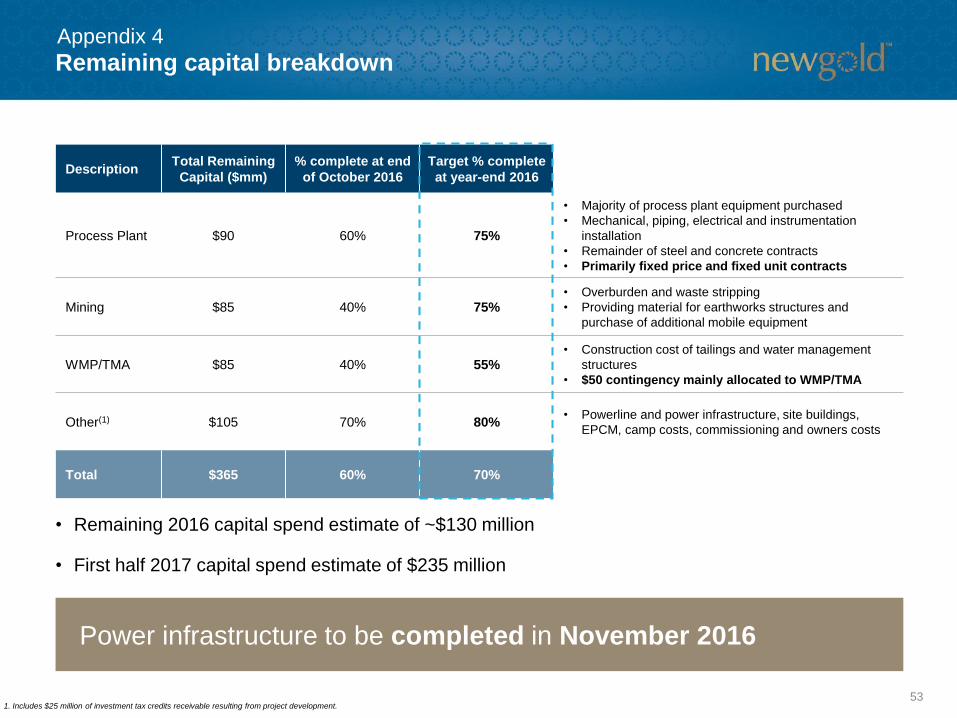
Remaining capital breakdown
DescriptionTotal Remaining
Capital ($mm)
% complete at end
of October 2016
Target % complete
at year-end 2016
Process Plant $90 60% 75%
• Majority of process plant equipment purchased
• Mechanical, piping, electrical and instrumentation
installation
• Remainder of steel and concrete contracts
• Primarily fixed price and fixed unit contracts
Mining $85 40% 75%• Overburden and waste stripping
• Providing material for earthworks structures and
purchase of additional mobile equipment
WMP/TMA $85 40% 55%• Construction cost of tailings and water management
structures
• $50 contingency mainly allocated to WMP/TMA
Other(1) $105 70% 80%• Powerline and power infrastructure, site buildings,
EPCM, camp costs, commissioning and owners costs
Total $365 60% 70%
Power infrastructure to be completed in November 2016
• Remaining 2016 capital spend estimate of ~$130 million
• First half 2017 capital spend estimate of $235 million
1. Includes $25 million of investment tax credits receivable resulting from project development.
Appendix 4
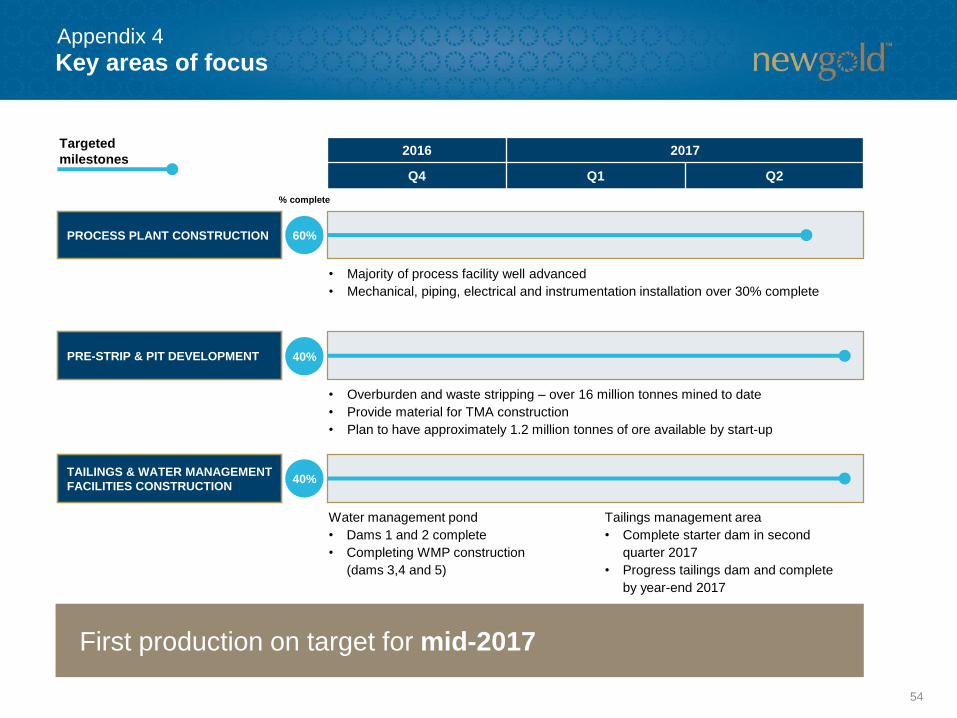
Key areas of focus
54
2016 2017
Q4 Q1 Q2
Targeted
milestones
First production on target for mid-2017
PRE-STRIP & PIT DEVELOPMENT
TAILINGS & WATER MANAGEMENT
FACILITIES CONSTRUCTION
PROCESS PLANT CONSTRUCTION
• Majority of process facility well advanced
• Mechanical, piping, electrical and instrumentation installation over 30% complete
Water management pond
• Dams 1 and 2 complete
• Completing WMP construction
(dams 3,4 and 5)
• Overburden and waste stripping – over 16 million tonnes mined to date
• Provide material for TMA construction
• Plan to have approximately 1.2 million tonnes of ore available by start-up
60%
% complete
40%
40%
Tailings management area
• Complete starter dam in second
quarter 2017
• Progress tailings dam and complete
by year-end 2017
Appendix 4
55
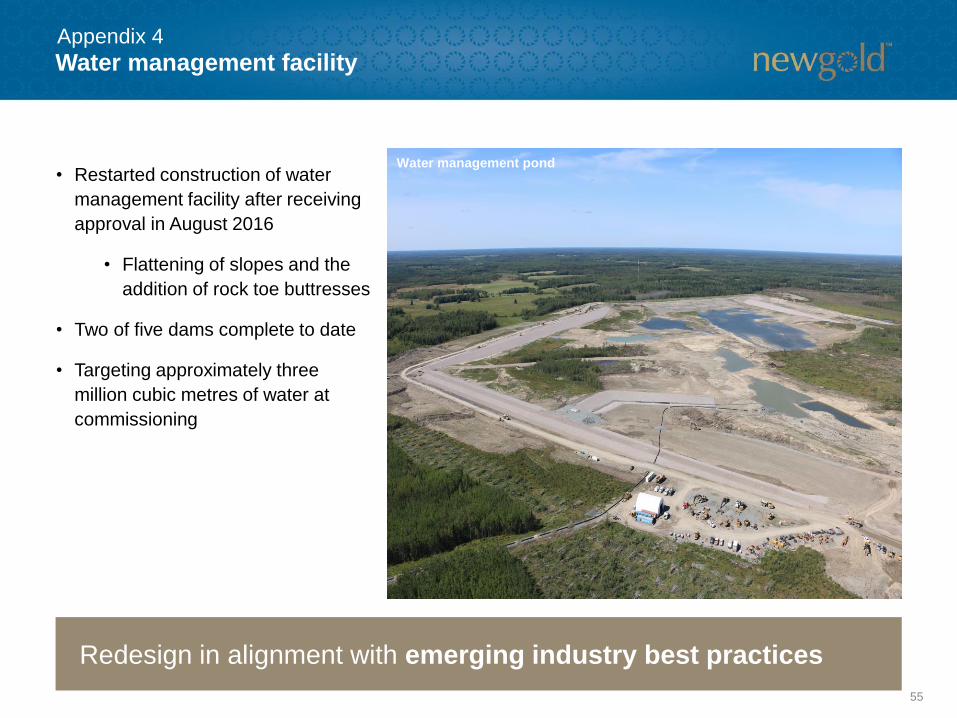
Water management facility
• Restarted construction of water
management facility after receiving
approval in August 2016
• Flattening of slopes and the
addition of rock toe buttresses
• Two of five dams complete to date
• Targeting approximately three
million cubic metres of water at
commissioning
Redesign in alignment with emerging industry best practices
Water management pond
Appendix 4
56
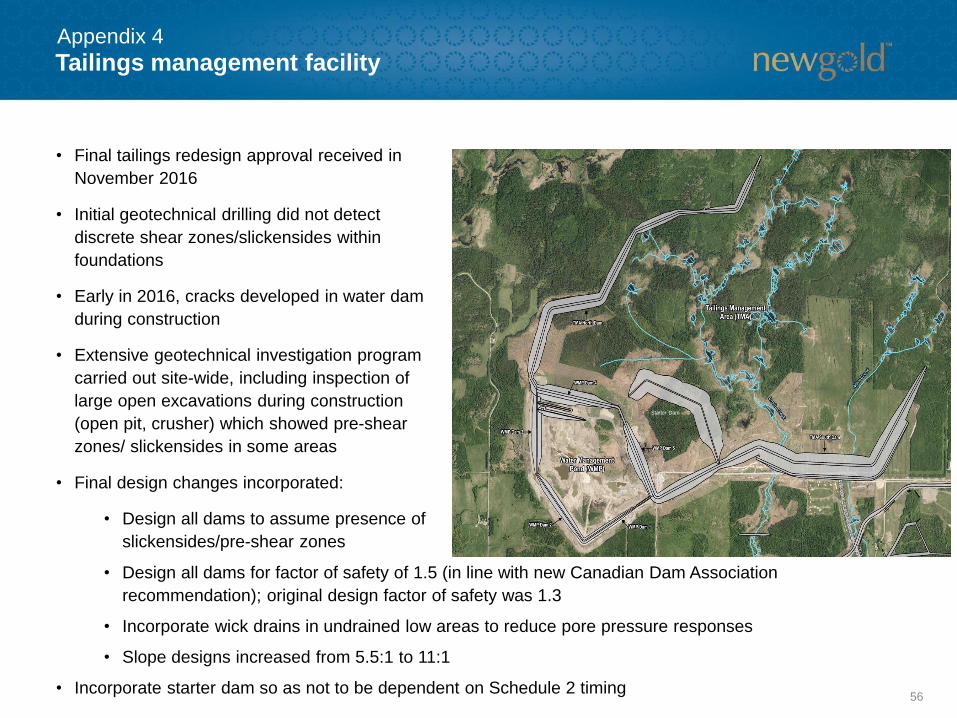
Tailings management facility
• Final tailings redesign approval received in
November 2016
• Initial geotechnical drilling did not detect
discrete shear zones/slickensides within
foundations
• Early in 2016, cracks developed in water dam
during construction
• Extensive geotechnical investigation program
carried out site-wide, including inspection of
large open excavations during construction
(open pit, crusher) which showed pre-shear
zones/ slickensides in some areas
• Final design changes incorporated:
• Design all dams to assume presence of
slickensides/pre-shear zones
• Design all dams for factor of safety of 1.5 (in line with new Canadian Dam Association
recommendation); original design factor of safety was 1.3
• Incorporate wick drains in undrained low areas to reduce pore pressure responses
• Slope designs increased from 5.5:1 to 11:1
• Incorporate starter dam so as not to be dependent on Schedule 2 timing
Starter Dam
Appendix 4
57
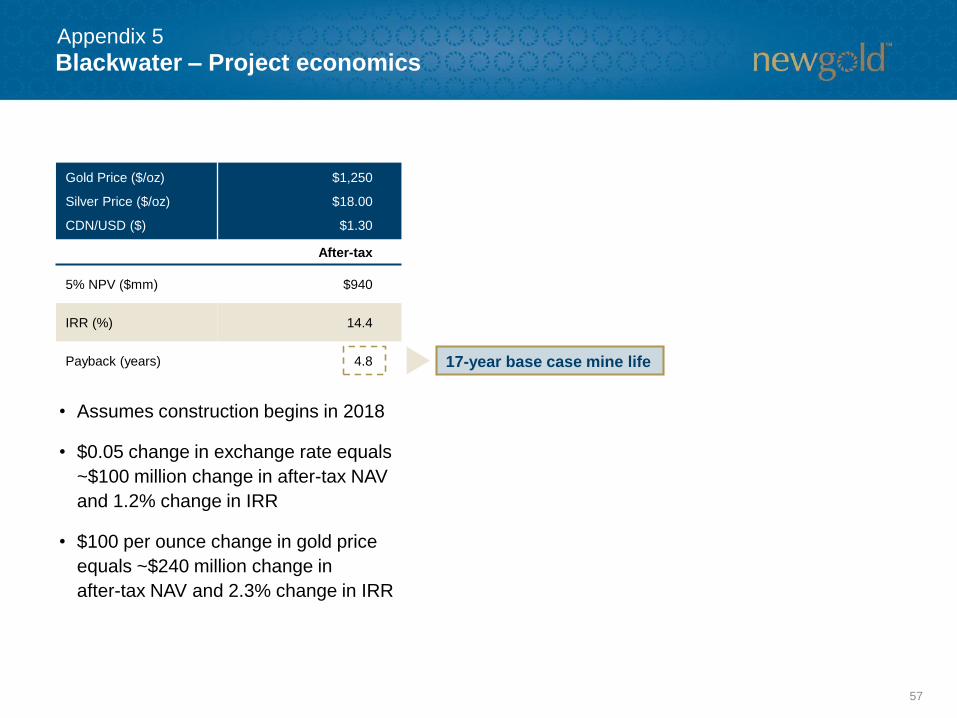
Blackwater – Project economics
• Assumes construction begins in 2018
• $0.05 change in exchange rate equals
~$100 million change in after-tax NAV
and 1.2% change in IRR
• $100 per ounce change in gold price
equals ~$240 million change in
after-tax NAV and 2.3% change in IRR
Gold Price ($/oz)
Silver Price ($/oz)
CDN/USD ($)
$1,250
$18.00
$1.30
After-tax
5% NPV ($mm) $940
IRR (%) 14.4
Payback (years) 4.8
Appendix 5
17-year base case mine life
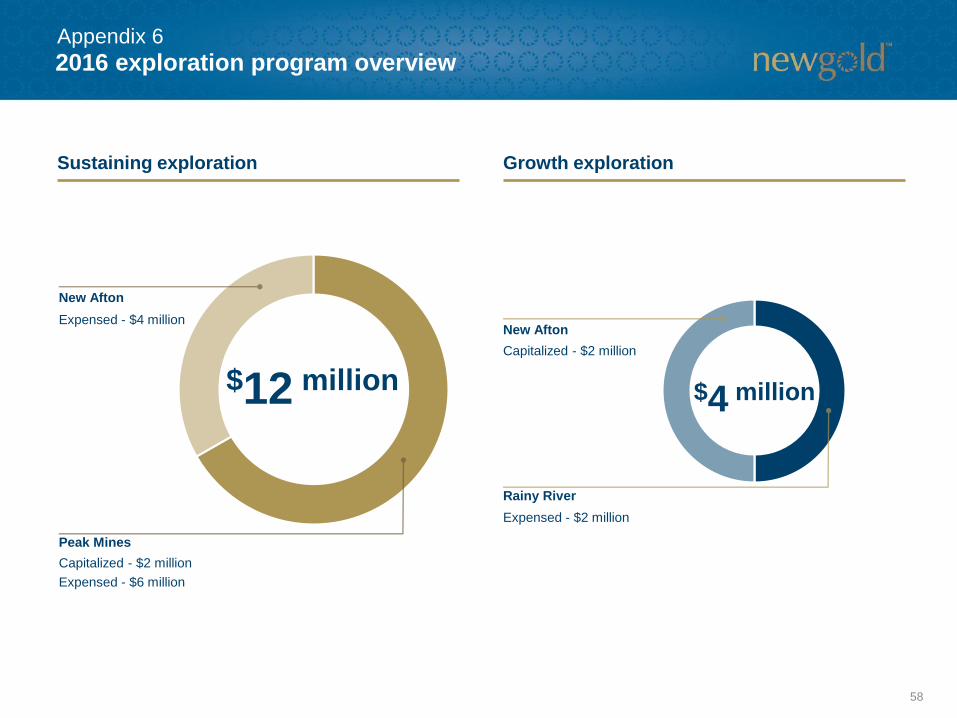
2016 exploration program overview
58
Rainy River
$4 million
Expensed - $2 million
New Afton
Sustaining exploration Growth exploration
$12 millionCapitalized - $2 million
Peak Mines
Capitalized - $2 million
Expensed - $6 million
New Afton
Expensed - $4 million
Appendix 6
2016 exploration program overview
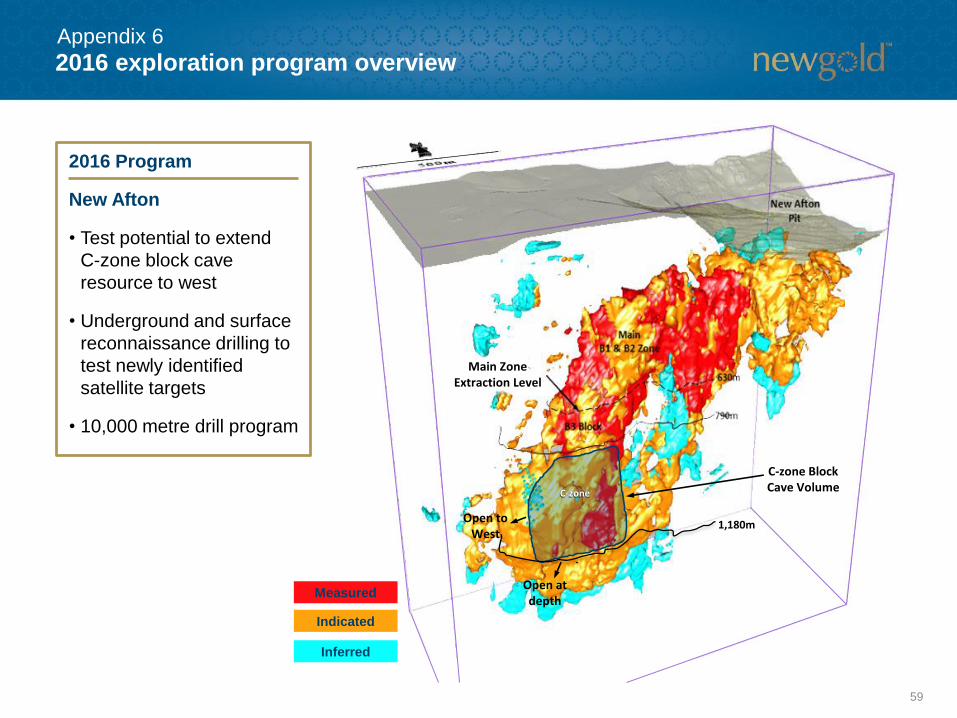
59
1,180m
C-zone Block Cave Volume
Open to West
Open at depth
Main Zone Extraction Level
C-zone
Measured
Indicated
Inferred
2016 Program
New Afton
• Test potential to extend
C-zone block cave
resource to west
• Underground and surface
reconnaissance drilling to
test newly identified
satellite targets
• 10,000 metre drill program
Appendix 6

2016 exploration program overview (cont’d)
60
2016 Program
Rainy River
• Continue to advance district reconnaissance and target identification
Peak Mines
• Chronos – underground diamond drilling to expand inferred status and upgrade central gold lens to M&I status
• Anjea – surface diamond drilling to delineate resource to inferred status
• Mine Corridor – surface and underground drilling to test newly identified mine corridor targets at Burrabungie,
Dapville, Gladstone, Mt. Pleasant, Young Australian
Appendix 6
Positive results from
initial reconnaissance
drilling
Proteus
2016: 10,000
metres of drilling
2016: 10,000
metres of drilling
611. 2014 information per Annual Information Form dated March 27, 2015.
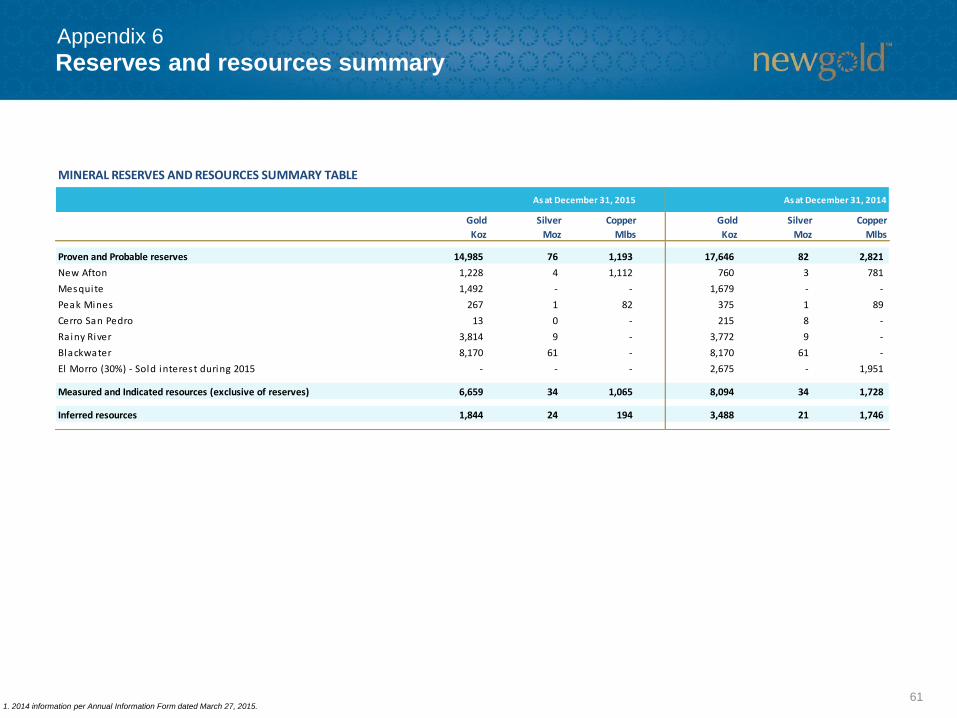
Reserves and resources summaryAppendix 6
Gold
Koz
Silver
Moz
Copper
Mlbs
Gold
Koz
Silver
Moz
Copper
Mlbs
Proven and Probable reserves 14,985 76 1,193 17,646 82 2,821
New Afton 1,228 4 1,112 760 3 781
Mesquite 1,492 - - 1,679 - -
Peak Mines 267 1 82 375 1 89
Cerro San Pedro 13 0 - 215 8 -
Ra iny River 3,814 9 - 3,772 9 -
Blackwater 8,170 61 - 8,170 61 -
El Morro (30%) - Sold interest during 2015 - - - 2,675 - 1,951
Measured and Indicated resources (exclusive of reserves) 6,659 34 1,065 8,094 34 1,728
Inferred resources 1,844 24 194 3,488 21 1,746
MINERAL RESERVES AND RESOURCES SUMMARY TABLE
As at December 31, 2015 As at December 31, 2014
62
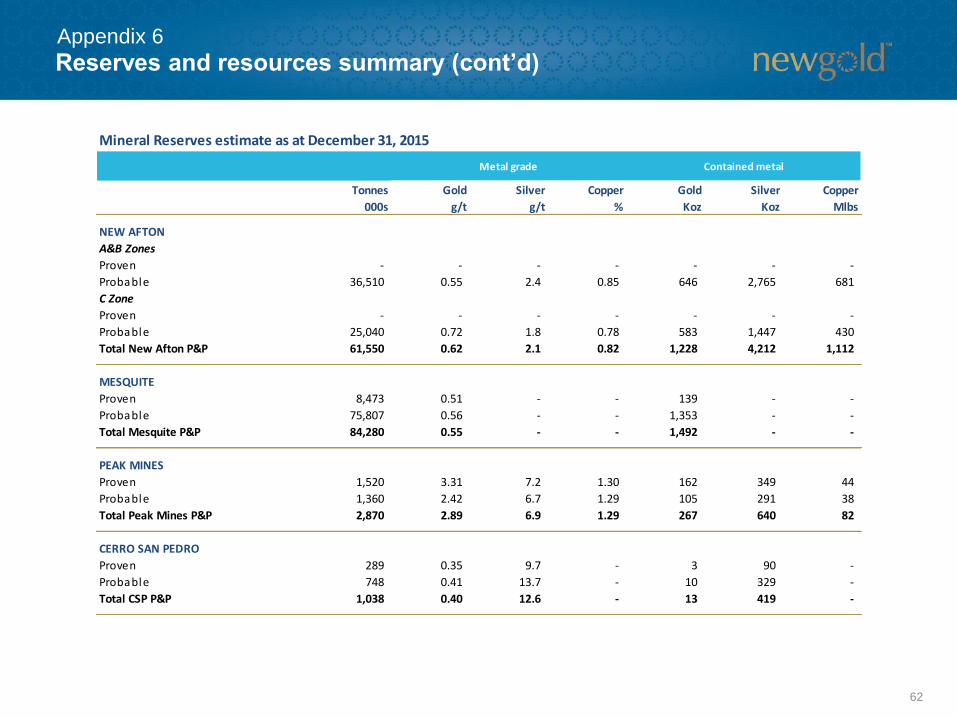
Reserves and resources summary (cont’d)Appendix 6
Mineral Reserves estimate as at December 31, 2015
Tonnes
000s
Gold
g/t
Silver
g/t
Copper
%
Gold
Koz
Silver
Koz
Copper
Mlbs
NEW AFTON
A&B Zones
Proven - - - - - - -
Probable 36,510 0.55 2.4 0.85 646 2,765 681
C Zone
Proven - - - - - - -
Probable 25,040 0.72 1.8 0.78 583 1,447 430
Total New Afton P&P 61,550 0.62 2.1 0.82 1,228 4,212 1,112
MESQUITE
Proven 8,473 0.51 - - 139 - -
Probable 75,807 0.56 - - 1,353 - -
Total Mesquite P&P 84,280 0.55 - - 1,492 - -
PEAK MINES
Proven 1,520 3.31 7.2 1.30 162 349 44
Probable 1,360 2.42 6.7 1.29 105 291 38
Total Peak Mines P&P 2,870 2.89 6.9 1.29 267 640 82
CERRO SAN PEDRO
Proven 289 0.35 9.7 - 3 90 -
Probable 748 0.41 13.7 - 10 329 -
Total CSP P&P 1,038 0.40 12.6 - 13 419 -
Metal grade Contained metal
63
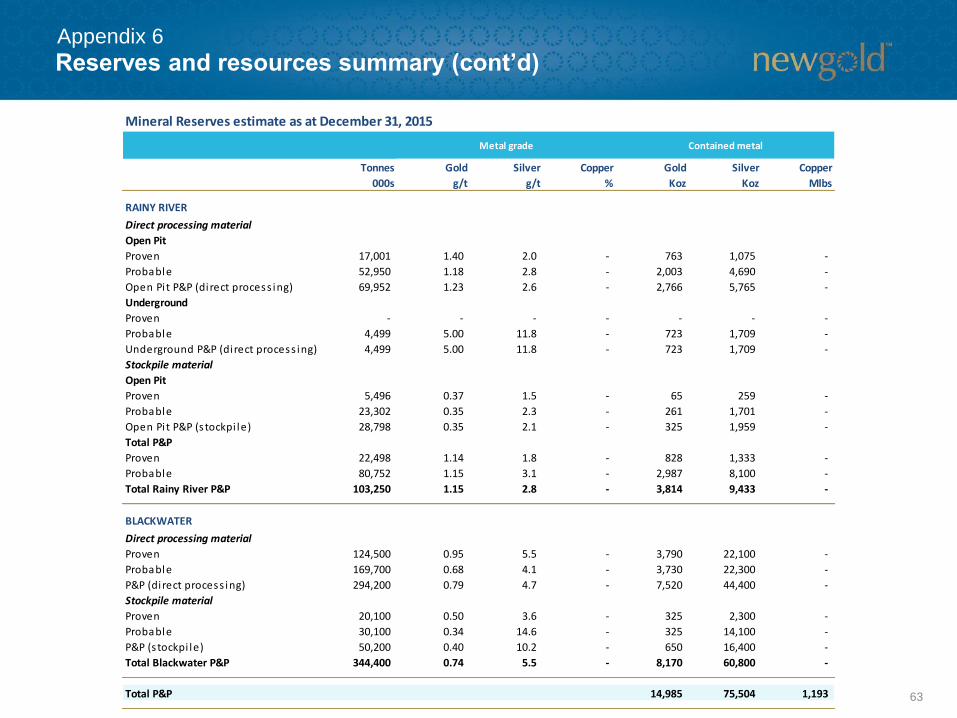
Reserves and resources summary (cont’d)Appendix 6
Mineral Reserves estimate as at December 31, 2015
Tonnes
000s
Gold
g/t
Silver
g/t
Copper
%
Gold
Koz
Silver
Koz
Copper
Mlbs
RAINY RIVER
Direct processing material
Open Pit
Proven 17,001 1.40 2.0 - 763 1,075 -
Probable 52,950 1.18 2.8 - 2,003 4,690 -
Open Pi t P&P (direct process ing) 69,952 1.23 2.6 - 2,766 5,765 -
Underground
Proven - - - - - - -
Probable 4,499 5.00 11.8 - 723 1,709 -
Underground P&P (direct process ing) 4,499 5.00 11.8 - 723 1,709 -
Stockpile material
Open Pit
Proven 5,496 0.37 1.5 - 65 259 -
Probable 23,302 0.35 2.3 - 261 1,701 -
Open Pi t P&P (s tockpi le) 28,798 0.35 2.1 - 325 1,959 -
Total P&P
Proven 22,498 1.14 1.8 - 828 1,333 -
Probable 80,752 1.15 3.1 - 2,987 8,100 -
Total Rainy River P&P 103,250 1.15 2.8 - 3,814 9,433 -
BLACKWATER
Direct processing material
Proven 124,500 0.95 5.5 - 3,790 22,100 -
Probable 169,700 0.68 4.1 - 3,730 22,300 -
P&P (direct process ing) 294,200 0.79 4.7 - 7,520 44,400 -
Stockpile material
Proven 20,100 0.50 3.6 - 325 2,300 -
Probable 30,100 0.34 14.6 - 325 14,100 -
P&P (s tockpi le) 50,200 0.40 10.2 - 650 16,400 -
Total Blackwater P&P 344,400 0.74 5.5 - 8,170 60,800 -
Total P&P 14,985 75,504 1,193
Metal grade Contained metal
64
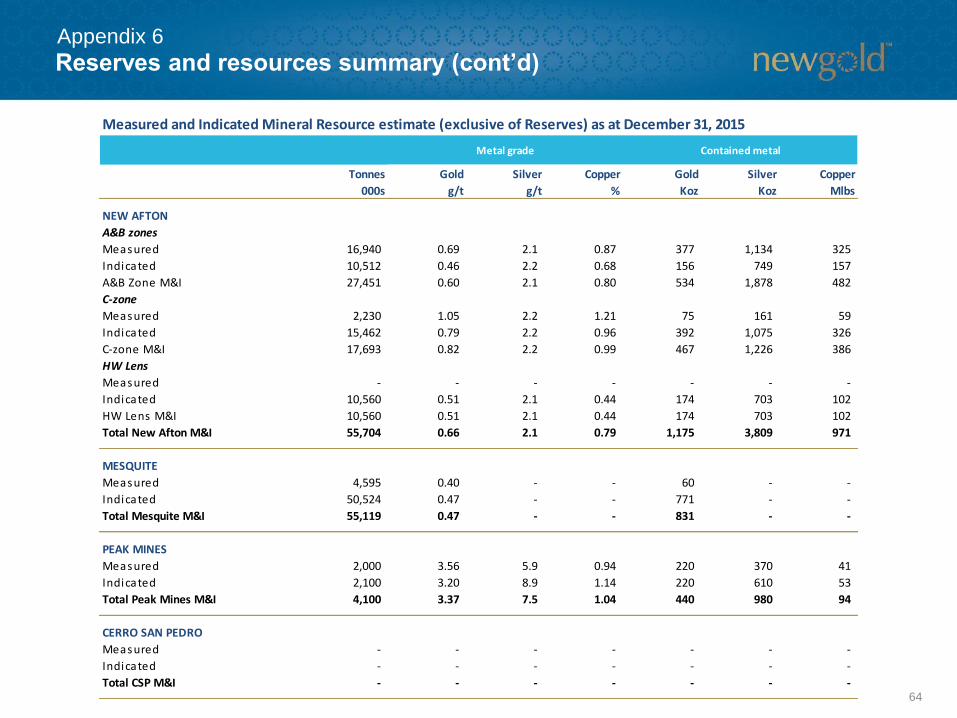
Reserves and resources summary (cont’d)Appendix 6
Measured and Indicated Mineral Resource estimate (exclusive of Reserves) as at December 31, 2015
Tonnes
000s
Gold
g/t
Silver
g/t
Copper
%
Gold
Koz
Silver
Koz
Copper
Mlbs
NEW AFTON
A&B zones
Measured 16,940 0.69 2.1 0.87 377 1,134 325
Indicated 10,512 0.46 2.2 0.68 156 749 157
A&B Zone M&I 27,451 0.60 2.1 0.80 534 1,878 482
C-zone
Measured 2,230 1.05 2.2 1.21 75 161 59
Indicated 15,462 0.79 2.2 0.96 392 1,075 326
C-zone M&I 17,693 0.82 2.2 0.99 467 1,226 386
HW Lens
Measured - - - - - - -
Indicated 10,560 0.51 2.1 0.44 174 703 102
HW Lens M&I 10,560 0.51 2.1 0.44 174 703 102
Total New Afton M&I 55,704 0.66 2.1 0.79 1,175 3,809 971
MESQUITE
Measured 4,595 0.40 - - 60 - -
Indicated 50,524 0.47 - - 771 - -
Total Mesquite M&I 55,119 0.47 - - 831 - -
PEAK MINES
Measured 2,000 3.56 5.9 0.94 220 370 41
Indicated 2,100 3.20 8.9 1.14 220 610 53
Total Peak Mines M&I 4,100 3.37 7.5 1.04 440 980 94
CERRO SAN PEDRO
Measured - - - - - - -
Indicated - - - - - - -
Total CSP M&I - - - - - - -
Metal grade Contained metal
65
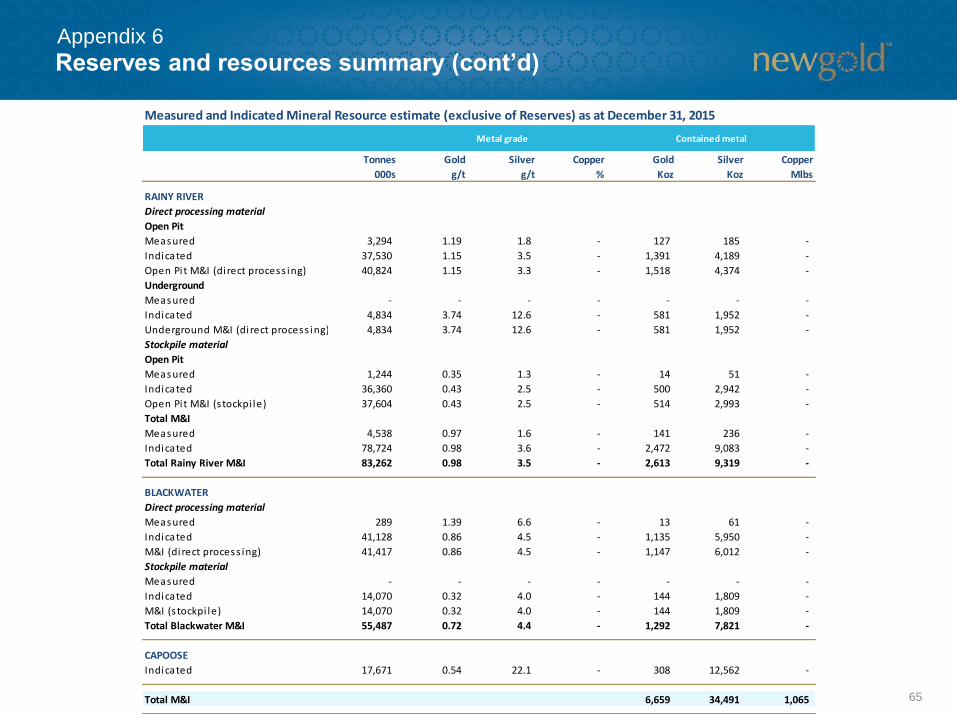
Reserves and resources summary (cont’d)Appendix 6
Measured and Indicated Mineral Resource estimate (exclusive of Reserves) as at December 31, 2015
Tonnes
000s
Gold
g/t
Silver
g/t
Copper
%
Gold
Koz
Silver
Koz
Copper
Mlbs
RAINY RIVER
Direct processing material
Open Pit
Measured 3,294 1.19 1.8 - 127 185 -
Indicated 37,530 1.15 3.5 - 1,391 4,189 -
Open Pi t M&I (direct process ing) 40,824 1.15 3.3 - 1,518 4,374 -
Underground
Measured - - - - - - -
Indicated 4,834 3.74 12.6 - 581 1,952 -
Underground M&I (direct process ing) 4,834 3.74 12.6 - 581 1,952 -
Stockpile material
Open Pit
Measured 1,244 0.35 1.3 - 14 51 -
Indicated 36,360 0.43 2.5 - 500 2,942 -
Open Pi t M&I (s tockpi le) 37,604 0.43 2.5 - 514 2,993 -
Total M&I
Measured 4,538 0.97 1.6 - 141 236 -
Indicated 78,724 0.98 3.6 - 2,472 9,083 -
Total Rainy River M&I 83,262 0.98 3.5 - 2,613 9,319 -
BLACKWATER
Direct processing material
Measured 289 1.39 6.6 - 13 61 -
Indicated 41,128 0.86 4.5 - 1,135 5,950 -
M&I (direct process ing) 41,417 0.86 4.5 - 1,147 6,012 -
Stockpile material
Measured - - - - - - -
Indicated 14,070 0.32 4.0 - 144 1,809 -
M&I (s tockpi le) 14,070 0.32 4.0 - 144 1,809 -
Total Blackwater M&I 55,487 0.72 4.4 - 1,292 7,821 -
CAPOOSE
Indicated 17,671 0.54 22.1 - 308 12,562 -
Total M&I 6,659 34,491 1,065
Metal grade Contained metal
66
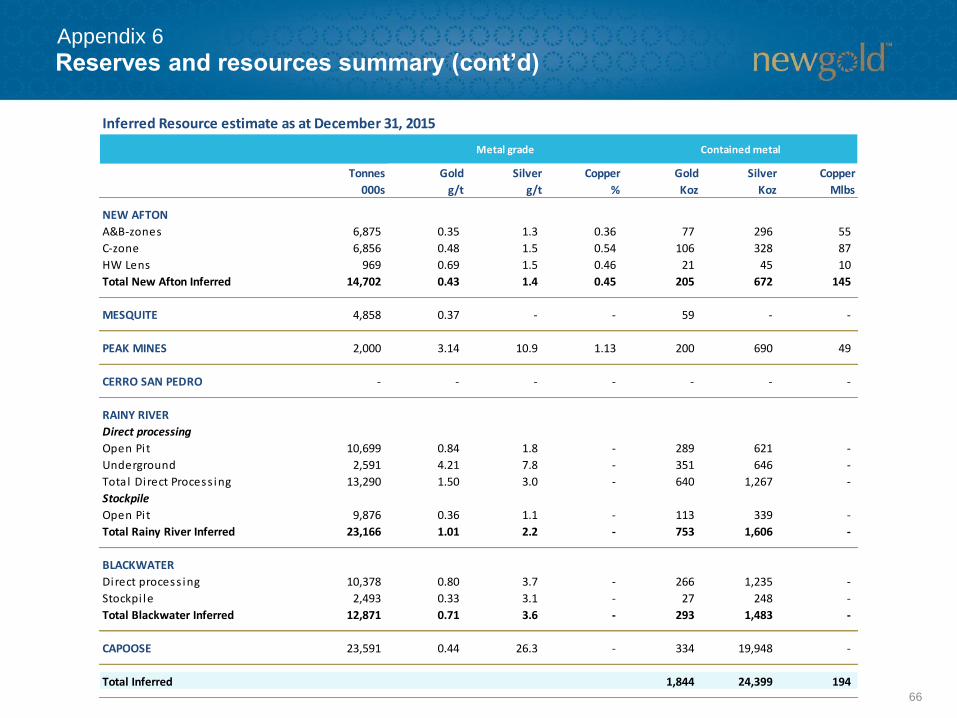
Reserves and resources summary (cont’d)Appendix 6
Inferred Resource estimate as at December 31, 2015
Tonnes
000s
Gold
g/t
Silver
g/t
Copper
%
Gold
Koz
Silver
Koz
Copper
Mlbs
NEW AFTON
A&B-zones 6,875 0.35 1.3 0.36 77 296 55
C-zone 6,856 0.48 1.5 0.54 106 328 87
HW Lens 969 0.69 1.5 0.46 21 45 10
Total New Afton Inferred 14,702 0.43 1.4 0.45 205 672 145
MESQUITE 4,858 0.37 - - 59 - -
PEAK MINES 2,000 3.14 10.9 1.13 200 690 49
CERRO SAN PEDRO - - - - - - -
RAINY RIVER
Direct processing
Open Pit 10,699 0.84 1.8 - 289 621 -
Underground 2,591 4.21 7.8 - 351 646 -
Total Direct Process ing 13,290 1.50 3.0 - 640 1,267 -
Stockpile
Open Pit 9,876 0.36 1.1 - 113 339 -
Total Rainy River Inferred 23,166 1.01 2.2 - 753 1,606 -
BLACKWATER
Direct process ing 10,378 0.80 3.7 - 266 1,235 -
Stockpi le 2,493 0.33 3.1 - 27 248 -
Total Blackwater Inferred 12,871 0.71 3.6 - 293 1,483 -
CAPOOSE 23,591 0.44 26.3 - 334 19,948 -
Total Inferred 1,844 24,399 194
Metal grade Contained metal
67
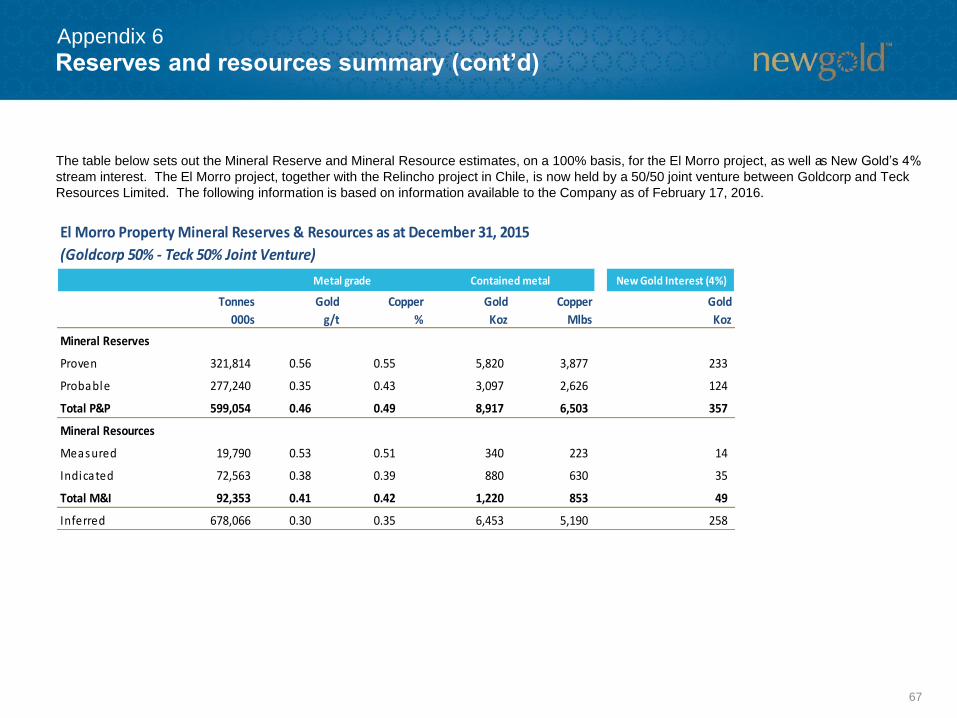
Reserves and resources summary (cont’d)Appendix 6
New Gold Interest (4%)
Tonnes
000s
Gold
g/t
Copper
%
Gold
Koz
Copper
Mlbs
Gold
Koz
Mineral Reserves
Proven 321,814 0.56 0.55 5,820 3,877 233
Probable 277,240 0.35 0.43 3,097 2,626 124
Total P&P 599,054 0.46 0.49 8,917 6,503 357
Mineral Resources
Measured 19,790 0.53 0.51 340 223 14
Indicated 72,563 0.38 0.39 880 630 35
Total M&I 92,353 0.41 0.42 1,220 853 49
Inferred 678,066 0.30 0.35 6,453 5,190 258
Metal grade Contained metal
El Morro Property Mineral Reserves & Resources as at December 31, 2015
(Goldcorp 50% - Teck 50% Joint Venture)
The table below sets out the Mineral Reserve and Mineral Resource estimates, on a 100% basis, for the El Morro project, as well as New Gold’s 4%
stream interest. The El Morro project, together with the Relincho project in Chile, is now held by a 50/50 joint venture between Goldcorp and Teck
Resources Limited. The following information is based on information available to the Company as of February 17, 2016.
68
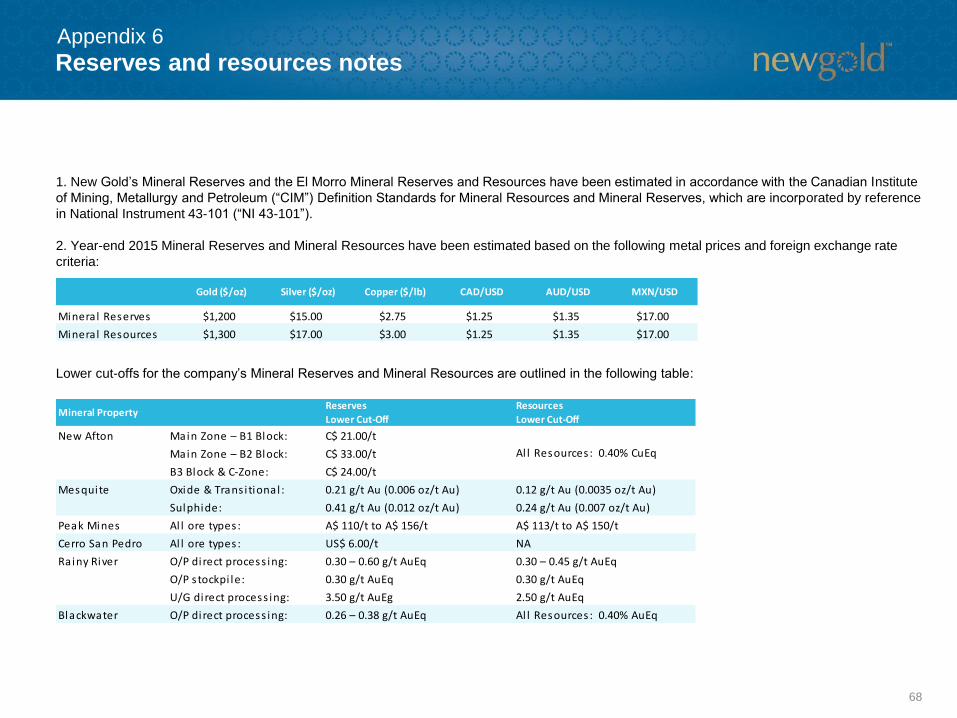
1. New Gold’s Mineral Reserves and the El Morro Mineral Reserves and Resources have been estimated in accordance with the Canadian Institute
of Mining, Metallurgy and Petroleum (“CIM”) Definition Standards for Mineral Resources and Mineral Reserves, which are incorporated by reference
in National Instrument 43-101 (“NI 43-101”).
2. Year-end 2015 Mineral Reserves and Mineral Resources have been estimated based on the following metal prices and foreign exchange rate
criteria:
Lower cut-offs for the company’s Mineral Reserves and Mineral Resources are outlined in the following table:
Reserves and resources notesAppendix 6
Gold ($/oz) Silver ($/oz) Copper ($/lb) CAD/USD AUD/USD MXN/USD
Mineral Reserves $1,200 $15.00 $2.75 $1.25 $1.35 $17.00
Mineral Resources $1,300 $17.00 $3.00 $1.25 $1.35 $17.00
Reserves Resources
Lower Cut-Off Lower Cut-Off
New Afton Main Zone – B1 Block: C$ 21.00/t
Main Zone – B2 Block: C$ 33.00/t
B3 Block & C-Zone: C$ 24.00/t
Mesquite Oxide & Trans itional : 0.21 g/t Au (0.006 oz/t Au) 0.12 g/t Au (0.0035 oz/t Au)
Sulphide: 0.41 g/t Au (0.012 oz/t Au) 0.24 g/t Au (0.007 oz/t Au)
Peak Mines Al l ore types: A$ 110/t to A$ 156/t A$ 113/t to A$ 150/t
Cerro San Pedro Al l ore types: US$ 6.00/t NA
Rainy River O/P direct process ing: 0.30 – 0.60 g/t AuEq 0.30 – 0.45 g/t AuEq
O/P stockpi le: 0.30 g/t AuEq 0.30 g/t AuEq
U/G direct process ing: 3.50 g/t AuEg 2.50 g/t AuEq
Blackwater O/P direct process ing: 0.26 – 0.38 g/t AuEq Al l Resources : 0.40% AuEq
Mineral Property
Al l Resources : 0.40% CuEq
69
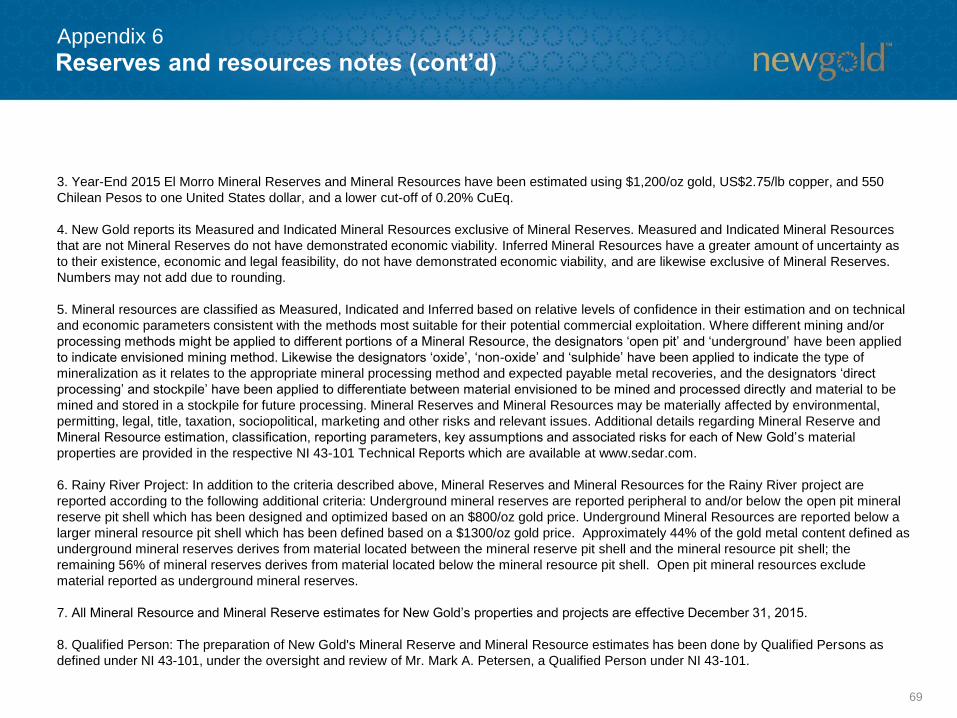
3. Year-End 2015 El Morro Mineral Reserves and Mineral Resources have been estimated using $1,200/oz gold, US$2.75/lb copper, and 550
Chilean Pesos to one United States dollar, and a lower cut-off of 0.20% CuEq.
4. New Gold reports its Measured and Indicated Mineral Resources exclusive of Mineral Reserves. Measured and Indicated Mineral Resources
that are not Mineral Reserves do not have demonstrated economic viability. Inferred Mineral Resources have a greater amount of uncertainty as
to their existence, economic and legal feasibility, do not have demonstrated economic viability, and are likewise exclusive of Mineral Reserves.
Numbers may not add due to rounding.
5. Mineral resources are classified as Measured, Indicated and Inferred based on relative levels of confidence in their estimation and on technical
and economic parameters consistent with the methods most suitable for their potential commercial exploitation. Where different mining and/or
processing methods might be applied to different portions of a Mineral Resource, the designators ‘open pit’ and ‘underground’ have been applied
to indicate envisioned mining method. Likewise the designators ‘oxide’, ‘non-oxide’ and ‘sulphide’ have been applied to indicate the type of
mineralization as it relates to the appropriate mineral processing method and expected payable metal recoveries, and the designators ‘direct
processing’ and stockpile’ have been applied to differentiate between material envisioned to be mined and processed directly and material to be
mined and stored in a stockpile for future processing. Mineral Reserves and Mineral Resources may be materially affected by environmental,
permitting, legal, title, taxation, sociopolitical, marketing and other risks and relevant issues. Additional details regarding Mineral Reserve and
Mineral Resource estimation, classification, reporting parameters, key assumptions and associated risks for each of New Gold’s material
properties are provided in the respective NI 43-101 Technical Reports which are available at www.sedar.com.
6. Rainy River Project: In addition to the criteria described above, Mineral Reserves and Mineral Resources for the Rainy River project are
reported according to the following additional criteria: Underground mineral reserves are reported peripheral to and/or below the open pit mineral
reserve pit shell which has been designed and optimized based on an $800/oz gold price. Underground Mineral Resources are reported below a
larger mineral resource pit shell which has been defined based on a $1300/oz gold price. Approximately 44% of the gold metal content defined as
underground mineral reserves derives from material located between the mineral reserve pit shell and the mineral resource pit shell; the
remaining 56% of mineral reserves derives from material located below the mineral resource pit shell. Open pit mineral resources exclude
material reported as underground mineral reserves.
7. All Mineral Resource and Mineral Reserve estimates for New Gold’s properties and projects are effective December 31, 2015.
8. Qualified Person: The preparation of New Gold's Mineral Reserve and Mineral Resource estimates has been done by Qualified Persons as
defined under NI 43-101, under the oversight and review of Mr. Mark A. Petersen, a Qualified Person under NI 43-101.
Reserves and resources notes (cont’d)Appendix 6
70
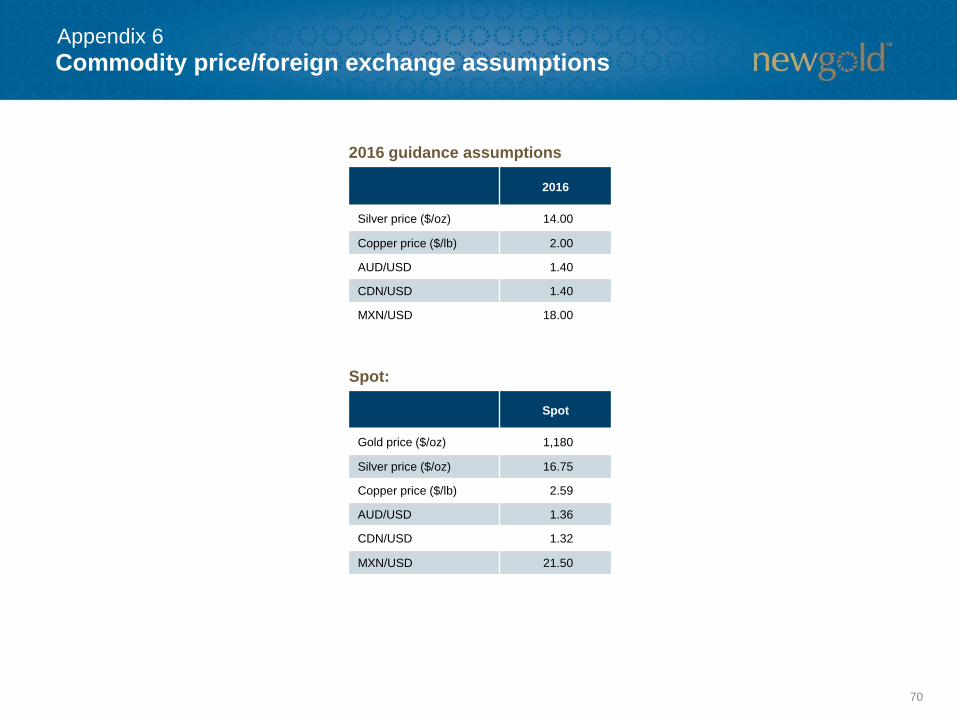
2016 guidance assumptions
Spot:
2016
Silver price ($/oz) 14.00
Copper price ($/lb) 2.00
AUD/USD 1.40
CDN/USD 1.40
MXN/USD 18.00
Spot
Gold price ($/oz) 1,180
Silver price ($/oz) 16.75
Copper price ($/lb) 2.59
AUD/USD 1.36
CDN/USD 1.32
MXN/USD 21.50
Commodity price/foreign exchange assumptionsAppendix 6
Endnotes
71
CAUTIONARY NOTE TO U.S. READERS CONCERNING ESTIMATES OF MINERAL RESERVES AND MINERAL RESOURCES
Information concerning the properties and operations of New Gold has been prepared in accordance with Canadian standards under applicable Canadian securities laws, and may not be
comparable to similar information for United States companies. The terms “Mineral Resource”, “Measured Mineral Resource”, “Indicated Mineral Resource” and “Inferred Mineral Resource”
used in this presentation are Canadian mining terms as defined in the Canadian Institute of Mining, Metallurgy and Petroleum (“CIM”) Definition Standards for Mineral Resources and Mineral
Reserves adopted by CIM Council on May 10, 2014 and incorporated by reference in National Instrument 43-101. While the terms “Mineral Resource”, “Measured Mineral Resource”,
“Indicated Mineral Resource” and “Inferred Mineral Resource” are recognized and required by Canadian securities regulations, they are not defined terms under standards of the United States
Securities and Exchange Commission. As such, certain information contained in this presentation concerning descriptions of mineralization and mineral resources under Canadian standards
is not comparable to similar information made public by United States companies subject to the reporting and disclosure requirements of the United States Securities and Exchange
Commission.
An “Inferred Mineral Resource” has a great amount of uncertainty as to its existence and as to its economic and legal feasibility. Under Canadian rules, estimates of inferred mineral resources
may not form the basis of feasibility or pre-feasibility studies. It cannot be assumed that all or any part of an “Inferred Mineral Resource” will ever be upgraded to a higher confidence category.
Readers are cautioned not to assume that all or any part of an “Inferred Mineral Resource” exists or is economically or legally mineable.
Under United States standards, mineralization may not be classified as a “Reserve” unless the determination has been made that the mineralization could be economically and legally
produced or extracted at the time the reserve estimation is made. Readers are cautioned not to assume that all or any part of the measured or indicated mineral resources will ever be
converted into mineral reserves. In addition, the definitions of “Proven Mineral Reserves” and “Probable Mineral Reserves” under CIM standards differ in certain respects from the standards of
the United States Securities and Exchange Commission.
TECHNICAL INFORMATION
The scientific and technical information in this presentation has been reviewed and approved by Mark A. Petersen, Vice President, Exploration of New Gold. Mr. Petersen is an AIPG Certified
Professional Geologist and a “Qualified Person” as defined under National Instrument 43-101.
For additional technical information on New Gold’s material properties, including a detailed breakdown of Mineral Reserves and Mineral Resources by category, as well as key assumptions,
parameters and risks, refer to New Gold’s Annual Information Form for the year ended December 31, 2015.
Endnotes (cont’d)
72
NON-GAAP MEASURES
(1) ALL-IN SUSTAINING COSTS
“All-in sustaining costs” per ounce is a non-GAAP financial measure. Consistent with guidance announced in 2013 by the World Gold Council, an association of various gold mining companies
from around the world of which New Gold is a member, New Gold defines “all-in sustaining costs” per ounce as the sum of total cash costs, capital expenditures that are sustaining in nature,
corporate general and administrative costs, capitalized and expensed exploration that is sustaining in nature and environmental reclamation costs, all divided by the ounces of gold sold to
arrive at a per ounce figure. New Gold believes this non-GAAP financial measure provides further transparency into costs associated with producing gold and assists analysts, investors and
other stakeholders of the company in assessing the company’s operating performance, its ability to generate free cash flow from current operations and its overall value. This data is furnished
to provide additional information and is a non-GAAP financial measure.
All-in sustaining costs presented do not have a standardized meaning under IFRS and may not be comparable to similar measures presented by other mining companies. It should not be
considered in isolation or as a substitute for measures of performance prepared in accordance with IFRS and is not necessarily indicative of cash flow from operations under IFRS or operating
costs presented under IFRS. Further details regarding historical all-in sustaining costs and a reconciliation to the nearest IFRS measures are provided below and in the MD&A accompanying
New Gold’s financial statements filed from time to time on www.sedar.com.
(2) TOTAL CASH COSTS
“Total cash costs” per ounce is a non-GAAP financial measure which is calculated in accordance with a standard developed by The Gold Institute, a worldwide association of suppliers of gold
and gold products that ceased operations in 2002. Adoption of the standard is voluntary and the cost measures presented may not be comparable to other similarly titled measures of other
companies. New Gold reports total cash costs on a sales basis. The company believes that certain investors use this information to evaluate the company’s performance and ability to
generate liquidity through operating cash flow to fund future capital expenditures and working capital needs. This measure, along with sales, is considered to be a key indicator of the
company’s ability to generate operating earnings and cash flow from its mining operations. Total cash costs include mine site operating costs such as mining, processing and administration
costs, royalties, production taxes, and realized gains and losses on fuel contracts, but are exclusive of amortization, reclamation, capital and exploration costs and net of by-product sales.
Total cash costs are then divided by ounces of gold sold to arrive at a per ounce figure. Co-product cash costs remove the impact of other metal sales that are produced as a by-product of
gold production and apportion the cash costs to each metal produced on a percentage of revenue basis, and subsequently divides the amount by the total ounces of gold or silver or pounds of
copper sold, as the case may be, to arrive at per ounce or per pound figures. Unless otherwise indicated, all total cash cost information in this presentation is net of by-product sales. This data
is furnished to provide additional information and is a non-GAAP financial measure. Total cash costs and co-product cash costs presented do not have a standardized meaning under IFRS
and may not be comparable to similar measures presented by other mining companies. It should not be considered in isolation or as a substitute for measures of performance prepared in
accordance with IFRS and is not necessarily indicative of cash flow from operations under IFRS or operating costs presented under GAAP. Further details regarding historical total cash costs
and a reconciliation to the nearest IFRS measures are provided below and in the MD&A accompanying New Gold’s financial statements filed from time to time on www.sedar.com.
(3) AVERAGE REALIZED PRICE
“Average realized price per ounce or pound sold” is a non-GAAP financial measure with no standard meaning under IFRS. Management uses this measure to better understand the price
realized in each reporting period for gold, silver, and copper sales. Average realized price is intended to provide additional information only and does not have any standardized definition
under IFRS; it should not be considered in isolation or as a substitute for measures of performance prepared in accordance with IFRS. Other companies may calculate this measure differently
and this measure is unlikely to be comparable to similar measures presented by other companies.
Endnotes (cont’d)
73
(4) ADJUSTED NET (LOSS)/EARNINGS
“Adjusted net (loss)/earnings” and “adjusted net (loss)/earnings per share” are non-GAAP financial measures. Net (loss)/earnings have been adjusted and tax affected for the group of costs in
“Other gains and losses” on the condensed consolidated income statement. The adjusted entries are also impacted for tax to the extent that the underlying entries are impacted for tax in the
unadjusted net (loss)/earnings from continuing operations. The company uses this measure for its own internal purposes. Management’s internal budgets and forecasts and public guidance
do not reflect fair value changes on senior notes and non-hedged derivatives, foreign currency translation and fair value through profit or loss and financial asset gains/losses. Consequently,
the presentation of adjusted net earnings and adjusted net earnings per share enables investors and analysts to better understand the underlying operating performance of our core mining
business through the eyes of management. Management periodically evaluates the components of adjusted net earnings and adjusted net earnings per share based on an internal
assessment of performance measures that are useful for evaluating the operating performance of our business and a review of the non-GAAP measures used by mining industry analysts and
other mining companies. Adjusted net (loss)/earnings and adjusted net (loss)/earnings per share are intended to provide additional information only and do not have any standardized meaning
under IFRS and may not be comparable to similar measures presented by other companies. They should not be considered in isolation or as a substitute for measures of performance
prepared in accordance with IFRS. The measures are not necessarily indicative of operating profit or cash flows from operations as determined under IFRS.
(5) OPERATING MARGIN
“Operating margin” is a non-GAAP financial measure with no standard meaning under IFRS, which management uses to evaluate the Company’s aggregated and mine-by-mine contribution to
net earnings before non-cash depreciation and depletion charges.
(6) CASH GENERATED FROM OPERATIONS BEFORE CHANGES IN NON-CASH OPERATING WORKING CAPITAL
“Cash generated from operations before changes in working capital” and “cash generated from operations before changes in working capital per share” are non-GAAP financial measures with
no standard meaning under IFRS, which exclude changes in non-cash operating working capital. Management uses this measure to evaluate the Company’s ability to generate cash from its
operations before temporary working capital changes.