Embed Size (px)
Citation preview


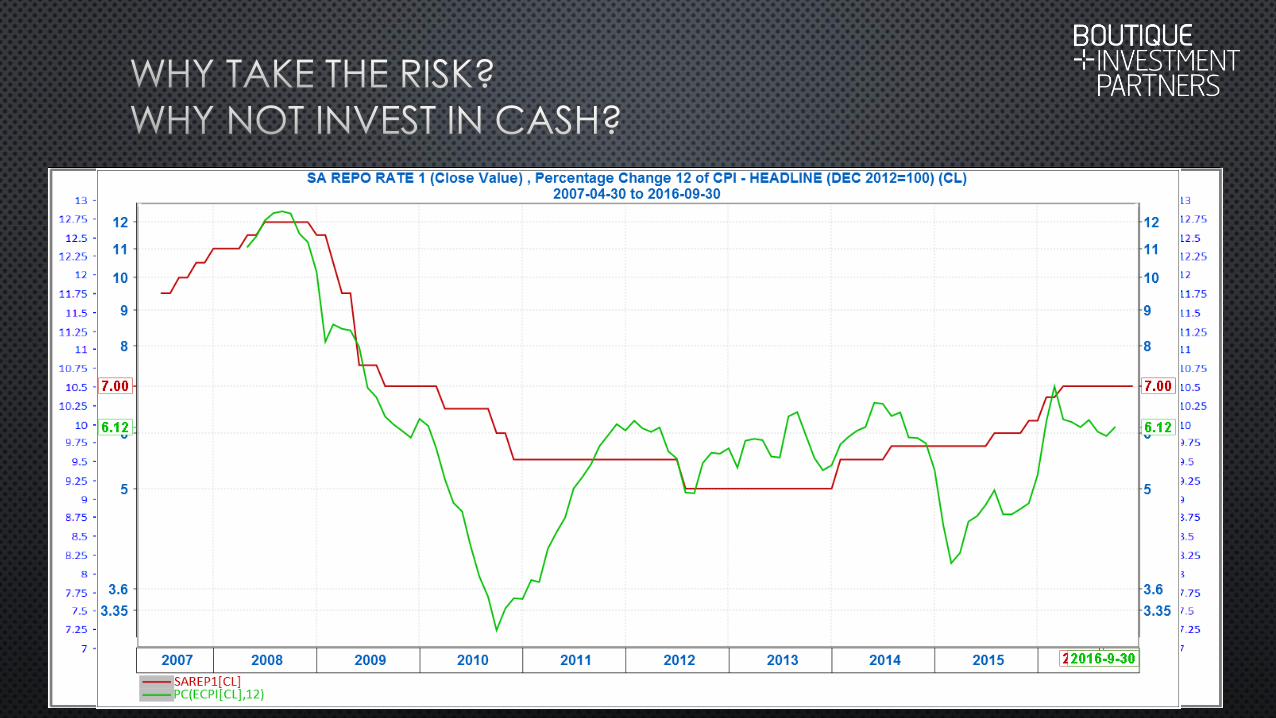
•
•
•
•
•


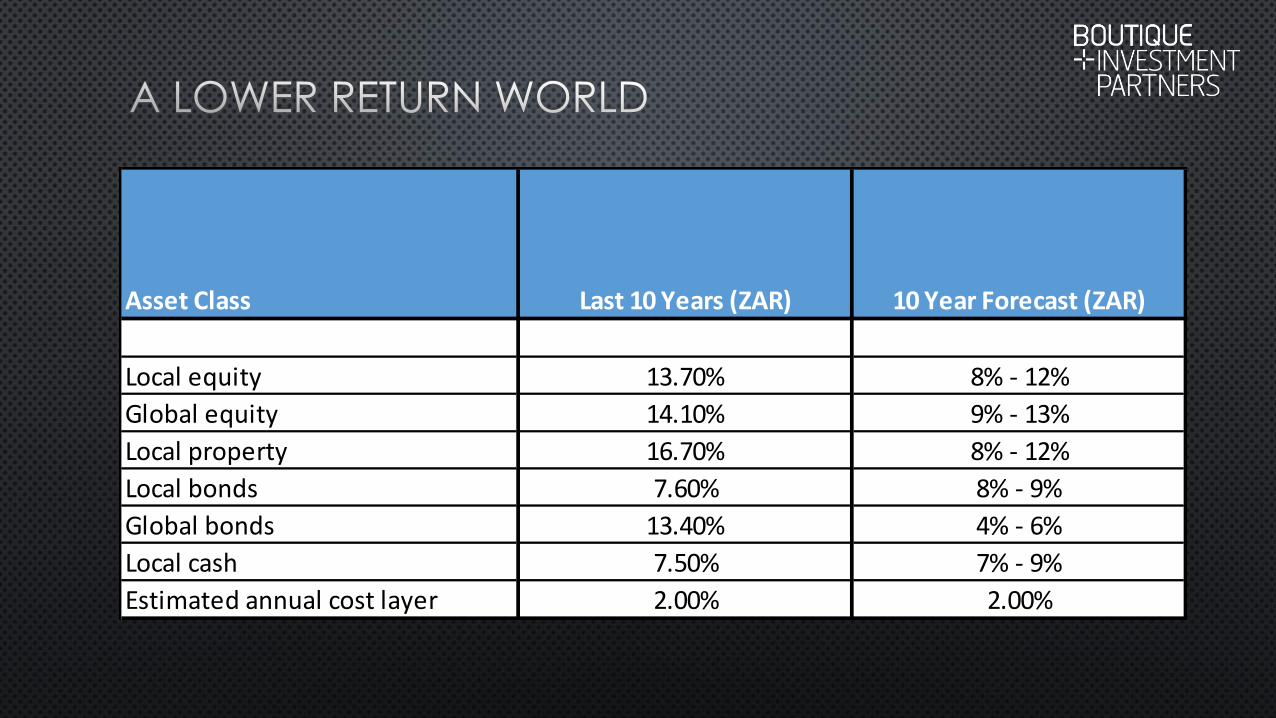
Asset Class Last 10 Years (ZAR) 10 Year Forecast (ZAR)
Local equity 13.70% 8% - 12%
Global equity 14.10% 9% - 13%
Local property 16.70% 8% - 12%
Local bonds 7.60% 8% - 9%
Global bonds 13.40% 4% - 6%
Local cash 7.50% 7% - 9%
Estimated annual cost layer 2.00% 2.00%
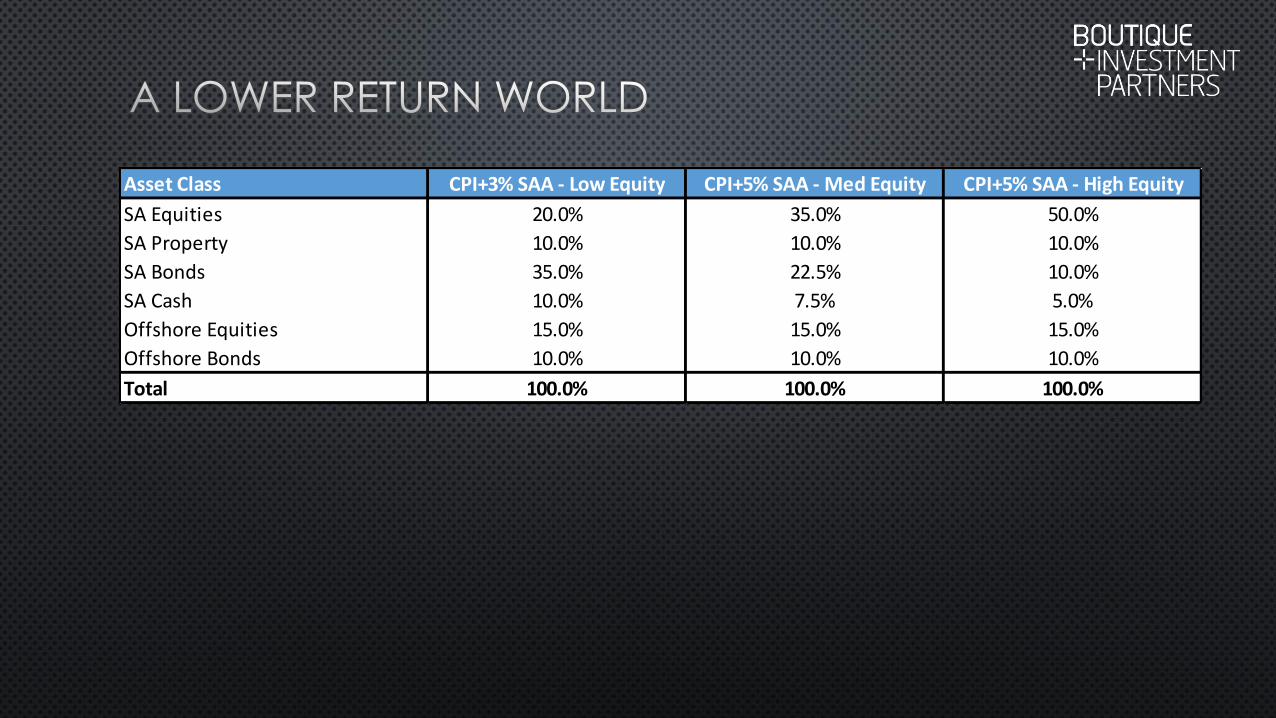
Asset Class CPI+3% SAA - Low Equity CPI+5% SAA - Med Equity CPI+5% SAA - High Equity
SA Equities 20.0% 35.0% 50.0%
SA Property 10.0% 10.0% 10.0%
SA Bonds 35.0% 22.5% 10.0%
SA Cash 10.0% 7.5% 5.0%
Offshore Equities 15.0% 15.0% 15.0%
Offshore Bonds 10.0% 10.0% 10.0%
Total 100.0% 100.0% 100.0%
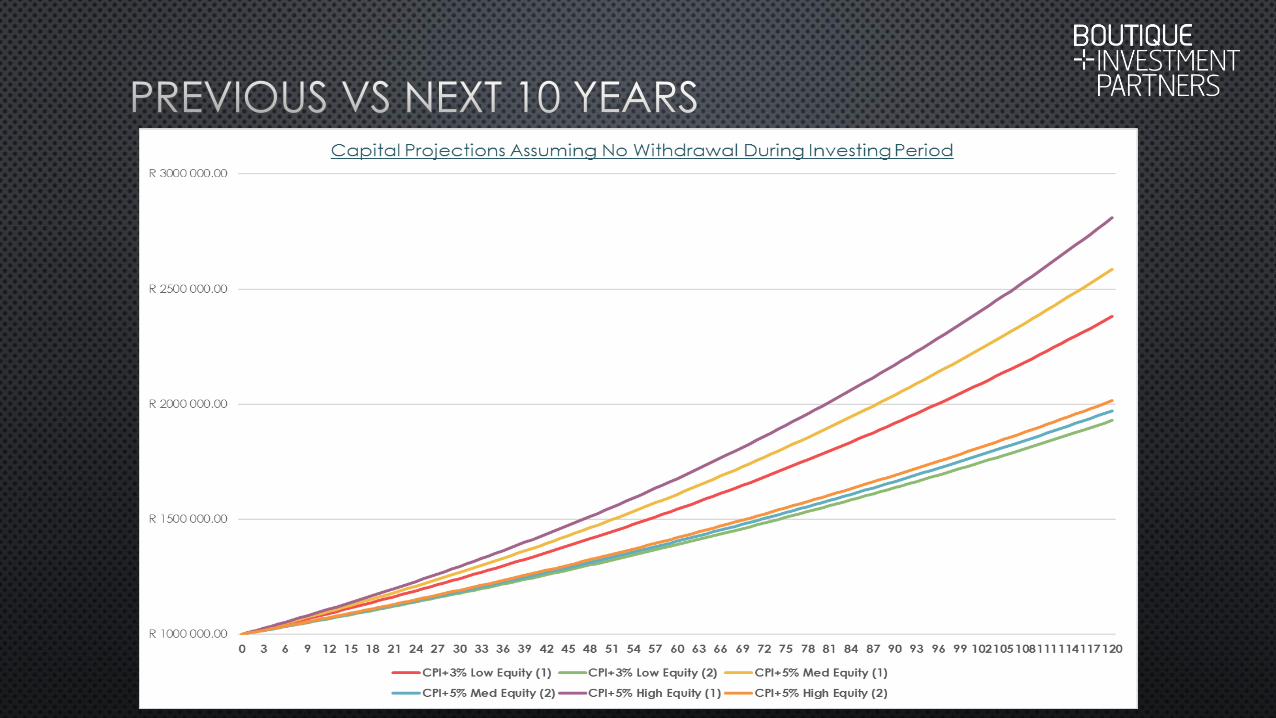
Capital Balance At The
End Of Period … CPI+3% Low Equity (1) CPI+5% Med Equity (1) CPI+5% High Equity (1)
1 R 1,098,516.50 R 1,108,440.31 R 1,118,446.83
2 R 1,189,419.99 R 1,209,332.73 R 1,229,564.74
3 R 1,297,187.78 R 1,329,899.16 R 1,363,411.96
4 R 1,414,719.91 R 1,462,485.66 R 1,511,829.45
5 R 1,542,901.07 R 1,608,290.59 R 1,676,403.28
6 R 1,682,696.13 R 1,768,631.79 R 1,858,892.19
7 R 1,835,157.37 R 1,944,958.46 R 2,061,246.36
8 R 2,001,432.41 R 2,138,864.32 R 2,285,628.29
9 R 2,182,772.85 R 2,352,101.93 R 2,534,435.85
10 R 2,380,543.71 R 2,586,598.63 R 2,810,327.95
Projections Based On Last Decade's Return Series
Capital Balance At The
End Of Period … CPI+3% Low Equity (2) CPI+5% Med Equity (2) CPI+5% High Equity (2)
1 R1,067,895.75 R1,070,225.07 R1,072,559.04
2 R1,140,401.34 R1,145,381.70 R1,150,382.90
3 R1,217,829.75 R1,225,816.21 R1,233,853.58
4 R1,300,515.22 R1,311,899.24 R1,323,380.81
5 R1,388,814.68 R1,404,027.46 R1,419,404.06
6 R1,483,109.30 R1,502,625.38 R1,522,394.66
7 R1,583,806.13 R1,608,147.35 R1,632,858.15
8 R1,691,339.84 R1,721,079.61 R1,751,336.78
9 R1,806,174.63 R1,841,942.55 R1,878,412.10
10 R1,928,806.22 R1,971,293.09 R2,014,707.88
Projections Based On Next Decade's Assumed Return Series
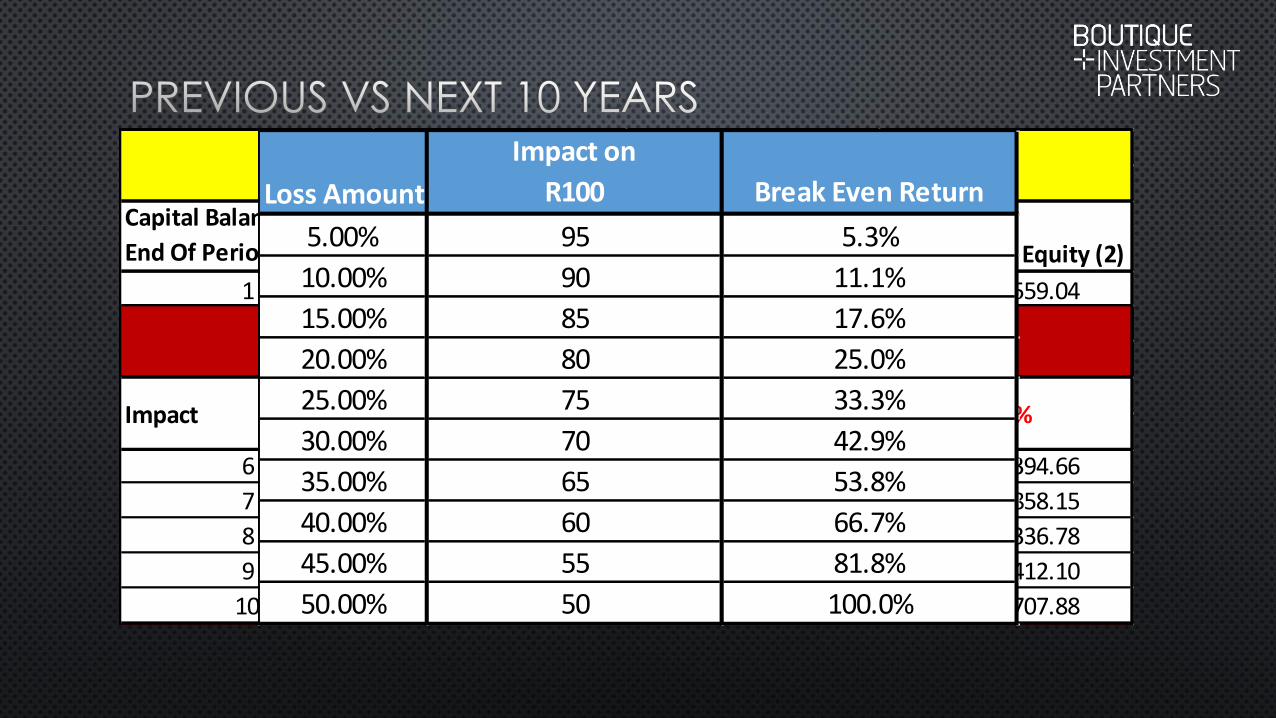
Impact On Final Accumulated Amount
Impact -19% -24% -28%
Loss Amount
Impact on
R100 Break Even Return
5.00% 95 5.3%
10.00% 90 11.1%
15.00% 85 17.6%
20.00% 80 25.0%
25.00% 75 33.3%
30.00% 70 42.9%
35.00% 65 53.8%
40.00% 60 66.7%
45.00% 55 81.8%
50.00% 50 100.0%
CPI+3% Low Equity (1) CPI+3% Low Equity (2) CPI+3% Low Equity (1) CPI+3% Low Equity (2) CPI+3% Low Equity (1) CPI+3% Low Equity (2)
1 50,000.00 50,000.00 70,000.00 70,000.00 100,000.00 100,000.00
2 51,803.75 50,725.05 70,998.41 69,520.01 98,154.48 96,110.62
3 53,672.58 51,460.61 72,011.05 69,043.32 96,343.02 92,372.51
4 55,608.82 52,206.84 73,038.14 68,569.89 94,564.99 88,779.79
5 57,614.91 52,963.89 74,079.88 68,099.71 92,819.77 85,326.80
6 59,693.37 53,731.92 75,136.48 67,632.76 91,106.77 82,008.12
7 61,846.81 54,511.08 76,208.15 67,169.00 89,425.37 78,818.51
8 64,077.94 55,301.54 77,295.11 66,708.43 87,775.01 75,752.96
9 66,389.56 56,103.47 78,397.56 66,251.01 86,155.10 72,806.63
10 68,784.57 56,917.02 79,515.74 65,796.73 84,565.09 69,974.91
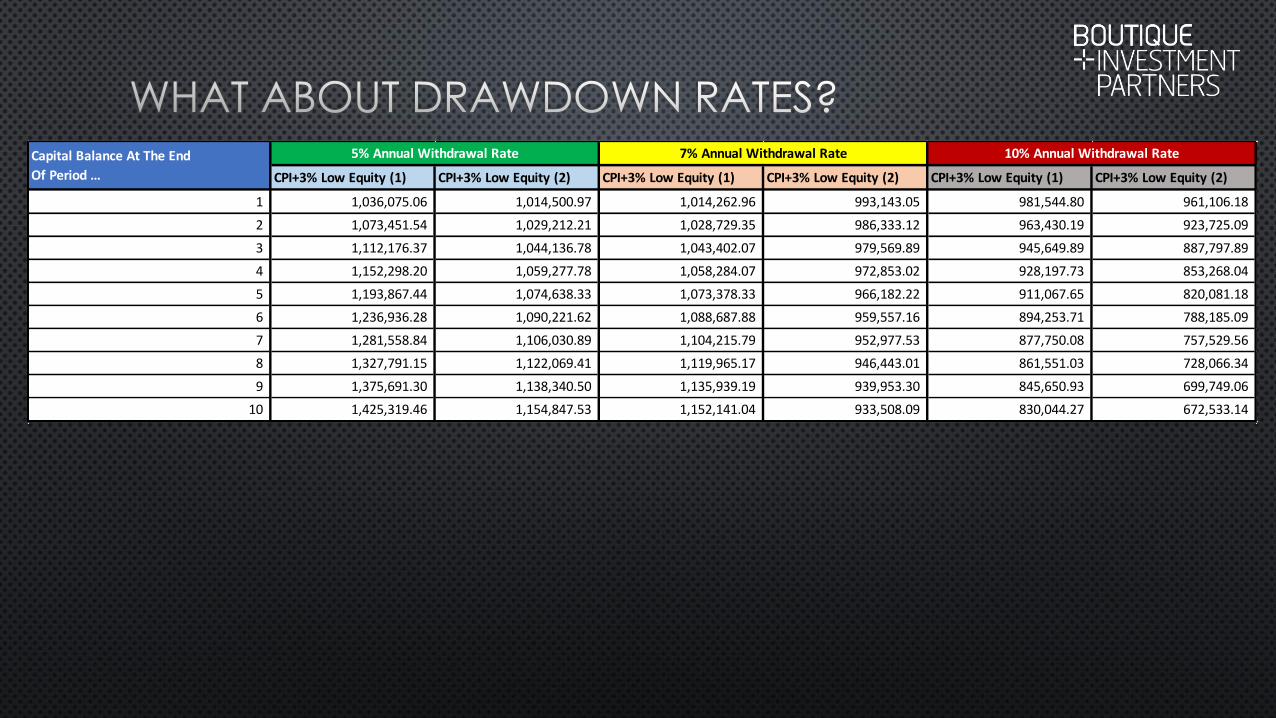
5% Annual Withdrawal Rate 7% Annual Withdrawal Rate 10% Annual Withdrawal RateAmount Withdrawn At
The Beginning Of Period… CPI+3% Low Equity (1) CPI+3% Low Equity (2) CPI+3% Low Equity (1) CPI+3% Low Equity (2) CPI+3% Low Equity (1) CPI+3% Low Equity (2)
1 1,036,075.06 1,014,500.97 1,014,262.96 993,143.05 981,544.80 961,106.18
2 1,073,451.54 1,029,212.21 1,028,729.35 986,333.12 963,430.19 923,725.09
3 1,112,176.37 1,044,136.78 1,043,402.07 979,569.89 945,649.89 887,797.89
4 1,152,298.20 1,059,277.78 1,058,284.07 972,853.02 928,197.73 853,268.04
5 1,193,867.44 1,074,638.33 1,073,378.33 966,182.22 911,067.65 820,081.18
6 1,236,936.28 1,090,221.62 1,088,687.88 959,557.16 894,253.71 788,185.09
7 1,281,558.84 1,106,030.89 1,104,215.79 952,977.53 877,750.08 757,529.56
8 1,327,791.15 1,122,069.41 1,119,965.17 946,443.01 861,551.03 728,066.34
9 1,375,691.30 1,138,340.50 1,135,939.19 939,953.30 845,650.93 699,749.06
10 1,425,319.46 1,154,847.53 1,152,141.04 933,508.09 830,044.27 672,533.14
Capital Balance At The End
Of Period …
5% Annual Withdrawal Rate 7% Annual Withdrawal Rate 10% Annual Withdrawal Rate
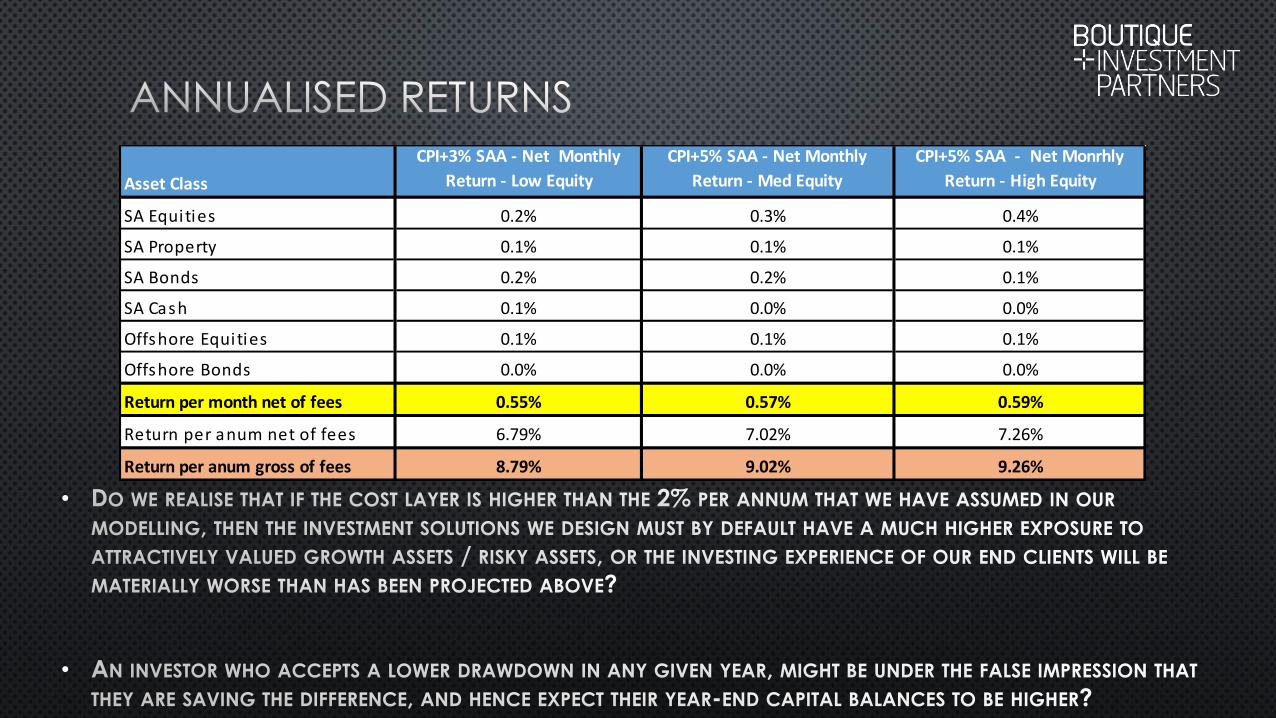
Asset Class
CPI+3% SAA - Net Monthly
Return - Low Equity
CPI+5% SAA - Net Monthly
Return - Med Equity
CPI+5% SAA - Net Monrhly
Return - High Equity
SA Equities 0.2% 0.3% 0.4%
SA Property 0.1% 0.1% 0.1%
SA Bonds 0.2% 0.2% 0.1%
SA Cash 0.1% 0.0% 0.0%
Offshore Equities 0.1% 0.1% 0.1%
Offshore Bonds 0.0% 0.0% 0.0%
Return per month net of fees 0.55% 0.57% 0.59%
Return per anum net of fees 6.79% 7.02% 7.26%
Return per anum gross of fees 8.79% 9.02% 9.26%
•
•
Asset Class
CPI+3% SAA - Net Monthly
Return - Low Equity
CPI+5% SAA - Net Monthly
Return - Med Equity
CPI+5% SAA - Net Monrhly
Return - High Equity
SA Equities 0.2% 0.3% 0.4%
SA Property 0.1% 0.1% 0.1%
SA Bonds 0.2% 0.2% 0.1%
SA Cash 0.1% 0.0% 0.0%
Offshore Equities 0.1% 0.1% 0.1%
Offshore Bonds 0.0% 0.0% 0.0%
Return per month net of fees 0.55% 0.57% 0.59%
Return per anum net of fees 6.79% 7.02% 7.26%
Return per anum gross of fees 8.79% 9.02% 9.26%
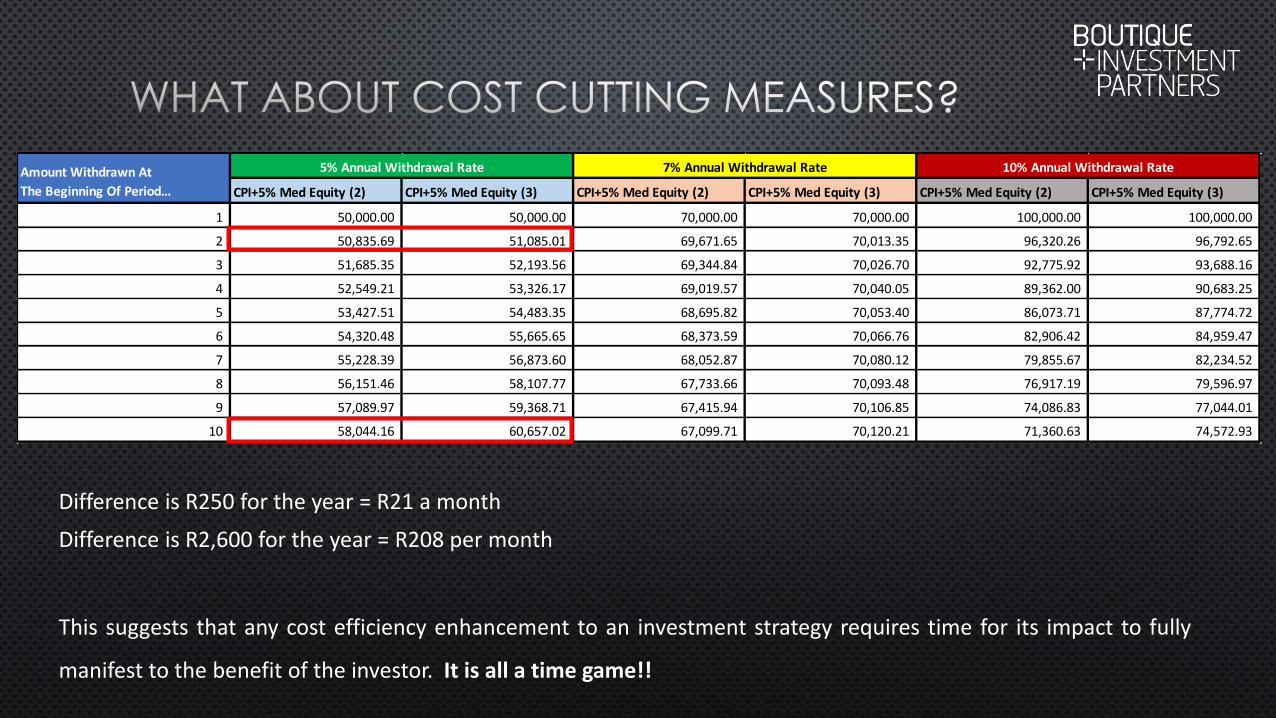
CPI+5% Med Equity (2) CPI+5% Med Equity (3) CPI+5% Med Equity (2) CPI+5% Med Equity (3) CPI+5% Med Equity (2) CPI+5% Med Equity (3)
1 50,000.00 50,000.00 70,000.00 70,000.00 100,000.00 100,000.00
2 50,835.69 51,085.01 69,671.65 70,013.35 96,320.26 96,792.65
3 51,685.35 52,193.56 69,344.84 70,026.70 92,775.92 93,688.16
4 52,549.21 53,326.17 69,019.57 70,040.05 89,362.00 90,683.25
5 53,427.51 54,483.35 68,695.82 70,053.40 86,073.71 87,774.72
6 54,320.48 55,665.65 68,373.59 70,066.76 82,906.42 84,959.47
7 55,228.39 56,873.60 68,052.87 70,080.12 79,855.67 82,234.52
8 56,151.46 58,107.77 67,733.66 70,093.48 76,917.19 79,596.97
9 57,089.97 59,368.71 67,415.94 70,106.85 74,086.83 77,044.01
10 58,044.16 60,657.02 67,099.71 70,120.21 71,360.63 74,572.93
Amount Withdrawn At
The Beginning Of Period…
5% Annual Withdrawal Rate 7% Annual Withdrawal Rate 10% Annual Withdrawal Rate
This suggests that any cost efficiency enhancement to an investment strategy requires time for its impact to fully
manifest to the benefit of the investor. It is all a time game!!
Difference is R250 for the year = R21 a month
Difference is R2,600 for the year = R208 per month

Asset Class Last 10 Years (ZAR) 10 Year Forecast (ZAR)
Mid-range 10 Year
Projection
(Annualised in % terms)
Local equity 13.70% 8% - 12% 10.0%
Global equity 14.10% 9% - 13% 11.0%
Local property 16.70% 8% - 12% 10.0%
Local bonds 7.60% 8% - 9% 8.5%
Global bonds 13.40% 4% - 6% 5.0%
Local cash 7.50% 7% - 9% 8.0%
Estimated annual cost layer 2.00% 2.00% 2.00%
Mid-range 10 Year
Projection
(After Industrial Sector De-
rating)
8.00%
11.00%
10.00%
8.50%
5.00%
8.00%
2.00%
CPI+5% Med Equity (3) CPI+5% Med Equity (4) CPI+5% Med Equity (3) CPI+5% Med Equity (4) CPI+5% Med Equity (3) CPI+5% Med Equity (4)
1 50,000.00 50,000.00 70,000.00 70,000.00 100,000.00 100,000.00
2 51,085.01 50,509.68 70,013.35 69,224.84 96,792.65 95,702.55
3 52,193.56 51,024.55 70,026.70 68,458.27 93,688.16 91,589.78
4 53,326.17 51,544.68 70,040.05 67,700.19 90,683.25 87,653.75
5 54,483.35 52,070.10 70,053.40 66,950.50 87,774.72 83,886.88
6 55,665.65 52,600.88 70,066.76 66,209.11 84,959.47 80,281.88
7 56,873.60 53,137.07 70,080.12 65,475.94 82,234.52 76,831.81
8 58,107.77 53,678.73 70,093.48 64,750.88 79,596.97 73,530.00
9 59,368.71 54,225.91 70,106.85 64,033.85 77,044.01 70,370.08
10 60,657.02 54,778.66 70,120.21 63,324.76 74,572.93 67,345.96
Amount Withdrawn At
The Beginning Of Period…
5% Annual Withdrawal Rate 7% Annual Withdrawal Rate 10% Annual Withdrawal Rate
CPI+5% Med Equity (3) CPI+5% Med Equity (4) CPI+5% Med Equity (3) CPI+5% Med Equity (4) CPI+5% Med Equity (3) CPI+5% Med Equity (4)
1 1,021,700.15 1,010,193.57 1,000,190.67 988,926.34 967,926.45 957,025.49
2 1,043,871.19 1,020,491.06 1,000,381.37 977,975.31 936,881.62 915,897.79
3 1,066,523.34 1,030,893.51 1,000,572.12 967,145.54 906,832.50 876,537.54
4 1,089,667.06 1,041,402.00 1,000,762.89 956,435.71 877,747.17 838,868.77
5 1,113,312.99 1,052,017.61 1,000,953.71 945,844.46 849,594.71 802,818.79
6 1,137,472.04 1,062,741.43 1,001,144.56 935,370.50 822,345.19 768,318.05
7 1,162,155.35 1,073,574.56 1,001,335.45 925,012.53 795,969.66 735,299.96
8 1,187,374.29 1,084,518.13 1,001,526.37 914,769.26 770,440.09 703,700.81
9 1,213,140.49 1,095,573.24 1,001,717.33 904,639.42 745,729.35 673,459.61
10 1,239,465.81 1,106,741.05 1,001,908.33 894,621.75 721,811.16 644,518.01
Capital Balance At The End
Of Period …
5% Annual Withdrawal Rate 7% Annual Withdrawal Rate 10% Annual Withdrawal Rate
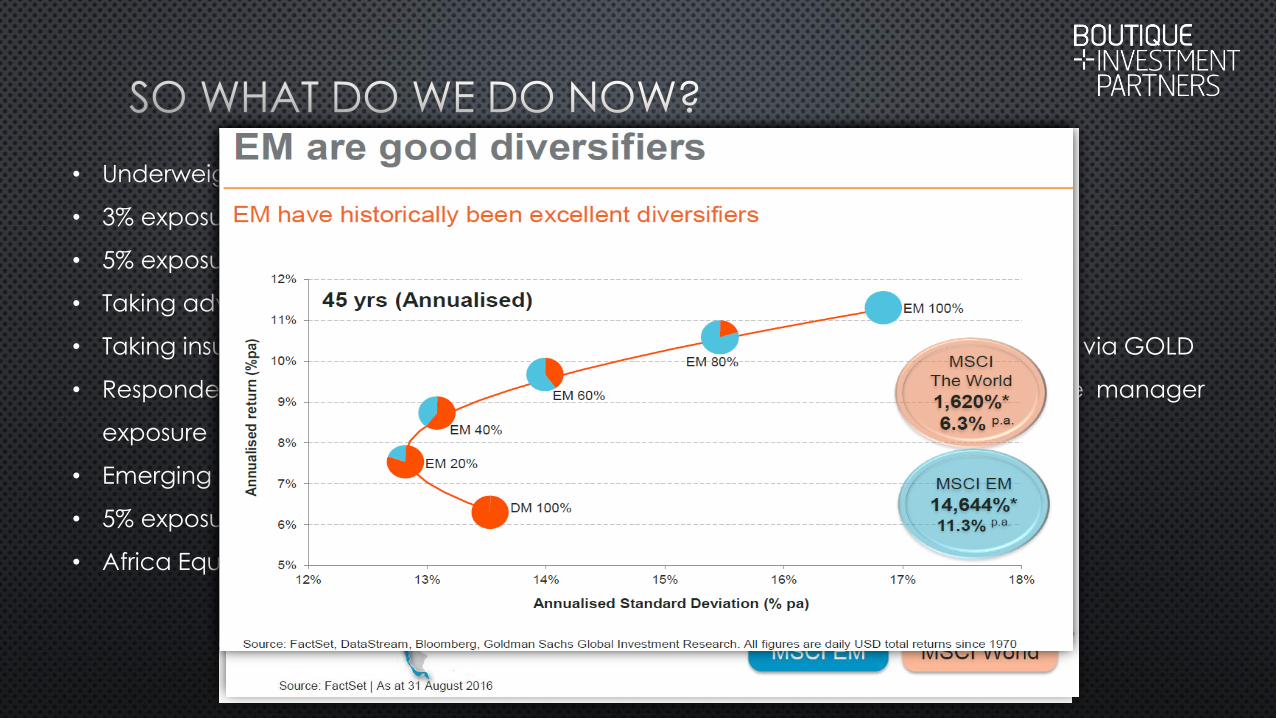
• Underweight the expensive stocks like rand-hedge industrials
• 3% exposure to direct small caps
• 5% exposure to financial stocks
• Taking advantage of the opportunities within local nominal bonds
• Taking insurance against event/political risks and hedging against the equity market via GOLD
• Responded to negative investor sentiment against global energy through active manager
exposure
• Emerging markets – fantastic opportunities for the patient investor
• 5% exposure to USD Cash within our offshore portfolios
• Africa Equity and Africa Listed Property


“…Successful investing takes time, discipline and patience.
No matter how great the talent or effort, some things just take time: You cannot produce a baby
in one month by getting 9 women pregnant…”
- Warren Buffett