Embed Size (px)
Citation preview
NASDAQ: BAGR © 2015 by Diversified Restaurant Holdings, Inc.
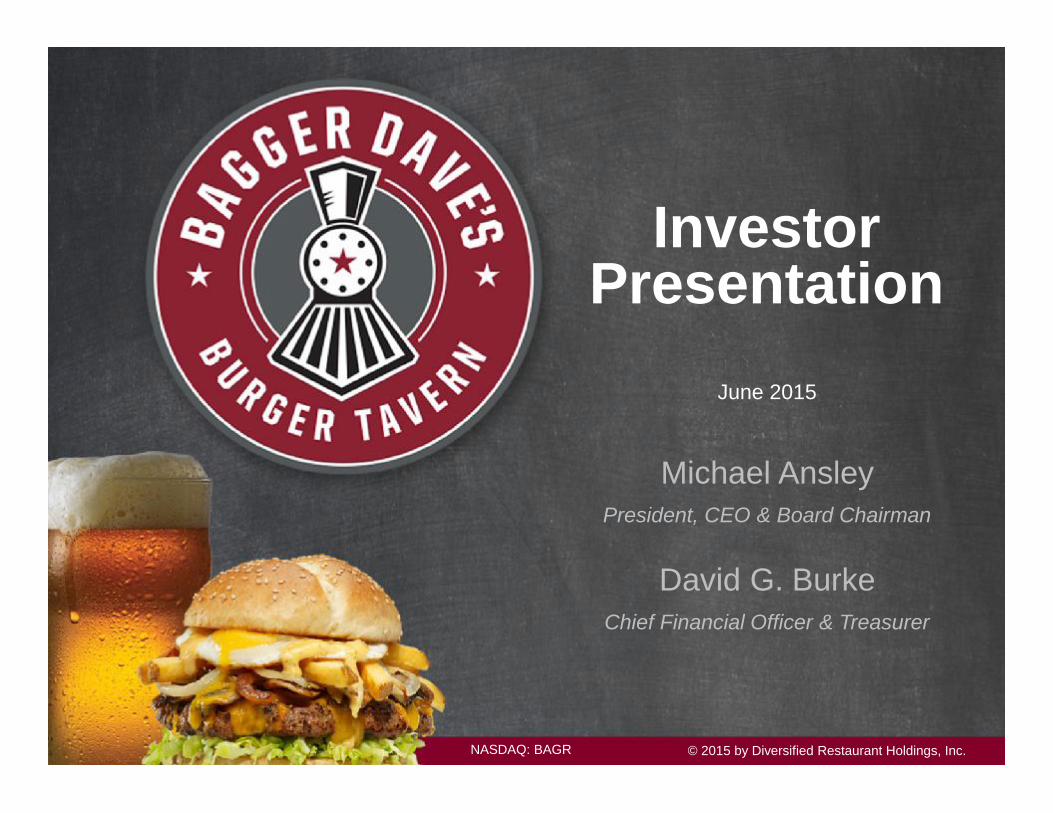
Investor Presentation
June 2015
Michael AnsleyPresident, CEO & Board Chairman
David G. BurkeChief Financial Officer & Treasurer
NASDAQ: BAGR 2
Safe Harbor Statement
The information made available in this presentation contains forward-looking statementswhich reflect the Company’s current view of future events, results of operations, cash flows,performance, business prospects and opportunities. Wherever used, the words "anticipate,""believe," "expect," "intend," "plan," "project," "will continue," "will likely result," "may," andsimilar expressions identify forward-looking statements as such term is defined in theSecurities Exchange Act of 1934. Any such forward-looking statements are subject to risksand uncertainties and the Company's actual growth, results of operations, financialcondition, cash flows, performance, business prospects and opportunities could differmaterially from historical results or current expectations. Some of these risks include, withoutlimitation, the impact of economic and industry conditions, competition, food and drug safetyissues, store expansion and remodeling, labor relations issues, costs of providing employeebenefits, regulatory matters, legal and administrative proceedings, information technology,security, severe weather, natural disasters, accounting matters, other risk factors relating toour business or industry and other risks detailed from time to time in the Securities andExchange Commission filings of DRH. Forward-looking statements contained herein speakonly as of the date made and, thus, DRH undertakes no obligation to update or publiclyannounce the revision of any of the forward-looking statements contained herein to reflectnew information, future events, developments or changed circumstances or for any otherreason.
© 2015 by Diversified Restaurant Holdings, Inc.
NASDAQ: BAGR © 2015 by Diversified Restaurant Holdings, Inc. 3
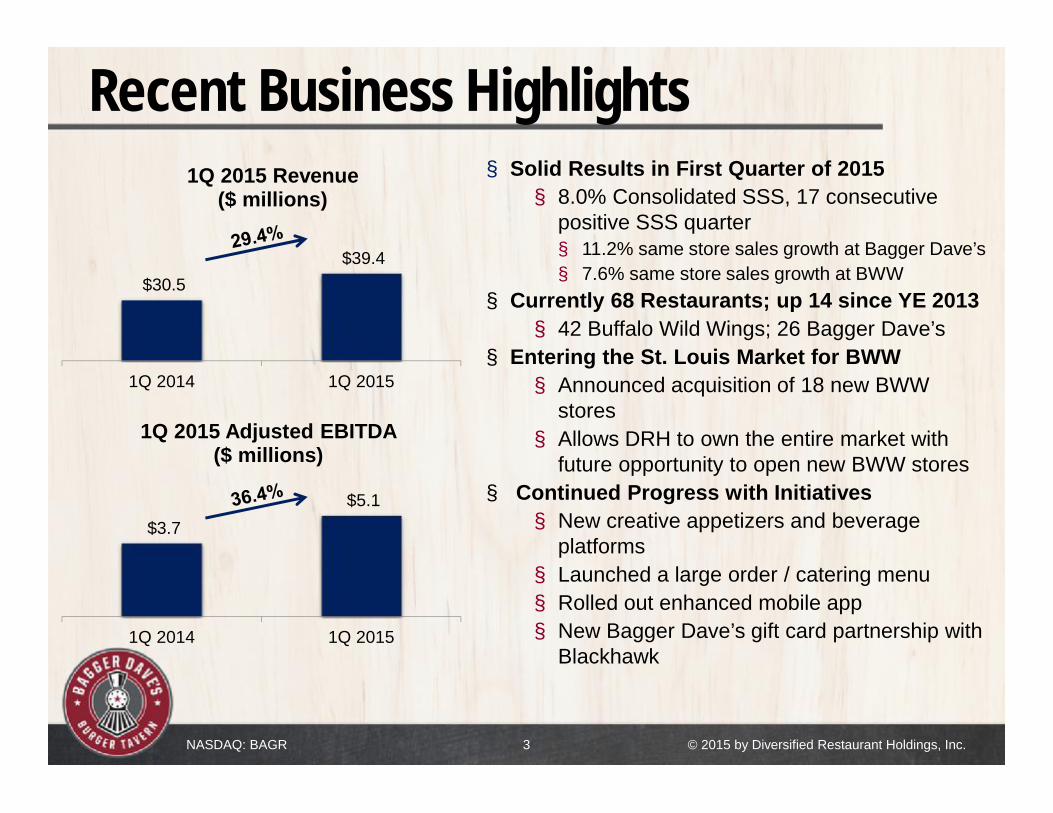
Recent Business Highlights
$30.5 $39.4
1Q 2014 1Q 2015
1Q 2015 Revenue($ millions)
§ Solid Results in First Quarter of 2015§ 8.0% Consolidated SSS, 17 consecutive
positive SSS quarter§ 11.2% same store sales growth at Bagger Dave’s§ 7.6% same store sales growth at BWW
§ Currently 68 Restaurants; up 14 since YE 2013§ 42 Buffalo Wild Wings; 26 Bagger Dave’s
§ Entering the St. Louis Market for BWW§ Announced acquisition of 18 new BWW
stores§ Allows DRH to own the entire market with
future opportunity to open new BWW stores§ Continued Progress with Initiatives
§ New creative appetizers and beverage platforms
§ Launched a large order / catering menu§ Rolled out enhanced mobile app§ New Bagger Dave’s gift card partnership with
Blackhawk
$3.7 $5.1
1Q 2014 1Q 2015
1Q 2015 Adjusted EBITDA($ millions)
NASDAQ: BAGR
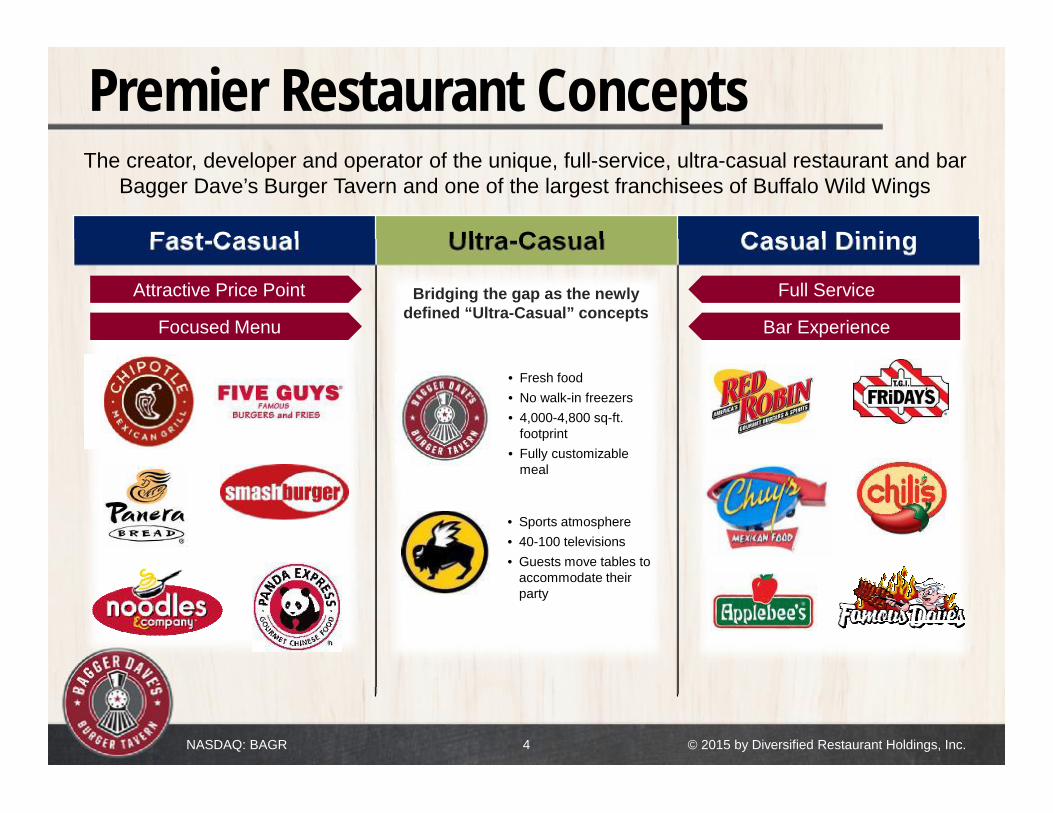
Fast-Casual Ultra-Casual Casual Dining
© 2015 by Diversified Restaurant Holdings, Inc. 4
Premier Restaurant Concepts
Bridging the gap as the newly defined “Ultra-Casual” concepts
Attractive Price Point
Focused Menu
Full Service
Bar Experience
• Fresh food• No walk-in freezers• 4,000-4,800 sq-ft.
footprint• Fully customizable
meal
• Sports atmosphere• 40-100 televisions• Guests move tables to
accommodate their party
The creator, developer and operator of the unique, full-service, ultra-casual restaurant and bar Bagger Dave’s Burger Tavern and one of the largest franchisees of Buffalo Wild Wings
NASDAQ: BAGR © 2015 by Diversified Restaurant Holdings, Inc. 5
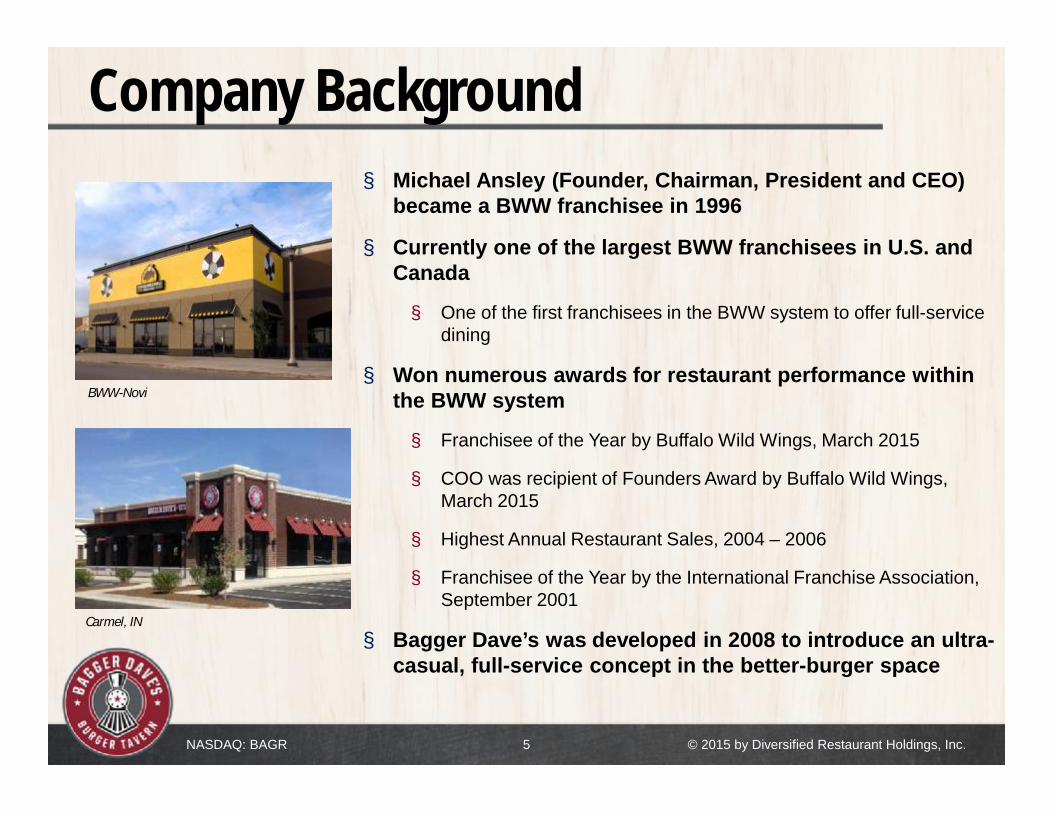
Company Background§ Michael Ansley (Founder, Chairman, President and CEO)
became a BWW franchisee in 1996
§ Currently one of the largest BWW franchisees in U.S. and Canada
§ One of the first franchisees in the BWW system to offer full-service dining
§ Won numerous awards for restaurant performance within the BWW system
§ Franchisee of the Year by Buffalo Wild Wings, March 2015
§ COO was recipient of Founders Award by Buffalo Wild Wings, March 2015
§ Highest Annual Restaurant Sales, 2004 – 2006
§ Franchisee of the Year by the International Franchise Association, September 2001
§ Bagger Dave’s was developed in 2008 to introduce an ultra-casual, full-service concept in the better-burger space
BWW-Novi
Carmel, IN

NASDAQ: BAGR © 2015 by Diversified Restaurant Holdings, Inc. 6
Key Investment Highlights§ Diversified, yet highly complementary concepts provide guests with strong value proposition
§ Fresh, high quality and differentiated menu has broad appeal and drives top-line growth
§ Significant growth opportunities that can leverage operational expertise and infrastructure
§ Flexible business model with attractive unit economics and returns
§ Experienced and dedicated management team possesses significant insider ownership
Founded: 1999 NASDAQ: BAGRTotal Restaurants 68 2014 Restaurant Additions 12
Market Capitalization (millions) $108.7 2014 Revenue (millions) $128.4
Recent Price $4.15 Avg. Vol. (3 months, thousands) 38.2
52 wk. Price Range $3.55 - $5.50 Shares Outstanding (millions) 26.2
Market Data as of May 28, 2015 [Source: Bloomberg LP]; Year End is Last Sunday in December
NASDAQ: BAGR © 2015 by Diversified Restaurant Holdings, Inc. 7
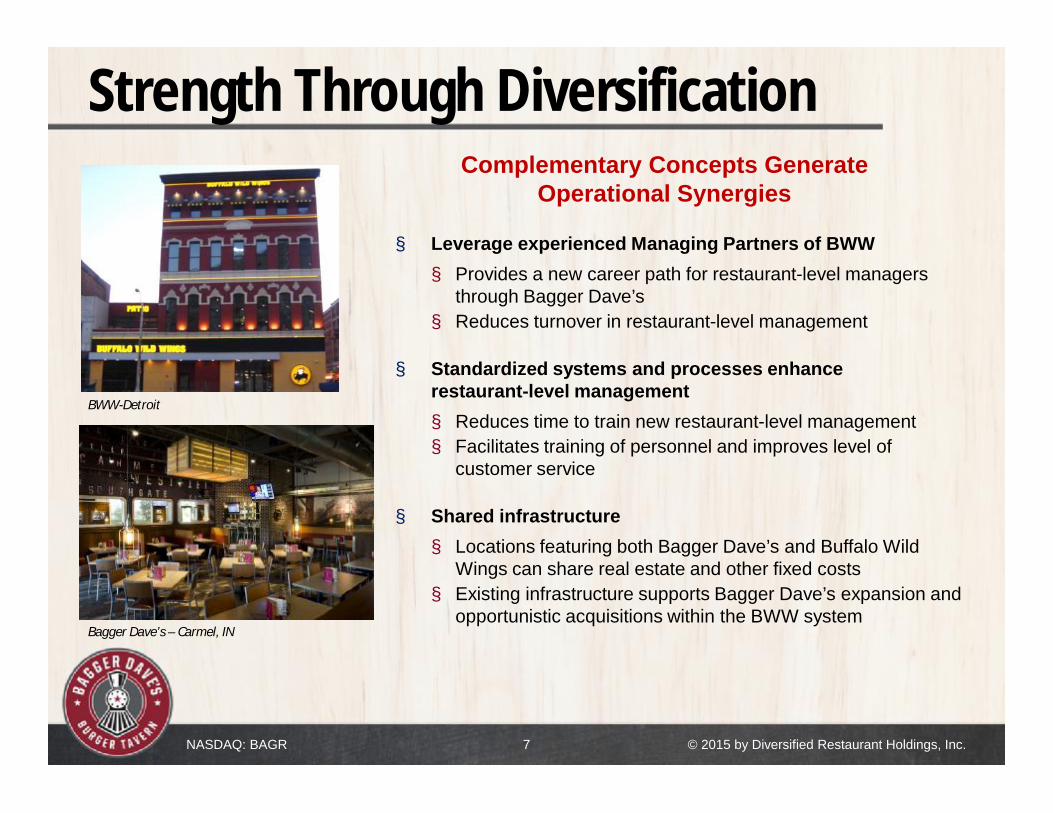
Strength Through Diversification
§ Leverage experienced Managing Partners of BWW§ Provides a new career path for restaurant-level managers
through Bagger Dave’s§ Reduces turnover in restaurant-level management
§ Standardized systems and processes enhancerestaurant-level management§ Reduces time to train new restaurant-level management§ Facilitates training of personnel and improves level of
customer service
§ Shared infrastructure§ Locations featuring both Bagger Dave’s and Buffalo Wild
Wings can share real estate and other fixed costs§ Existing infrastructure supports Bagger Dave’s expansion and
opportunistic acquisitions within the BWW system
Complementary Concepts GenerateOperational Synergies
Bagger Dave’s – Carmel, IN
BWW-Detroit
NASDAQ: BAGR © 2015 by Diversified Restaurant Holdings, Inc. 8
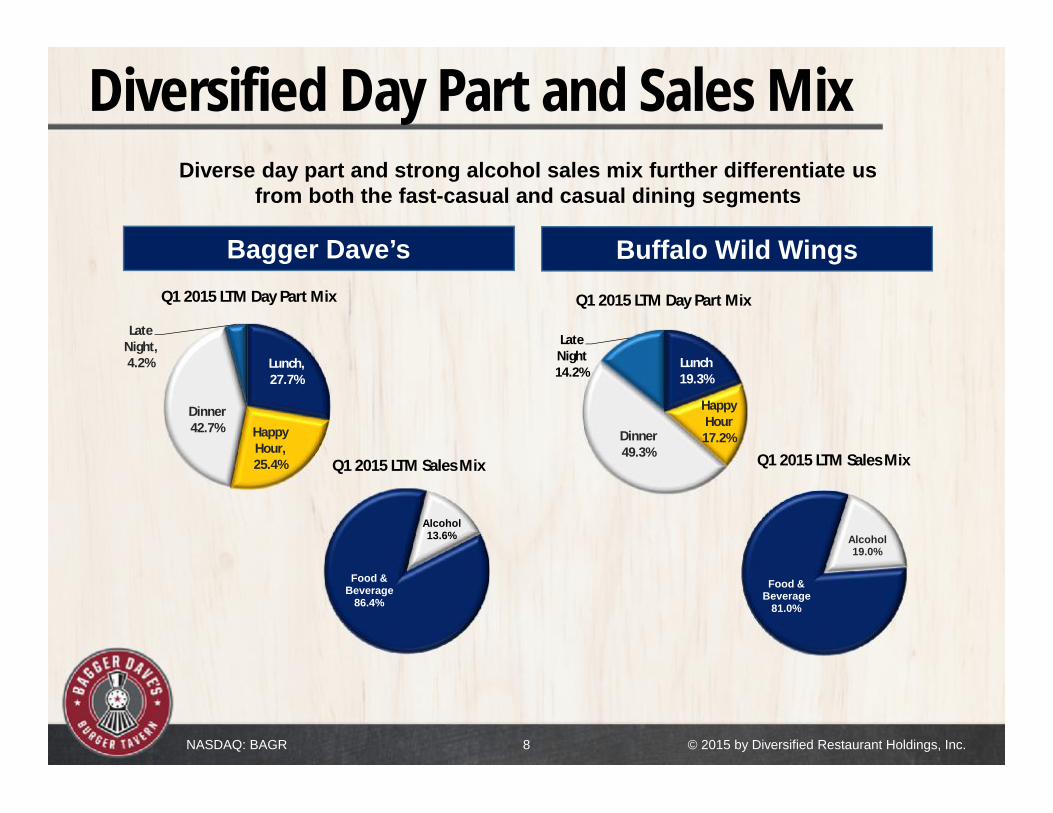
Diversified Day Part and Sales Mix
Food & Beverage
86.4%
Alcohol13.6%
Food & Beverage
81.0%
Alcohol19.0%
Lunch, 27.7%
Happy Hour, 25.4%
Dinner42.7%
Late Night, 4.2% Lunch
19.3%
Happy Hour
17.2%Dinner 49.3%
Late Night14.2%
Bagger Dave’sQ1 2015 LTM Day Part Mix
Q1 2015 LTM Sales Mix
Buffalo Wild Wings
Diverse day part and strong alcohol sales mix further differentiate us from both the fast-casual and casual dining segments
Q1 2015 LTM Day Part Mix
Q1 2015 LTM Sales Mix
NASDAQ: BAGR © 2015 by Diversified Restaurant Holdings, Inc. 9
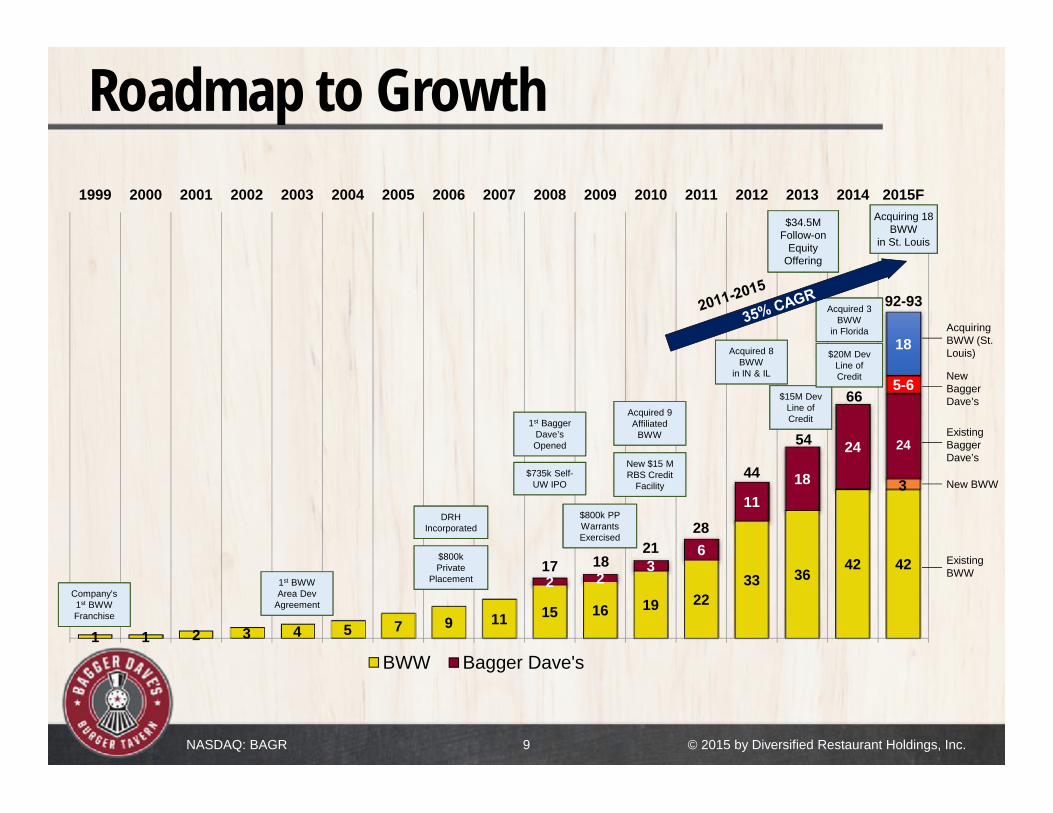
Roadmap to Growth
1 1 2 3 4 5 7 9 11 15 16 19 2233 36
42 42
24
2 23
6
1118
24
5-6
18
1999 2000 2001 2002 2003 2004 2005 2006 2007 2008 2009 2010 2011 2012 2013 2014 2015F
BWW Bagger Dave's
Company’s 1st BWWFranchise
DRHIncorporated
1st Bagger Dave’s Opened
Acquired 8 BWW
in IN & IL
$34.5M Follow-on
Equity Offering
$800k Private
Placement
$735k Self-UW IPO
New $15 M RBS Credit
Facility
Acquired 9 Affiliated
BWW
$15M DevLine of Credit
$800k PP Warrants Exercised
1st BWW Area Dev
Agreement
92-93
66
54
44
2821
1817
$20M DevLine of Credit
Acquired 3 BWW
in Florida
Acquiring 18 BWW
in St. Louis
3
Acquiring BWW (St. Louis)
New Bagger Dave’s
Existing Bagger Dave’s
New BWW
Existing BWW
NASDAQ: BAGR © 2015 by Diversified Restaurant Holdings, Inc. 10
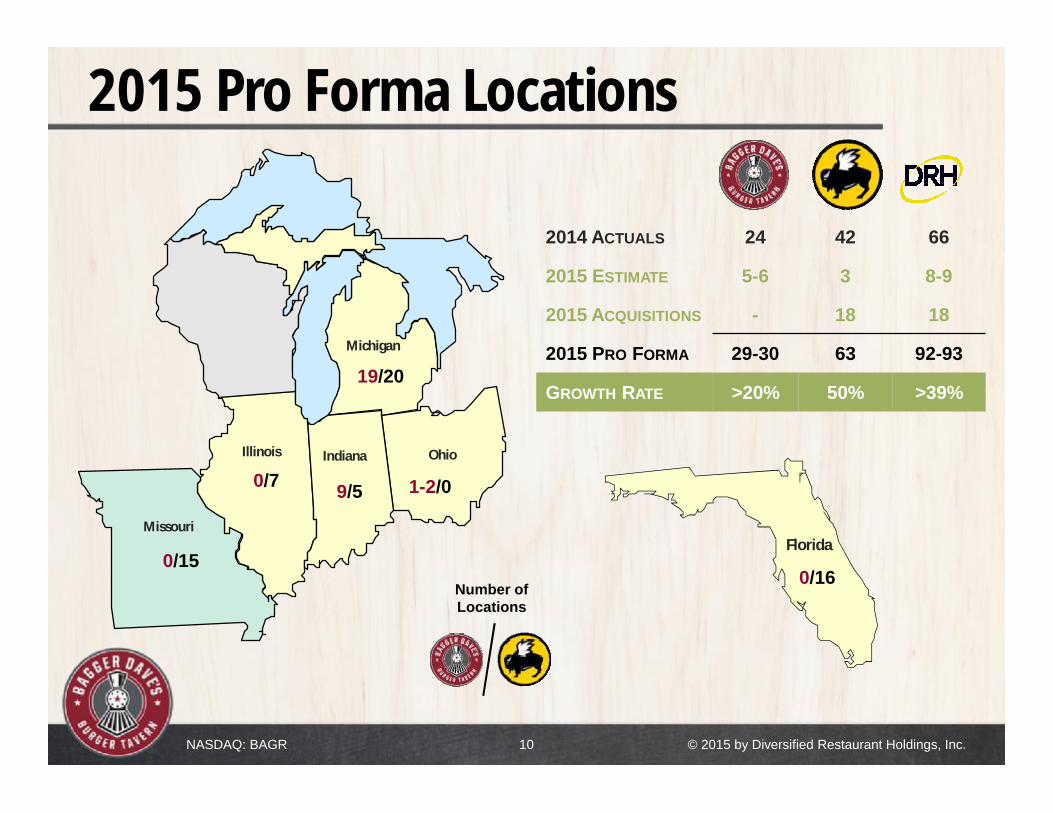
2015 Pro Forma Locations
Florida
2014 ACTUALS 24 42 66
2015 ESTIMATE 5-6 3 8-9
2015 ACQUISITIONS - 18 18
2015 PRO FORMA 29-30 63 92-93
GROWTH RATE >20% 50% >39%
IndianaIllinois
Michigan
Ohio
Missouri
19/20
9/50/7
0/15
1-2/0
0/16Number of Locations
NASDAQ: BAGR
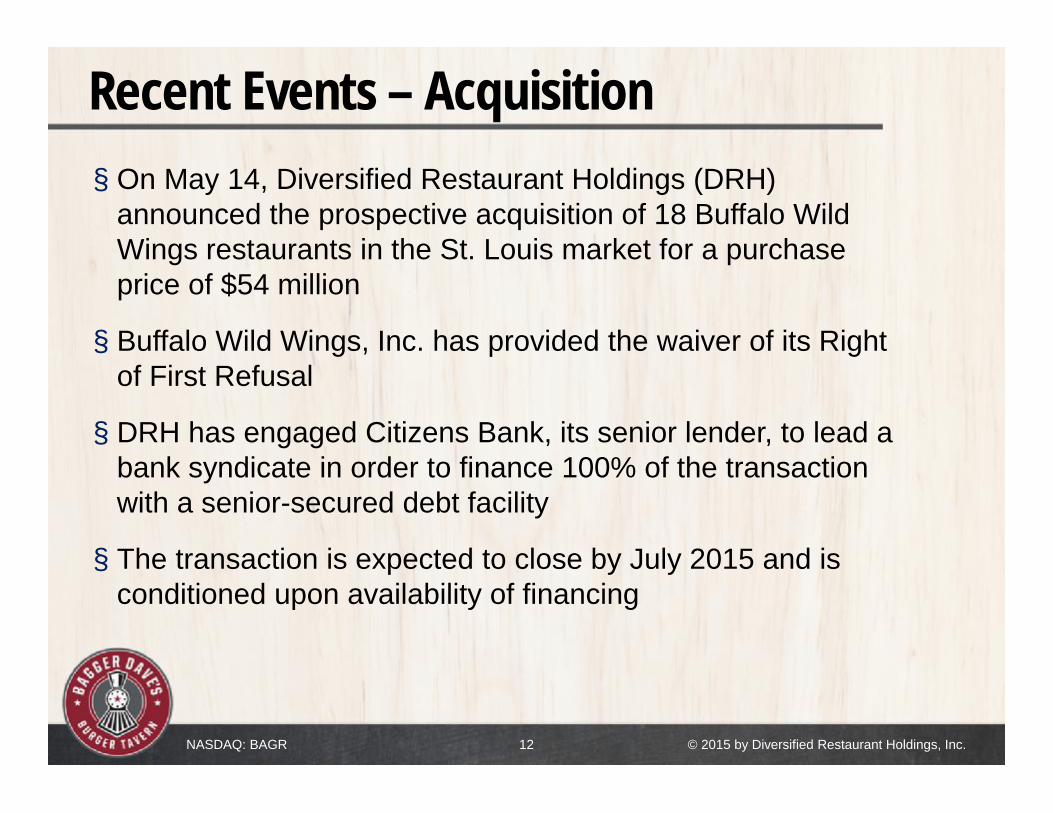
Recent Events – Acquisition§ On May 14, Diversified Restaurant Holdings (DRH)
announced the prospective acquisition of 18 Buffalo Wild Wings restaurants in the St. Louis market for a purchase price of $54 million
§ Buffalo Wild Wings, Inc. has provided the waiver of its Right of First Refusal
§ DRH has engaged Citizens Bank, its senior lender, to lead a bank syndicate in order to finance 100% of the transaction with a senior-secured debt facility
§ The transaction is expected to close by July 2015 and is conditioned upon availability of financing
© 2015 by Diversified Restaurant Holdings, Inc. 12
NASDAQ: BAGR
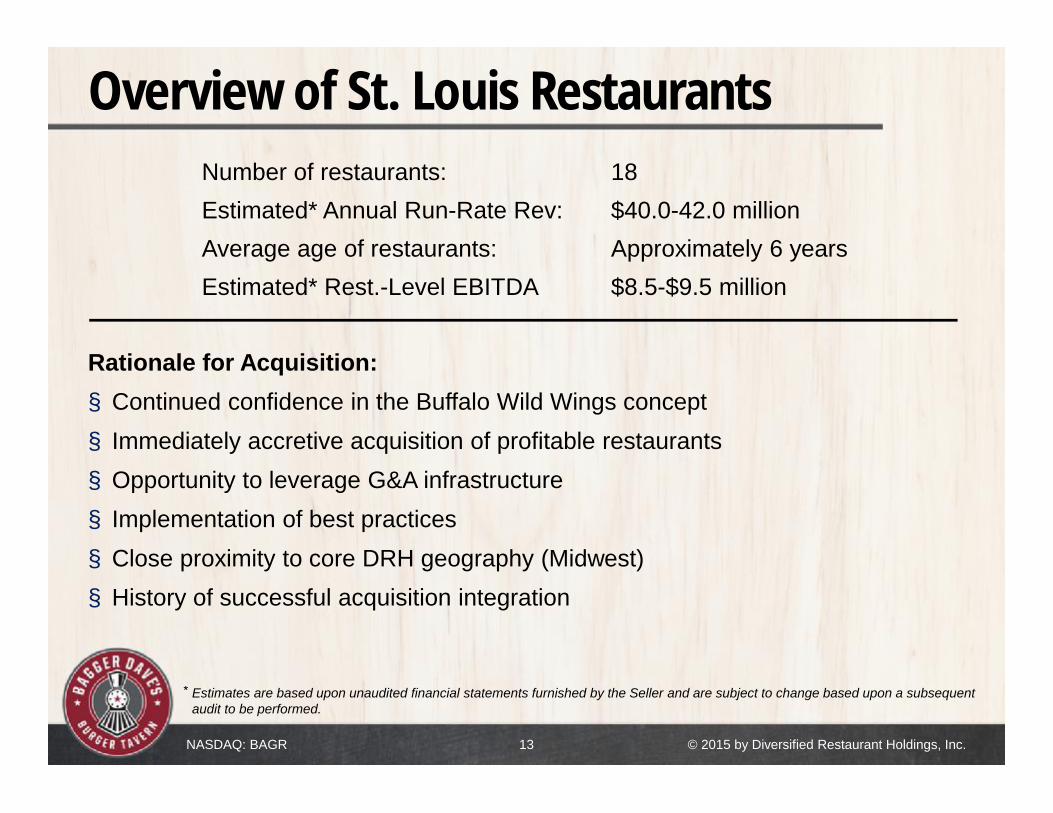
Overview of St. Louis RestaurantsNumber of restaurants: 18Estimated* Annual Run-Rate Rev: $40.0-42.0 millionAverage age of restaurants: Approximately 6 yearsEstimated* Rest.-Level EBITDA $8.5-$9.5 million
Rationale for Acquisition:§ Continued confidence in the Buffalo Wild Wings concept § Immediately accretive acquisition of profitable restaurants§ Opportunity to leverage G&A infrastructure§ Implementation of best practices§ Close proximity to core DRH geography (Midwest)§ History of successful acquisition integration
Estimates are based upon unaudited financial statements furnished by the Seller and are subject to change based upon a subsequent audit to be performed.
© 2015 by Diversified Restaurant Holdings, Inc. 13
NASDAQ: BAGR
$2.1
$2.3 $2.5
$2.8
8.6%
5.1%
14.2%
19.0%
0.0%
5.0%
10.0%
15.0%
20.0%
25.0%
1.0
1.5
2.0
2.5
$3.0
2011 2012 2013 2014AUV Restaurant-Level EBITDA Margin
(AUV, US$ in millions) (% Margin)
Pre-Acquisition Post-Acquisition
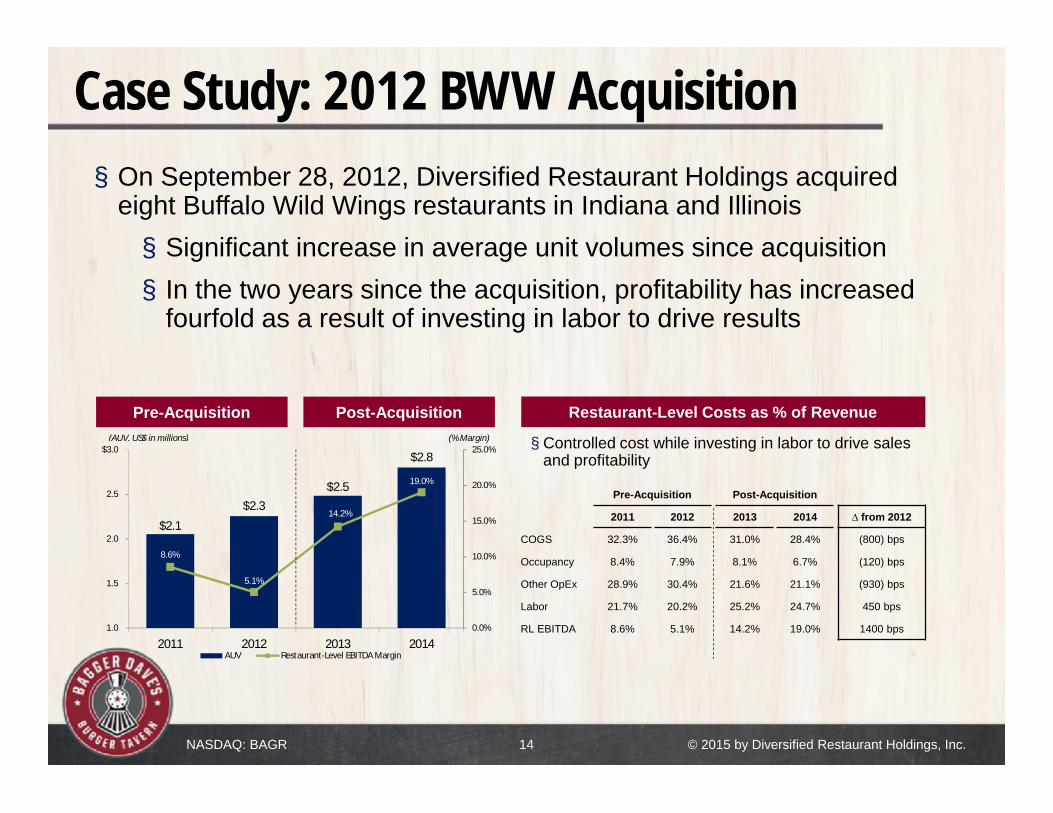
Case Study: 2012 BWW Acquisition
© 2015 by Diversified Restaurant Holdings, Inc.
§ On September 28, 2012, Diversified Restaurant Holdings acquired eight Buffalo Wild Wings restaurants in Indiana and Illinois§ Significant increase in average unit volumes since acquisition§ In the two years since the acquisition, profitability has increased
fourfold as a result of investing in labor to drive results
Pre-Acquisition Post-Acquisition
2011 2012 2013 2014 ∆ from 2012
COGS 32.3% 36.4% 31.0% 28.4% (800) bps
Occupancy 8.4% 7.9% 8.1% 6.7% (120) bps
Other OpEx 28.9% 30.4% 21.6% 21.1% (930) bps
Labor 21.7% 20.2% 25.2% 24.7% 450 bps
RL EBITDA 8.6% 5.1% 14.2% 19.0% 1400 bps
§ Controlled cost while investing in labor to drive sales and profitability
Restaurant-Level Costs as % of Revenue
14
NASDAQ: BAGR
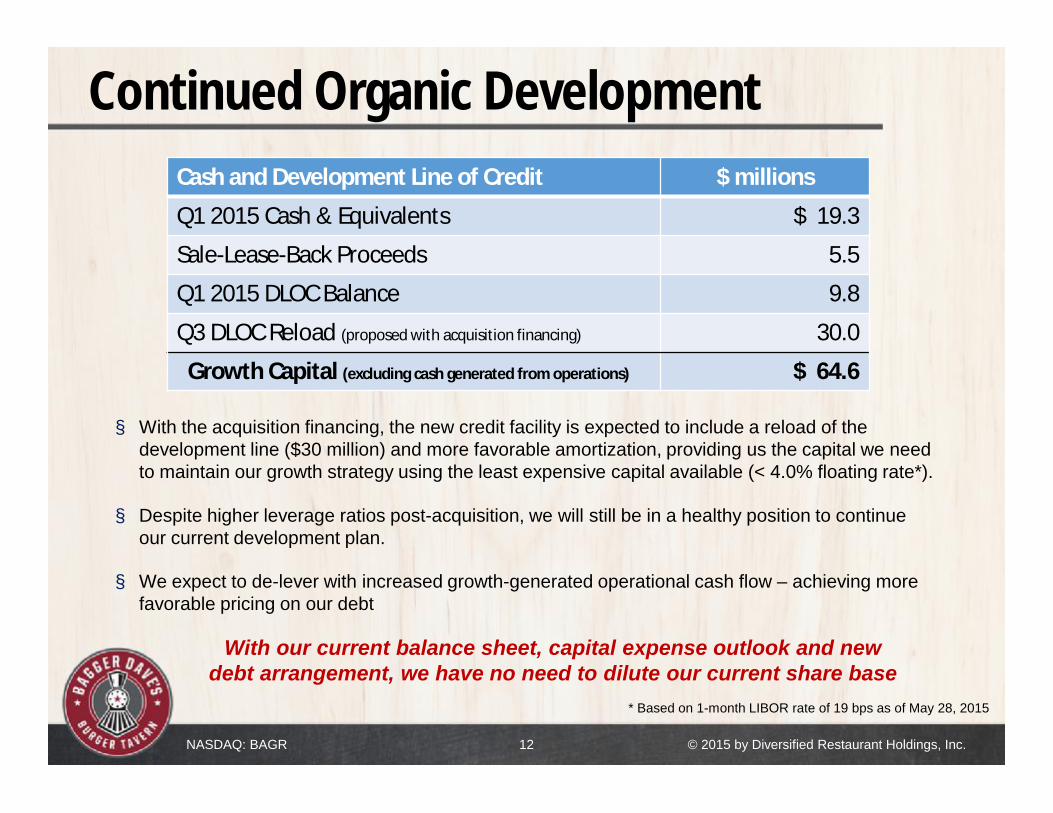
Continued Organic Development
© 2015 by Diversified Restaurant Holdings, Inc. 12
With our current balance sheet, capital expense outlook and new debt arrangement, we have no need to dilute our current share base
* Based on 1-month LIBOR rate of 19 bps as of May 28, 2015
Cash and Development Line of Credit $ millions
Q1 2015 Cash & Equivalents $ 19.3
Sale-Lease-Back Proceeds 5.5
Q1 2015 DLOC Balance 9.8
Q3 DLOC Reload (proposed with acquisition financing) 30.0
Growth Capital (excluding cash generated from operations) $ 64.6
§ With the acquisition financing, the new credit facility is expected to include a reload of the development line ($30 million) and more favorable amortization, providing us the capital we need to maintain our growth strategy using the least expensive capital available (< 4.0% floating rate*).
§ Despite higher leverage ratios post-acquisition, we will still be in a healthy position to continue our current development plan.
§ We expect to de-lever with increased growth-generated operational cash flow – achieving more favorable pricing on our debt
NASDAQ: BAGR © 2015 by Diversified Restaurant Holdings, Inc. 15
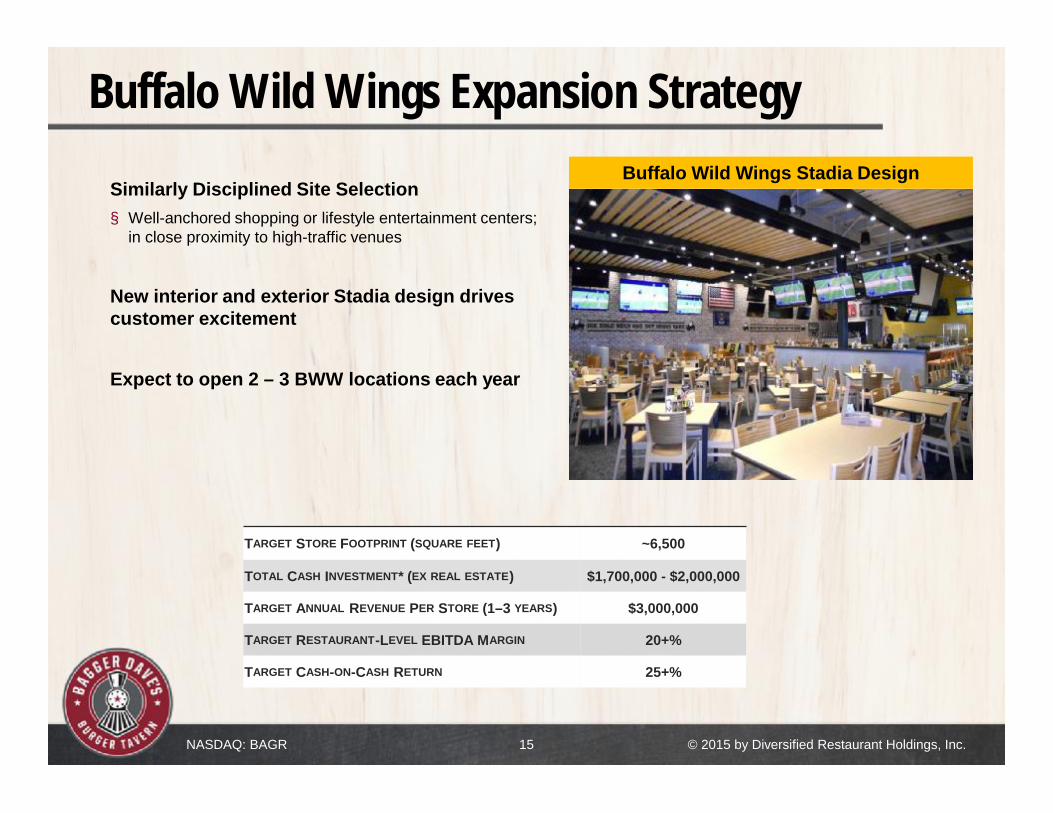
Buffalo Wild Wings Expansion Strategy
TARGET STORE FOOTPRINT (SQUARE FEET) ~6,500
TOTAL CASH INVESTMENT* (EX REAL ESTATE) $1,700,000 - $2,000,000
TARGET ANNUAL REVENUE PER STORE (1–3 YEARS) $3,000,000
TARGET RESTAURANT-LEVEL EBITDA MARGIN 20+%
TARGET CASH-ON-CASH RETURN 25+%
Similarly Disciplined Site Selection§ Well-anchored shopping or lifestyle entertainment centers;
in close proximity to high-traffic venues
New interior and exterior Stadia design drives customer excitement
Expect to open 2 – 3 BWW locations each year
Buffalo Wild Wings Stadia Design
NASDAQ: BAGR 16
Progress with Margin Enhancing Initiatives
§ Improving restaurant productivity is an ongoing priority
§ Opportunity to leverage corporate G&A with unit growth
§ Bagger Dave’s strong unit growth momentum facilitates operating leverage
§ Acquisition of BWW franchises enhances market positioning with ability to leverage scale
© 2015 by Diversified Restaurant Holdings, Inc.
NASDAQ: BAGR © 2015 by Diversified Restaurant Holdings, Inc.
Bagger Dave’sOverview
NASDAQ: BAGR © 2015 by Diversified Restaurant Holdings, Inc. 18
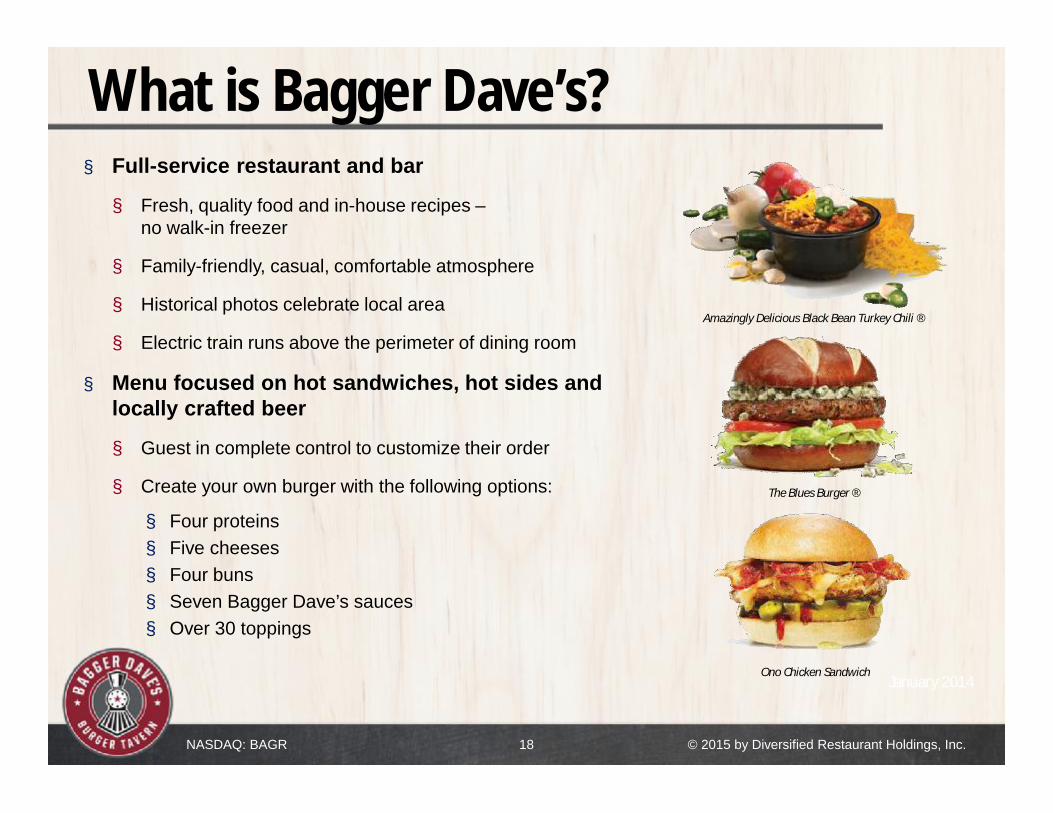
What is Bagger Dave’s?
January 2014
§ Full-service restaurant and bar
§ Fresh, quality food and in-house recipes –no walk-in freezer
§ Family-friendly, casual, comfortable atmosphere
§ Historical photos celebrate local area
§ Electric train runs above the perimeter of dining room
§ Menu focused on hot sandwiches, hot sides and locally crafted beer
§ Guest in complete control to customize their order
§ Create your own burger with the following options:
§ Four proteins§ Five cheeses§ Four buns§ Seven Bagger Dave’s sauces§ Over 30 toppings
Amazingly Delicious Black Bean Turkey Chili ®
Ono Chicken Sandwich
The Blues Burger ®

NASDAQ: BAGR
Focused on Sustainable Sales Growth
© 2015 by Diversified Restaurant Holdings, Inc. 19
Multiple initiatives in place to drive same store sales growth
1.5%
5.1%6.0% 6.3%
7.2%6.2%
7.2%
9.2%
3.5%
6.7%
3.7%
1.1% 1.2% 1.2%
5.0%5.8%
8.0%
Q12011
Q22011
Q32011
Q42011
Q12012
Q22012
Q32012
Q42012
Q12013
Q22013
Q32013
Q42013
Q12014
Q22014
Q32014
Q42014
Q12015
17 Consecutive Quarters of Positive Same Store Sales Growth
Traffic
Check
Marketing
Reimaging
§Stay ahead of the curve through differentiated, customizable and proprietary menu offerings that decrease “veto” vote and enhance guest experience
§New marketing program creates “buzz” around concept§Technologically sophisticated loyalty program attracts and retains guests
§New prototype designs for both Bagger Dave’s and BWW improve brand image§Features edgier feel with an increased emphasis on bar area and experience
§Table side selling of food and beverage items encourages higher attachment and productivity gains
NASDAQ: BAGR © 2015 by Diversified Restaurant Holdings, Inc. 20
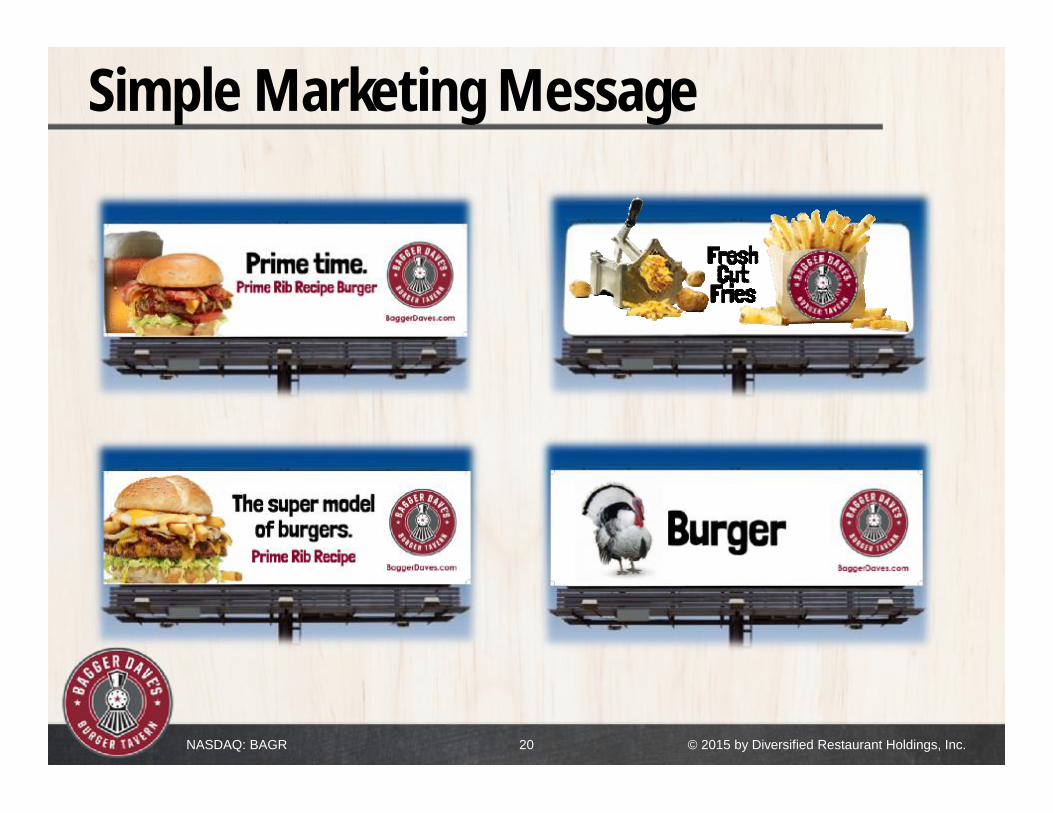
Simple Marketing Message

NASDAQ: BAGR
Bagger Dave’s – Increased AUVs
© 2015 by Diversified Restaurant Holdings, Inc. 12
Increasing unit volumes illustrate success of enhanced menu offerings, branding and guest experience.
Higher AUVs at newer locations is indicative of better real estate and enhanced interior/exterior design.
NASDAQ: BAGR © 2015 by Diversified Restaurant Holdings, Inc. 22
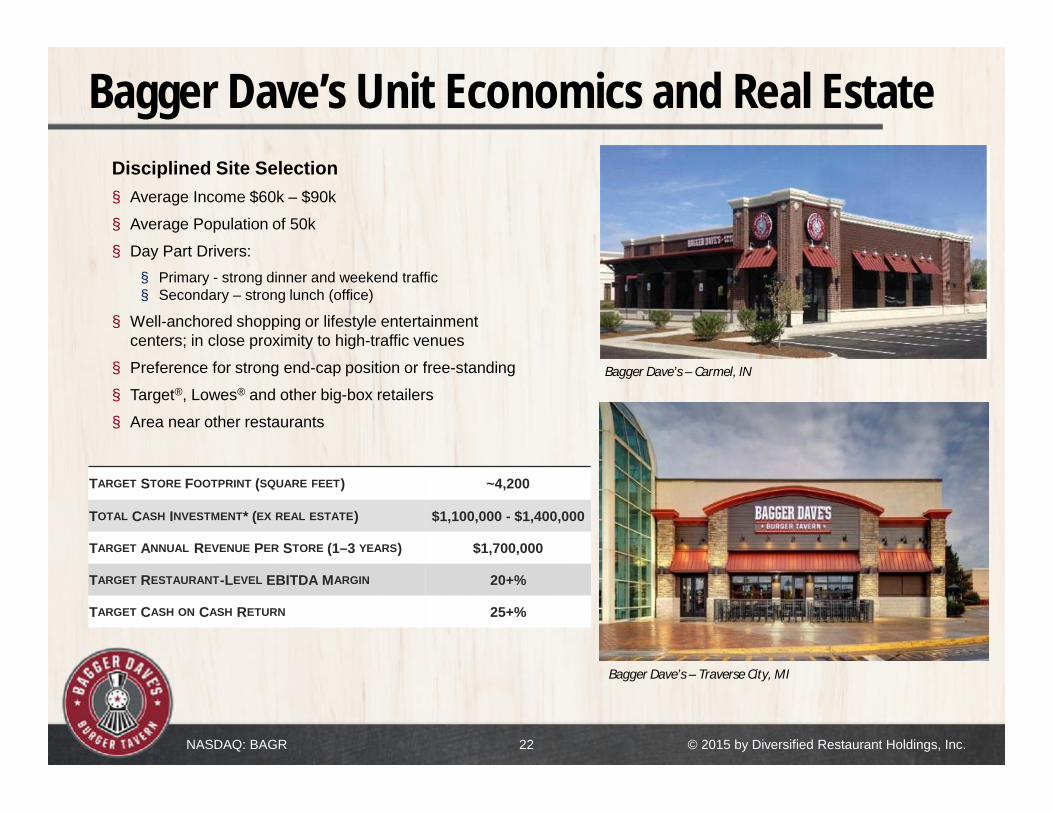
Bagger Dave’s Unit Economics and Real Estate
TARGET STORE FOOTPRINT (SQUARE FEET) ~4,200
TOTAL CASH INVESTMENT* (EX REAL ESTATE) $1,100,000 - $1,400,000
TARGET ANNUAL REVENUE PER STORE (1–3 YEARS) $1,700,000
TARGET RESTAURANT-LEVEL EBITDA MARGIN 20+%
TARGET CASH ON CASH RETURN 25+%
Disciplined Site Selection§ Average Income $60k – $90k
§ Average Population of 50k
§ Day Part Drivers: § Primary - strong dinner and weekend traffic§ Secondary – strong lunch (office)
§ Well-anchored shopping or lifestyle entertainment centers; in close proximity to high-traffic venues
§ Preference for strong end-cap position or free-standing
§ Target®, Lowes® and other big-box retailers
§ Area near other restaurants
Bagger Dave’s – Traverse City, MI
Bagger Dave’s – Carmel, IN
NASDAQ: BAGR
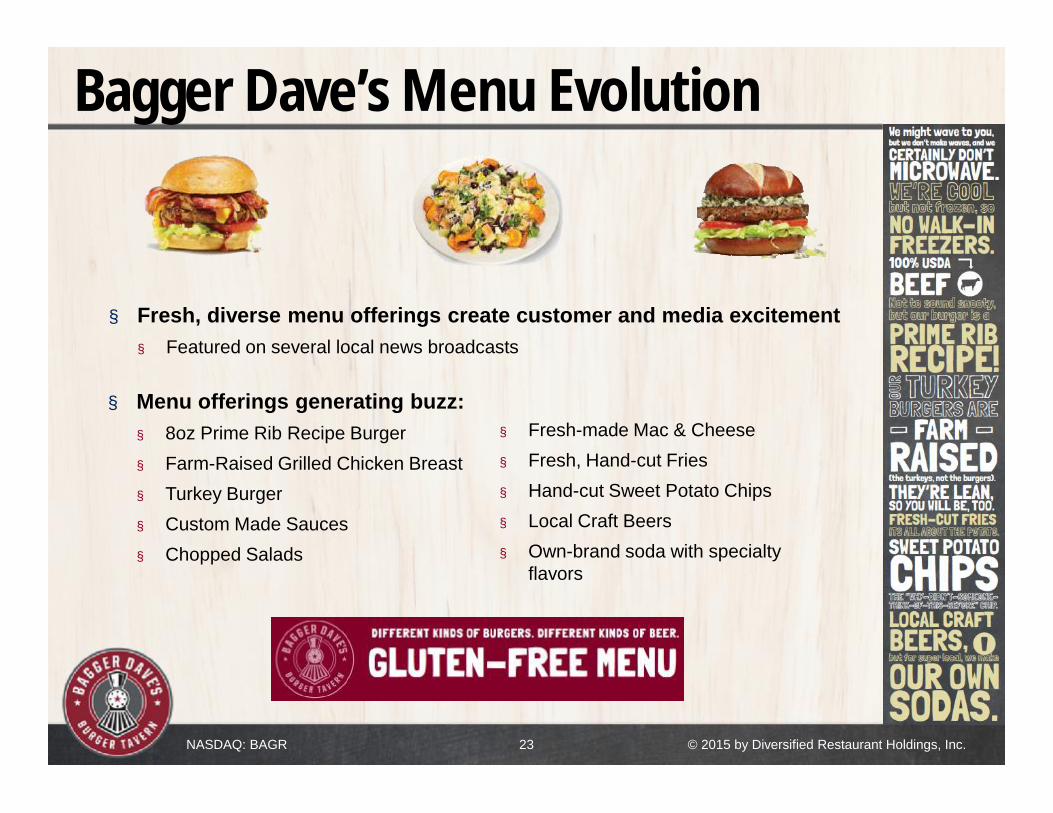
Bagger Dave’s Menu Evolution
© 2015 by Diversified Restaurant Holdings, Inc. 23
§ Fresh, diverse menu offerings create customer and media excitement§ Featured on several local news broadcasts
§ Menu offerings generating buzz: § 8oz Prime Rib Recipe Burger§ Farm-Raised Grilled Chicken Breast§ Turkey Burger§ Custom Made Sauces§ Chopped Salads
§ Fresh-made Mac & Cheese§ Fresh, Hand-cut Fries§ Hand-cut Sweet Potato Chips§ Local Craft Beers§ Own-brand soda with specialty
flavors
NASDAQ: BAGR © 2015 by Diversified Restaurant Holdings, Inc. 24
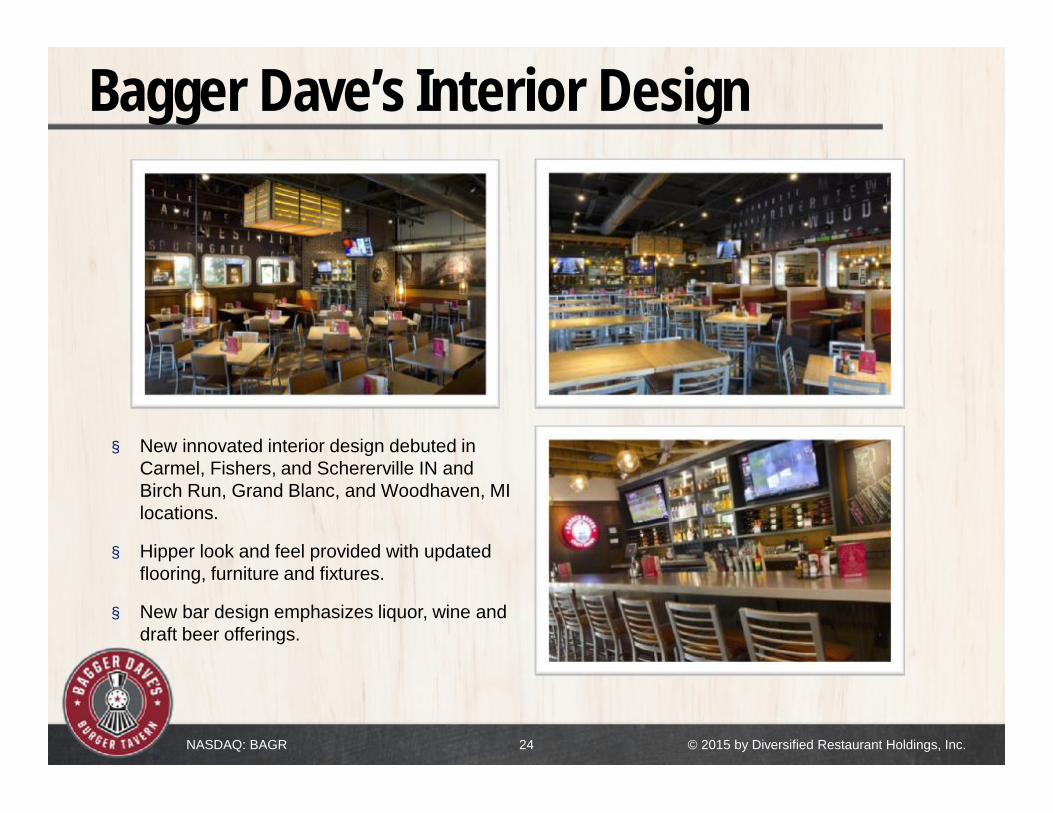
Bagger Dave’s Interior Design
§ New innovated interior design debuted in Carmel, Fishers, and Schererville IN and Birch Run, Grand Blanc, and Woodhaven, MI locations.
§ Hipper look and feel provided with updated flooring, furniture and fixtures.
§ New bar design emphasizes liquor, wine and draft beer offerings.
NASDAQ: BAGR © 2015 by Diversified Restaurant Holdings, Inc. 25
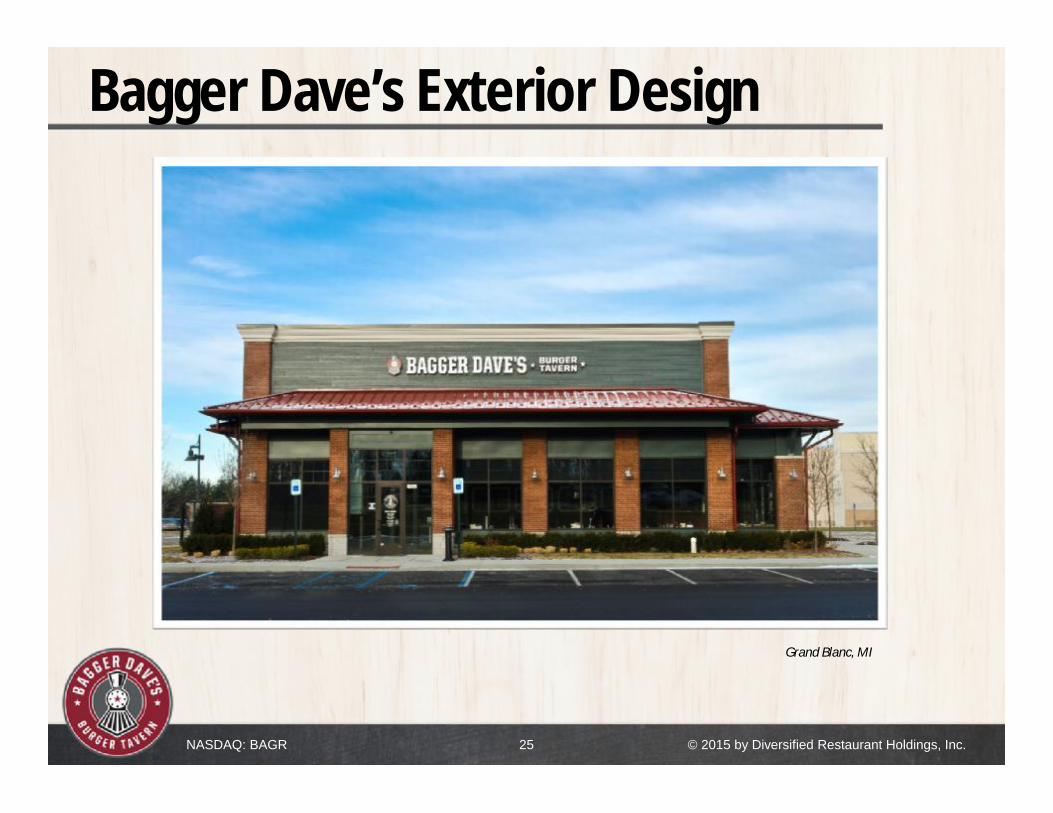
Bagger Dave’s Exterior Design
Grand Blanc, MI
NASDAQ: BAGR © 2015 by Diversified Restaurant Holdings, Inc. 26
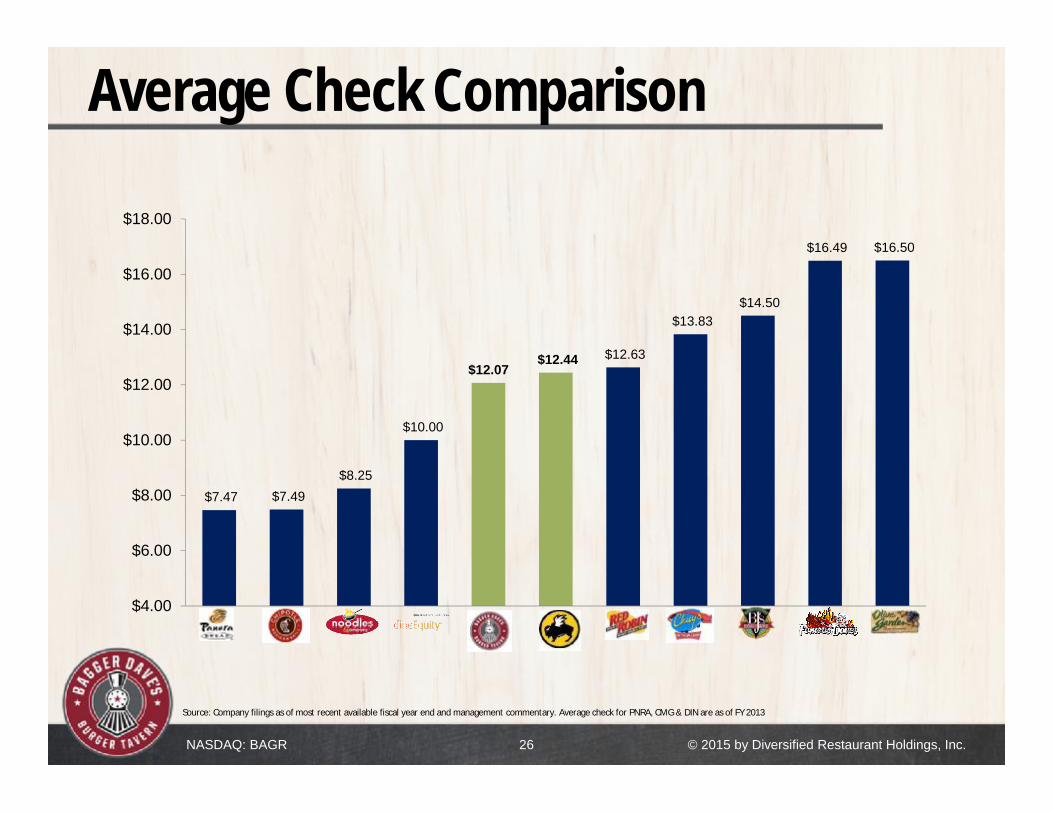
Average Check Comparison
$7.47 $7.49 $8.25
$10.00
$12.07 $12.44 $12.63
$13.83 $14.50
$16.49 $16.50
$4.00
$6.00
$8.00
$10.00
$12.00
$14.00
$16.00
$18.00
Source: Company filings as of most recent available fiscal year end and management commentary. Average check for PNRA, CMG & DIN are as of FY 2013
NASDAQ: BAGR © 2015 by Diversified Restaurant Holdings, Inc. 27
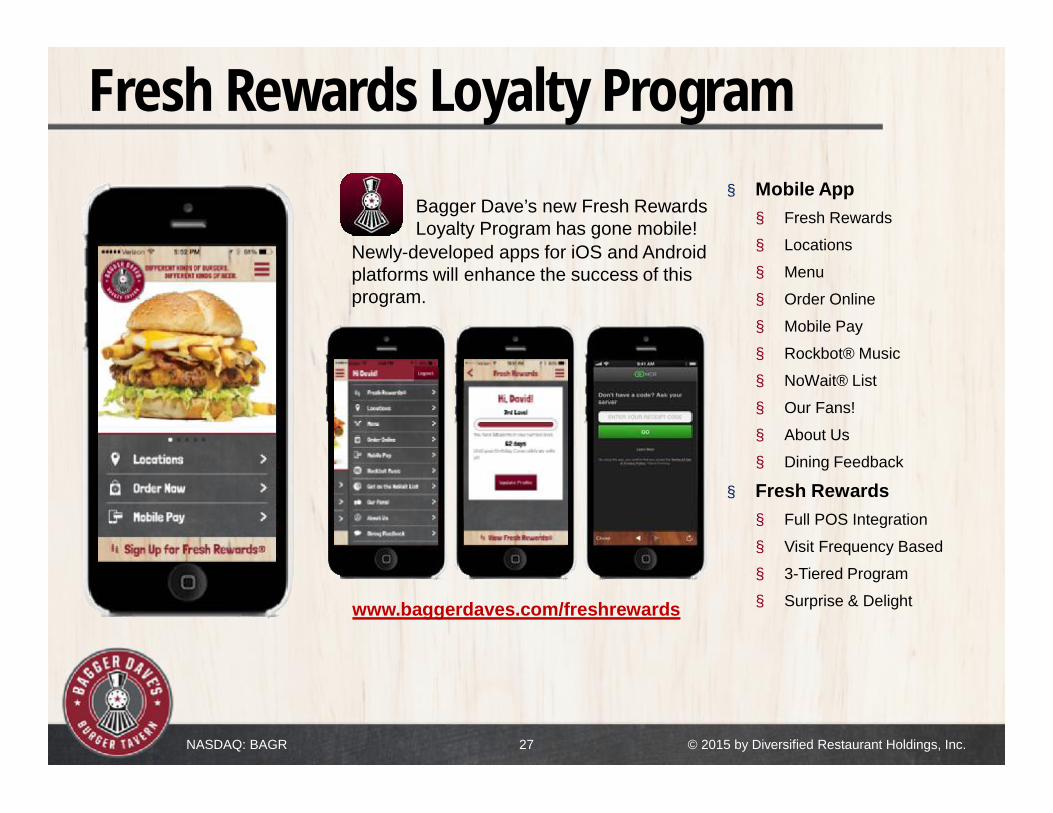
Fresh Rewards Loyalty Program
Bagger Dave’s new Fresh Rewards Loyalty Program has gone mobile!
§ Mobile App§ Fresh Rewards
§ Locations
§ Menu
§ Order Online
§ Mobile Pay
§ Rockbot® Music
§ NoWait® List
§ Our Fans!
§ About Us
§ Dining Feedback
§ Fresh Rewards§ Full POS Integration
§ Visit Frequency Based
§ 3-Tiered Program
§ Surprise & Delight
Newly-developed apps for iOS and Android platforms will enhance the success of this program.
www.baggerdaves.com/freshrewards
NASDAQ: BAGR © 2015 by Diversified Restaurant Holdings, Inc. 28
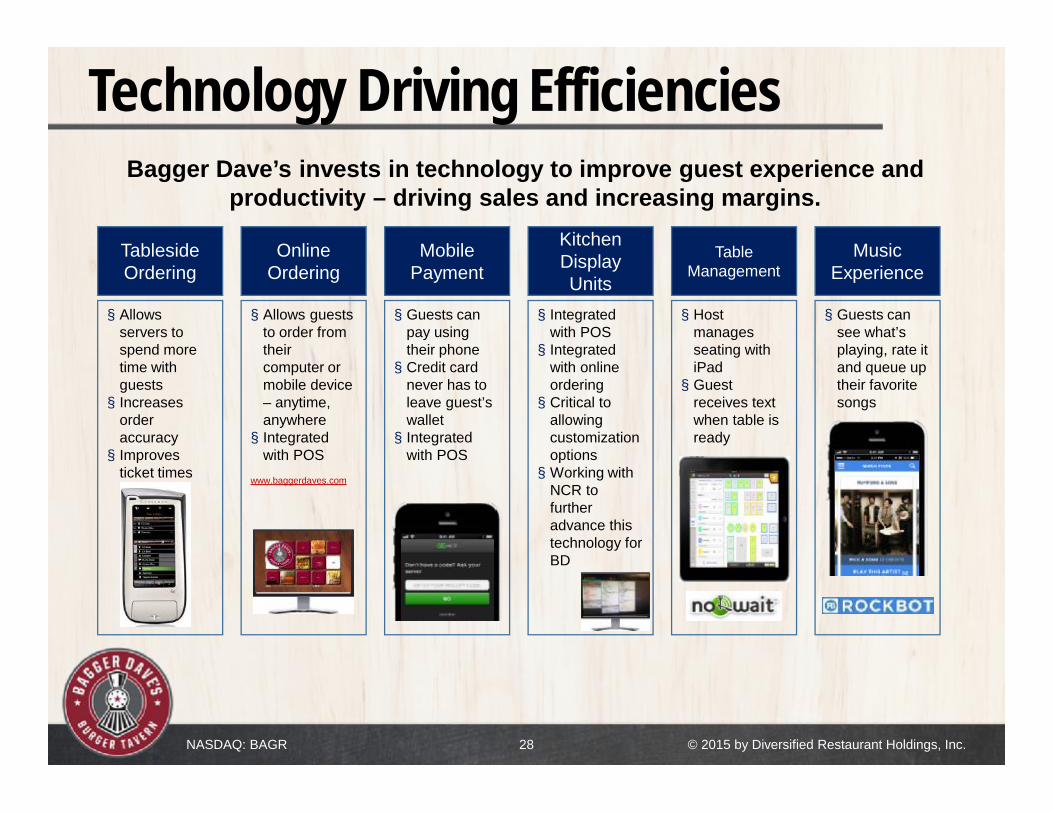
Technology Driving Efficiencies Bagger Dave’s invests in technology to improve guest experience and
productivity – driving sales and increasing margins.
§ Allows servers to spend more time with guests§ Increases
order accuracy§ Improves
ticket times
Tableside Ordering
§ Allows guests to order from their computer or mobile device – anytime, anywhere§ Integrated
with POS www.baggerdaves.com
Online Ordering
§ Guests can pay using their phone§ Credit card
never has to leave guest’s wallet§ Integrated
with POS
Mobile Payment
§ Integrated with POS§ Integrated
with online ordering§ Critical to
allowing customization options§ Working with
NCR to further advance this technology for BD
Kitchen Display Units
§ Host manages seating with iPad§ Guest
receives text when table is ready
Table Management
§ Guests can see what’s playing, rate it and queue up their favorite songs
MusicExperience

NASDAQ: BAGR © 2015 by Diversified Restaurant Holdings, Inc.
Supplemental Information
NASDAQ: BAGR © 2015 by Diversified Restaurant Holdings, Inc. 30
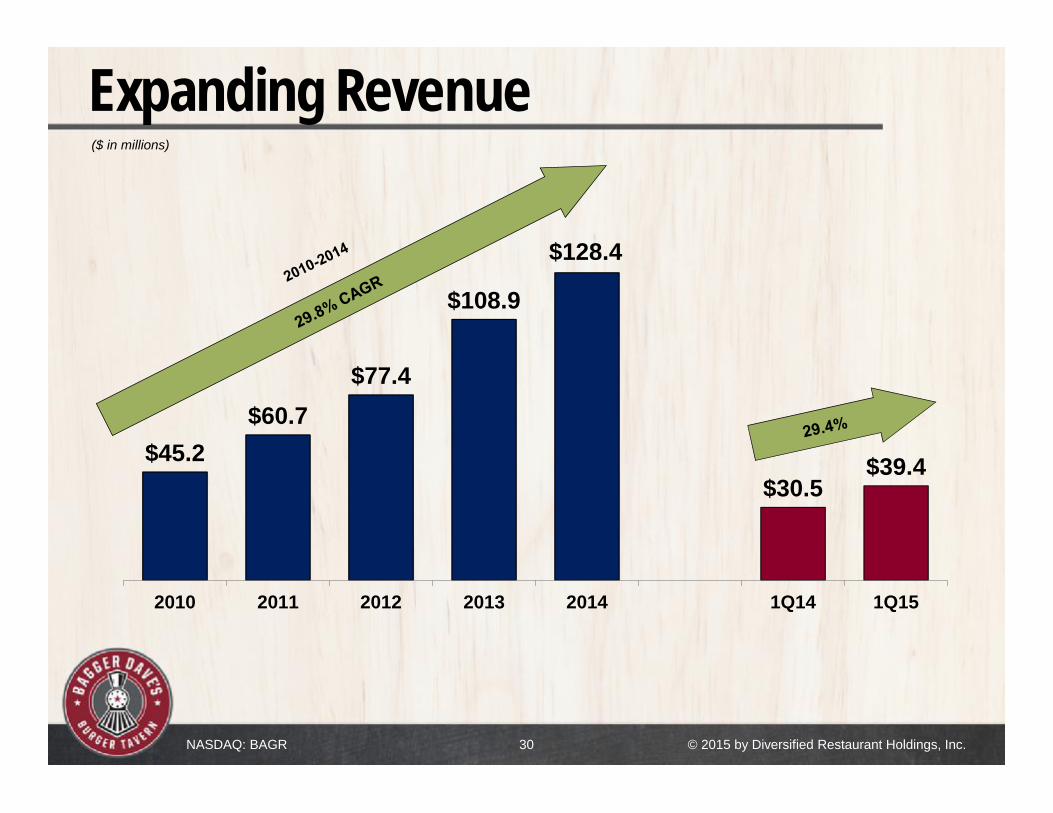
Expanding Revenue($ in millions)
$45.2$60.7
$77.4
$108.9
$128.4
$30.5$39.4
2010 2011 2012 2013 2014 1Q14 1Q15
NASDAQ: BAGR © 2015 by Diversified Restaurant Holdings, Inc. 31
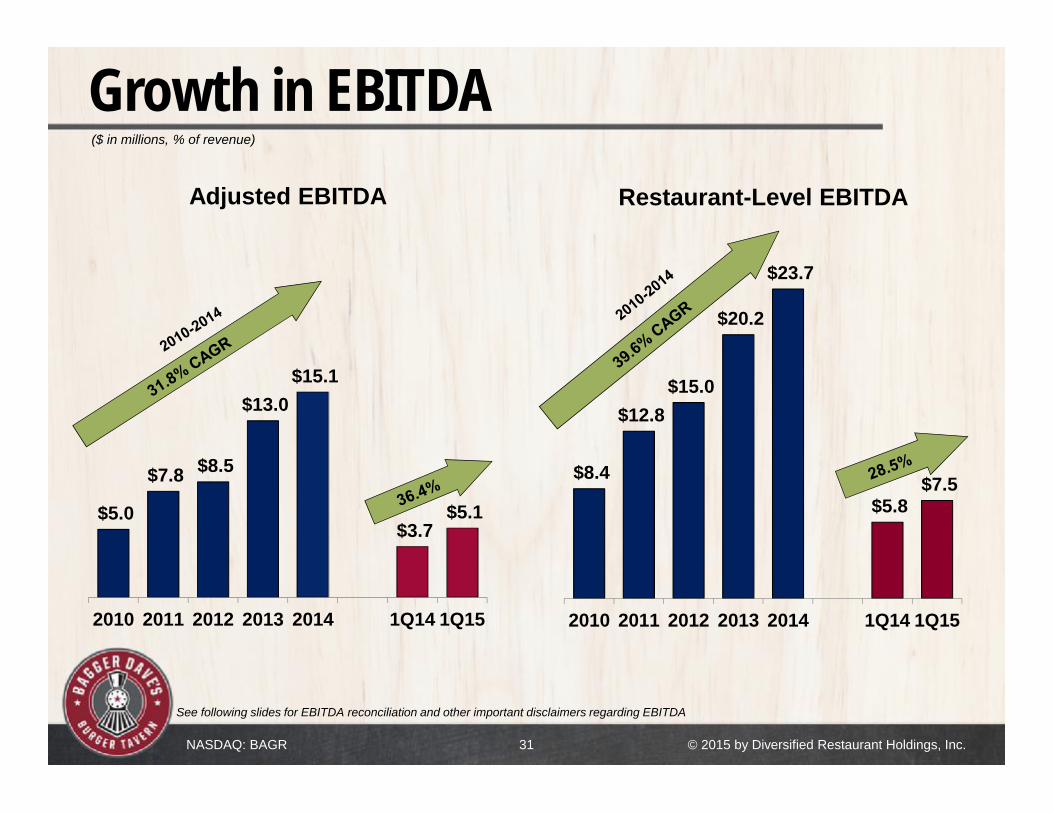
Growth in EBITDA
See following slides for EBITDA reconciliation and other important disclaimers regarding EBITDA
($ in millions, % of revenue)
$5.0
$7.8 $8.5
$13.0 $15.1
$3.7 $5.1
2010 2011 2012 2013 2014 1Q14 1Q15
Adjusted EBITDA
$8.4
$12.8 $15.0
$20.2
$23.7
$5.8 $7.5
2010 2011 2012 2013 2014 1Q14 1Q15
Restaurant-Level EBITDA
NASDAQ: BAGR © 2015 by Diversified Restaurant Holdings, Inc. 32
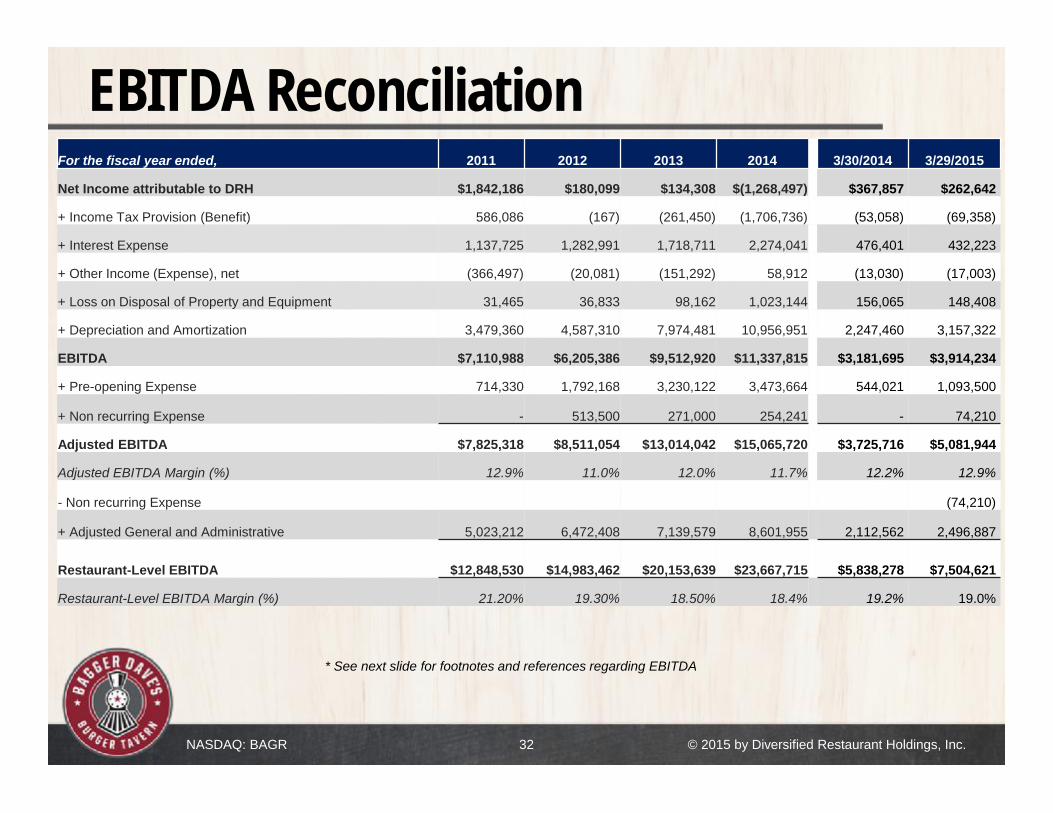
EBITDA Reconciliation
* See next slide for footnotes and references regarding EBITDA
For the fiscal year ended, 2011 2012 2013 2014 3/30/2014 3/29/2015
Net Income attributable to DRH $1,842,186 $180,099 $134,308 $(1,268,497) $367,857 $262,642
+ Income Tax Provision (Benefit) 586,086 (167) (261,450) (1,706,736) (53,058) (69,358)
+ Interest Expense 1,137,725 1,282,991 1,718,711 2,274,041 476,401 432,223
+ Other Income (Expense), net (366,497) (20,081) (151,292) 58,912 (13,030) (17,003)
+ Loss on Disposal of Property and Equipment 31,465 36,833 98,162 1,023,144 156,065 148,408
+ Depreciation and Amortization 3,479,360 4,587,310 7,974,481 10,956,951 2,247,460 3,157,322
EBITDA $7,110,988 $6,205,386 $9,512,920 $11,337,815 $3,181,695 $3,914,234
+ Pre-opening Expense 714,330 1,792,168 3,230,122 3,473,664 544,021 1,093,500
+ Non recurring Expense - 513,500 271,000 254,241 - 74,210
Adjusted EBITDA $7,825,318 $8,511,054 $13,014,042 $15,065,720 $3,725,716 $5,081,944
Adjusted EBITDA Margin (%) 12.9% 11.0% 12.0% 11.7% 12.2% 12.9%
- Non recurring Expense (74,210)
+ Adjusted General and Administrative 5,023,212 6,472,408 7,139,579 8,601,955 2,112,562 2,496,887
Restaurant-Level EBITDA $12,848,530 $14,983,462 $20,153,639 $23,667,715 $5,838,278 $7,504,621
Restaurant-Level EBITDA Margin (%) 21.20% 19.30% 18.50% 18.4% 19.2% 19.0%
NASDAQ: BAGR © 2015 by Diversified Restaurant Holdings, Inc. 33
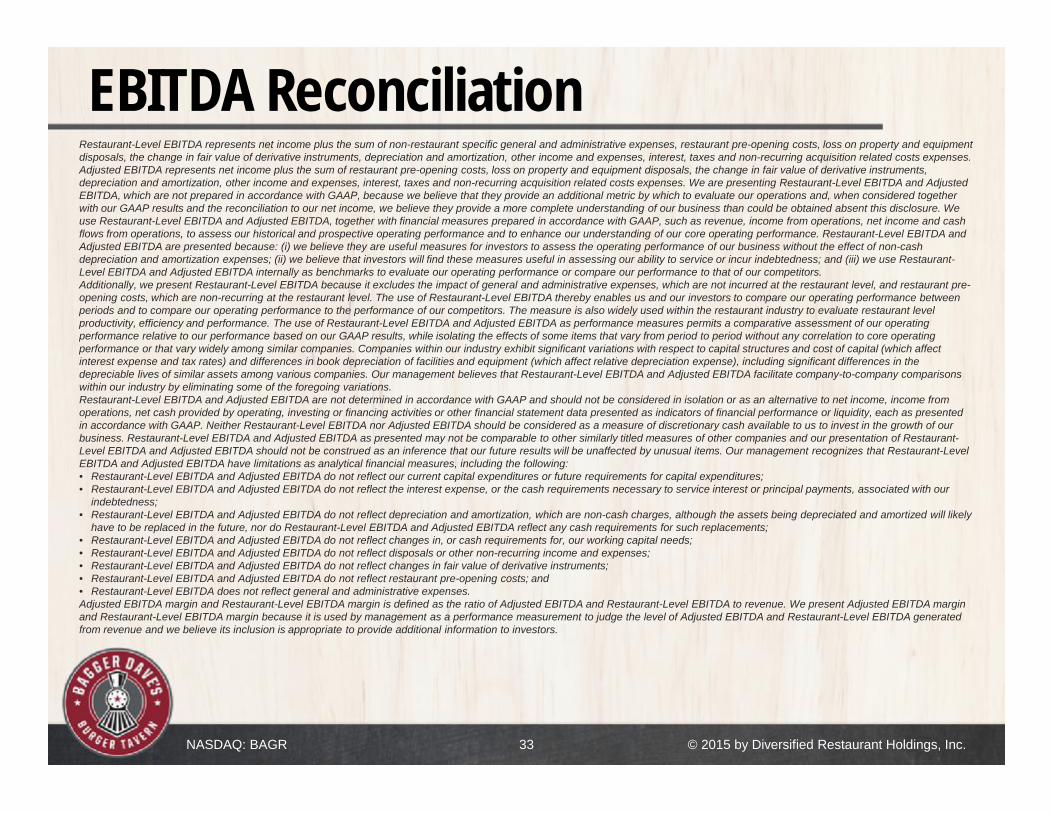
EBITDA ReconciliationRestaurant-Level EBITDA represents net income plus the sum of non-restaurant specific general and administrative expenses, restaurant pre-opening costs, loss on property and equipment disposals, the change in fair value of derivative instruments, depreciation and amortization, other income and expenses, interest, taxes and non-recurring acquisition related costs expenses. Adjusted EBITDA represents net income plus the sum of restaurant pre-opening costs, loss on property and equipment disposals, the change in fair value of derivative instruments, depreciation and amortization, other income and expenses, interest, taxes and non-recurring acquisition related costs expenses. We are presenting Restaurant-Level EBITDA and Adjusted EBITDA, which are not prepared in accordance with GAAP, because we believe that they provide an additional metric by which to evaluate our operations and, when considered together with our GAAP results and the reconciliation to our net income, we believe they provide a more complete understanding of our business than could be obtained absent this disclosure. We use Restaurant-Level EBITDA and Adjusted EBITDA, together with financial measures prepared in accordance with GAAP, such as revenue, income from operations, net income and cash flows from operations, to assess our historical and prospective operating performance and to enhance our understanding of our core operating performance. Restaurant-Level EBITDA and Adjusted EBITDA are presented because: (i) we believe they are useful measures for investors to assess the operating performance of our business without the effect of non-cash depreciation and amortization expenses; (ii) we believe that investors will find these measures useful in assessing our ability to service or incur indebtedness; and (iii) we use Restaurant-Level EBITDA and Adjusted EBITDA internally as benchmarks to evaluate our operating performance or compare our performance to that of our competitors.Additionally, we present Restaurant-Level EBITDA because it excludes the impact of general and administrative expenses, which are not incurred at the restaurant level, and restaurant pre-opening costs, which are non-recurring at the restaurant level. The use of Restaurant-Level EBITDA thereby enables us and our investors to compare our operating performance between periods and to compare our operating performance to the performance of our competitors. The measure is also widely used within the restaurant industry to evaluate restaurant level productivity, efficiency and performance. The use of Restaurant-Level EBITDA and Adjusted EBITDA as performance measures permits a comparative assessment of our operating performance relative to our performance based on our GAAP results, while isolating the effects of some items that vary from period to period without any correlation to core operating performance or that vary widely among similar companies. Companies within our industry exhibit significant variations with respect to capital structures and cost of capital (which affect interest expense and tax rates) and differences in book depreciation of facilities and equipment (which affect relative depreciation expense), including significant differences in the depreciable lives of similar assets among various companies. Our management believes that Restaurant-Level EBITDA and Adjusted EBITDA facilitate company-to-company comparisons within our industry by eliminating some of the foregoing variations.Restaurant-Level EBITDA and Adjusted EBITDA are not determined in accordance with GAAP and should not be considered in isolation or as an alternative to net income, income from operations, net cash provided by operating, investing or financing activities or other financial statement data presented as indicators of financial performance or liquidity, each as presented in accordance with GAAP. Neither Restaurant-Level EBITDA nor Adjusted EBITDA should be considered as a measure of discretionary cash available to us to invest in the growth of our business. Restaurant-Level EBITDA and Adjusted EBITDA as presented may not be comparable to other similarly titled measures of other companies and our presentation of Restaurant-Level EBITDA and Adjusted EBITDA should not be construed as an inference that our future results will be unaffected by unusual items. Our management recognizes that Restaurant-Level EBITDA and Adjusted EBITDA have limitations as analytical financial measures, including the following:• Restaurant-Level EBITDA and Adjusted EBITDA do not reflect our current capital expenditures or future requirements for capital expenditures;• Restaurant-Level EBITDA and Adjusted EBITDA do not reflect the interest expense, or the cash requirements necessary to service interest or principal payments, associated with our
indebtedness;• Restaurant-Level EBITDA and Adjusted EBITDA do not reflect depreciation and amortization, which are non-cash charges, although the assets being depreciated and amortized will likely
have to be replaced in the future, nor do Restaurant-Level EBITDA and Adjusted EBITDA reflect any cash requirements for such replacements;• Restaurant-Level EBITDA and Adjusted EBITDA do not reflect changes in, or cash requirements for, our working capital needs;• Restaurant-Level EBITDA and Adjusted EBITDA do not reflect disposals or other non-recurring income and expenses;• Restaurant-Level EBITDA and Adjusted EBITDA do not reflect changes in fair value of derivative instruments;• Restaurant-Level EBITDA and Adjusted EBITDA do not reflect restaurant pre-opening costs; and• Restaurant-Level EBITDA does not reflect general and administrative expenses.Adjusted EBITDA margin and Restaurant-Level EBITDA margin is defined as the ratio of Adjusted EBITDA and Restaurant-Level EBITDA to revenue. We present Adjusted EBITDA margin and Restaurant-Level EBITDA margin because it is used by management as a performance measurement to judge the level of Adjusted EBITDA and Restaurant-Level EBITDA generated from revenue and we believe its inclusion is appropriate to provide additional information to investors.
NASDAQ: BAGR
Contact Information
Investor Contact:Raphael [email protected]
Or visit us at:www.diversifiedrestaurantholdings.com
© 2015 by Diversified Restaurant Holdings, Inc.