Embed Size (px)
Citation preview
AGILITY HEALTH
INVESTOR PRESENTATION
March 2017
Safe Harbor
Disclosure
Certain statements contained in this presentation may be considered “forward-looking information”
as defined under applicable Canadian securities laws (“forward-looking statements”). Forward-
looking statements include, but are not limited to, statements made under the heading “Risk
Factors” of the base shelf prospectus of Agility Health, Inc. dated May 29, 2015 and other
statements concerning the objectives of Agility Health, Inc. (“Agility”), strategies to achieve those
objectives, as well as statements with respect to management’s beliefs, plans, estimates, and
intentions, and similar statements concerning anticipated future events, results, circumstances,
performance or expectations that are not historical facts. Forward-looking statements generally can
be identified by the use of forward-looking terminology such as “outlook”, “objective”, “may”, “will”,
“expect”, “intend”, “estimate”, “anticipate”, “believe”, “should”, “plans”, or “continue”, or similar
expressions suggesting future outcomes or events. Such forward-looking statements reflect
management’s current beliefs and are based on information currently available to management.
Forward-looking statements involve risks and uncertainties that could cause actual results to differ
materially from those contemplated by such statements.
No assurance can be given as to any such future results, levels of activity or achievements and
neither Agility nor any other person assumes responsibility for the accuracy and completeness of
any forward-looking statements. The factors underlying current expectations are dynamic and
subject to change. All forward-looking statements in this presentation are qualified by these
cautionary statements. Other than specifically required by applicable laws, Agility is under no
obligation and expressly disclaims any such obligation to update or alter the forward-looking
statements whether as a result of new information, future events or otherwise except as may be
required by law.
All reference to dollars in this presentation are to U.S. dollars, unless otherwise indicated.2
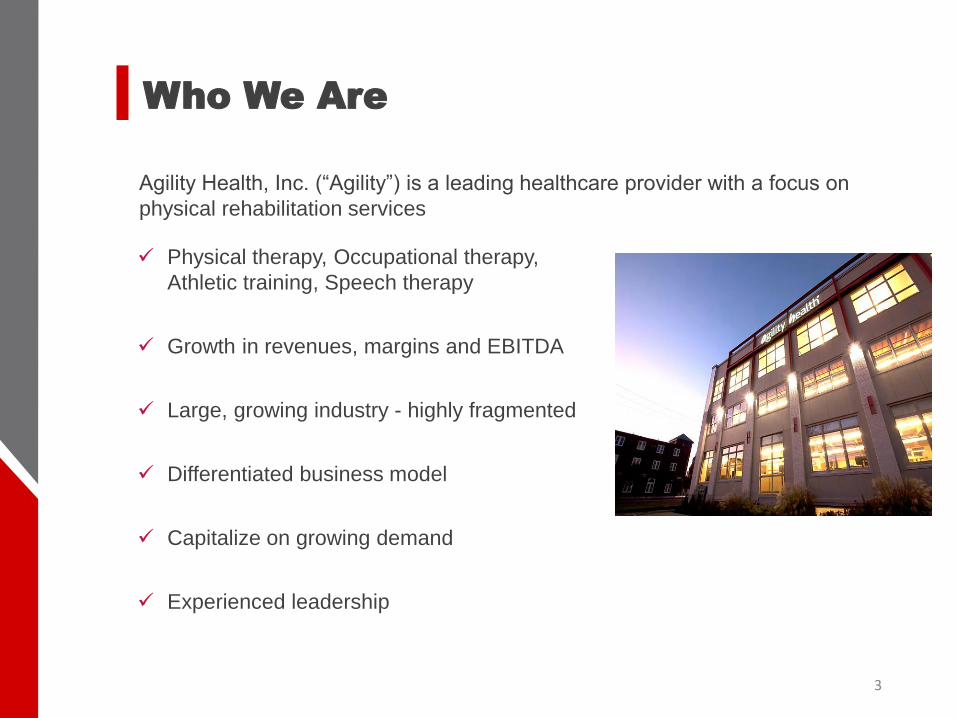
Who We Are
Agility Health, Inc. (“Agility”) is a leading healthcare provider with a focus on
physical rehabilitation services
3
Physical therapy, Occupational therapy,
Athletic training, Speech therapy
Growth in revenues, margins and EBITDA
Large, growing industry - highly fragmented
Differentiated business model
Capitalize on growing demand
Experienced leadership

Physical Therapy Market Overview
4
Physical therapy is a >US$30 billion industry that is expected to grow 7% annually through 2018.
Physical therapy accounts for approximately 90% of all outpatient rehabilitation spending
• Highly fragmented with largest 50 competitors comprising less than 25% of the market
Numerous, positive factors driving long-term growth:
• Expanding patient population that provides favorable tailwinds:
− Aging U.S. population − Unhealthy youth lifestyle trends − Growth in employment
• Outpatient rehabilitation is significantly less costly than surgery or hospitalization, but with similar
clinical effectiveness
U.S. Outpatient Rehabilitation Expenditures Outpatient Rehabilitation Spending by Segment
For the Years Ended and Ending December 31, 2004-2018P($ in billions)
$0
$5
$10
$15
$20
$25
$30
$40
$45
2004 2005 2006 2007 2008 2009 2010 2011 2012 2013E 2014P 2015P 2016P 2017P 2018P
Orthopedic Physical Therapy
48%
Speech Therapy and Audiology
10%
GeneralPhysical
Therapy9%
$35
GeriatricPhysical
Therapy 9%
PediatricPhysical
Therapy
8%
Sportsphysical
Therapy
7%Other Specialty Neurological
Physical Therapy Physical Therapy
3% 6%90%
Source: IBISWorld.
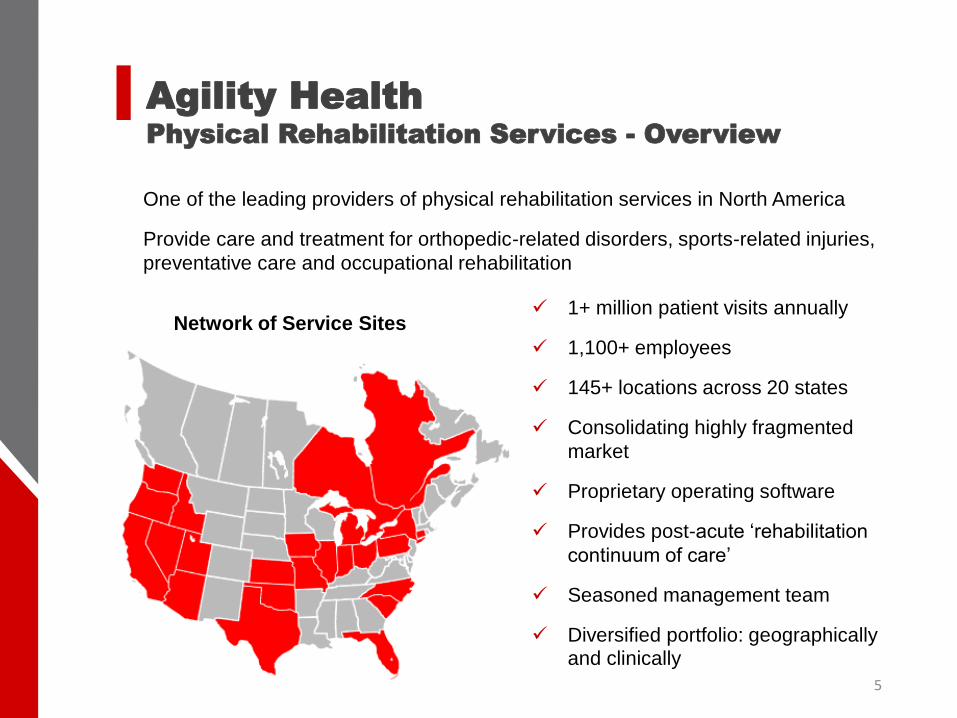
Network of Service Sites 1+ million patient visits annually
1,100+ employees
145+ locations across 20 states
Consolidating highly fragmented
market
Proprietary operating software
Provides post-acute ‘rehabilitation
continuum of care’
Seasoned management team
Diversified portfolio: geographically and clinically
5
One of the leading providers of physical rehabilitation services in North America
Provide care and treatment for orthopedic-related disorders, sports-related injuries,
preventative care and occupational rehabilitation
Agility Health
Physical Rehabilitation Services - Overview
6
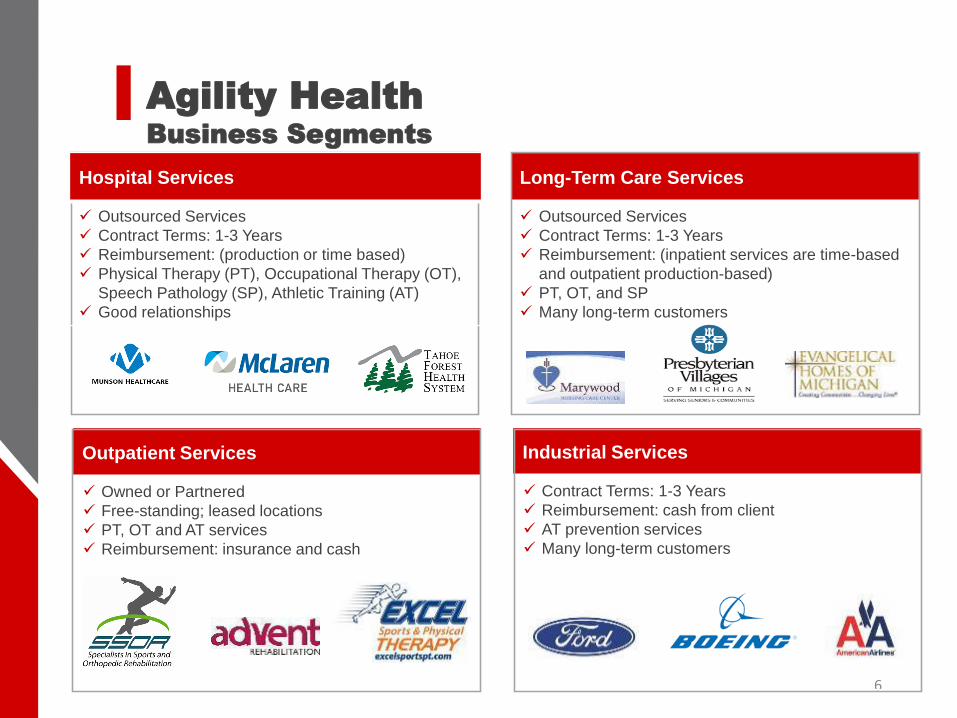
Hospital Services
Outsourced Services
Contract Terms: 1-3 Years
Reimbursement: (production or time based)
Physical Therapy (PT), Occupational Therapy (OT),
Speech Pathology (SP), Athletic Training (AT)
Good relationships
Long-Term Care Services
Outsourced Services
Contract Terms: 1-3 Years
Reimbursement: (inpatient services are time-based
and outpatient production-based)
PT, OT, and SP
Many long-term customers
Outpatient Services
Owned or Partnered
Free-standing; leased locations
PT, OT and AT services
Reimbursement: insurance and cash
Industrial Services
Contract Terms: 1-3 Years
Reimbursement: cash from client
AT prevention services
Many long-term customers
Agility Health
Business Segments
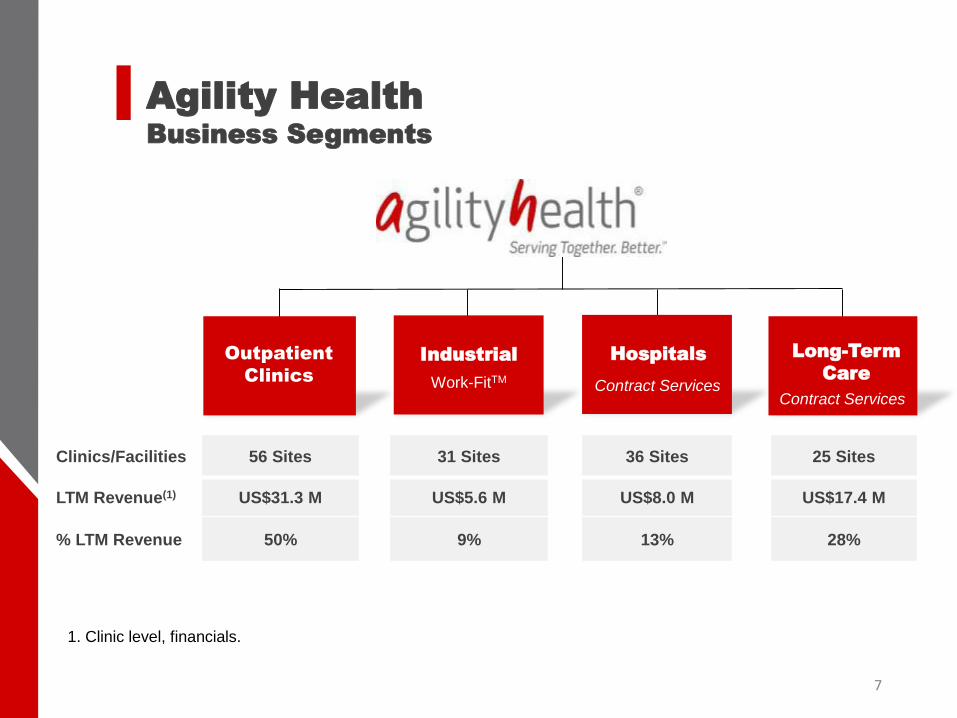
Long-Term
Care
Contract Services
Outpatient
Clinics
Hospitals
Contract Services
Industrial
Work-FitTM
7
Clinics/Facilities 56 Sites 31 Sites 36 Sites 25 Sites
LTM Revenue(1) US$31.3 M US$5.6 M US$8.0 M US$17.4 M
% LTM Revenue 50% 9% 13% 28%
1. Clinic level, financials.
Agility Health
Business Segments

Agility Health
Gross Charges by Payor
Gross Charges by Payor 2015Gross Charges by Payor 2014
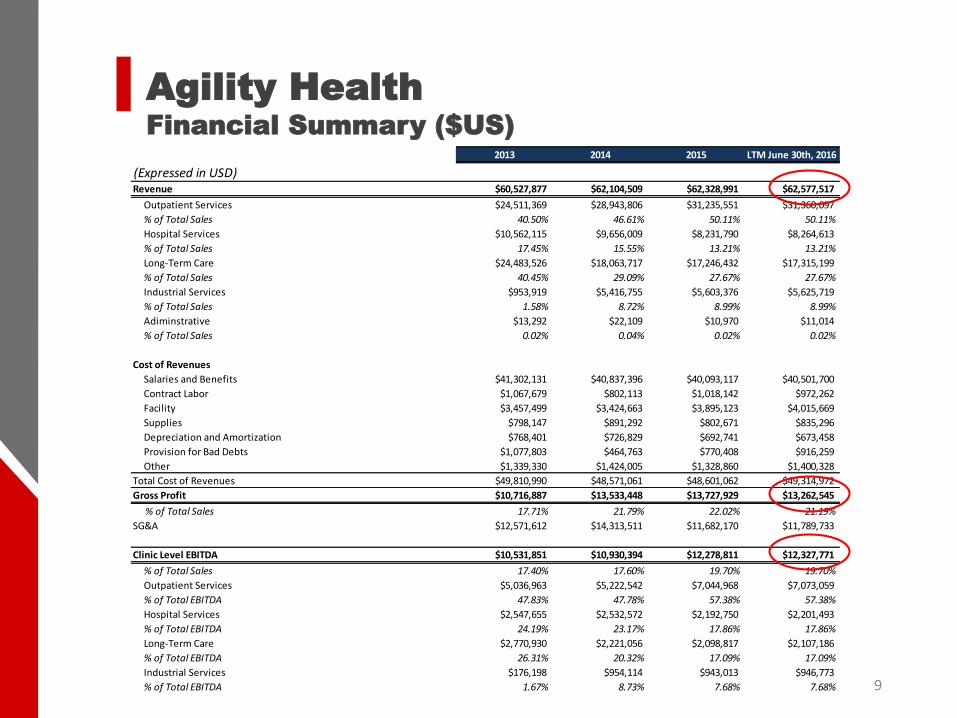
2013 2014 2015 LTM June 30th, 2016
(Expressed in USD)Revenue $60,527,877 $62,104,509 $62,328,991 $62,577,517
Outpatient Services $24,511,369 $28,943,806 $31,235,551 $31,360,097
% of Total Sales 40.50% 46.61% 50.11% 50.11%
Hospital Services $10,562,115 $9,656,009 $8,231,790 $8,264,613
% of Total Sales 17.45% 15.55% 13.21% 13.21%
Long-Term Care $24,483,526 $18,063,717 $17,246,432 $17,315,199
% of Total Sales 40.45% 29.09% 27.67% 27.67%
Industrial Services $953,919 $5,416,755 $5,603,376 $5,625,719
% of Total Sales 1.58% 8.72% 8.99% 8.99%
Adiminstrative $13,292 $22,109 $10,970 $11,014
% of Total Sales 0.02% 0.04% 0.02% 0.02%
Cost of Revenues
Salaries and Benefits $41,302,131 $40,837,396 $40,093,117 $40,501,700
Contract Labor $1,067,679 $802,113 $1,018,142 $972,262
Facility $3,457,499 $3,424,663 $3,895,123 $4,015,669
Supplies $798,147 $891,292 $802,671 $835,296
Depreciation and Amortization $768,401 $726,829 $692,741 $673,458
Provision for Bad Debts $1,077,803 $464,763 $770,408 $916,259
Other $1,339,330 $1,424,005 $1,328,860 $1,400,328
Total Cost of Revenues $49,810,990 $48,571,061 $48,601,062 $49,314,972
Gross Profit $10,716,887 $13,533,448 $13,727,929 $13,262,545
% of Total Sales 17.71% 21.79% 22.02% 21.19%
SG&A $12,571,612 $14,313,511 $11,682,170 $11,789,733
Clinic Level EBITDA $10,531,851 $10,930,394 $12,278,811 $12,327,771
% of Total Sales 17.40% 17.60% 19.70% 19.70%
Outpatient Services $5,036,963 $5,222,542 $7,044,968 $7,073,059
% of Total EBITDA 47.83% 47.78% 57.38% 57.38%
Hospital Services $2,547,655 $2,532,572 $2,192,750 $2,201,493
% of Total EBITDA 24.19% 23.17% 17.86% 17.86%
Long-Term Care $2,770,930 $2,221,056 $2,098,817 $2,107,186
% of Total EBITDA 26.31% 20.32% 17.09% 17.09%
Industrial Services $176,198 $954,114 $943,013 $946,773
% of Total EBITDA 1.67% 8.73% 7.68% 7.68%
Agility Health
Financial Summary ($US)
9
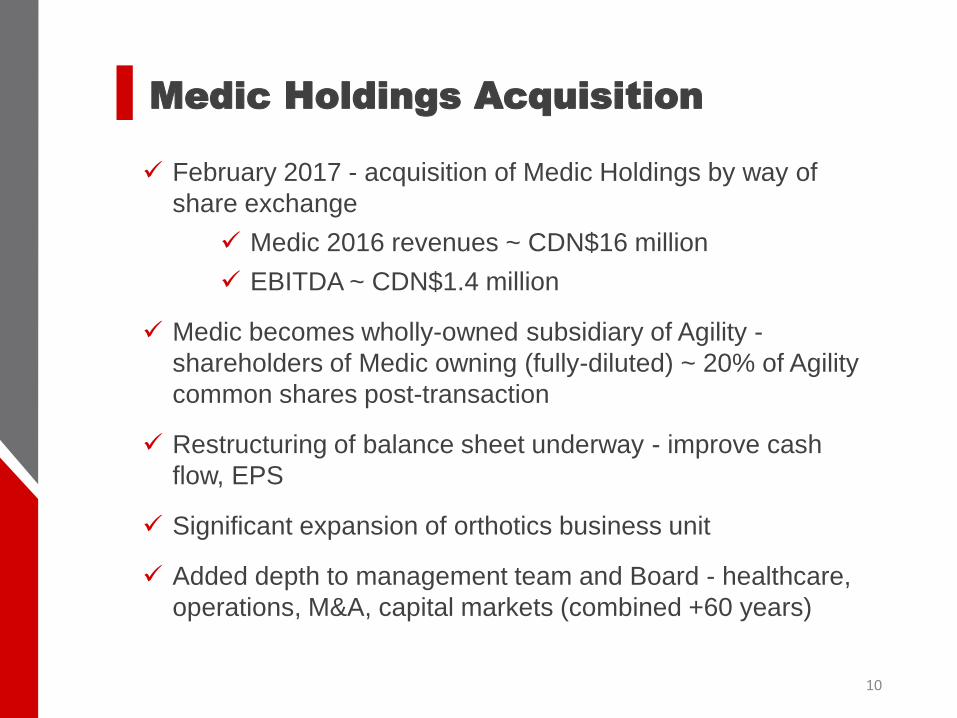
Medic Holdings Acquisition
10
February 2017 - acquisition of Medic Holdings by way of
share exchange
Medic 2016 revenues ~ CDN$16 million
EBITDA ~ CDN$1.4 million
Medic becomes wholly-owned subsidiary of Agility -
shareholders of Medic owning (fully-diluted) ~ 20% of Agility
common shares post-transaction
Restructuring of balance sheet underway - improve cash
flow, EPS
Significant expansion of orthotics business unit
Added depth to management team and Board - healthcare,
operations, M&A, capital markets (combined +60 years)
11
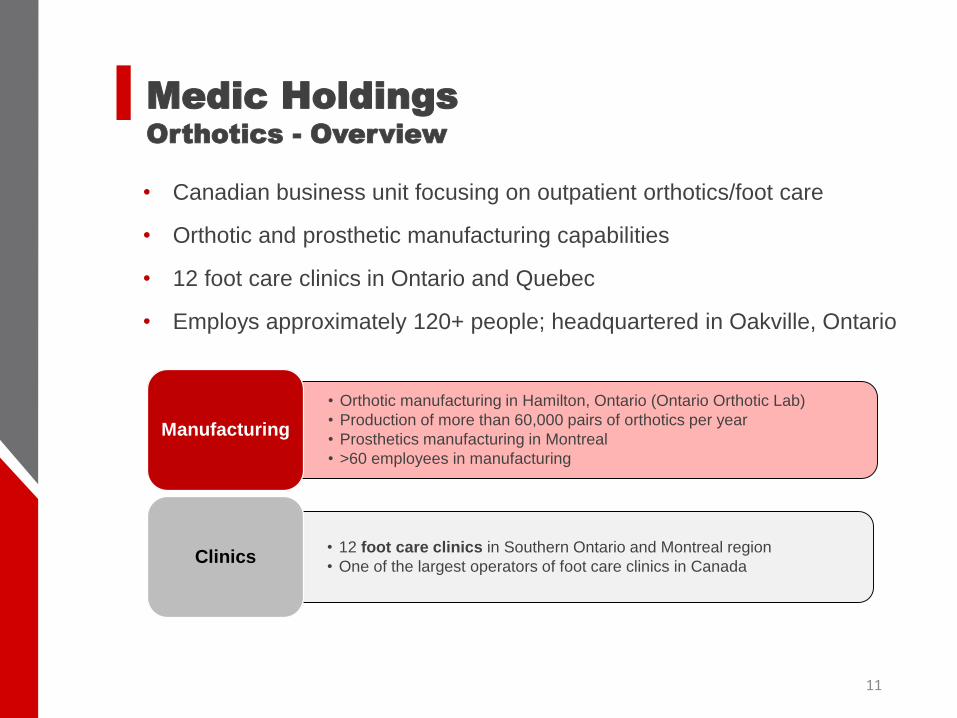
• Canadian business unit focusing on outpatient orthotics/foot care
• Orthotic and prosthetic manufacturing capabilities
• 12 foot care clinics in Ontario and Quebec
• Employs approximately 120+ people; headquartered in Oakville, Ontario
• Orthotic manufacturing in Hamilton, Ontario (Ontario Orthotic Lab)
• Production of more than 60,000 pairs of orthotics per year
• Prosthetics manufacturing in Montreal
• >60 employees in manufacturing
Manufacturing
• 12 foot care clinics in Southern Ontario and Montreal region
• One of the largest operators of foot care clinics in Canada Clinics
Medic Holdings
Orthotics - Overview

12
Ontario Orthotic Lab
• Manufactures arch supports (orthotics)
• 40 plant employees
• ~3,000 pairs of orthotics on back order
Product Offerings:
Custom-manufactured, prescription orthotic
devices for dress, athletic, casual or
diabetic footwear (compatible with Adidas,
Nike, Rockport, Drew, Asics and NAOT)
Wide variety of compression hosiery styles
and brands
Functional electrical stimulation (FES),
prosthetics, T.E.N.S pain management,
home health care and mobility aids
Medic Holdings
Business Segments
Slawner Orthotics
• Leader in field of orthotics and prosthetics
• Over 60 years of service history
• Multiple locations around Montreal; serves
multiple hospitals
Product Offerings:
Comfort shoes
Foot orthotics
Functional electrical stimulation (FES),
compression therapy, T.E.N.S. pain
management, home care and mobility aids
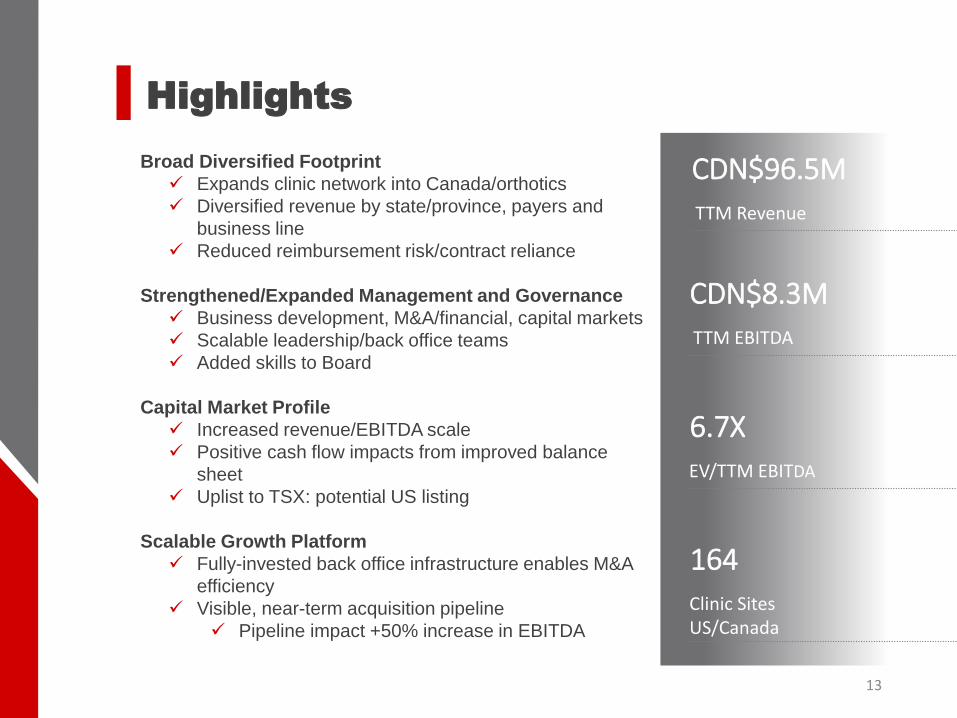
Highlights
13
Broad Diversified Footprint
Expands clinic network into Canada/orthotics
Diversified revenue by state/province, payers and
business line
Reduced reimbursement risk/contract reliance
Strengthened/Expanded Management and Governance
Business development, M&A/financial, capital markets
Scalable leadership/back office teams
Added skills to Board
Capital Market Profile
Increased revenue/EBITDA scale
Positive cash flow impacts from improved balance
sheet
Uplist to TSX: potential US listing
Scalable Growth Platform
Fully-invested back office infrastructure enables M&A
efficiency
Visible, near-term acquisition pipeline
Pipeline impact +50% increase in EBITDA
CDN$96.5M
TTM Revenue
CDN$8.3M
TTM EBITDA
6.7X
EV/TTM EBITDA
164
Clinic Sites US/Canada
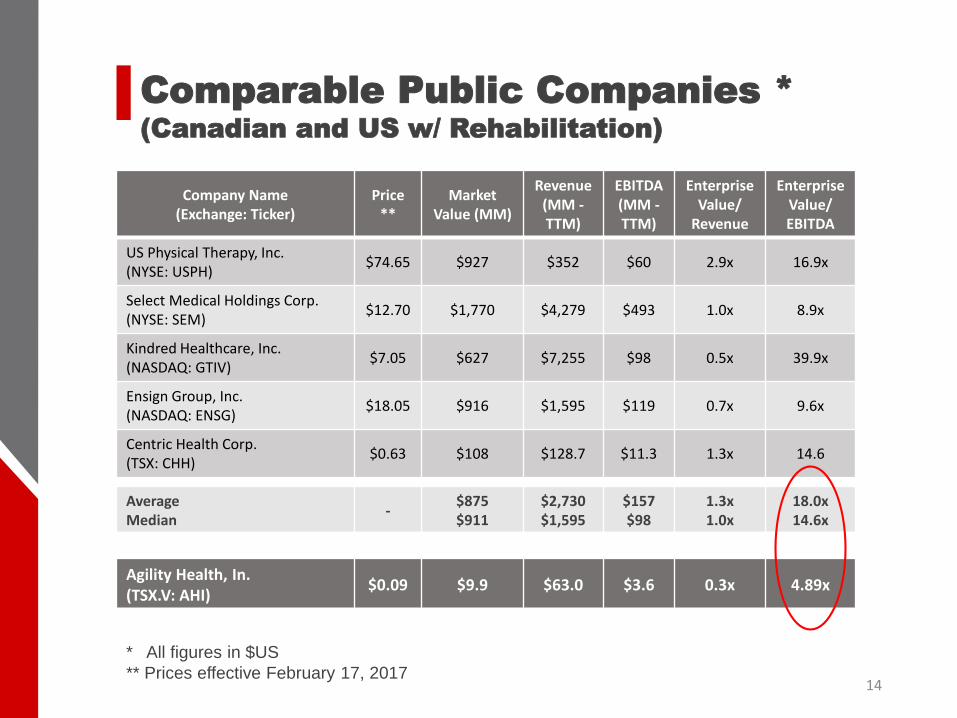
Comparable Public Companies *
(Canadian and US w/ Rehabilitation)
14
* All figures in $US
** Prices effective February 17, 2017
Company Name(Exchange: Ticker)
Price **
MarketValue (MM)
Revenue(MM -TTM)
EBITDA(MM -TTM)
EnterpriseValue/
Revenue
EnterpriseValue/EBITDA
US Physical Therapy, Inc.(NYSE: USPH)
$74.65 $927 $352 $60 2.9x 16.9x
Select Medical Holdings Corp.(NYSE: SEM)
$12.70 $1,770 $4,279 $493 1.0x 8.9x
Kindred Healthcare, Inc.(NASDAQ: GTIV)
$7.05 $627 $7,255 $98 0.5x 39.9x
Ensign Group, Inc.(NASDAQ: ENSG)
$18.05 $916 $1,595 $119 0.7x 9.6x
Centric Health Corp.(TSX: CHH)
$0.63 $108 $128.7 $11.3 1.3x 14.6
AverageMedian
-$875$911
$2,730$1,595
$157$98
1.3x1.0x
18.0x14.6x
Agility Health, In.(TSX.V: AHI)
$0.09 $9.9 $63.0 $3.6 0.3x 4.89x
15
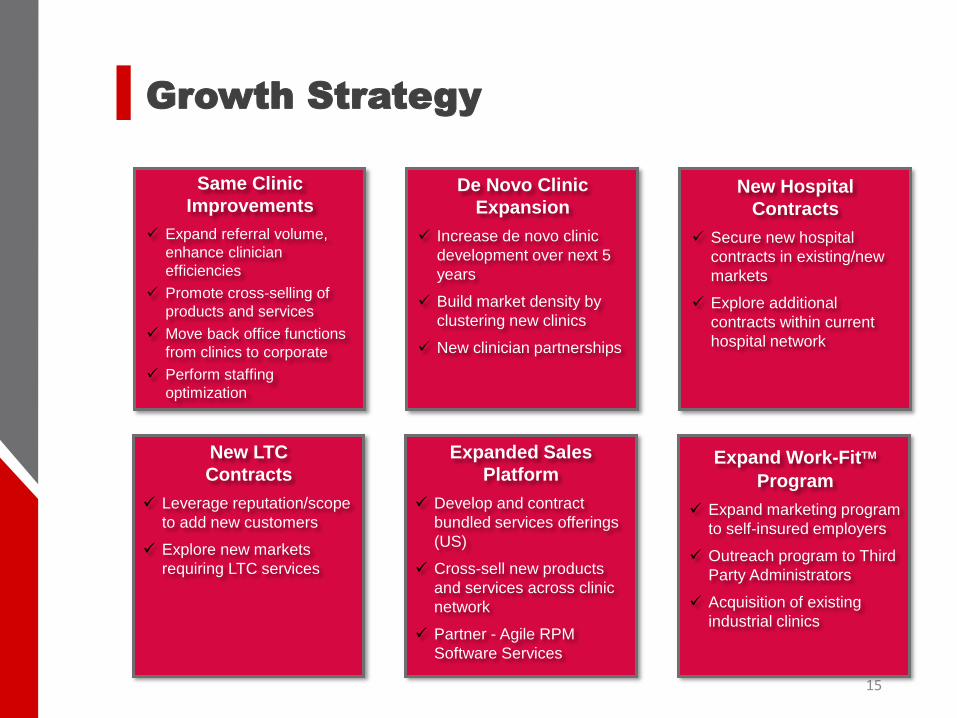
Growth Strategy
Same Clinic
Improvements
Expand referral volume,
enhance clinician
efficiencies
Promote cross-selling of
products and services
Move back office functions
from clinics to corporate
Perform staffing
optimization
De Novo Clinic
Expansion
Increase de novo clinic
development over next 5
years
Build market density by
clustering new clinics
New clinician partnerships
New Hospital
Contracts
Secure new hospital
contracts in existing/new
markets
Explore additional
contracts within current
hospital network
New LTC
Contracts
Leverage reputation/scope
to add new customers
Explore new markets
requiring LTC services
Expanded Sales
Platform
Develop and contract
bundled services offerings
(US)
Cross-sell new products
and services across clinic
network
Partner - Agile RPM
Software Services
Expand Work-FitTM
Program
Expand marketing program
to self-insured employers
Outreach program to Third
Party Administrators
Acquisition of existing
industrial clinics
16
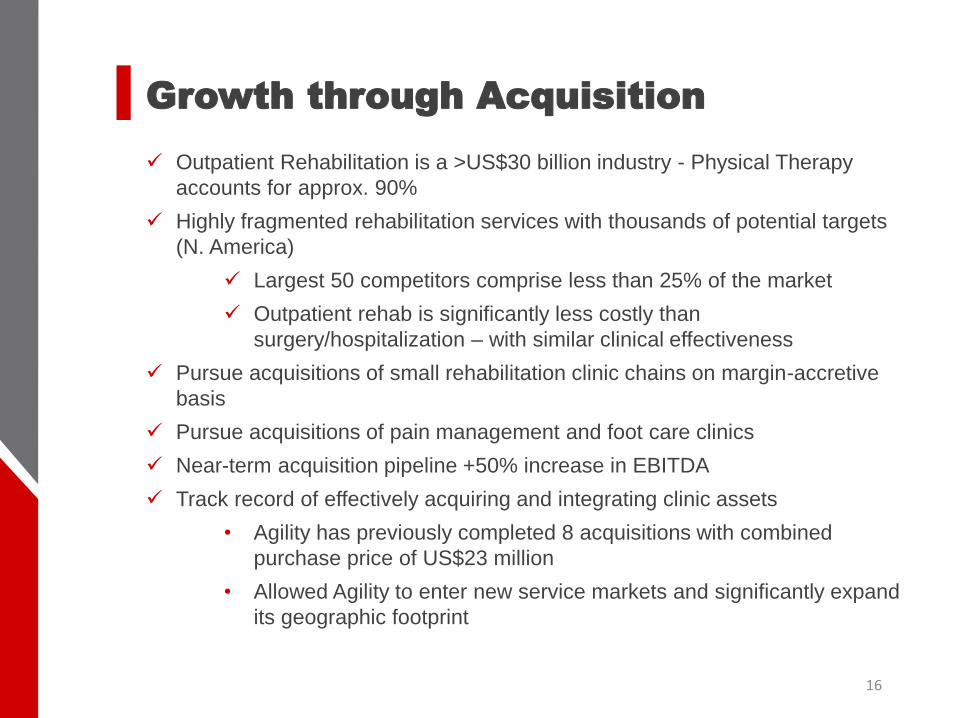
Outpatient Rehabilitation is a >US$30 billion industry - Physical Therapy
accounts for approx. 90%
Highly fragmented rehabilitation services with thousands of potential targets
(N. America)
Largest 50 competitors comprise less than 25% of the market
Outpatient rehab is significantly less costly than
surgery/hospitalization – with similar clinical effectiveness
Pursue acquisitions of small rehabilitation clinic chains on margin-accretive
basis
Pursue acquisitions of pain management and foot care clinics
Near-term acquisition pipeline +50% increase in EBITDA
Track record of effectively acquiring and integrating clinic assets
• Agility has previously completed 8 acquisitions with combined
purchase price of US$23 million
• Allowed Agility to enter new service markets and significantly expand
its geographic footprint
Growth through Acquisition
17
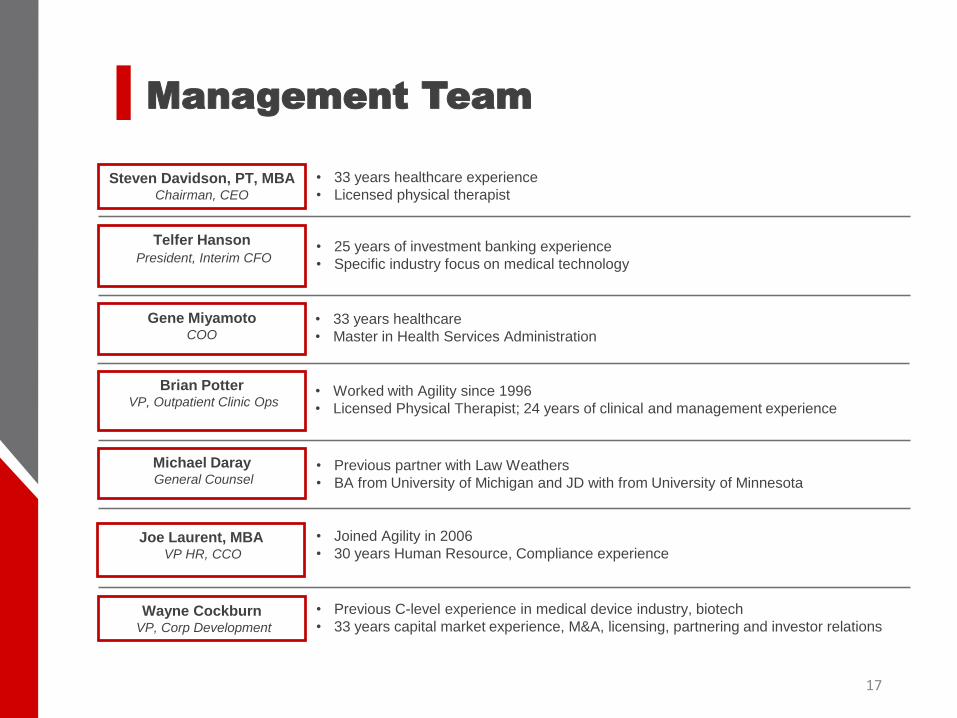
Management Team
Steven Davidson, PT, MBAChairman, CEO
Telfer Hanson
President, Interim CFO
Gene MiyamotoCOO
Brian PotterVP, Outpatient Clinic Ops
Michael DarayGeneral Counsel
Joe Laurent, MBAVP HR, CCO
Wayne CockburnVP, Corp Development
• 33 years healthcare experience
• Licensed physical therapist
• 33 years healthcare
• Master in Health Services Administration
• 25 years of investment banking experience
• Specific industry focus on medical technology
• Worked with Agility since 1996
• Licensed Physical Therapist; 24 years of clinical and management experience
• Previous partner with Law Weathers
• BA from University of Michigan and JD with from University of Minnesota
• Joined Agility in 2006
• 30 years Human Resource, Compliance experience
• Previous C-level experience in medical device industry, biotech
• 33 years capital market experience, M&A, licensing, partnering and investor relations
THANK YOU
For more information, please contact:
Wayne Cockburn
VP, Corporate Development
(905) 505-0770
APPENDIX
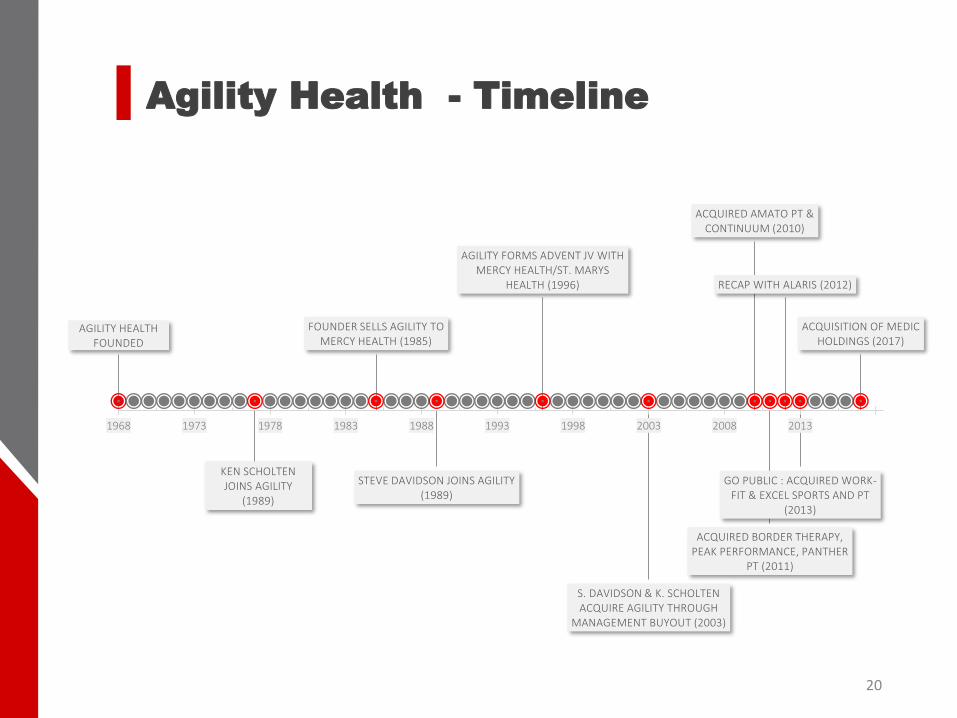
Agility Health - Timeline
20
AGILITY HEALTH FOUNDED
KEN SCHOLTEN JOINS AGILITY
(1989)
FOUNDER SELLS AGILITY TO MERCY HEALTH (1985)
STEVE DAVIDSON JOINS AGILITY (1989)
AGILITY FORMS ADVENT JV WITH MERCY HEALTH/ST. MARYS
HEALTH (1996)
S. DAVIDSON & K. SCHOLTEN ACQUIRE AGILITY THROUGH
MANAGEMENT BUYOUT (2003)
ACQUIRED AMATO PT & CONTINUUM (2010)
ACQUIRED BORDER THERAPY, PEAK PERFORMANCE, PANTHER
PT (2011)
RECAP WITH ALARIS (2012)
GO PUBLIC : ACQUIRED WORK-FIT & EXCEL SPORTS AND PT
(2013)
ACQUISITION OF MEDIC HOLDINGS (2017)
1968 1973 1978 1983 1988 1993 1998 2003 2008 2013