Embed Size (px)
Citation preview
1/18
Results
3Q12
Nov. 06, 2012
IDVL4: R$6.90 per share
Closing: November 06, 2012
Outstanding Shares: 62,371,178
Market Cap: R$430.4 million
Price/Book Value: 0.73
Conference Calls / Webcasts
November 07, 2012
In English
9:00 (US EST) / 12:00 (Brasília)
Connections
Brazil: +55 11 4688-6361
USA: +1 786 924-6977
Code: BI&P
In Portuguese
8:00 (US EST) / 11:00 (Brasília)
Number: +55 11 4688-6361
Code: BI&P
Website: www.bip.b.br/ir
Growth of 6.5% in the Expanded Credit Portfolio with better credit quality
Share of AA to B rated loans increases to 81%, from 79% in 2Q12 and 66% in 3Q11
Corporate segment now accounts for 56% of the Expanded Credit Portfolio
Highlights of the Period
• Expanded Credit Portfolio came to R$3.0 billion in 3Q12, up 6.5% quarter
on quarter and 33% year on year, led by loan and financing operations,
including BNDES onlending and agribusiness bonds operations. The Bank’s
new commercial structure shows its origination strength, generating R$687
million in new loans in the period, 38% more than in 3Q11 (R$498 million).
• At the end of September, the Corporate segment accounted for 56% of the
Expanded Credit Portfolio, due both to business growth and to the
migration of Middle Market clients. This migration was a reflection of the
growth of the client-companies, their sophisticated requirements, and the
adjustments to the commercial platforms through the repositioning of the
Bank’s client and product profile.
• Continuous improvement in the quality of the Expanded Credit Portfolio:
the share of credits rated between AA and B increased to 81% (78% of the
‘classic’ credit portfolio) in 3Q12. Of the loans granted in the quarter,
99.7% are rated between AA and B (99.4% in 2Q12).
• Reduction in operations overdue more than 90 days to 1.8% (2.6% in June
2012 and 4.1% in September 2011), with coverage by provisions of 231.9%
(175.7% in June 2012 and 199.3% in September 2011).
• Total funding of R$2.9 billion, up 6.6% in the quarter, in line with the Credit
Portfolio growth and the maintenance of the spread over CDI. Funding
through Agribusiness Letters of Credit (LCA) accounted for 11.2% of total
funding, versus 11.8% in June and 6.7% in September 2011.
• In line with our strategy adopted since 2011, revenue from services, which
includes structuring fees, climbed by 43% over 2Q12 and 40% in relation to
3Q11, contributing R$7.7 million to the results of the quarter.
• Net Profit totaled R$3.1 million in 3Q12, up 29% in the quarter, despite the
cut in the Selic rate and de management decision to deal with higher credit
quality (lower spreads), milder impact of the allowance for loan losses and
lower net operating expenses, which dropped 11.8% in the period.
2/18
Summary
Message from the Management ................................................................................................................ 3
Macroeconomic Environment .................................................................................................................... 4
Key Indicators .............................................................................................................................................. 5
Operating Performance .............................................................................................................................. 6
Credit Portfolio ............................................................................................................................................ 9
Funding ..................................................................................................................................................... 12
Liquidity ..................................................................................................................................................... 13
Capital Adequacy ...................................................................................................................................... 13
Risk Ratings ............................................................................................................................................... 14
Capital Markets ......................................................................................................................................... 14
Balance Sheet ............................................................................................................................................ 16
Income Statement .................................................................................................................................... 18
3/18
Message from the Management
With the Brazilian economy’s growth improving in the third quarter, in reaction to the government’s economic incentives,
our credit portfolio resumed growth, especially in loans and financing, which include BNDES onlendings, and agro bonds
(Rural Product Certificates (CPR), Agribusiness Credit Rights Certificate (CDCA) and Agribusiness Deposit Certificates and
Warrants (CDA/WA). Our expanded credit portfolio reached R$3.0 billion, up 6.5% in the quarter and 33% in a year,
increasing the share of loans rated between AA and B to 81% (compared to 76% in September 2011), in line with our
strategy of growth combined with quality. In this regard, considering the economic scenario until June, in the second half
we decided to focus further on better quality credits, even if with lower spreads and shorter terms, resulting in a higher
share of the Corporate segment (companies with annual revenue of between R$400 million and R$2.0 billion). This client
portfolio currently accounts for 56% of total loans granted. In a more favorable scenario, expected in 2013, we should
resume Middle Market segment growth retaking the strategic 45% Corporate and 55% Middle Market mix.
Loan operations overdue more than 90 days dropped from 2.6% in 2Q12 to 1.8% in 3Q12, reflecting both the better quality
of the portfolio generated in the past 18 months and the write-offs of R$16 million in the quarter.
Funding stood at R$2.9 billion, an increase of 6.6%, in line with the credit portfolio, growing by 21% in relation to
September 2011. Deposits in Real still account for 75% of total funding, maintaining lower costs in relation to the same
period in 2011. In view of the uncertainties in the international scenario and a possible negative reaction to the recent
developments in Brazil’s financial system, we decided to increase our long-term funding operations at the end of the
quarter, while preserving the limit available for DPGE I, as its extinction is imminent due to the availability of DPGE II for
corporate loans, expected in the first half of 2013.
The development of products continues to deserve mention, not only because of the business growth driven by products
launched last year - related to the agricultural sector and to the production chains of our large clients - but also due to the
beginning of funding through real estate letters of credit in the third quarter.
As already mentioned several times, our business plan is not short-term and is only just beginning. We don’t just have a
vision, but rather a project to build a bank that serves as a benchmark in the Brazilian market. This project will be rolled out
in the long term, sustained by a strategy architecture whose foundations were laid 18 months ago. The bases of the pillars
that sustain this architecture have been under construction since March 2011. Our vision and our project are grounded in
five main pillars:
People – Structural and systematic planning of people, valuing and consolidating meritocracy in an objective
manner.
Processes and technology – Continuous review of processes in the pursuit of speed, efficiency and safety, creating
technological differentials in terms of both processes and customer service, while seeking technological excellence
in all of the Bank’s areas.
Services and products – Incentives to cross-selling, development and growth of investment bank and fixed income
activities, creation of alternative distribution channels and structuring of innovation groups.
Creation of franchise value – Development of expertise in credit and risk analysis as well as in structures that
create competitive advantages in certain segments of the economy.
Planning of strategic moves – The scenario in which we operate is constantly changing and, in order for us to
adjust to these changes, we have to constantly monitor the market and its trends, and to be open and prepared
for business opportunities that are in line with our vision and our values.
We will not grow at any cost. Nevertheless, we wish to control our own destiny and lead the careful construction of these
pillars, which, grounded in our values, will sustain our future growth in a secure and profitable manner, while supporting
our vision in the direction of the Bank we want to build.
4/18
Macroeconomic Environment
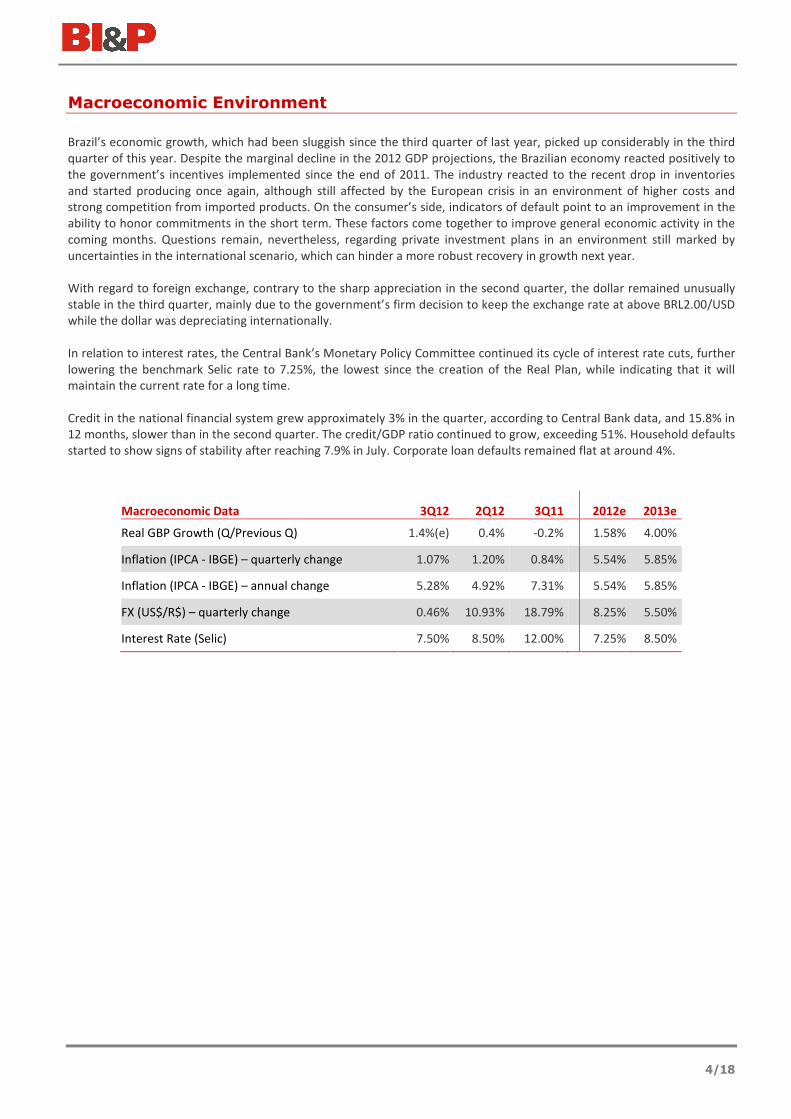
Brazil’s economic growth, which had been sluggish since the third quarter of last year, picked up considerably in the third
quarter of this year. Despite the marginal decline in the 2012 GDP projections, the Brazilian economy reacted positively to
the government’s incentives implemented since the end of 2011. The industry reacted to the recent drop in inventories
and started producing once again, although still affected by the European crisis in an environment of higher costs and
strong competition from imported products. On the consumer’s side, indicators of default point to an improvement in the
ability to honor commitments in the short term. These factors come together to improve general economic activity in the
coming months. Questions remain, nevertheless, regarding private investment plans in an environment still marked by
uncertainties in the international scenario, which can hinder a more robust recovery in growth next year.
With regard to foreign exchange, contrary to the sharp appreciation in the second quarter, the dollar remained unusually
stable in the third quarter, mainly due to the government’s firm decision to keep the exchange rate at above BRL2.00/USD
while the dollar was depreciating internationally.
In relation to interest rates, the Central Bank’s Monetary Policy Committee continued its cycle of interest rate cuts, further
lowering the benchmark Selic rate to 7.25%, the lowest since the creation of the Real Plan, while indicating that it will
maintain the current rate for a long time.
Credit in the national financial system grew approximately 3% in the quarter, according to Central Bank data, and 15.8% in
12 months, slower than in the second quarter. The credit/GDP ratio continued to grow, exceeding 51%. Household defaults
started to show signs of stability after reaching 7.9% in July. Corporate loan defaults remained flat at around 4%.
Macroeconomic Data 3Q12 2Q12 3Q11 2012e 2013e
Real GBP Growth (Q/Previous Q) 1.4%(e) 0.4% -0.2%
1.58% 4.00%
Inflation (IPCA - IBGE) – quarterly change 1.07% 1.20% 0.84%
5.54% 5.85%
Inflation (IPCA - IBGE) – annual change 5.28% 4.92% 7.31%
5.54% 5.85%
FX (US$/R$) – quarterly change 0.46% 10.93% 18.79%
8.25% 5.50%
Interest Rate (Selic) 7.50% 8.50% 12.00%
7.25% 8.50%

5/18
Key Indicators
The financial and operating information presented in this report are based on consolidated financials prepared in millions of Real (local
currency), according to Brazilian GAAP (BRGAAP), except were otherwise stated.
Results 3Q12 2Q12 3Q12/2Q12 3Q11 3Q12/3Q11 9M2012 9M2011 9M12/9M11
Result from Financial Int. before ALL 48.4 59.6 -18.7% 45.0 7.5% 158.8 121.3 31.0%
ALL Expenses 1 (11.9) (22.6) -47.4% (13.8) -13.8% (48.9) (117.0) -58.2%
Result from Financial Intermediation 36.5 37.0 -1.1% 31.3 16.9% 109.9 4.3 2460.8%
Net Operating Expenses (27.0) (30.7) -11.8% (26.8) 1.1% (84.8) (77.4) 9.7%
Recurring Operating Result 9.5 6.3 50.4% 4.5 111.4% 25.1 (73.1) 134.3%
Non-Recurring Operating Expenses 0.0 (0.3) -100.0% 0.0 n.m. (0.3) (3.9) -93.0%
Operating Result 9.5 6.0 57.2% 4.5 111.4% 24.8 (77.0) 132.2%
Net Profit (Loss) 3.1 2.4 29.4% 7.3 -57.4% 10.6 (42.1) 125.2%
Assets & Liabilities 3Q12 2Q12 3Q12/2Q12 3Q11 3Q12/3Q11
Loan Portfolio 2,548.4 2,395.6 6.4% 2,095.0 21.6%
Expanded Loan Portfolio2 2,990.9 2,807.1 6.5% 2,248.2 33.0%
Cash & Short Term Investments 955.1 632.6 51.0% 407.5 134.4%
Securities and Derivatives 613.1 1,536.0 -60.1% 1,755.4 -65.1%
Securities excl. Agro Sec. & Private Credit
Bonds3
338.1 1,300.3 -74.0% 1,705.1 -80.2%
Total Assets 4,337.1 4,966.5 -12.7% 4,458.7 -2.7%
Total Deposits 2,194.5 2,038.0 7.7% 1,734.3 26.5%
Open Market 597.2 1,219.6 -51.0% 1,204.0 -50.4%
Foreign Borrowings 432.0 449.2 -3.8% 491.2 -12.1%
Domestic On-lending 309.3 267.8 15.5% 194.8 58.8%
Shareholders’ Equity 587.6 582.4 0.9% 577.5 1.7%
Performance 3Q12 2Q12 3Q12/2Q12 3Q11 3Q12/3Q11 9M2012 9M2011 9M12/9M11
Free Cash 903.7 873.7 3.4% 914.1 -1.1%
NPL 60 days/ Loan portfolio 3.0% 2.8% 0.2 p.p. 6.3% -3.2 p.p.
NPL 90 days/ Loan portfolio 1.8% 2.6% -0.8 p.p. 4.1% -2.3 p.p.
Basel Index 15.8% 17.0% -1.2 p.p. 21.1% -5.3 p.p.
ROAE 2.2% 1.7% 0.5 p.p. 5.2% -3.1 p.p. 2.4% -11.0% 13.4 p.p.
Adjusted Net Interest Margin (NIMa) 6.1% 7.7% -1.6 p.p. 6.3% -0.2 p.p. 6.7% 5.7% 1.0 p.p.
Efficiency Ratio 69.7% 60.8% 8.9 p.p. 68.9% 0.8 p.p. 65.8% 74.5% -8.7 p.p.
Other Information 3Q12 2Q12 3Q12/2Q12 3Q11 3Q12/3Q11
Number of Corporate Clients 774 820 -5.6% 861 -10.1%
Number of Employees 423 438 -3.4% 385 9.9%
Details in the respective sessions of this report:
1 Additional Allowance for Loan Losses (ALL) included.
2 Including Guarantees issued, Private Credit Bonds (PNs and Debentures) and agro securities (CDCAs, CDA/WAs and CPRs).
3 Excluding Agro Securities (CPRs and CDA/WA) and Private Credit Bonds (PNs and debentures).
BI&P - Banco Indusval & Partners is a commercial bank listed at Level 2 Corporate Governance of the BM&FBOVESPA, with
45 years of experience in the financial market, focusing on local and foreign currency corporate loan products. BI&P relies
on a network of 11 branches strategically located in economically relevant Brazilian regions, including an offshore branch in
Cayman Islands, its brokerage firm operating at the São Paulo Stock, Commodities and Futures Exchange - BM&FBOVESPA
and Serglobal Cereais, acquired in April 2011, which originates agricultural bonds.
6/18
Operating Performance
Financial Intermediation Result
before Allowance for Loan Losses
Net Profit
Expanded Credit Portfolio Funding
Profitability
Financial Intermediation 3Q12 2Q12 3Q12/2Q12 3Q11 3Q12/3Q11 9M2012 9M2011 9M12/9M11
Financial Intermediation Revenues 131.7 222.8 -40.9% 212.6 -38.1% 516.3 455.8 13.3%
Loan Operations 62.9 62.9 0.0% 76.4 -17.7% 195.9 202.8 -3.4%
Loans & Discounts Receivables 49.1 46.4 5.9% 66.1 -25.7% 158.4 183.9 -13.8%
Financing 7.9 7.6 3.6% 8.9 -11.8% 21.8 15.9 37.2%
Other 5.9 8.9 -33.6% 1.3 337.8% 15.7 3.0 423.5%
Securities 53.4 114.4 -53.3% 95.8 -44.2% 236.4 200.5 17.9%
Derivative Financial Instruments 4.7 5.5 -14.8% (28.8) 116.4% 6.5 (31.9) 120.5%
FX Operations Result 10.6 40.0 -73.4% 69.2 -84.6% 77.4 84.5 -8.4%
Financial Intermediation Expenses 83.3 163.3 -49.0% 167.6 -50.3% 357.5 334.6 6.8%
Money Market Funding 69.2 119.4 -42.0% 88.0 -21.3% 273.9 244.9 11.8%
Time Deposits 37.3 40.8 -8.7% 46.5 -19.9% 123.3 139.0 -11.3%
Repurchase Transactions 22.7 68.1 -66.6% 34.4 -33.9% 121.3 87.1 39.3%
Interbank Deposits 2.4 3.4 -31.5% 2.5 -3.8% 8.9 8.9 1.0%
Agro (LCA), Real State (LCI) & Bank Notes (LF) 6.9 7.0 -2.5% 4.6 49.9% 20.3 10.0 103.8%
Loans, Assignments & Onlending 14.0 43.9 -68.0% 79.7 -82.4% 83.6 89.7 -6.8%
Foreign Borrowings 8.5 39.6 -78.5% 76.9 -88.9% 70.3 82.7 -15.0%
Domestic Borrowings & Onlending 5.5 4.3 27.2% 2.8 99.9% 13.3 7.0 90.8%
Gross Result Financial Interm. before ALL 48.4 59.6 -18.7% 45.0 7.5% 158.8 121.3 31.0%
Allowance for Loan Losses (ALL) (11.9) (22.6) -47.4% (13.8) -13.8% (48.9) (117.0) -58.2%
Gross Result Financial Intermediation 36.5 37.0 -1.1% 31.3 16.9% 109.9 4.3 2460.8%
45.0 49.3 50.8 59.648.4
121.3
158.8
3Q11 4Q11 1Q12 2Q12 3Q12 9M11 9M12
R$
mill
ion
7.310.3
5.02.4 3.1
10.6
3Q11 4Q11 1Q12 2Q12 3Q12 9M11 9M12
R$
mill
ion
2.22.5
2.8 2.8 3.0
3Q11 4Q11 1Q12 2Q12 3Q12
R$
bill
ion
Loans & Financing in Reais
Trade Finance
Guarantees Issued
Agro Bonds (CPR, CDA/WA and CDCA)
Private Credit Bonds (PNs and Debentures)
2.4 2.5 2.7 2.8 2.9
3Q11 4Q11 1Q12 2Q12 3Q12
R$
bill
ion
Time Deposits Insured Time Deposits
Agro Bonds Bank and Real State Notes
Interbank and Demand Deposits Domestic Onlending
Trade Finance and Foreign Borrowings
7.5%
31.0% -57.4% 125.2%
-42.1
33.0%
6.5%
21.3%
6.6%
29,4% -18.7%
7/18
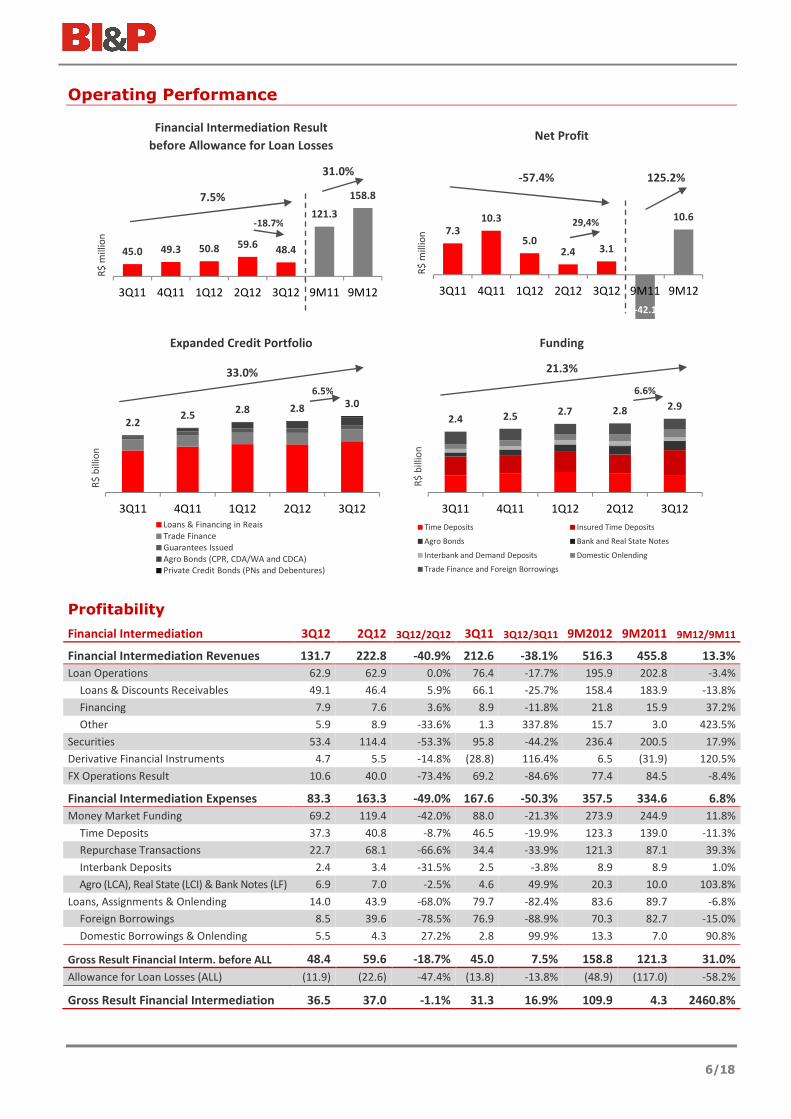
Result from Financial Intermediation before expenses with the allowance for loan losses totaled R$48.4 million in 3Q12,
down 18.7% in the quarter and up 7.5% year on year, chiefly due to the lowering of the benchmark Selic rate and lower
spreads on loans as a result of the greater share of the Corporate segment in the credit portfolio, as detailed below:
Revenue from Loan Operations remained flat in relation to 2Q12, despite the cuts in the Selic rate and the impact of the
international crisis on the Brazilian economy. The Corporate segment accounted for 54% of total loans and financing
disbursed in local and foreign currency, versus 45% in 2Q12, accompanied by a natural trend of lower spreads and better
quality of credit. Therefore, the fact that Revenue from Loan Operations remained flat reflects the growth in the average
balances of loans, discounted bills and BNDES onlending operations. Another factor that contributed to this result was
credit recovery totaling R$5.7 million in 3Q12 (compared to R$8.5 million in 2Q12).
Income from Securities, which includes the results from the treasury’s directional portfolio and CPR, CDA/WA and
Debenture operations, is offset by funding expenses. The quarter-on-quarter reduction of 53.3% seen in Income from
Securities resulted from the cut in the benchmark interest rate and, mainly, from the lower balance of securities subject to
repurchase agreements, which dropped from R$724.7 million at the end of 2Q12 to R$9.0 million on September 30. These
operations also led to a reduction in open market funding expenses, from R$1,220 million on June 30 to R$597 million on
September 30. The combination of lower volume and the cut in the interest rate resulted in a 66.6% decline in expenses
with repo operations.
The Result from Derivative Financial Instruments includes results from operations involving swaps, forwards, futures and
options used to hedge against exchange exposure and interest rates for funding operations indexed to the IPCA and IGPM,
as well as foreign borrowings (non-trade related), to hedge coffee prices resulting from CPR operations and indexers of
federal government bonds held in the securities portfolio, in addition to the directional portfolio. Thus, the result from
derivative financial instruments has offsets in both revenues and expenses from financial intermediation resulting from
operations in local and foreign currency, commodities and indexes.
After deducting the expenses with allowance for loan losses of R$11.9 million in the quarter (R$22.6 million in 2Q12), as a
reflection of the improved quality of the credit portfolio since March 2011, the Result from Financial Intermediation was
R$36.5 million, remaining at the same level as in the previous quarter.
In the nine-month period ended September 30, Revenues from Financial Intermediation totaled R$516.3 million, up 13.3%
over the same period in 2011, while expenses from financial intermediation (excluding expenses with allowance for loan
losses) increased only slightly by 6.8% to R$357.5 million. Thus, the comparison of the Result from Financial Intermediation
in the nine-month periods of the last two years pointed to a 31.0% growth which, consequent to the drop in expenses with
allowance for loan losses, from R$117.0 million until September 2011 to R$48.9 million (-58.2%) in the same periods,
increased the Result from Financial Intermediation from R$4.3 million until September 2011 to R$109.9 million in the nine
months of 2012.
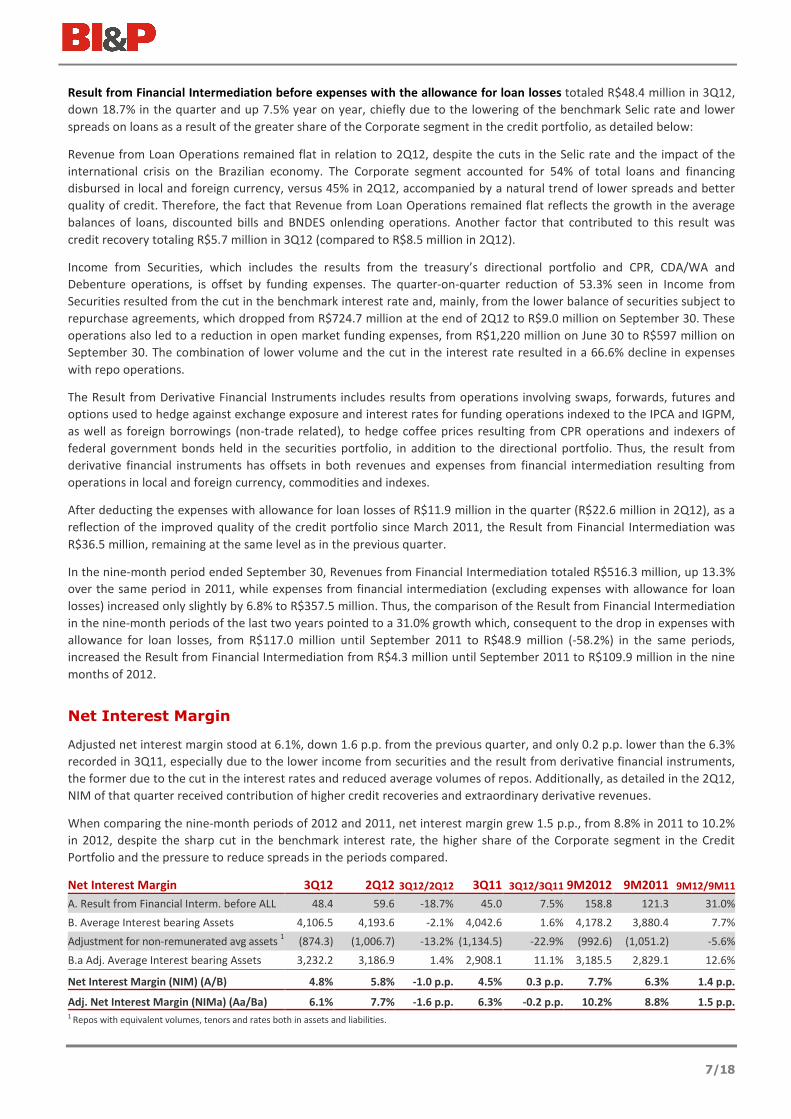
Net Interest Margin
Adjusted net interest margin stood at 6.1%, down 1.6 p.p. from the previous quarter, and only 0.2 p.p. lower than the 6.3%
recorded in 3Q11, especially due to the lower income from securities and the result from derivative financial instruments,
the former due to the cut in the interest rates and reduced average volumes of repos. Additionally, as detailed in the 2Q12,
NIM of that quarter received contribution of higher credit recoveries and extraordinary derivative revenues.
When comparing the nine-month periods of 2012 and 2011, net interest margin grew 1.5 p.p., from 8.8% in 2011 to 10.2%
in 2012, despite the sharp cut in the benchmark interest rate, the higher share of the Corporate segment in the Credit
Portfolio and the pressure to reduce spreads in the periods compared.
Net Interest Margin 3Q12 2Q12 3Q12/2Q12 3Q11 3Q12/3Q11 9M2012 9M2011 9M12/9M11
A. Result from Financial Interm. before ALL 48.4 59.6 -18.7% 45.0 7.5% 158.8 121.3 31.0%
B. Average Interest bearing Assets 4,106.5 4,193.6 -2.1% 4,042.6 1.6% 4,178.2 3,880.4 7.7%
Adjustment for non-remunerated avg assets 1 (874.3) (1,006.7) -13.2% (1,134.5) -22.9% (992.6) (1,051.2) -5.6%
B.a Adj. Average Interest bearing Assets 3,232.2 3,186.9 1.4% 2,908.1 11.1% 3,185.5 2,829.1 12.6%
Net Interest Margin (NIM) (A/B) 4.8% 5.8% -1.0 p.p. 4.5% 0.3 p.p. 7.7% 6.3% 1.4 p.p.
Adj. Net Interest Margin (NIMa) (Aa/Ba) 6.1% 7.7% -1.6 p.p. 6.3% -0.2 p.p. 10.2% 8.8% 1.5 p.p.1 Repos with equivalent volumes, tenors and rates both in assets and liabilities.
8/18
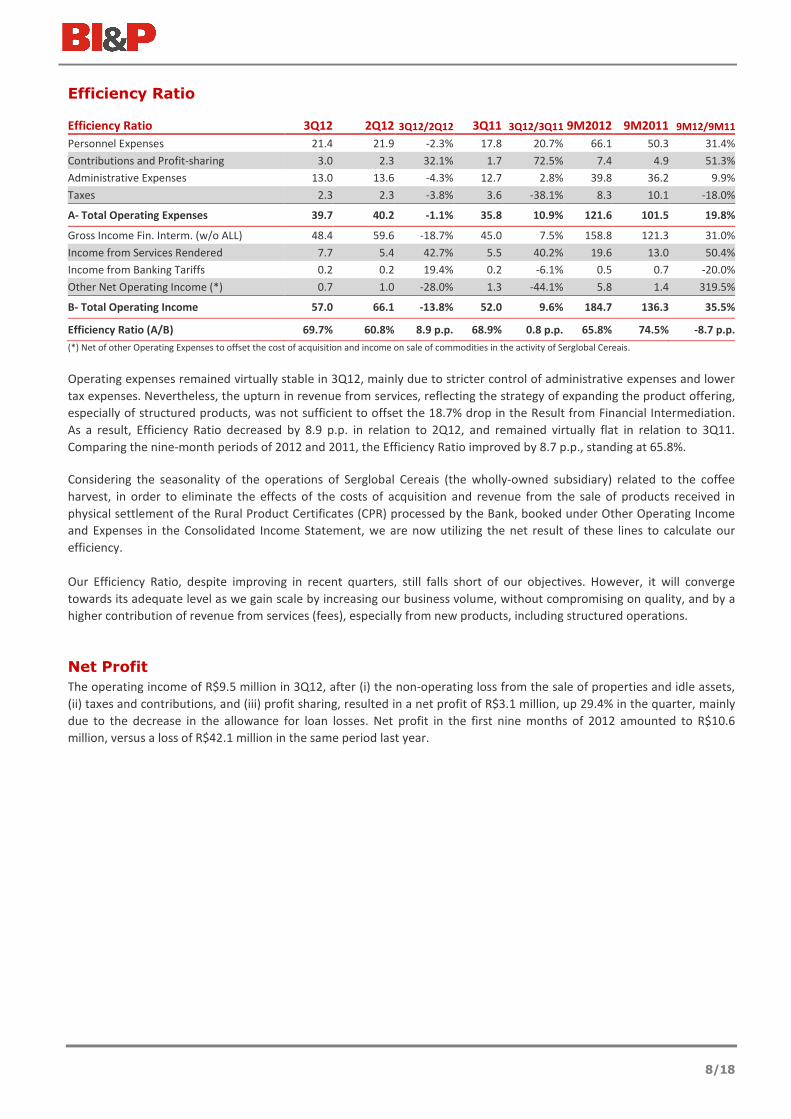
Efficiency Ratio
Efficiency Ratio 3Q12 2Q12 3Q12/2Q12 3Q11 3Q12/3Q11 9M2012 9M2011 9M12/9M11
Personnel Expenses 21.4 21.9 -2.3% 17.8 20.7% 66.1 50.3 31.4%
Contributions and Profit-sharing 3.0 2.3 32.1% 1.7 72.5% 7.4 4.9 51.3%
Administrative Expenses 13.0 13.6 -4.3% 12.7 2.8% 39.8 36.2 9.9%
Taxes 2.3 2.3 -3.8% 3.6 -38.1% 8.3 10.1 -18.0%
A- Total Operating Expenses 39.7 40.2 -1.1% 35.8 10.9% 121.6 101.5 19.8%
Gross Income Fin. Interm. (w/o ALL) 48.4 59.6 -18.7% 45.0 7.5% 158.8 121.3 31.0%
Income from Services Rendered 7.7 5.4 42.7% 5.5 40.2% 19.6 13.0 50.4%
Income from Banking Tariffs 0.2 0.2 19.4% 0.2 -6.1% 0.5 0.7 -20.0%
Other Net Operating Income (*) 0.7 1.0 -28.0% 1.3 -44.1% 5.8 1.4 319.5%
B- Total Operating Income 57.0 66.1 -13.8% 52.0 9.6% 184.7 136.3 35.5%
Efficiency Ratio (A/B) 69.7% 60.8% 8.9 p.p. 68.9% 0.8 p.p. 65.8% 74.5% -8.7 p.p.
(*) Net of other Operating Expenses to offset the cost of acquisition and income on sale of commodities in the activity of Serglobal Cereais.
Operating expenses remained virtually stable in 3Q12, mainly due to stricter control of administrative expenses and lower
tax expenses. Nevertheless, the upturn in revenue from services, reflecting the strategy of expanding the product offering,
especially of structured products, was not sufficient to offset the 18.7% drop in the Result from Financial Intermediation.
As a result, Efficiency Ratio decreased by 8.9 p.p. in relation to 2Q12, and remained virtually flat in relation to 3Q11.
Comparing the nine-month periods of 2012 and 2011, the Efficiency Ratio improved by 8.7 p.p., standing at 65.8%.
Considering the seasonality of the operations of Serglobal Cereais (the wholly-owned subsidiary) related to the coffee
harvest, in order to eliminate the effects of the costs of acquisition and revenue from the sale of products received in
physical settlement of the Rural Product Certificates (CPR) processed by the Bank, booked under Other Operating Income
and Expenses in the Consolidated Income Statement, we are now utilizing the net result of these lines to calculate our
efficiency.
Our Efficiency Ratio, despite improving in recent quarters, still falls short of our objectives. However, it will converge
towards its adequate level as we gain scale by increasing our business volume, without compromising on quality, and by a
higher contribution of revenue from services (fees), especially from new products, including structured operations.
Net Profit
The operating income of R$9.5 million in 3Q12, after (i) the non-operating loss from the sale of properties and idle assets,
(ii) taxes and contributions, and (iii) profit sharing, resulted in a net profit of R$3.1 million, up 29.4% in the quarter, mainly
due to the decrease in the allowance for loan losses. Net profit in the first nine months of 2012 amounted to R$10.6
million, versus a loss of R$42.1 million in the same period last year.
9/18
Credit Portfolio
Expanded Credit Portfolio
At the end of September 2012, the Expanded Credit Portfolio totaled R$3.0 billion, up 6.5% in the quarter and 33.0% in 12
months, reflecting the efforts by the sales department, now with fully structured teams and a fresh focus on clients and
products and relying on the support of the Business Development and Monitoring department.
The Expanded Credit Portfolio includes loan and financing operations in Real and Trade Finance operations, detailed in
note 6(a) to the financial statements, as well as: (i) guarantees issued (sureties, guarantees and letters of credit), (ii)
agribusiness bonds originated from the absorption of the operations of Serglobal Cereais (CPR and CDA/WA), which are
booked under Securities as per the Central Bank regulations; and (iii) Private Credit Bonds (promissory notes and
debentures).
Expanded Credit Portfolio by Product Group 3Q12 2Q12 3Q12/2Q12 3Q11 3Q12/3Q11
Loans & Financing in Real 1,974.4 1,844.4 7.0% 1,627.6 21.3%
Trade Finance (ACC/ACE/IMPFIN) 463.0 449.4 3.0% 433.1 6.9%
Guarantees Issued (LGs & L/Cs) 167.5 175.8 -4.7% 102.8 62.9%
Agro Bonds (Securities: CPRs & CDA/WA; Credit: CDCAs) 306.7 267.0 14.9% 52.4 485.9%
Private Credit Bonds (Securities: PNs & Debentures) 41.1 30.7 34.1% 10.0 311.5%
Other 38.1 39.8 -4.3% 22.3 70.9%
TOTAL 2,990.9 2,807.1 6.5% 2,248.2 33.0%
Loans and financing operations in Real, which include loans, discounted bills, acquisition of client receivables and BNDES
onlendings, represented 66.0% of the Expanded Credit Portfolio. Notable were the increase of 7.9% in the quarter and
16.9% in the year in loan operations, which totaled R$1.6 billion at the end of September 2012, and in BNDES onlending
operations, which totaled R$301.0 million, an increase of 15.4% in the quarter and 66.0% in 12 months.
Trade Finance operations, which accounted for 15.5% of the Expanded Credit Portfolio, include import financing (R$115.3
million) and export financing (ACC/ACE in the amount of R$347.7 million).
The guarantees issued (sureties, guarantees and import letters of credit) represented 5.6% of the Expanded Credit
Portfolio, down 4.7% in the quarter and up 62.9% in the year.
Though agribusiness bonds and private credit bonds represent credit exposure, they are classified under Marketable
Securities in the balance sheet, in accordance with Brazilian Central Bank regulations on account of their negotiability.
These bonds jointly represented 9.2% of the Expanded Credit Portfolio, up 16.7% in the quarter and 446.4% in 12 months.
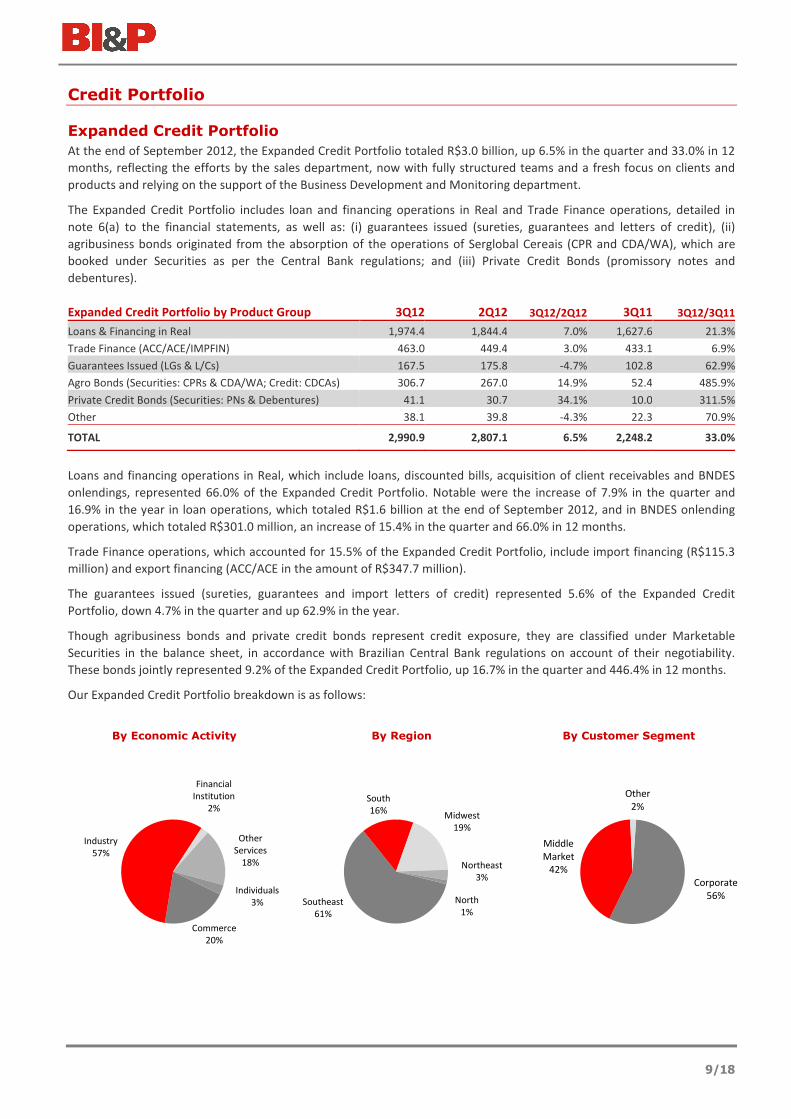
Our Expanded Credit Portfolio breakdown is as follows:
By Economic Activity By Region By Customer Segment
Commerce
20%
Industry
57%
Financial
Institution
2%
Other
Services
18%
Individuals
3% Southeast
61%
South
16%Midwest
19%
Northeast
3%
North
1%
Corporate
56%
Middle
Market
42%
Other
2%
10/18
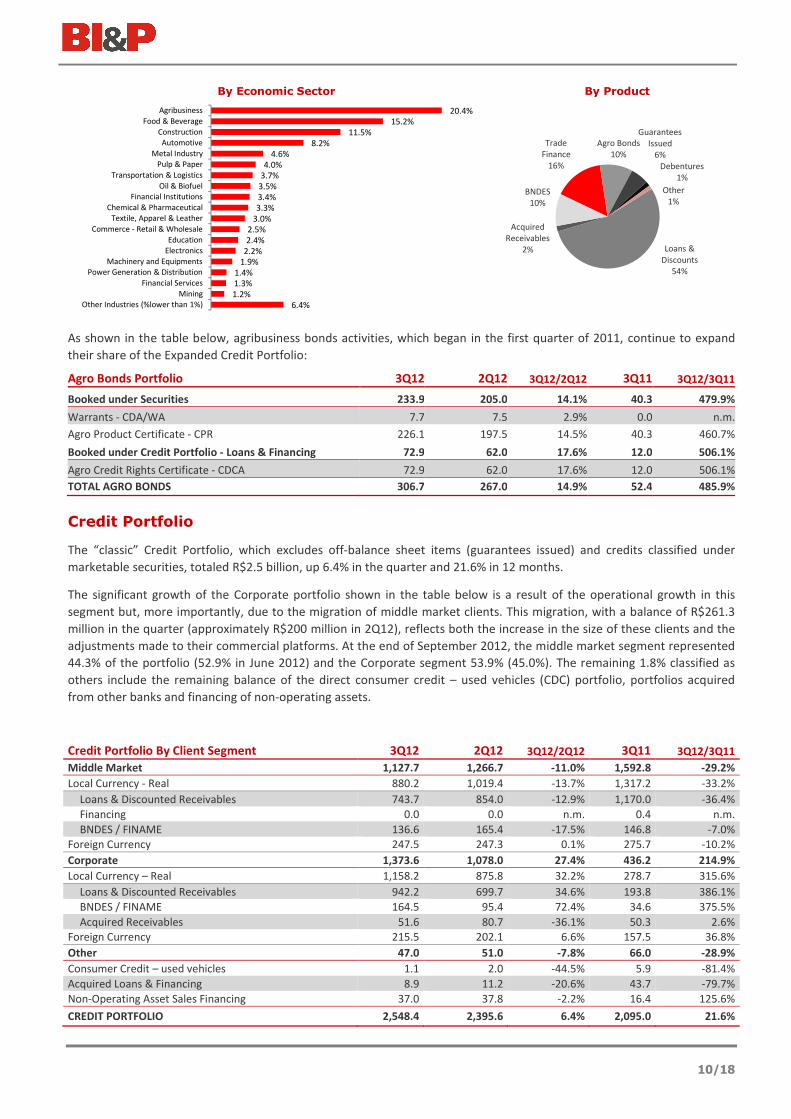
By Economic Sector By Product
As shown in the table below, agribusiness bonds activities, which began in the first quarter of 2011, continue to expand
their share of the Expanded Credit Portfolio:
Agro Bonds Portfolio 3Q12 2Q12 3Q12/2Q12 3Q11 3Q12/3Q11
Booked under Securities 233.9 205.0 14.1% 40.3 479.9%
Warrants - CDA/WA 7.7 7.5 2.9% 0.0 n.m.
Agro Product Certificate - CPR 226.1 197.5 14.5% 40.3 460.7%
Booked under Credit Portfolio - Loans & Financing 72.9 62.0 17.6% 12.0 506.1%
Agro Credit Rights Certificate - CDCA 72.9 62.0 17.6% 12.0 506.1%
TOTAL AGRO BONDS 306.7 267.0 14.9% 52.4 485.9%
Credit Portfolio
The “classic” Credit Portfolio, which excludes off-balance sheet items (guarantees issued) and credits classified under
marketable securities, totaled R$2.5 billion, up 6.4% in the quarter and 21.6% in 12 months.
The significant growth of the Corporate portfolio shown in the table below is a result of the operational growth in this
segment but, more importantly, due to the migration of middle market clients. This migration, with a balance of R$261.3
million in the quarter (approximately R$200 million in 2Q12), reflects both the increase in the size of these clients and the
adjustments made to their commercial platforms. At the end of September 2012, the middle market segment represented
44.3% of the portfolio (52.9% in June 2012) and the Corporate segment 53.9% (45.0%). The remaining 1.8% classified as
others include the remaining balance of the direct consumer credit – used vehicles (CDC) portfolio, portfolios acquired
from other banks and financing of non-operating assets.
Credit Portfolio By Client Segment 3Q12 2Q12 3Q12/2Q12 3Q11 3Q12/3Q11
Middle Market 1,127.7 1,266.7 -11.0% 1,592.8 -29.2%
Local Currency - Real 880.2 1,019.4 -13.7% 1,317.2 -33.2%
Loans & Discounted Receivables 743.7 854.0 -12.9% 1,170.0 -36.4%
Financing 0.0 0.0 n.m. 0.4 n.m.
BNDES / FINAME 136.6 165.4 -17.5% 146.8 -7.0%
Foreign Currency 247.5 247.3 0.1% 275.7 -10.2%
Corporate 1,373.6 1,078.0 27.4% 436.2 214.9%
Local Currency – Real 1,158.2 875.8 32.2% 278.7 315.6%
Loans & Discounted Receivables 942.2 699.7 34.6% 193.8 386.1%
BNDES / FINAME 164.5 95.4 72.4% 34.6 375.5%
Acquired Receivables 51.6 80.7 -36.1% 50.3 2.6%
Foreign Currency 215.5 202.1 6.6% 157.5 36.8%
Other 47.0 51.0 -7.8% 66.0 -28.9%
Consumer Credit – used vehicles 1.1 2.0 -44.5% 5.9 -81.4%
Acquired Loans & Financing 8.9 11.2 -20.6% 43.7 -79.7%
Non-Operating Asset Sales Financing 37.0 37.8 -2.2% 16.4 125.6%
CREDIT PORTFOLIO 2,548.4 2,395.6 6.4% 2,095.0 21.6%
6.4%
1.2%
1.3%
1.4%
1.9%
2.2%
2.4%
2.5%
3.0%
3.3%
3.4%
3.5%
3.7%
4.0%
4.6%
8.2%
11.5%
15.2%
20.4%
Other Industries (%lower than 1%)
Mining
Financial Services
Power Generation & Distribution
Machinery and Equipments
Electronics
Education
Commerce - Retail & Wholesale
Textile, Apparel & Leather
Chemical & Pharmaceutical
Financial Institutions
Oil & Biofuel
Transportation & Logistics
Pulp & Paper
Metal Industry
Automotive
Construction
Food & Beverage
Agribusiness
Loans &
Discounts
54%
Acquired
Receivables
2%
BNDES
10%
Trade
Finance
16%
Agro Bonds
10%
Guarantees
Issued
6%
Debentures
1%
Other
1%
11/18
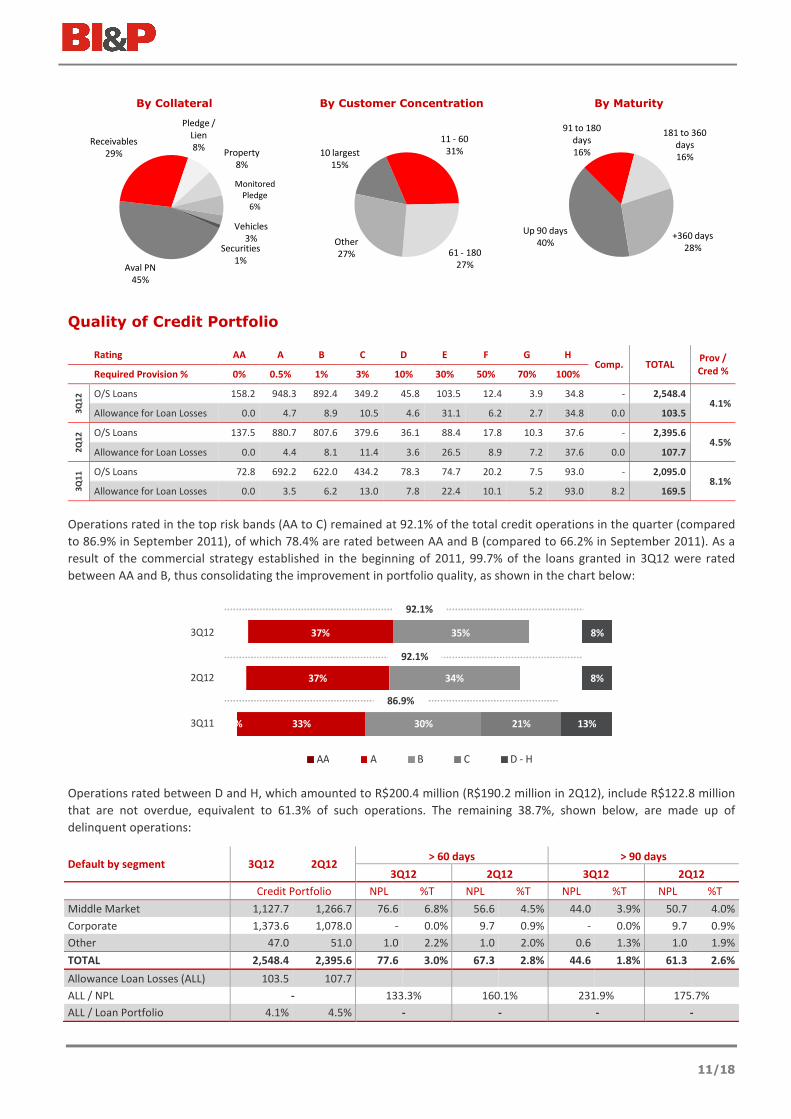
By Collateral By Customer Concentration By Maturity
Quality of Credit Portfolio
Rating AA A B C D E F G H Comp. TOTAL
Prov /
Cred % Required Provision % 0% 0.5% 1% 3% 10% 30% 50% 70% 100%
3Q
12
O/S Loans 158.2 948.3 892.4 349.2 45.8 103.5 12.4 3.9 34.8 - 2,548.4 4.1%
Allowance for Loan Losses 0.0 4.7 8.9 10.5 4.6 31.1 6.2 2.7 34.8 0.0 103.5
2Q
12
O/S Loans 137.5 880.7 807.6 379.6 36.1 88.4 17.8 10.3 37.6 - 2,395.6 4.5%
Allowance for Loan Losses 0.0 4.4 8.1 11.4 3.6 26.5 8.9 7.2 37.6 0.0 107.7
3Q
11
O/S Loans 72.8 692.2 622.0 434.2 78.3 74.7 20.2 7.5 93.0 - 2,095.0 8.1%
Allowance for Loan Losses 0.0 3.5 6.2 13.0 7.8 22.4 10.1 5.2 93.0 8.2 169.5
Operations rated in the top risk bands (AA to C) remained at 92.1% of the total credit operations in the quarter (compared
to 86.9% in September 2011), of which 78.4% are rated between AA and B (compared to 66.2% in September 2011). As a
result of the commercial strategy established in the beginning of 2011, 99.7% of the loans granted in 3Q12 were rated
between AA and B, thus consolidating the improvement in portfolio quality, as shown in the chart below:
Operations rated between D and H, which amounted to R$200.4 million (R$190.2 million in 2Q12), include R$122.8 million
that are not overdue, equivalent to 61.3% of such operations. The remaining 38.7%, shown below, are made up of
delinquent operations:
Default by segment 3Q12 2Q12 > 60 days > 90 days
3Q12 2Q12 3Q12 2Q12
Credit Portfolio NPL %T NPL %T NPL %T NPL %T
Middle Market 1,127.7 1,266.7 76.6 6.8% 56.6 4.5% 44.0 3.9% 50.7 4.0%
Corporate 1,373.6 1,078.0 - 0.0% 9.7 0.9% - 0.0% 9.7 0.9%
Other 47.0 51.0 1.0 2.2% 1.0 2.0% 0.6 1.3% 1.0 1.9%
TOTAL 2,548.4 2,395.6 77.6 3.0% 67.3 2.8% 44.6 1.8% 61.3 2.6%
Allowance Loan Losses (ALL) 103.5 107.7
ALL / NPL - 133.3% 160.1% 231.9% 175.7%
ALL / Loan Portfolio 4.1% 4.5% - - - -
Aval PN
45%
Receivables
29%
Pledge /
Lien
8%Property
8%
Monitored
Pledge
6%
Vehicles
3%Securities
1%
10 largest
15%
11 - 60
31%
61 - 180
27%
Other
27%
Up 90 days
40%
91 to 180
days
16%
181 to 360
days
16%
+360 days
28%
3%
6%
6%
33%
37%
37%
30%
34%
35%
21%
16%
14%
13%
8%
8%
3Q11
2Q12
3Q12
AA A B C D - H
92.1%
92.1%
86.9%
12/18
The default rates on loans overdue by more than 60 days (NPL 60 days) increased slightly in the quarter (0.2 p.p.), as a
result of the middle market portfolio, still reflecting loans granted before 2011. The default rates on loans overdue by more
than 90 days (NPL 90 days) fell by 0.8 p.p. in the quarter. In relation to September 2011, both indicators improved
substantially, by 3.2 p.p. and 2.3 p.p., respectively, for loans overdue by more than 60 and 90 days.
The improvement in these ratios in recent quarters is the result of the strategy, adopted last year, of expanding the credit
portfolio through better quality loans. This evolution is evident from the potential default rate (ratio of installments
overdue between 15 and 60 days to the credit portfolio), which dropped from 1.5% in September 2011 to 0.65% in June
2012 and 0.31% in September 2012. During the quarter, R$16.1 million in loan operations, already fully provisioned in
previous quarters, was written off as losses.
The allowance for loan losses, amounting to R$103.5 million, provides coverage to 133.3% of the loans overdue more than
60 days and 231.9% of the loans overdue more than 90 days.
Once more we highlight the relevance of the restructuring of the commercial area in the last 18 months with the
renovation of teams, multiproduct offering training, and improved customer segmentation in the search for a better credit
quality customer profile also to promote improved cross selling. All these actions are supported by the Business
Development and Monitoring unit and the product areas, both for market intelligence and strategic business monitoring,
as well as with the expertise to detect business opportunities and deliver customer solutions. These areas combined efforts
reflected in the increase of 45% in the accumulated volume of disbursements within 3Q12, in comparison to 2Q12.
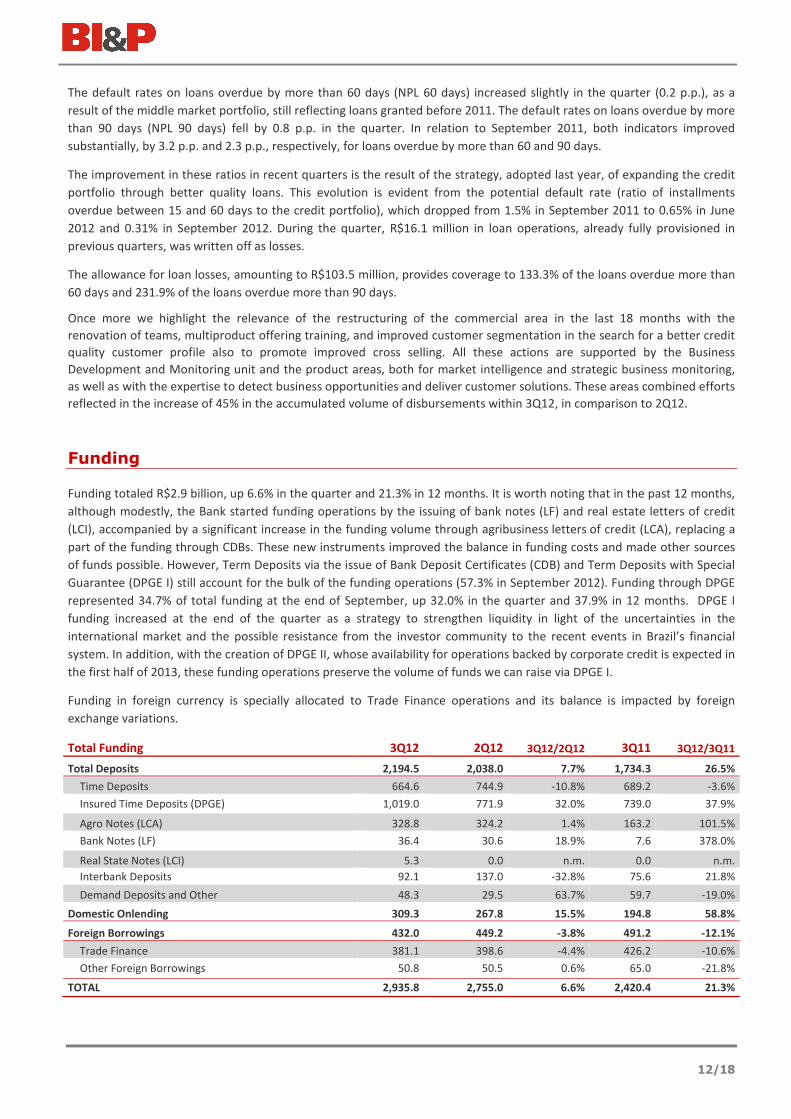
Funding
Funding totaled R$2.9 billion, up 6.6% in the quarter and 21.3% in 12 months. It is worth noting that in the past 12 months,
although modestly, the Bank started funding operations by the issuing of bank notes (LF) and real estate letters of credit
(LCI), accompanied by a significant increase in the funding volume through agribusiness letters of credit (LCA), replacing a
part of the funding through CDBs. These new instruments improved the balance in funding costs and made other sources
of funds possible. However, Term Deposits via the issue of Bank Deposit Certificates (CDB) and Term Deposits with Special
Guarantee (DPGE I) still account for the bulk of the funding operations (57.3% in September 2012). Funding through DPGE
represented 34.7% of total funding at the end of September, up 32.0% in the quarter and 37.9% in 12 months. DPGE I
funding increased at the end of the quarter as a strategy to strengthen liquidity in light of the uncertainties in the
international market and the possible resistance from the investor community to the recent events in Brazil’s financial
system. In addition, with the creation of DPGE II, whose availability for operations backed by corporate credit is expected in
the first half of 2013, these funding operations preserve the volume of funds we can raise via DPGE I.
Funding in foreign currency is specially allocated to Trade Finance operations and its balance is impacted by foreign
exchange variations.
Total Funding 3Q12 2Q12 3Q12/2Q12 3Q11 3Q12/3Q11
Total Deposits 2,194.5 2,038.0 7.7% 1,734.3 26.5%
Time Deposits 664.6 744.9 -10.8% 689.2 -3.6%
Insured Time Deposits (DPGE) 1,019.0 771.9 32.0% 739.0 37.9%
Agro Notes (LCA) 328.8 324.2 1.4% 163.2 101.5%
Bank Notes (LF) 36.4 30.6 18.9% 7.6 378.0%
Real State Notes (LCI) 5.3 0.0 n.m. 0.0 n.m.
Interbank Deposits 92.1 137.0 -32.8% 75.6 21.8%
Demand Deposits and Other 48.3 29.5 63.7% 59.7 -19.0%
Domestic Onlending 309.3 267.8 15.5% 194.8 58.8%
Foreign Borrowings 432.0 449.2 -3.8% 491.2 -12.1%
Trade Finance 381.1 398.6 -4.4% 426.2 -10.6%
Other Foreign Borrowings 50.8 50.5 0.6% 65.0 -21.8%
TOTAL 2,935.8 2,755.0 6.6% 2,420.4 21.3%
13/18
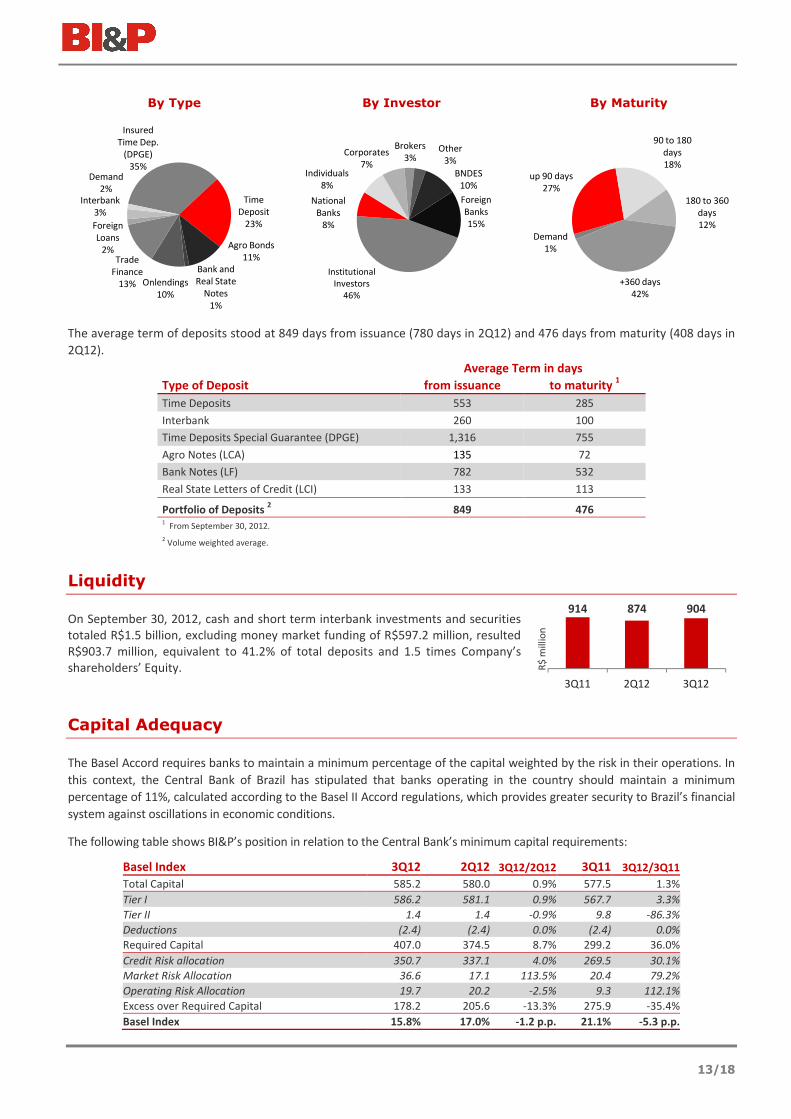
By Type By Investor By Maturity
The average term of deposits stood at 849 days from issuance (780 days in 2Q12) and 476 days from maturity (408 days in
2Q12).
Average Term in days
Type of Deposit from issuance to maturity 1
Time Deposits 553 285
Interbank 260 100
Time Deposits Special Guarantee (DPGE) 1,316 755
Agro Notes (LCA) 135 72
Bank Notes (LF) 782 532
Real State Letters of Credit (LCI) 133 113
Portfolio of Deposits 2 849 476
1 From September 30, 2012.
2 Volume weighted average.
Liquidity
On September 30, 2012, cash and short term interbank investments and securities
totaled R$1.5 billion, excluding money market funding of R$597.2 million, resulted
R$903.7 million, equivalent to 41.2% of total deposits and 1.5 times Company’s
shareholders’ Equity.
Capital Adequacy
The Basel Accord requires banks to maintain a minimum percentage of the capital weighted by the risk in their operations. In
this context, the Central Bank of Brazil has stipulated that banks operating in the country should maintain a minimum
percentage of 11%, calculated according to the Basel II Accord regulations, which provides greater security to Brazil’s financial
system against oscillations in economic conditions.
The following table shows BI&P’s position in relation to the Central Bank’s minimum capital requirements:
Basel Index 3Q12 2Q12 3Q12/2Q12 3Q11 3Q12/3Q11
Total Capital 585.2 580.0 0.9% 577.5 1.3%
Tier I 586.2 581.1 0.9% 567.7 3.3%
Tier II 1.4 1.4 -0.9% 9.8 -86.3%
Deductions (2.4) (2.4) 0.0% (2.4) 0.0%
Required Capital 407.0 374.5 8.7% 299.2 36.0%
Credit Risk allocation 350.7 337.1 4.0% 269.5 30.1%
Market Risk Allocation 36.6 17.1 113.5% 20.4 79.2%
Operating Risk Allocation 19.7 20.2 -2.5% 9.3 112.1%
Excess over Required Capital 178.2 205.6 -13.3% 275.9 -35.4%
Basel Index 15.8% 17.0% -1.2 p.p. 21.1% -5.3 p.p.
Insured
Time Dep.
(DPGE)
35%
Time
Deposit
23%
Agro Bonds
11%
Bank and
Real State
Notes
1%
Onlendings
10%
Trade
Finance
13%
Foreign
Loans
2%
Interbank
3%
Demand
2%
Institutional
Investors
46%
National
Banks
8%
Individuals
8%
Corporates
7%
Brokers
3%Other
3%
BNDES
10%
Foreign
Banks
15%
Demand
1%
up 90 days
27%
90 to 180
days
18%
180 to 360
days
12%
+360 days
42%
914 874 904
3Q11 2Q12 3Q12
R$
mill
ion
14/18
Risk Ratings
Agency Classification Observation Last
Report
Financial
Data
Standard & Poor’s BB/ Stable /B
brA+/ Stable /brA-1
Global Scale
Local Scale - Brazil Aug. 06, 2012 Mar. 31, 2012
Moody's Ba3/ Stable /Not Prime
A2.br/ Stable /BR-2
Global Scale
Local Scale - Brazil Nov. 28, 2011 Set. 30, 2011
FitchRatings BBB/ Stable /F3 Local Scale - Brazil July 11, 2012 Mar 31, 2012
RiskBank 10.36
Ranking: 42
Riskbank Index
Low Risk Short Term Oct. 17, 2012 June 30, 2012
Capital Market
Total Shares and Free Float
Number of shares as of September 30, 2012
Type Corporate
Capital
Controlling
Group Management Treasury Free Float %
Common 36,945,649 20,743,333 277,307 - 15,925,009 43.1%
Preferred 26,160,044 609,226 60,125 734,515 24,756,178 94.6%
TOTAL 63,105,693 21,352,559 337,432 734,515 40,681,187 64.5%
Share Buyback Program
On October 19, 2011, the Board of Directors approved the 5th Share Buyback Program, effective until October 18, 2012, for
the acquisition of up to 1,720,734 preferred shares. Until September 30, 2012, no share had been repurchased under the
program, in which Indusval S.A. CTVM acts as the intermediary.
Stock Option Plan
The following Stock Options Plans, approved to be extended to the Company’s executive officers and managers, as well as
individuals who provide services to the Company or its subsidiaries, present the following balances as of September 30,
2012:
Quantity
Stock Option
Plan
Date of
Approval Grace Period
Term for
Exercise Granted Exercised Extinct Not Exercised
I 03.26.2008 Three years Five years 2,039,944 37,938 207,437 1,794,569
II 04.29.2011 Three years Five years 1,840,584 - 273,459 1,567,125
III 04.29.2011 Five years Seven years 1,850,786 - - 1,850,786
IV 04.24.2012 Up to five years Five years 355,840 - - 355,840
6,087,154 37,938 480,896 5,568,320
The aforementioned Stock Options Plans are filed with the Brazilian Securities Commission (CVM) and are also available in
the Company’s IR website.
15/18
Remuneration to Shareholder
During the first nine months of 2012, there was no provisioning or anticipated payment of interest on equity on account of
the minimum annual dividend for fiscal year 2012. The Board of Directors will, during the 2nd semester, analyze the
opportunity for such anticipated payments considering the company’s results in the current year and the tax efficiency of
such payment.
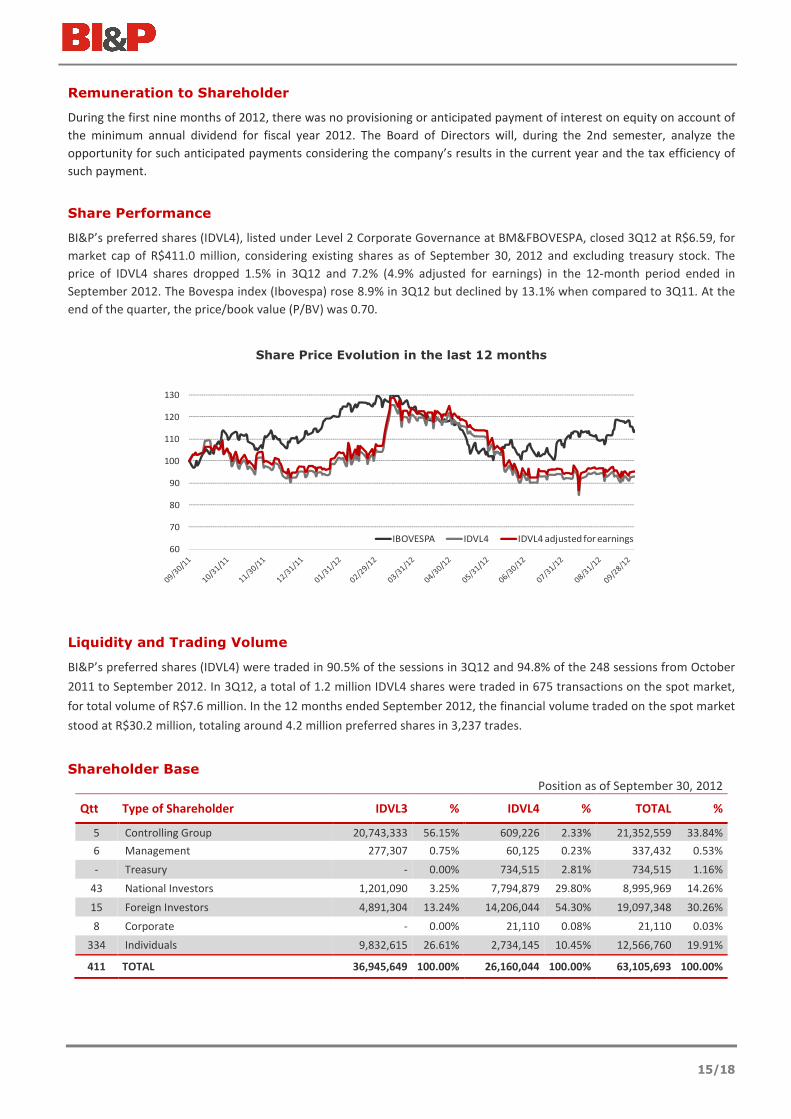
Share Performance
BI&P’s preferred shares (IDVL4), listed under Level 2 Corporate Governance at BM&FBOVESPA, closed 3Q12 at R$6.59, for
market cap of R$411.0 million, considering existing shares as of September 30, 2012 and excluding treasury stock. The
price of IDVL4 shares dropped 1.5% in 3Q12 and 7.2% (4.9% adjusted for earnings) in the 12-month period ended in
September 2012. The Bovespa index (Ibovespa) rose 8.9% in 3Q12 but declined by 13.1% when compared to 3Q11. At the
end of the quarter, the price/book value (P/BV) was 0.70.
Share Price Evolution in the last 12 months
Liquidity and Trading Volume
BI&P’s preferred shares (IDVL4) were traded in 90.5% of the sessions in 3Q12 and 94.8% of the 248 sessions from October
2011 to September 2012. In 3Q12, a total of 1.2 million IDVL4 shares were traded in 675 transactions on the spot market,
for total volume of R$7.6 million. In the 12 months ended September 2012, the financial volume traded on the spot market
stood at R$30.2 million, totaling around 4.2 million preferred shares in 3,237 trades.
Shareholder Base
Position as of September 30, 2012
Qtt Type of Shareholder IDVL3 % IDVL4 % TOTAL %
5 Controlling Group 20,743,333 56.15% 609,226 2.33% 21,352,559 33.84%
6 Management 277,307 0.75% 60,125 0.23% 337,432 0.53%
- Treasury - 0.00% 734,515 2.81% 734,515 1.16%
43 National Investors 1,201,090 3.25% 7,794,879 29.80% 8,995,969 14.26%
15 Foreign Investors 4,891,304 13.24% 14,206,044 54.30% 19,097,348 30.26%
8 Corporate - 0.00% 21,110 0.08% 21,110 0.03%
334 Individuals 9,832,615 26.61% 2,734,145 10.45% 12,566,760 19.91%
411 TOTAL 36,945,649 100.00% 26,160,044 100.00% 63,105,693 100.00%
60
70
80
90
100
110
120
130
IBOVESPA IDVL4 IDVL4 adjusted for earnings
16/18
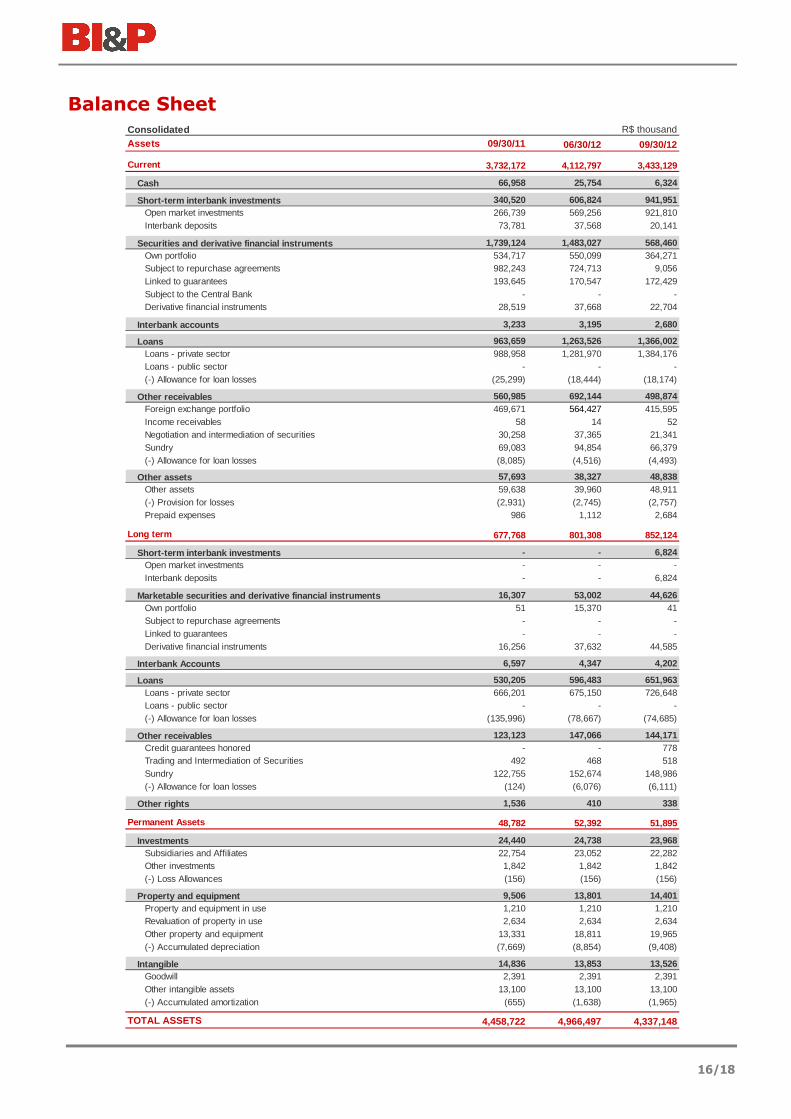
Balance Sheet
Consolidated R$ thousand
Assets 09/30/11 06/30/12 09/30/12
Current 3,732,172 4,112,797 3,433,129
Cash 66,958 25,754 6,324
Short-term interbank investments 340,520 606,824 941,951 Open market investments 266,739 569,256 921,810 Interbank deposits 73,781 37,568 20,141
Securities and derivative financial instruments 1,739,124 1,483,027 568,460 Own portfolio 534,717 550,099 364,271 Subject to repurchase agreements 982,243 724,713 9,056 Linked to guarantees 193,645 170,547 172,429 Subject to the Central Bank - - - Derivative financial instruments 28,519 37,668 22,704
Interbank accounts 3,233 3,195 2,680
Loans 963,659 1,263,526 1,366,002 Loans - private sector 988,958 1,281,970 1,384,176 Loans - public sector - - - (-) Allowance for loan losses (25,299) (18,444) (18,174)
Other receivables 560,985 692,144 498,874 Foreign exchange portfolio 469,671 564,427 415,595 Income receivables 58 14 52 Negotiation and intermediation of securities 30,258 37,365 21,341 Sundry 69,083 94,854 66,379 (-) Allowance for loan losses (8,085) (4,516) (4,493)
Other assets 57,693 38,327 48,838 Other assets 59,638 39,960 48,911 (-) Provision for losses (2,931) (2,745) (2,757)Prepaid expenses 986 1,112 2,684
Long term 677,768 801,308 852,124
Short-term interbank investments - - 6,824 Open market investments - - - Interbank deposits - - 6,824
Marketable securities and derivative financial inst ruments 16,307 53,002 44,626 Own portfolio 51 15,370 41 Subject to repurchase agreements - - - Linked to guarantees - - - Derivative financial instruments 16,256 37,632 44,585
Interbank Accounts 6,597 4,347 4,202
Loans 530,205 596,483 651,963 Loans - private sector 666,201 675,150 726,648 Loans - public sector - - - (-) Allowance for loan losses (135,996) (78,667) (74,685)
Other receivables 123,123 147,066 144,171 Credit guarantees honored - - 778 Trading and Intermediation of Securities 492 468 518 Sundry 122,755 152,674 148,986 (-) Allowance for loan losses (124) (6,076) (6,111)
Other rights 1,536 410 338
Permanent Assets 48,782 52,392 51,895
Investments 24,440 24,738 23,968 Subsidiaries and Affiliates 22,754 23,052 22,282 Other investments 1,842 1,842 1,842 (-) Loss Allowances (156) (156) (156)
Property and equipment 9,506 13,801 14,401 Property and equipment in use 1,210 1,210 1,210 Revaluation of property in use 2,634 2,634 2,634 Other property and equipment 13,331 18,811 19,965 (-) Accumulated depreciation (7,669) (8,854) (9,408)
Intangible 14,836 13,853 13,526 Goodwill 2,391 2,391 2,391 Other intangible assets 13,100 13,100 13,100 (-) Accumulated amortization (655) (1,638) (1,965)
TOTAL ASSETS 4,458,722 4,966,497 4,337,148
17/18
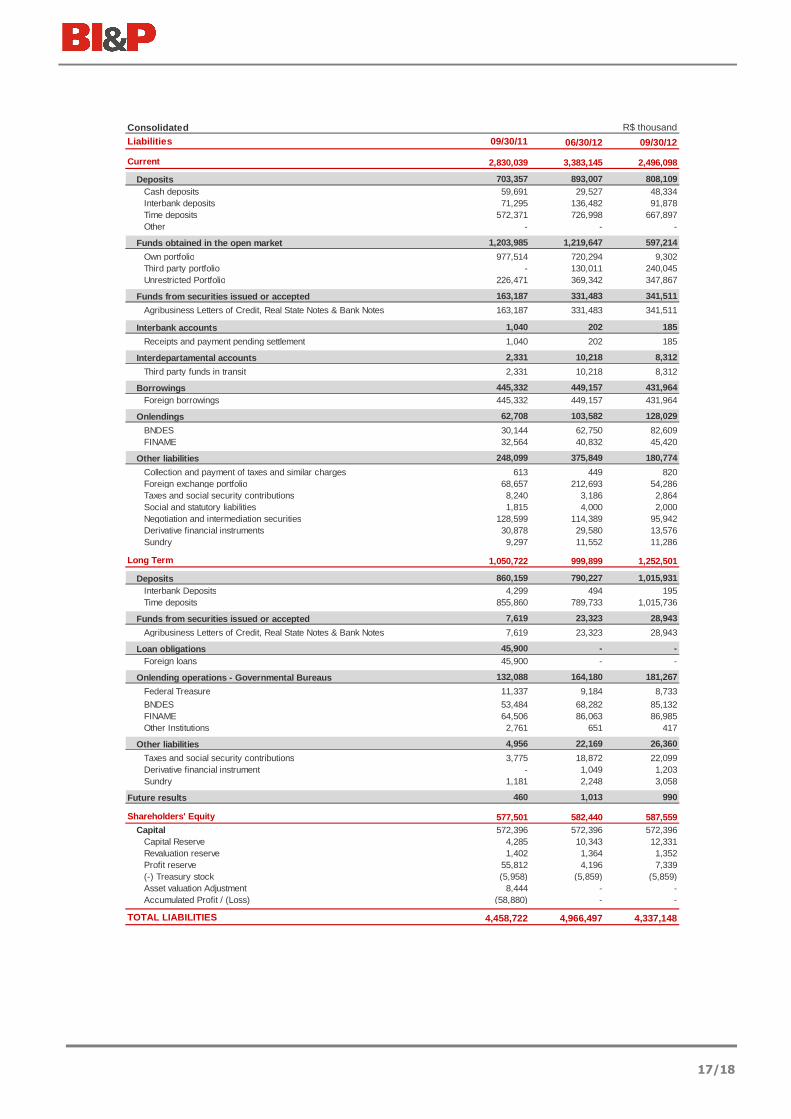
Consolidated R$ thousand
Liabilities 09/30/11 06/30/12 09/30/12
Current 2,830,039 3,383,145 2,496,098
Deposits 703,357 893,007 808,109 Cash deposits 59,691 29,527 48,334 Interbank deposits 71,295 136,482 91,878 Time deposits 572,371 726,998 667,897 Other - - -
Funds obtained in the open market 1,203,985 1,219,647 597,214
Own portfolio 977,514 720,294 9,302 Third party portfolio - 130,011 240,045 Unrestricted Portfolio 226,471 369,342 347,867
Funds from securities issued or accepted 163,187 331,483 341,511
Agribusiness Letters of Credit, Real State Notes & Bank Notes 163,187 331,483 341,511
Interbank accounts 1,040 202 185
Receipts and payment pending settlement 1,040 202 185
Interdepartamental accounts 2,331 10,218 8,312
Third party funds in transit 2,331 10,218 8,312
Borrowings 445,332 449,157 431,964 Foreign borrowings 445,332 449,157 431,964
Onlendings 62,708 103,582 128,029
BNDES 30,144 62,750 82,609 FINAME 32,564 40,832 45,420
Other liabilities 248,099 375,849 180,774
Collection and payment of taxes and similar charges 613 449 820 Foreign exchange portfolio 68,657 212,693 54,286 Taxes and social security contributions 8,240 3,186 2,864 Social and statutory liabilities 1,815 4,000 2,000 Negotiation and intermediation securities 128,599 114,389 95,942 Derivative financial instruments 30,878 29,580 13,576 Sundry 9,297 11,552 11,286
Long Term 1,050,722 999,899 1,252,501
Deposits 860,159 790,227 1,015,931 Interbank Deposits 4,299 494 195 Time deposits 855,860 789,733 1,015,736
Funds from securities issued or accepted 7,619 23,323 28,943
Agribusiness Letters of Credit, Real State Notes & Bank Notes 7,619 23,323 28,943
Loan obligations 45,900 - - Foreign loans 45,900 - -
Onlending operations - Governmental Bureaus 132,088 164,180 181,267
Federal Treasure 11,337 9,184 8,733
BNDES 53,484 68,282 85,132 FINAME 64,506 86,063 86,985 Other Institutions 2,761 651 417
Other liabilities 4,956 22,169 26,360
Taxes and social security contributions 3,775 18,872 22,099 Derivative financial instrument - 1,049 1,203 Sundry 1,181 2,248 3,058
Future results 460 1,013 990
Shareholders' Equity 577,501 582,440 587,559 Capital 572,396 572,396 572,396
Capital Reserve 4,285 10,343 12,331 Revaluation reserve 1,402 1,364 1,352 Profit reserve 55,812 4,196 7,339 (-) Treasury stock (5,958) (5,859) (5,859)Asset valuation Adjustment 8,444 - - Accumulated Profit / (Loss) (58,880) - -
TOTAL LIABILITIES 4,458,722 4,966,497 4,337,148
18/18
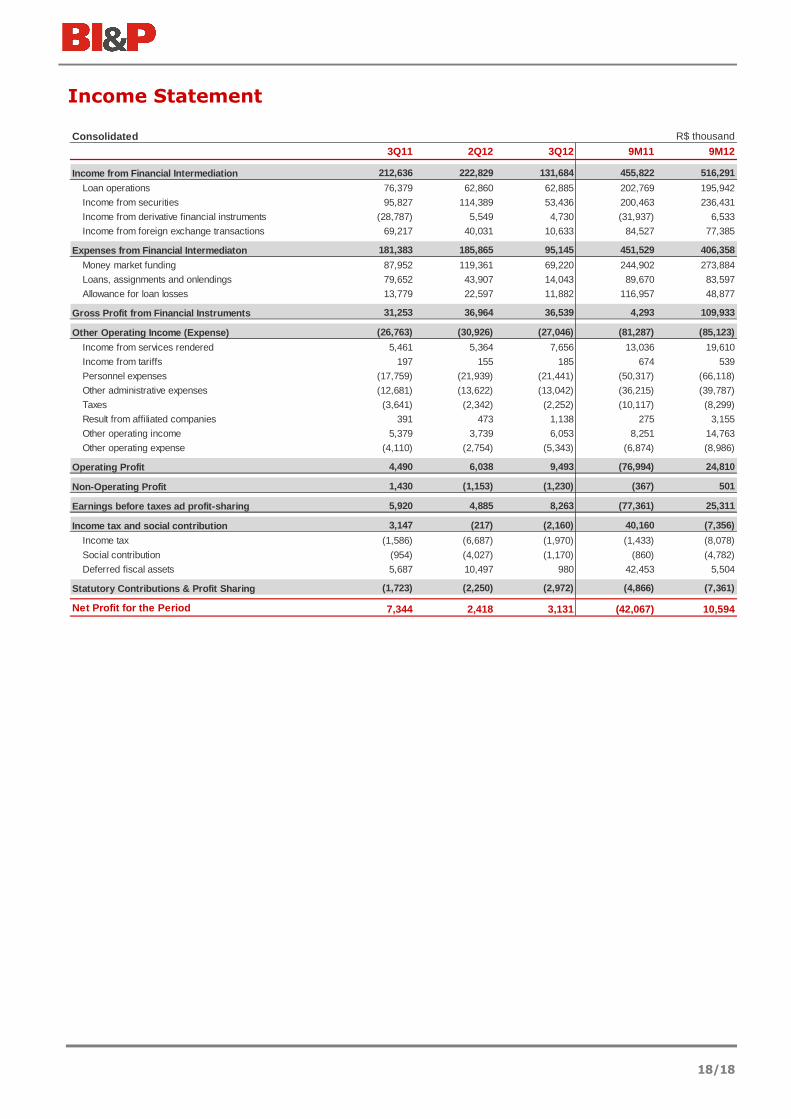
Income Statement
Consolidated R$ thousand
3Q11 2Q12 3Q12 9M11 9M12
Income from Financial Intermediation 212,636 222,829 131,684 455,822 516,291
Loan operations 76,379 62,860 62,885 202,769 195,942
Income from securities 95,827 114,389 53,436 200,463 236,431
Income from derivative financial instruments (28,787) 5,549 4,730 (31,937) 6,533
Income from foreign exchange transactions 69,217 40,031 10,633 84,527 77,385
Expenses from Financial Intermediaton 181,383 185,865 95,145 451,529 406,358
Money market funding 87,952 119,361 69,220 244,902 273,884
Loans, assignments and onlendings 79,652 43,907 14,043 89,670 83,597
Allowance for loan losses 13,779 22,597 11,882 116,957 48,877
Gross Profit from Financial Instruments 31,253 36,964 36,539 4,293 109,933
Other Operating Income (Expense) (26,763) (30,926) (27,046) (81,287) (85,123)
Income from services rendered 5,461 5,364 7,656 13,036 19,610
Income from tariffs 197 155 185 674 539
Personnel expenses (17,759) (21,939) (21,441) (50,317) (66,118)
Other administrative expenses (12,681) (13,622) (13,042) (36,215) (39,787)
Taxes (3,641) (2,342) (2,252) (10,117) (8,299)
Result from affiliated companies 391 473 1,138 275 3,155
Other operating income 5,379 3,739 6,053 8,251 14,763
Other operating expense (4,110) (2,754) (5,343) (6,874) (8,986)
Operating Profit 4,490 6,038 9,493 (76,994) 24,810
Non-Operating Profit 1,430 (1,153) (1,230) (367) 501
Earnings before taxes ad profit-sharing 5,920 4,885 8,263 (77,361) 25,311
Income tax and social contribution 3,147 (217) (2,160) 40,160 (7,356)
Income tax (1,586) (6,687) (1,970) (1,433) (8,078)
Social contribution (954) (4,027) (1,170) (860) (4,782)
Deferred fiscal assets 5,687 10,497 980 42,453 5,504
Statutory Contributions & Profit Sharing (1,723) (2,250) (2,972) (4,866) (7,361)
Net Profit for the Period 7,344 2,418 3,131 (42,067) 10,594