Embed Size (px)
Citation preview

Raymond James 36th Annual Institutional Investors Conference
March 2, 2015
MASCO CORPORATION

Safe Harbor Statement
Statements contained in this presentation that reflect our views about our future performance constitute “forward-looking statements” under the Private Securities Litigation Reform Act of 1995. Forward-looking statements can be identified by words such as “believe,” “anticipate,” “appear,” “may,” “will,” “should,” “intend,” “plan,” “estimate,” “expect,” “assume,” “seek,” “forecast,” and similar references to future periods. These views involve risks and uncertainties that are difficult to predict and, accordingly, our actual results may differ materially from the results discussed in our forward-looking statements. We caution you against relying on any of these forward-looking statements. Our future performance may be affected by our reliance on new home construction and home improvement, our reliance on key customers, the cost and availability of raw materials, uncertainty in the international economy, shifts in consumer preferences and purchasing practices, our ability to improve our underperforming businesses, our ability to maintain our competitive position in our industries, risks associated with the proposed spin-off of our Services Business, our ability to realize the expected benefits of the spin-off, the timing and terms of our share repurchase program, and our ability to reduce corporate expense and simplify our organizational structure. We discuss many of the risks we face in Item 1A, “Risk Factors” in our most recent Annual Report on Form 10-K, as well as in our Quarterly Reports on Form 10-Q and in other filings we make with the Securities and Exchange Commission. Our forward-looking statements in this presentation speak only as of the date of this presentation. Factors or events that could cause our actual results to differ may emerge from time to time, and it is not possible for us to predict all of them. Unless required by law, we undertake no obligation to update publicly any forward-looking statements as a result of new information, future events or otherwise.
The Company believes that the non-GAAP performance measures and ratios that are contained herein, used in managing the business, may provide users of this financial information with additional meaningful comparisons between current results and results in prior periods. Non-GAAP performance measures and ratios should be viewed in addition to, and not as an alternative for, the Company's reported results under accounting principles generally accepted in the United States. Additional information about the Company is contained in the Company's filings with the Securities and Exchange Commission and is available on Masco's website at www.masco.com.
2

Agenda
● Masco Key Highlights
● Powerful Capabilities– Strengths
– Opportunities
● Renewed Focus and Momentum
3

Masco at a Glance
Revenue $8.5B
Market cap >$8.8B
Dividend yield 1.4%
Free Cash Flow >$440M
Focused on Repair & Remodel(Breakdown of 2014 Revenue)
NewConstruction
Repair &Remodel71%29%
4
12/31/2014
Liquidity $1.7B

Masco – Strong Brands with Industry Leading Positions
5
BUSINESS SEGMENT
Cabinetsand Related Products
PlumbingProducts
Installation and Other Services
DecorativeArchitecturalProducts
$1.0B
$3.3B
$1.5B
$2.0B
REVENUE 2014
$8.5BTotal Company
OtherSpecialtyProducts
$0.7B
LEADING POSITIONS
Leading U.S. kitchen and bath cabinetry brands
#1 worldwide in faucets, fittings, showerheads
#1 in spas
Leading installer of and distributor of insulation products to the U.S. construction industry
Leading DIY paint and stain provider
#1 in vinyl windows in the western U.S.
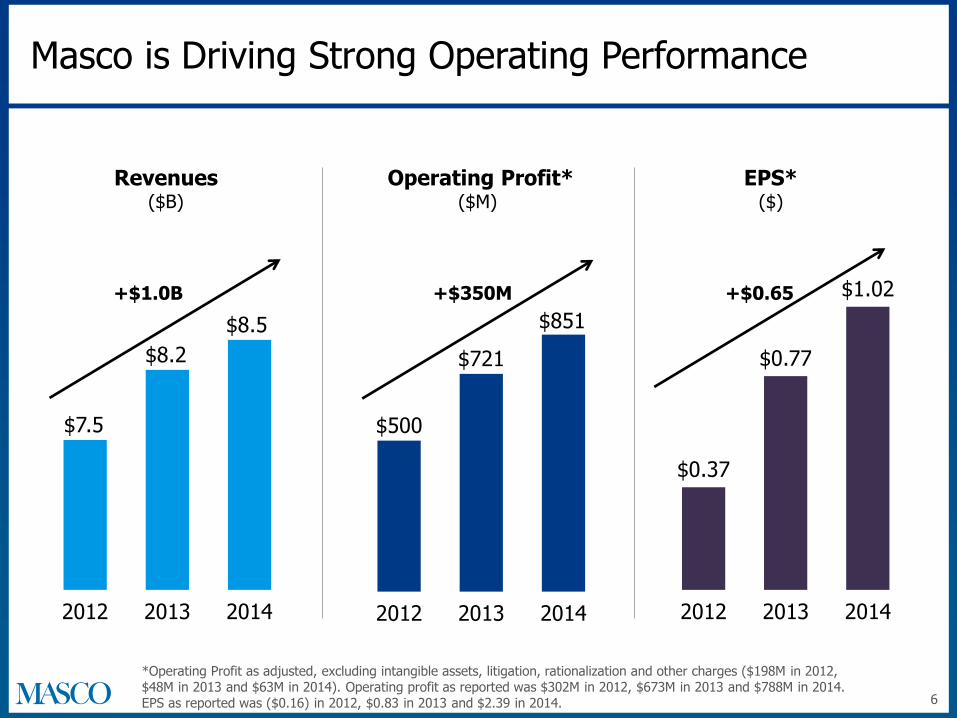
Masco is Driving Strong Operating Performance
6
*Operating Profit as adjusted, excluding intangible assets, litigation, rationalization and other charges ($198M in 2012, $48M in 2013 and $63M in 2014). Operating profit as reported was $302M in 2012, $673M in 2013 and $788M in 2014. EPS as reported was ($0.16) in 2012, $0.83 in 2013 and $2.39 in 2014.
$7.5
$8.2
$8.5
2012 2013 2014
Revenues($B)
$500
$721
$851
2012 2013 2014
$0.37
$0.77
$1.02
2012 2013 2014
EPS*($)
Operating Profit*($M)
+$1.0B +$350M +$0.65

Agenda
● Masco Key Highlights
● Powerful Capabilities– Strengths
– Opportunities
● Renewed Focus and Momentum
7

Masco Strengths
8
1 Unparalleled brand strength
2 Customer focused innovation
3 Broad market coverage
4 Strong financial position

M A S C O S T R E N G T H S
1. Unparalleled Brand Strength Drives Share Gains
9
Masco Cabinetry(cabinet manufacturer
in U.S.)
Delta(faucet brand
in North America)
Masco Contractor Services
(leading installer and distributor of insulation
products to U.S. construction industry)
Behr(DIY architectural
coatings inNorth America)
Milgard(vinyl window
brand inWestern U.S.)
Hansgrohe(global faucet
& mixer brand)
Arrow, Liberty,BrassCraft and
Watkins(in their respective
categories)
#2
#1
#1
#1#1
#1
#2

M A S C O S T R E N G T H S
2. Customer Focused Innovation
10* Percentage of 2014 gross sales of manufactured products attributable to new products introduced in trailing 36 months
30%*
Examples of New Products/Technologies
ExistingProducts
201420132012
70%
Hansgrohe SelectTM
Collection
KraftMaid® New Design Launch
2014 Revenues
Delta® Toilets
Paint & Primer in One with Advanced Stain
Blocking Formula
KraftMaid® Vanities
Behr DeckOver®
Coating
KraftMaid® Vantage
Behr Marquee®
Coating
Delta Temp 20TM

M A S C O S T R E N G T H S
3. Broad Coverage Across Segments, Price Points and Channels
11
Segments Price Points Channels
Newconstruction
29%
Repair / remodel71%
International19%
N. America81%
• Low ticket value ~$20
• High ticket luxury ~$20K
• Direct-to-Builder
• Big box retail
• Wholesale / dealer trade

M A S C O S T R E N G T H S
4. Strong Financial Position
12
Strong Liquidity(as of 12/31/2014)
● A strong operating cash flow business
– ~$1B last 3 years
– Maintenance capex of ~$100M annually
● Valuation allowance of ~$529 million on deferred tax assets was reversed in 2014
● Plan to reduce debt $300M–$500M by 2016
Declining Debt to Capitalization Ratio
2014Year End
FutureTarget
Balance Sheet Liquidity
Cash and cash investments $1.4B
Short-term bank deposits $0.3B
Total $1.7B
75%
45%–55%

Agenda
● Masco Key Highlights
● Powerful Capabilities– Strengths
– Opportunities
● Renewed Focus and Momentum
13

Masco Opportunities
14
2. Leverage
opportunities across our portfolio
1. Drive full
potential of our core businesses
3.Activelymanageportfolio
O P P O RT U N I T I E S

M A S C O O P P O R T U N I T I E S
1. Drive Full Potential of Our Core Businesses
15
Current Examples:
● Extended Delta® brand to toilets and showers based on the power of the brand
● Increased Behr marketing to the professional painter to add a new channel
● Extended Hansgrohe into new international markets
1.

M A S C O O P P O R T U N I T I E S
2. Leverage Opportunities Across Our Portfolio
16
● Improved supply chain by implementing best practices across our portfolio
● Reduced material costs from integrated purchasing
● Applied value engineering across businesses
Current Examples:
2.
M A S C O O P P O R T U N I T I E S
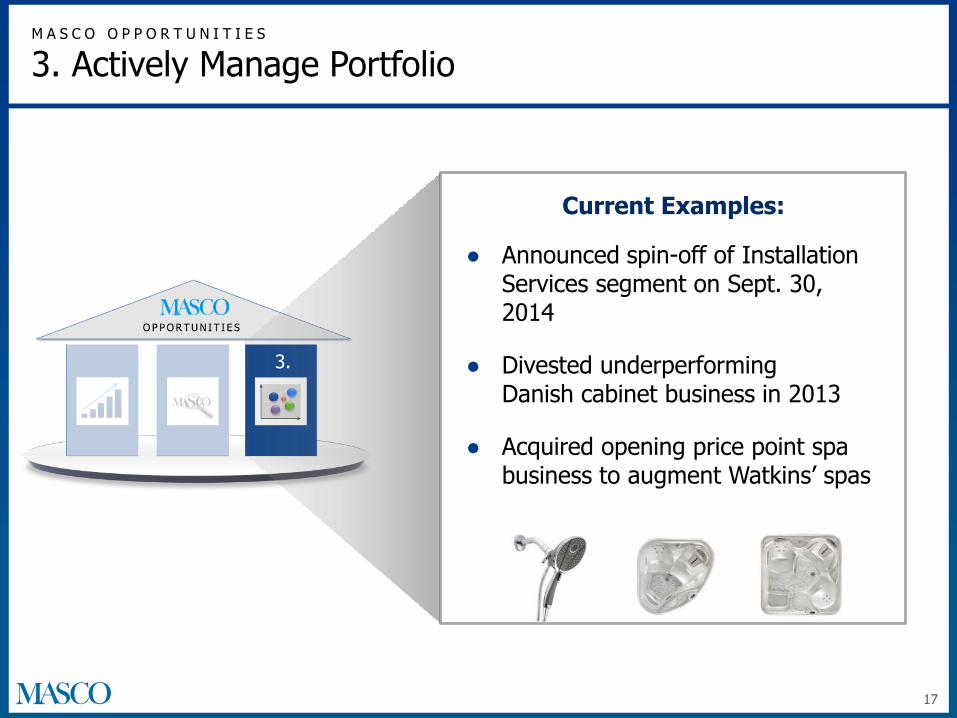
3. Actively Manage Portfolio
17
● Announced spin-off of Installation Services segment on Sept. 30, 2014
● Divested underperforming Danish cabinet business in 2013
● Acquired opening price point spa business to augment Watkins’ spas
Current Examples:
3.

Agenda
● Masco Key Highlights
● Powerful Capabilities– Strengths
– Opportunities
● Renewed Focus and Momentum
18

Key Initiatives to Unlock Shareholder Value
Unlocking Shareholder
Value
19
Spin-off of Installation and Other Services businesses
Reduce corporateexpense
Share repurchase program

Creating Two Strong Public Companies
• Differentiated businesses with strong technical competence in their respective manufacturing and service sectors
• Targeted investment opportunity for investors via a tax-free distribution of shares to Masco Corporation shareholders
• Completion targeted for mid-year 201520
Masco2014 Revenue: $7.0B
Focus: Branded Building Products
The New “Services Business”2014 Revenue: $1.5B
Focus: Installation and Distribution Services

Service Partners
Leading distributor of insulation, rain gutters, garage doors and fireplaces as well as other building products
Examples of Products Distributed
The Services Business Today - A Strong Platform
Masco Contractor Services
Leading installer of insulation, rain gutters, garage doors, fireplaces and more as well as recognized building science expertise
Examples of Products Installed
Garage Doors
InsulationGutters Fireplaces RoofingCellulose Insulation
21

Multiple Growth Drivers
Capitalize on new construction recovery through focus on organic growth
Further expansion into commercial construction
Leverage building science expertise
22
1
2
3
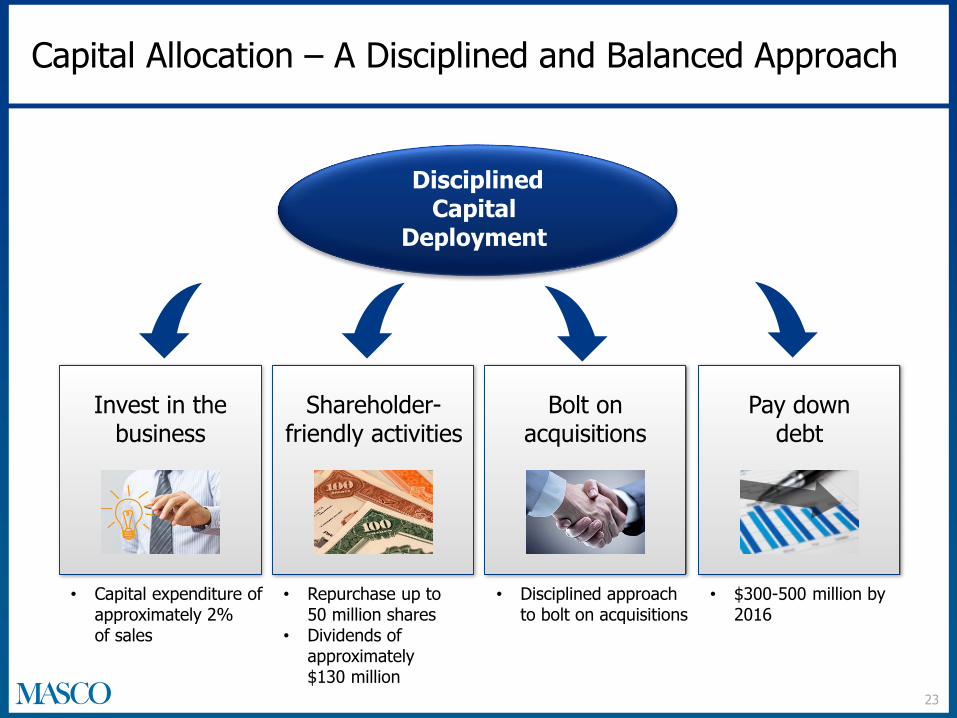
DisciplinedCapital
Deployment
23
Invest in the business
Pay down debt
Bolt on acquisitions
Shareholder-friendly activities
Capital Allocation – A Disciplined and Balanced Approach
• Capital expenditure of approximately 2% of sales
• $300-500 million by 2016
• Disciplined approach to bolt on acquisitions
• Repurchase up to 50 million shares
• Dividends of approximately $130 million

Delivering Shareholder Value Creation
24
Transforming • Delivering on the promise of transformation
• Unlocking value by creating two strong companies with independent growth opportunities
• Returning capital to shareholders
• Maintaining our focus on continued strong operating performance and free cash flow generation
• Streamlining corporate expense and organizational structure
Two Strong Companies
Share Repurchase Program
Reduce Corporate Expense
Balanced Capital Allocation

Key Messages
25
1 Strong operating performance
2 Customer focused innovation
3 Disciplined capital allocation
4 Strong financial position

Appendix

($ in Millions) 2015 Estimate 2014 Actual
Rationalization Charges1, 3 ~ $30 $72
Tax Rate4 ~ 36% 34%
Interest Expense ~ $235 $225
General Corp. Expense2 ~ $100 $103
Capital Expenditures ~ $190 $128
Depreciation & Amortization3
~ $154 $167
Shares Repurchased5 $400-500 $158
Shares Outstanding6 352 million 352 million
2015 Guidance Estimates
1. Based on 2015 business plans. 2015 includes approximately $25 million related to spin-off transaction costs.2. Excludes rationalization expenses of $33 million for the year ended December 31, 2014 and $16 million (estimated) for the year ended December 31, 2015.3. Includes accelerated depreciation of $1 million for the year ended December 31, 2014. This expense is also included in the rationalization charges.4. Excludes $529 million release of the valuation allowance in 2014. 5. 2014 share repurchases include approximately 1.7 million shares to offset grants of long-term stock awards.6. Assumes no share repurchases throughout 2015.
27

2014 Segment Mix*
R&R = % of sales to repair and remodel channelsNC = % of sales to new construction channels NA = % of sales within North AmericaInt’l = % of sales outside North America *Based on Company estimates.
Business Segment
PlumbingProducts
Installation andOther Services
DecorativeArchitecturalProducts
$3.3B
$1.5B
$2.0B
Revenue 2014 % of Total
39%
23%
18%
$8.5B 100%Total Company
Other SpecialtyProducts $0.7B 8%
R&R% vs. NC NA% vs. Int’l
82% 59%
99% 100%
18% 100%
74% 74%
71% 81%
Cabinets andRelated Products $1.0B 12% 55% 91%
28

2014 International Revenue Split*
*Based on Company estimates.
International Sales Accounted for ~19% of Total 2014 Masco Sales
28%
5%
10%
25%
9%
14%
9%
UK
Northern Europe
Southern Europe
Central Europe
Eastern Europe
Emerging markets
Other
29


