Embed Size (px)
Citation preview

1
Earnings Release | Conference Call – 1Q14
May 14th, 2014
2
Agenda
Ricardo Ribeiro
Vice President
Carlos Wollenweber
CFO | IR Officer
Operational Highlights
Financial Highlights
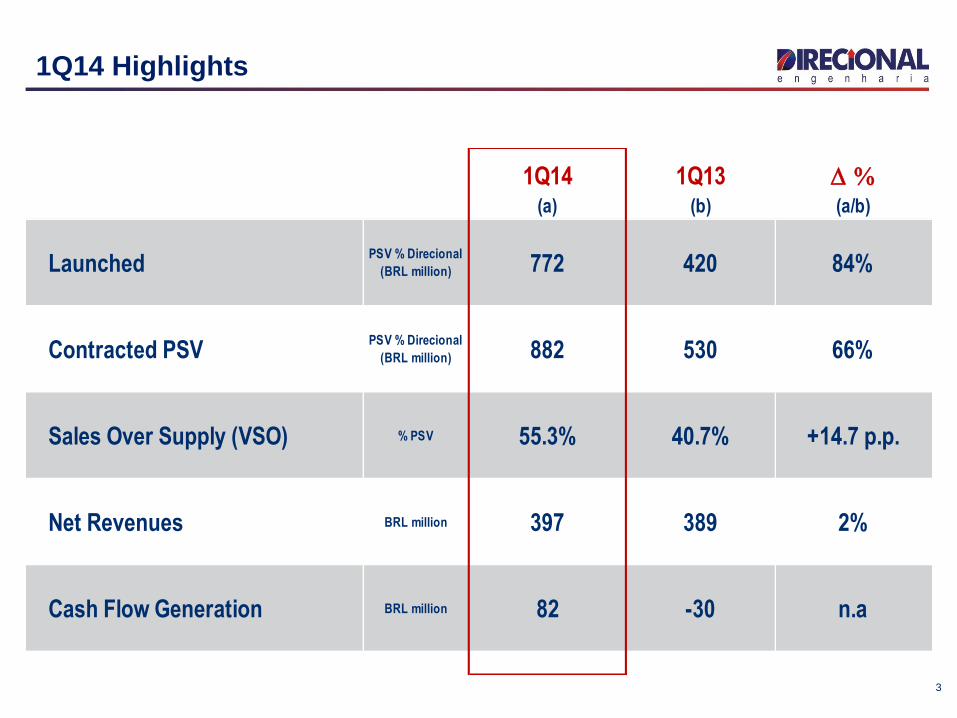
1Q14 1Q13 D %(a) (b) (a/b)
Launched PSV % Direcional
(BRL million) 772 420 84%
Contracted PSVPSV % Direcional
(BRL million) 882 530 66%
Sales Over Supply (VSO) % PSV 55.3% 40.7% +14.7 p.p.
Net Revenues BRL million 397 389 2%
Cash Flow Generation BRL million 82 -30 n.a
3
1Q14 Highlights

MG
RS
681,595PSV (R$'000)
Units
Granja Werneck
8,896
89,909PSV (R$'000)
Units
Irmãos Maristas
1,300
4
Launches - 1Q14
1Q14
88%
12%
1Q13
13%
87%
Launches by Region - MCMV Level 1
(% PSV)
South Southeast North
We launched two projects under the PMCMV Level 1 in 1Q14, the PSV totaled R$ 772 million
772
1Q13
+84%
1Q14
420
405
15
Launched PSV
(R$ million)
MCMV Level 1
Development
5
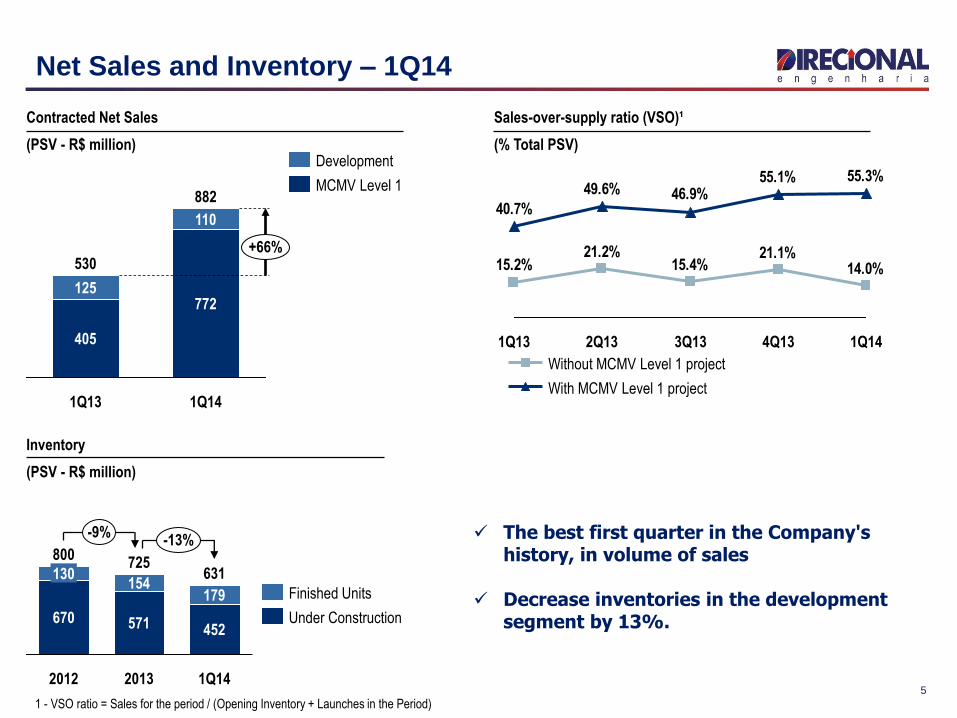
Net Sales and Inventory – 1Q14
-13% -9%
1Q14
631
452
179
2013
725
571
154
2012
800
670
130
Under Construction
Finished Units
Inventory
(PSV - R$ million)
882
+66%
1Q14
772
110
1Q13
530
405
125
Contracted Net Sales
(PSV - R$ million)
MCMV Level 1
Development
14.0%21.1%
15.4%21.2%
15.2%
55.3%55.1%46.9%49.6%
40.7%
1Q14 4Q13 3Q13 2Q13 1Q13
With MCMV Level 1 project
Without MCMV Level 1 project
Sales-over-supply ratio (VSO)¹
(% Total PSV)
1 - VSO ratio = Sales for the period / (Opening Inventory + Launches in the Period)
The best first quarter in the Company's history, in volume of sales
Decrease inventories in the development segment by 13%.
6
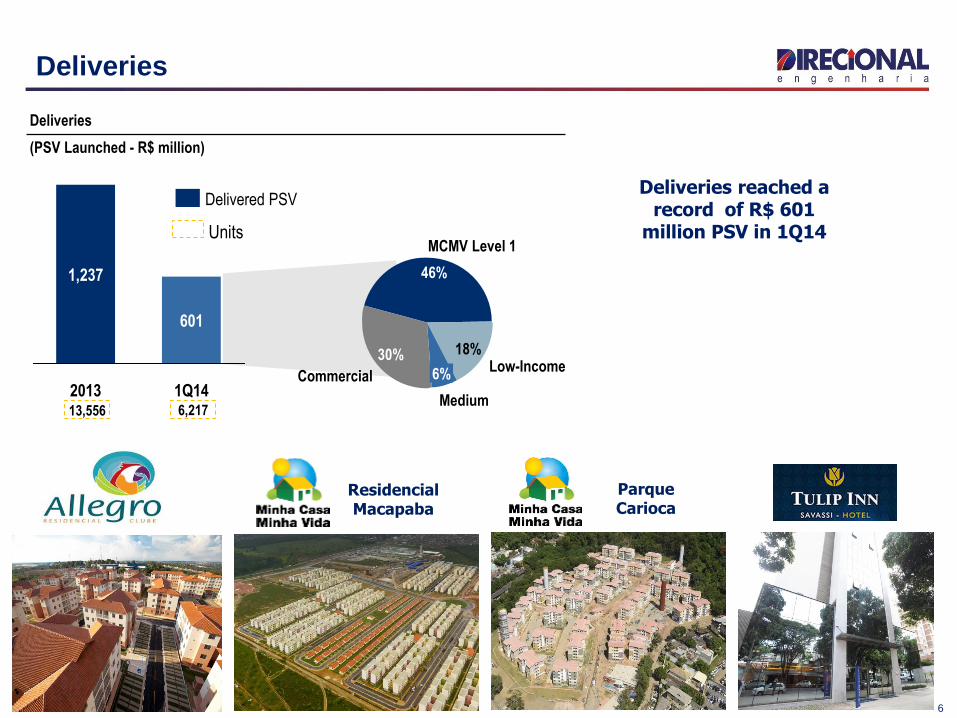
Deliveries
Deliveries
(PSV Launched - R$ million)
Units
6,217 13,556
1Q14
601
2013
1,237
Delivered PSV
30%
Commercial
18%
MCMV Level 1
46%
Medium
6% Low-Income
Residencial Macapaba
Parque Carioca
Deliveries reached a record of R$ 601
million PSV in 1Q14
7
Carlos Wollenweber
CFO | IR Officer
Financial Highlights

8
Results to be recognized
Service
78%
Development
22%
Service
87%
Development
13%
Breakdown of Results to be Recognized
(% Total – 1Q14)
1Q14 1Q13
+13%
4,214
+61%
1Q14
3,660
555
4Q13
3,746
3,160
586
1Q13
2,620
2,035
585
Level 1
Development
Revenues to be Recognized
(R$ million)
9
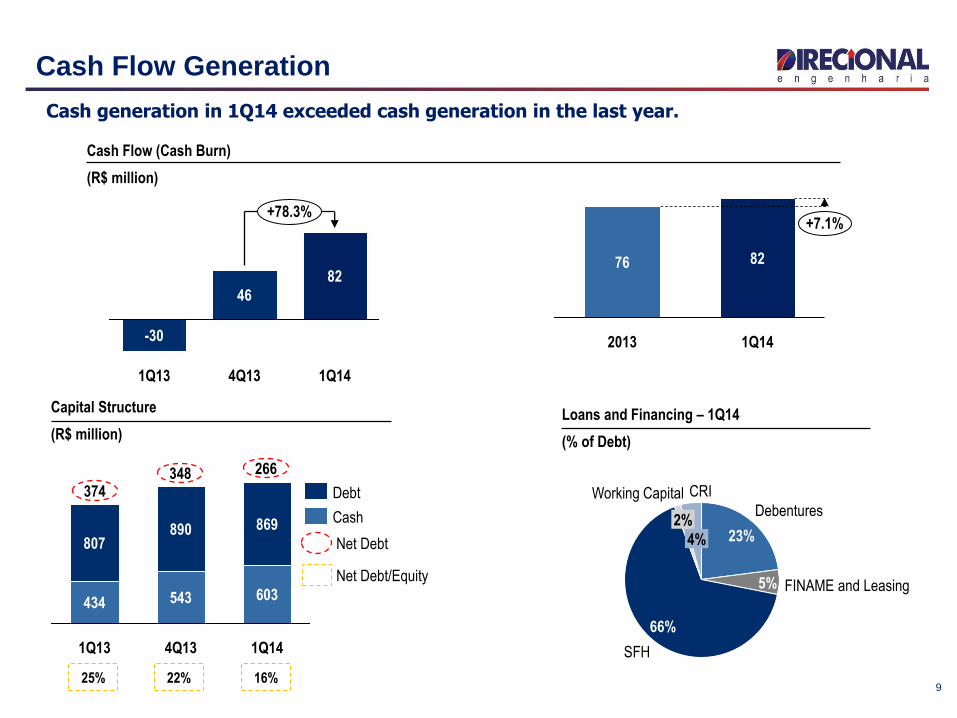
Cash Flow Generation
+7.1%
1Q14
82
2013
76
Cash Flow (Cash Burn)
(R$ million)
Capital Structure
(R$ million)
1Q14
603
869
4Q13
543
890
1Q13
434
807
Cash
Debt 374
Net Debt
25% 22% 16%
Net Debt/Equity
348 266
CRI
4%
Working Capital
2%
SFH
66%
FINAME and Leasing 5%
Debentures
23%
Loans and Financing – 1Q14
(% of Debt)
+78.3%
1Q14
82
4Q13
46
1Q13
-30
Cash generation in 1Q14 exceeded cash generation in the last year.
10
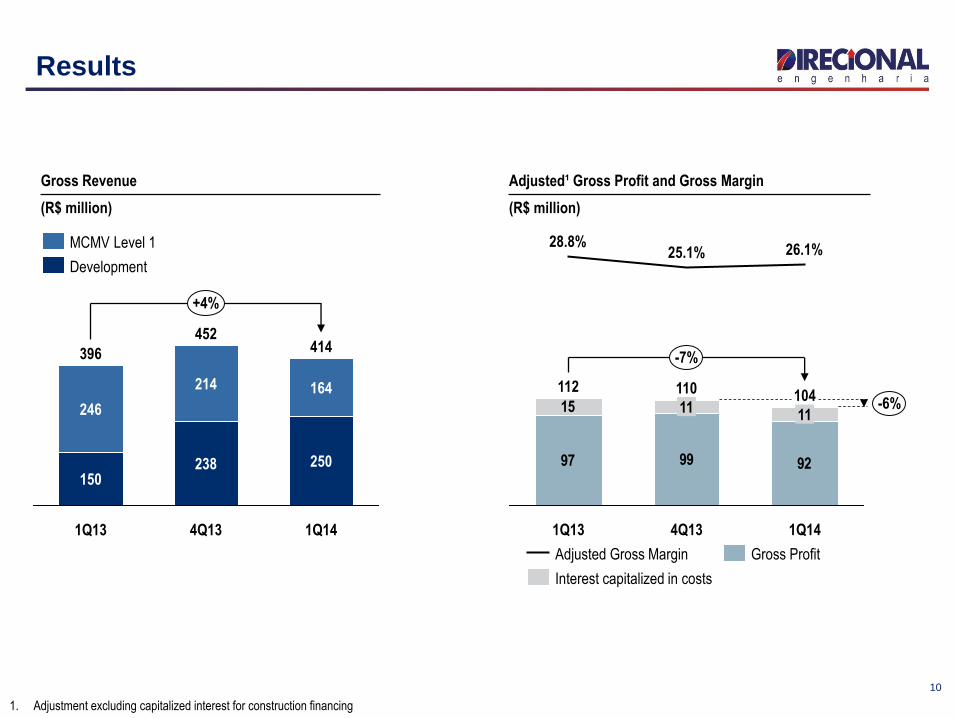
Results
Gross Revenue
(R$ million)
+4%
1Q14
414
250
164
4Q13
452
238
214
1Q13
396
150
246
Development
MCMV Level 1
1. Adjustment excluding capitalized interest for construction financing
Adjusted¹ Gross Profit and Gross Margin
(R$ million)
97 99 92
15104
-6%
-7%
1Q14
11
26.1%
4Q13
110
11
25.1%
1Q13
112
28.8%
Gross Profit
Interest capitalized in costs
Adjusted Gross Margin

11 11
Results
G&A
(R$ million)
+15%
1Q14
30
7.5%
4Q13
26
5.9%
1Q13
26
6.6%
% Net revenue
Selling Expenses
(R$ million)
14
3.3%
1Q13
6
1.6%
-27%
1Q14
11
2.7%
4Q13
% Net revenue
Net Income
(R$ million)
-8%
1Q14
46
11.7%
4Q13
50
11.5%
1Q13
55
14.1%
Net Margin

12
Disclosure and Contacts
This presentation contains certain forward-looking statements concerning the business prospects, projections of
operating and financial results and growth potential of the Company, which are based on management’s current
expectations and estimates of the future performance of the Company. Although the Company believes such
forward-looking statements are based on reasonable assumptions, it can give no assurance that its expectations
will be achieved. Expectations and estimates that are based on the future prospects of the Company are highly
dependent upon market behavior, Brazil’s political and economic situation, existing and future regulations of the
industry and international markets and, therefore, are subject to changes outside the Company’s and
management’s control. The Company undertakes no obligation to update any information contained herein or to
revise any forward-looking statement as a result of new information, future events or other information.
www.direcional.com.b/ir
(55 31) 3214-6200
(55 31) 3214-6450
Carlos Wollenweber
CFO | IR Officer
Paulo Sousa
IR Coordinator
Luiz Felipe Almeida
IR Analist


![1Q14 RESULTS PRESENTATION - NOS · 1Q14 RESULTS PRESENTATION Monthly Bill per Unique Corporate, SME and SoHo subscribers [Euros] 0 ä 200 ä 1Q13 2Q13 3Q13 4Q13 1Q14 Monthly Bill](https://img.dokumen.tips/doc/110x75/5f4bf904fbd0f2207a556b26/1q14-results-presentation-nos-1q14-results-presentation-monthly-bill-per-unique.jpg)