Embed Size (px)
Citation preview

Investor Overview December 2014
All information current to September 30, 2014 unless otherwise noted

Statements in this presentation that are not reported financial results or other historical information are "forward-looking statements" within the meaning of the Private Securities Litigation Reform Act of 1995. These statements include the company's expectations, beliefs, hopes, intentions or strategies regarding the future.
Forward looking statements include, but are not limited to:
• Statements about general economic conditions and the company's business outlook
• Assessment of current and future market conditions
• Business strategies, plans and goals
• Future sales or performance
• Future acquisitions
• Revenue and earnings forecasts
• Business model
• Management transition
• Timing of, and plans for, the introduction of new products and enhancements
• Competition
• Market share
• Revenue growth
• Operating margins
• Profitability
• Capital spending and financing needs
• Tax rates
These forward-looking statements are not guarantees of future performance. They are based on management's current expectations and various assumptions that involve a number of business risks and uncertainties, any of which could cause actual results to differ materially from those expressed in or implied by the forward-looking statements.
Factors that could cause our actual results to differ materially from those set forth in the forward-looking statements include, but are not limited to, the current downturn in the economy generally and in the architectural, engineering and construction industries specifically; competition in our industry and innovation by our competitors; our failure to anticipate and adapt to future changes in our industry; our failure to complete acquisitions, or failure to manage our acquisitions, including our inability to integrate and merge the business operations of the acquired companies or failure to retain key personnel and customers of acquired companies; our dependence on certain key vendors for equipment, maintenance services and supplies; damage or disruption to our facilities, our technology centers, our vendors or a majority of our customers; and our failure to continue to develop and introduce new services successfully. The foregoing list of risks and uncertainties is illustrative but is by no means exhaustive. For more information on factors that may affect our future performance, please review our periodic filings with the U.S. Securities and Exchange Commission, and specifically the risk factors set forth in our most recent reports on Form 10-K and Form 10-Q The Company undertakes no obligation to update or revise any forward-looking statements, whether as a result of new information, future events, or otherwise, except as required by law.
2
Forward Looking Statements
Non-GAAP (Reg G) Disclaimer
Certain information contained in this presentation is non-GAAP (generally accepted accounting principles) information within the meaning of SEC regulation G. This information is provided for a clearer or more complete understanding of comparative information and because management of the company believes that this information provides investors with useful information. Non-GAAP information should not be considered as a substitute for, or superior to, the reporting of results on a GAAP basis, which is provided in the company's SEC filings and press releases. Reconciliations of the most recent non-GAAP to GAAP information is set forth in our SEC filings, specifically our quarterly reports on form 10-Q, and our Annual Reports on Form 10-K. These documents are posted on the company's web site, www.e-arc.com, under the heading "Investor Relations" followed by "SEC Filings."

1990’s to 2005
ARC evolves into the largest reprographics consolidator in the world
• Builds national footprint from acquisitions
• Integration strategy dramatically improves profitability of acquired businesses
• Annual consolidated gross margins routinely above 40%
Management files IPO in 2005 Acquisition EBIDTA Multiple: 3.9
Post-Acquisition EBITDA Multiple: 2.9

4
2008 – 2012 Financial meltdown devastates non-res construction
’07 Forward - Value of Non Res Const PIP

5
2008 – 2012 ARC Metrics
ARC loses more than 40% of sales, but holds 30% margins throughout recession
• Forecasting chaos in economy and AEC industry
• Continuous right-sizing to align operations with constantly changing opportunity
• “Cut the coat to fit the cloth” was the only theme…
20.0%
25.0%
30.0%
35.0%
40.0%
45.0%
300,000
400,000
500,000
600,000
700,000
800,000
2008 2009 2010 2011 2012
Margin Strength vs. Revenue Decline
ARC Rev GM
2008:307 Locations 2012:186 Locations
39% Reduction in Service Centers
U.S. Real GDP Q/Q
50% Reduction of Labor Force
2008: 5,100 employees 2012: 2,600 employees

Print declines rapidly, the game begins to change…
$0
$20
$40
$60
$80
$100
$120
$140
$160
$180
$200
$0
$200,000
$400,000
$600,000
$800,000
$1,000,000
$1,200,000
$1,400,000
1Q 2
008
2Q 2
008
3Q 2
008
4Q 2
008
1Q 2
009
2Q 2
009
3Q 2
009
4Q 2
009
1Q 2
010
2Q 2
010
3Q 2
010
4Q 2
010
1Q 2
011
2Q 2
011
3Q 2
011
4Q 2
011
1Q 2
012
2Q 2
012
3Q 2
012
4Q 2
012
1Q 2
013
2Q 2
013
3Q 2
013
4Q 2
013
1Q 2
014
Private Non-Res Construction vs. ARC TR Revenue
Private Non-res Const Total ARC Segments Tradl Repro Revenue
($ value in millions)
Adoption of technology was changing the way people communicate…

• Deep domain knowledge and decades of experience
• Customers and relationships remain intact
• Document and information management still critical to AEC industry as workflow moves to cloud and mobile
• National footprint differentiates ARC and fosters strong local relationships within big companies
• Unique position as a large distribution channel to AEC creates leverage for partnerships and purchasing power with equipment manufacturers
• Proprietary suite of technology tools designed to distribute construction documents and information
7
Management mines existing strengths to identify opportunities

8
Management identifies three emerging solutions in AEC
MPS
Managed Print
Services
CDIM
Construction Document & Information Management
AIM
Archive & Information
Management
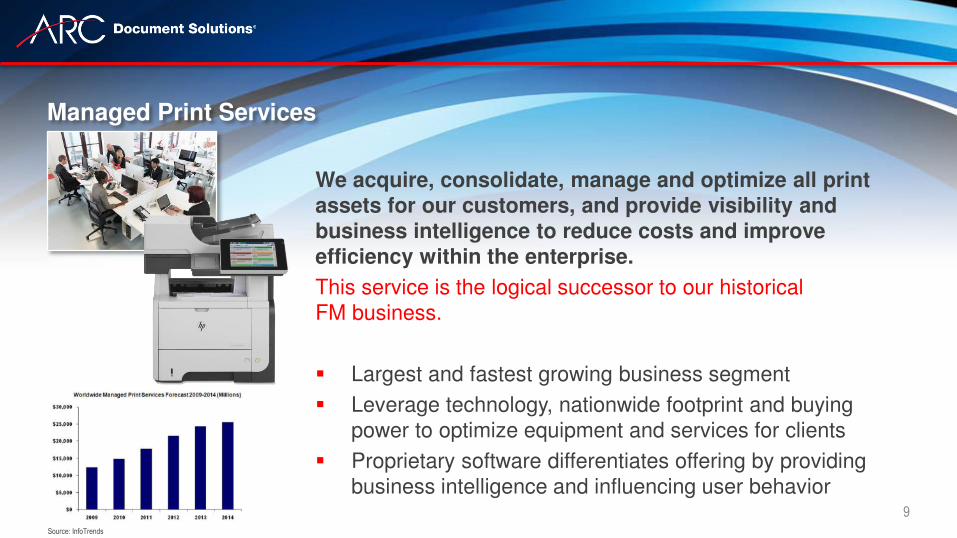
We acquire, consolidate, manage and optimize all print assets for our customers, and provide visibility and business intelligence to reduce costs and improve efficiency within the enterprise.
This service is the logical successor to our historical FM business.
Largest and fastest growing business segment
Leverage technology, nationwide footprint and buying power to optimize equipment and services for clients
Proprietary software differentiates offering by providing business intelligence and influencing user behavior
9
Managed Print Services
Source: InfoTrends

We archive and manage our customers documents and information on the cloud, provide secure mobile access with search capabilities for documents of any size and format, anywhere and anytime.
This service is the logical successor to our historical hardcopy storage services.
Opportunity to provide digital archive for massive historical volume of AEC documents relating to design and construction
High barrier to entry in the absence of decades of domain expertise and enterprise-level construction document management
Early signs of growth similar to MPS for AEC 10
Archiving & Information Management

We store, manage and distribute documents and information using proprietary cloud-based applications with mobile access, providing professional business services for project management.
This service is the logical successor to our historical reprographics business.
Drives collaboration, standardization and integration of construction information through entire project lifecycle
Centralizes project information by making it readily available to maximize productivity and efficiency
Builds on existing domain expertise and cloud computing infrastructure
11
Construction Document & Information Management

12
Addressable Market: Larger Base, Increased Opportunities
MPS, AIM and CDIM create a new addressable market four times the size
of ARC’s original reprographics market
Opportunity lies in capturing the entirety of our customers’ AEC documents and information, offering us additional revenue opportunities, pricing leverage and partnerships

13
What makes us so confident ?
MPS is largest and fastest growing revenue line, providing recurring, contracted and predictable sales
• Gartner declared ARC 9th Largest MPS Provider Worldwide
• Only service provider among multi-billion equipment manufacturers
• We have had tremendous success in the AEC vertical competing with multi-billion dollar manufacturers
MPS

14
What makes us so confident ?
AIM gathering momentum, further strengthened by ARC’s continuing technology investment – positive feedback from the market
• ARC is the only company who can offer cloud-based, enterprise-level, archival and retrieval software for construction document management or Facilities Management
• Maintaining “first-mover” advantage with search inside large-format blueprints as well as text documents
• Increasing need to liberate IP from boxes and make it useful
• Customer behavior is changing in our favor
AIM

15
What makes us so confident ?
CDIM is the successor to reprographics and we are deploying our domain expertise in facilitating document management and distribution
• Plays to our strength and experience
• Applications and hardware integrated into our offerings
• Current and forthcoming technology allowing ARC to dominate this space as we did the reprographics business
CDIM

16
New services to support professional services within AEC sector
• Building Information Modeling
• SaaS Applications e.g., Skysite
• ARC software integration with equipment makers
• OEM hardware for digital consumption of data, e.g. SmartScreen
• Hyperlinking documents and drawing sets
• Digital shipping via ishipdocs
• Scan with search capabilities
H Y P E R L I N K I N G
Revenue model continues to expand with growth in our services

Addressable market is four times greater than historical reprographics market
Revenue grows from growth in MPS and stabilizing non-res construction
Gross Margins grow by leveraging fixed costs against revenue growth, restructuring, and targeted margin improvement exercises
EBITDA grows from sales and gross margin improvements
Cash Flows grow from deleveraging senior debt and NOL's
Adjusted EBITDA margin1
13.1%
16.3%
14.9%
17.2%
15.9% 15.7%
17.5%
19.1%
16.60%
18.3%
10.0%
12.0%
14.0%
16.0%
18.0%
20.0%
Q3'12
Q3'13
Q4'12
Q4'13
Q1'13
Q1'14
Q2'13
Q2'14
Q3'13
Q3'14
1 Margin based off of consolidated EBITDA
$106 $105
$99 $101
$97
$101 $100 $100
$105
$109
$90
$95
$100
$105
$110
Q2'12
Q2'13
Q3'12
Q3'13
Q4'12
Q4'13
Q1'13
Q1'14
Q2'13
Q2'14
29.4%
32.5%
29.6%
33.0% 32.4% 33.8% 34.0%
36.0%
32.5% 33.9%
24.0%
28.0%
32.0%
36.0%
Q3'12
Q3'13
Q4'12
Q4'13
Q1'13
Q1'14
Q2'13
Q2'14
Q3'13
Q3'14
Revenue ($mm) Gross Margin
Financial Leverage

18
Organic quarterly revenue grew 5.5% yoy; fifth sequential quarter of yoy growth
Gross margin increased 140 bps yoy
Adj. EBITDA margin increased 70 bps
Q3 2014 Performance Update Three Months Ended Nine Months Ended
September 30, September 30,
(All dollar amounts in millions, except EPS) 2014 2013 2014 2013
Net Revenue $ 106.8 $ 101.3 $ 316.2 $ 305.9
Gross Margin 33.9 % 32.5 % 34.6 % 33.0 %
Net income (loss) attributable to ARC $ 3.7 $ (0.5 ) $ 9.6 $ 0.7
Adjusted Net Income attributable to ARC $ 2.9 $ 0.8 $ 9.2 $ 3.0
Earnings (loss) per share - Diluted $ 0.08 $ (0.01 ) $ 0.20 $ 0.01
Adjusted earnings per share - Diluted $ 0.06 $ 0.02 $ 0.20 $ 0.07
Adjusted EBITDA $ 18.3 $ 16.6 $ 55.2 $ 50.8
Cash provided by operating activities $ 15.3 $ 20.0 $ 37.0 $ 40.0
Capital Expenditures $ 3.4 $ 4.8 $ 10.0 $ 14.9
Debt & Capital Leases (including current) $ 205.6 $ 213.4
Paid down principle debt by $23.5mm year-to-date; more than 10% reduction with 10 month’s of cash flow
Refinanced Senior Debt with at 2.5% with Term A to further improve capital structure

19
1.) Margin Expansion
2.) Deleveraging
4.) Transformation
2012 2013 2014 2015-forward
3.) Revenue Growth
Restructuring/Repositioning Revenue Growth
Refinance
Organic Market Recovery
Evolving Industry Cloud for AEC Industry
Repay Term B… Term A…
Four stock value drivers

ARC has transformed to new and growing business with a bigger addressable market, and a better value proposition for the future
Management team of experienced, entrepreneurial industry veterans sensitive to future needs
Better growth, margins and cash potential in the future
Stock is undervalued given we are at the beginning of a non-res recovery cycle, and there is a lack of awareness of ARC’s transformation
2014 performance is clear evidence of the ARC’s direction and performance capabilities
Investment Opportunity

2014 Annual Guidance
Earnings Per Share: $0.24 - $0.27
Cash from Operations: $52mm - $54mm
EBITDA: $71mm - $74mm
2013 Key Metrics (in millions unless noted)
Revenue: $407.2
Gross Margin: 33.0%
EPS: $0.09
EBITDA: $68.2
CF from Ops: $46.8
CapEx: $18.2
Shares O/S: 46,000,000