Embed Size (px)
Citation preview

©2013 YUME. ALL RIGHTS RESERVED. 1
YuMe. Digital Video Audience Platform. March 2015.
FORWARD-LOOKING STATEMENTS
This presentation contains forward-looking statements. All statements other than statements of historical fact contained in this presentation are forward-looking statements. These statements are only current predictions and are subject to known and unknown risks, uncertainties, assumptions, and other factors that may cause our results or our industry’s actual results, levels of activity, performance or achievements to be materially different from those anticipated by the forward-looking statements. These forward-looking statements are subject to a number of risks, including those described under the heading “Risk Factors” in our periodic reports filed with the U.S. Securities and Exchange Commission, including our annual report on Form 10-K for the year ended December 31, 2014 and our quarterly report on Form 10-Q for the quarter ended September 31, 2014, and in our future filings and reports with the SEC. Moreover, new risks emerge periodically. It is not possible for us to predict all risks, nor can we assess the impact of all factors on our business or the extent to which any factor, or combination of factors, may cause actual results to differ materially from those contained in any forward-looking statements we may make. Actual results could differ materially and adversely from those anticipated or implied in the forward-looking statements. You should not rely upon forward-looking statements as predictions of future events. Except as required by law, we are under no duty to update or revise any of the forward-looking statements, whether as a results of new information, future events or otherwise, after the date of this presentation.
In addition to the U.S. GAAP financials, this presentation includes certain non-GAAP financial measures. These non-GAAP financial measures are in addition to, and not a substitute for or superior to measures of financial performance prepared in accordance with U.S. GAAP. See reconciliations between each non-GAAP measure and the most comparable GAAP measure contained in our prior reports filed with or furnished to the SEC. This presentation also contains statistical data that we obtained from industry publications and reports generated by third parties. Although we believe that the publications and reports are reliable, we have not independently verified this statistical data.
©2015 YUME. ALL RIGHTS RESERVED. 2
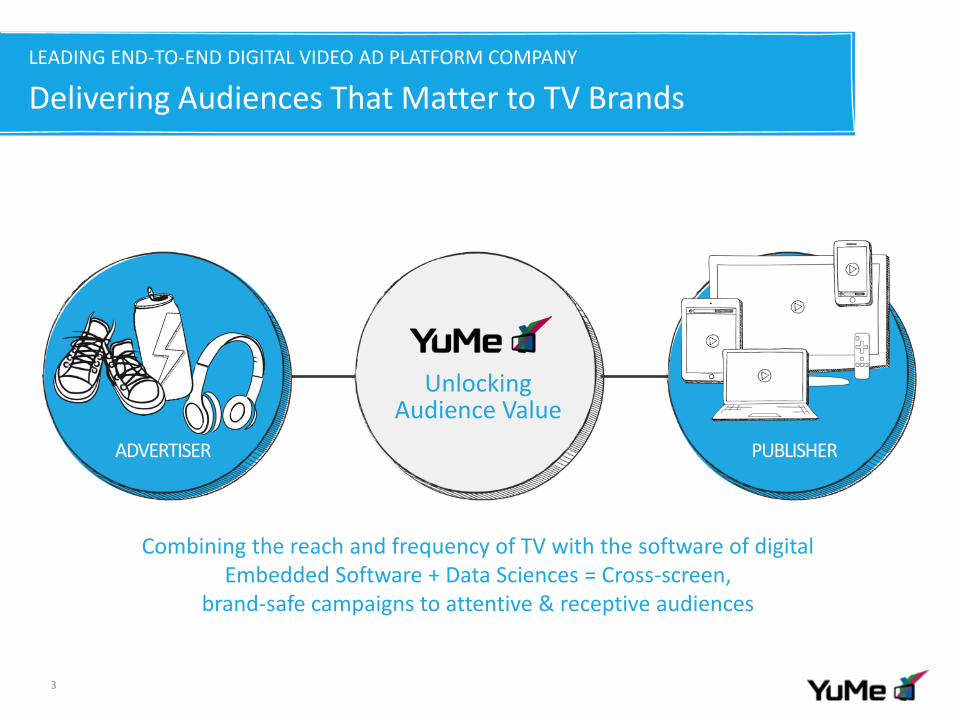
LEADING END-TO-END DIGITAL VIDEO AD PLATFORM COMPANY
Delivering Audiences That Matter to TV Brands
3
Unlocking Audience Value
Combining the reach and frequency of TV with the software of digital Embedded Software + Data Sciences = Cross-screen,
brand-safe campaigns to attentive & receptive audiences
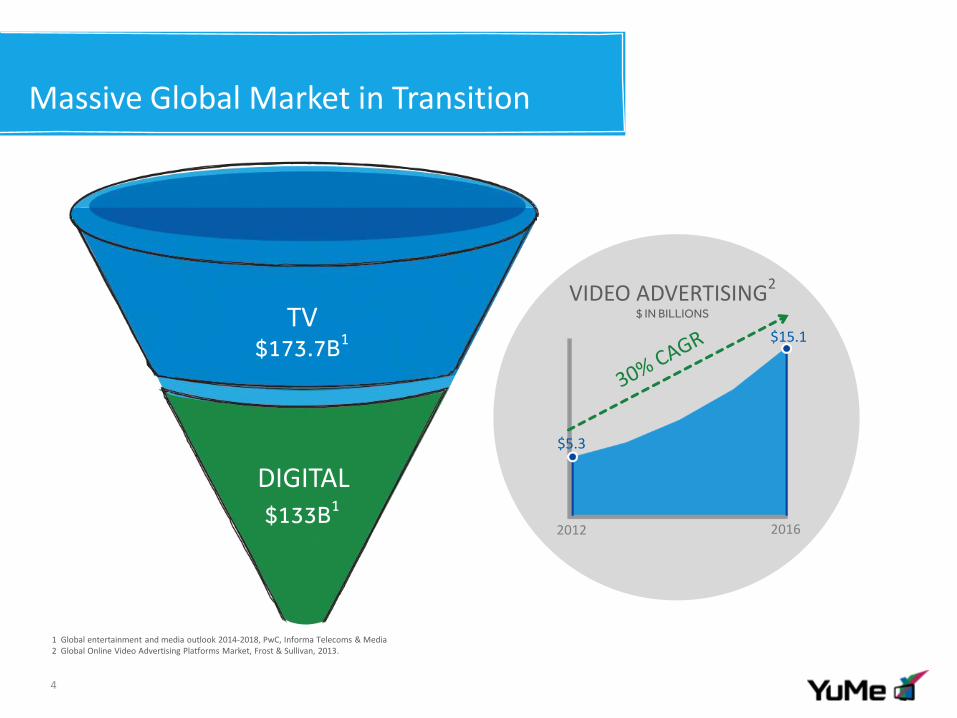
Massive Global Market in Transition
4
2012 2016
$15.1
VIDEO ADVERTISING
2
$ IN BILLIONS
$5.3
1 Global entertainment and media outlook 2014-2018, PwC, Informa Telecoms & Media 2 Global Online Video Advertising Platforms Market, Frost & Sullivan, 2013.
TV $173.7B
1
$133B1
DIGITAL
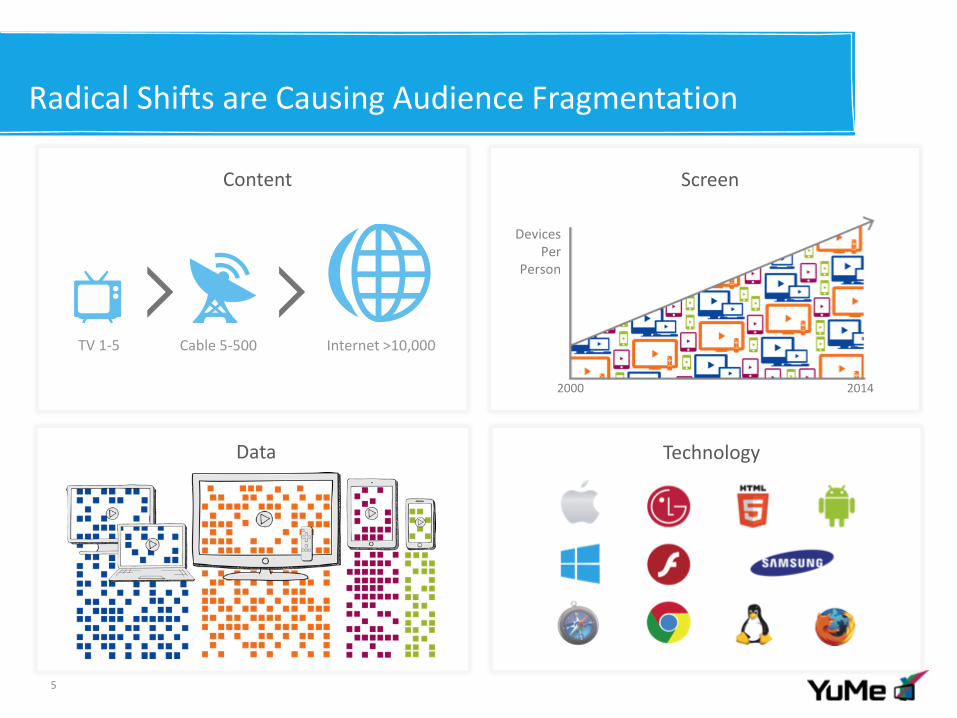
Content
TV 1-5 Cable 5-500 Internet >10,000
Technology
Radical Shifts are Causing Audience Fragmentation
5
Screen
Devices Per
Person
2000 2014
Data
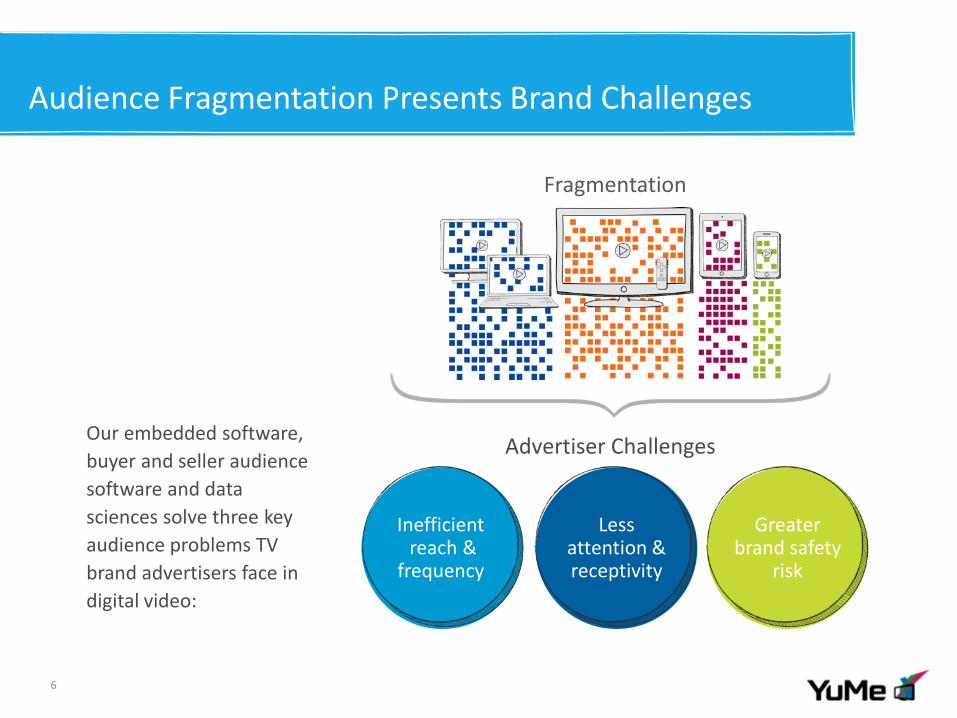
Audience Fragmentation Presents Brand Challenges
6
Advertiser Challenges
Greater brand safety
risk
Inefficient reach &
frequency
Less attention & receptivity
Fragmentation
Our embedded software,
buyer and seller audience
software and data
sciences solve three key
audience problems TV
brand advertisers face in
digital video:
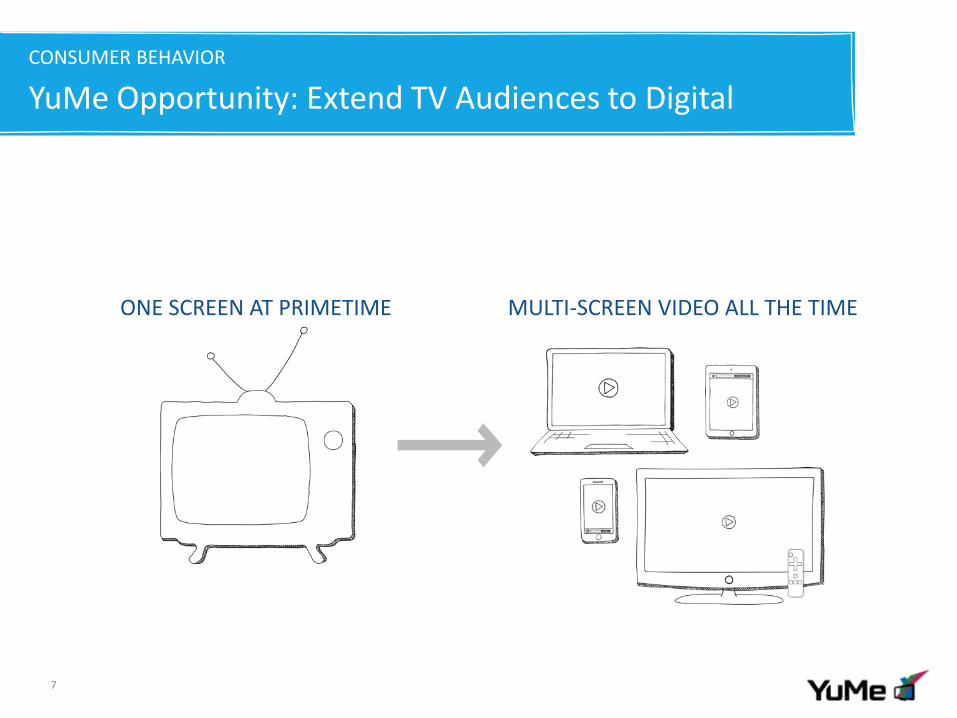
CONSUMER BEHAVIOR
YuMe Opportunity: Extend TV Audiences to Digital
7
ONE SCREEN AT PRIMETIME MULTI-SCREEN VIDEO ALL THE TIME
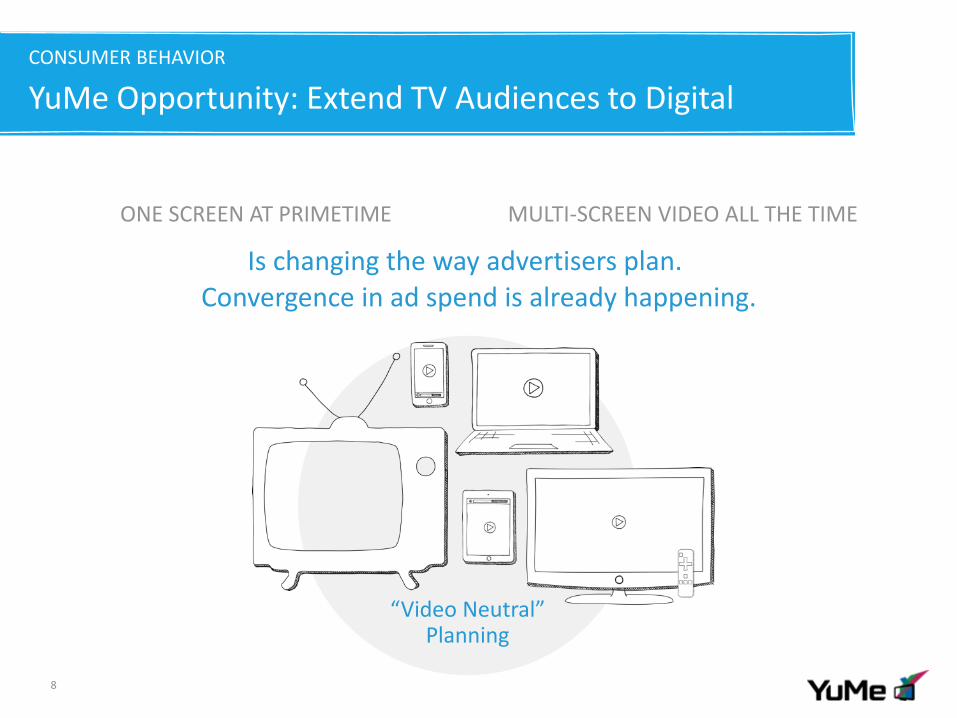
CONSUMER BEHAVIOR
YuMe Opportunity: Extend TV Audiences to Digital
8
ONE SCREEN AT PRIMETIME MULTI-SCREEN VIDEO ALL THE TIME
Is changing the way advertisers plan. Convergence in ad spend is already happening.
“Video Neutral” Planning
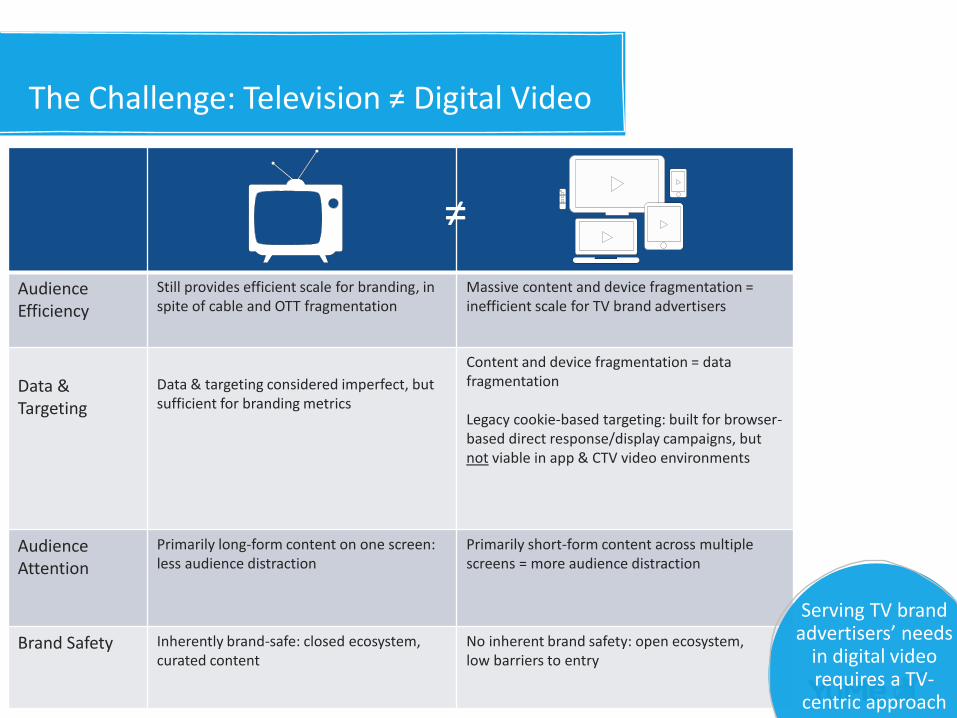
The Challenge: Television ≠ Digital Video
Audience Efficiency
Still provides efficient scale for branding, in spite of cable and OTT fragmentation
Massive content and device fragmentation = inefficient scale for TV brand advertisers
Data & Targeting
Data & targeting considered imperfect, but sufficient for branding metrics
Content and device fragmentation = data fragmentation Legacy cookie-based targeting: built for browser-based direct response/display campaigns, but not viable in app & CTV video environments
Audience Attention
Primarily long-form content on one screen: less audience distraction
Primarily short-form content across multiple screens = more audience distraction
Brand Safety Inherently brand-safe: closed ecosystem, curated content
No inherent brand safety: open ecosystem, low barriers to entry
≠
Serving TV brand advertisers’ needs
in digital video requires a TV-
centric approach
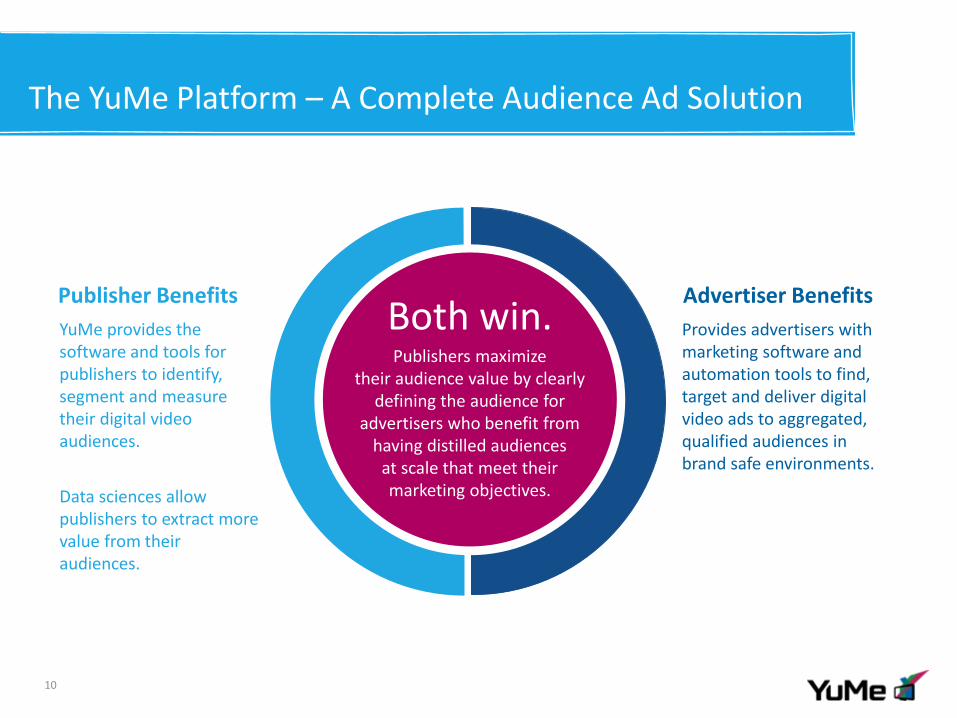
The YuMe Platform – A Complete Audience Ad Solution
10
Publisher Benefits Advertiser Benefits
Provides advertisers with marketing software and automation tools to find, target and deliver digital video ads to aggregated, qualified audiences in brand safe environments.
YuMe provides the software and tools for publishers to identify, segment and measure their digital video audiences.
Data sciences allow publishers to extract more value from their audiences.
Both win. Publishers maximize
their audience value by clearly defining the audience for
advertisers who benefit from having distilled audiences
at scale that meet their marketing objectives.
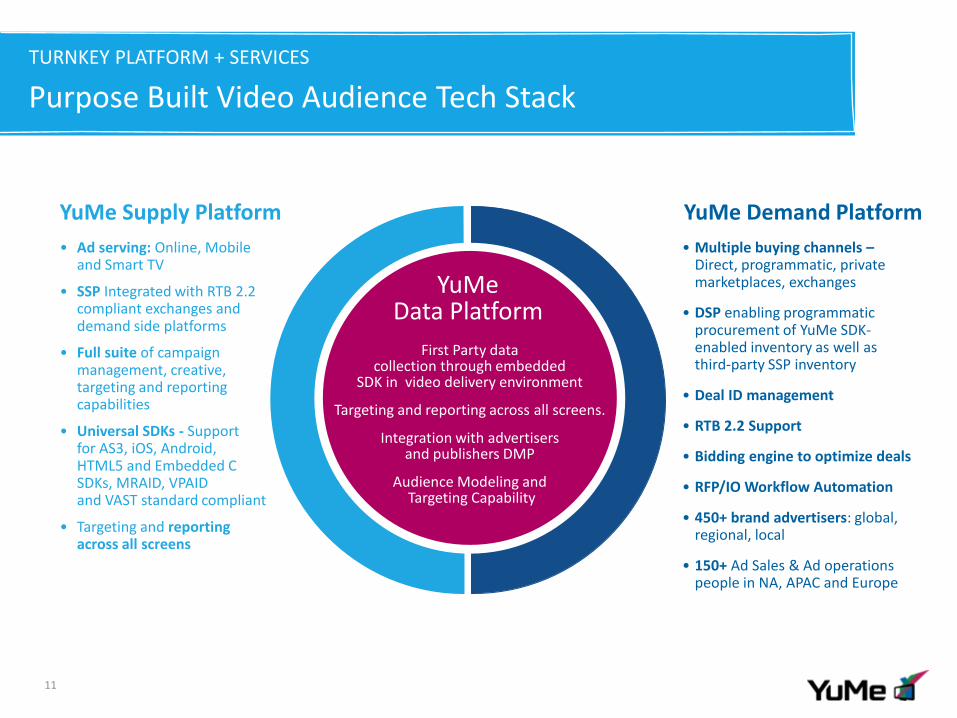
Purpose Built Video Audience Tech Stack
11
YuMe Supply Platform
YuMe Demand Platform
• Multiple buying channels – Direct, programmatic, private marketplaces, exchanges
• DSP enabling programmatic procurement of YuMe SDK-enabled inventory as well as third-party SSP inventory
• Deal ID management
• RTB 2.2 Support
• Bidding engine to optimize deals
• RFP/IO Workflow Automation
• 450+ brand advertisers: global, regional, local
• 150+ Ad Sales & Ad operations people in NA, APAC and Europe
• Ad serving: Online, Mobile and Smart TV
• SSP Integrated with RTB 2.2 compliant exchanges and demand side platforms
• Full suite of campaign management, creative, targeting and reporting capabilities
• Universal SDKs - Support for AS3, iOS, Android, HTML5 and Embedded C SDKs, MRAID, VPAID and VAST standard compliant
• Targeting and reporting across all screens
YuMe
Data Platform
First Party data collection through embedded
SDK in video delivery environment
Targeting and reporting across all screens.
Integration with advertisers and publishers DMP
Audience Modeling and Targeting Capability
TURNKEY PLATFORM + SERVICES
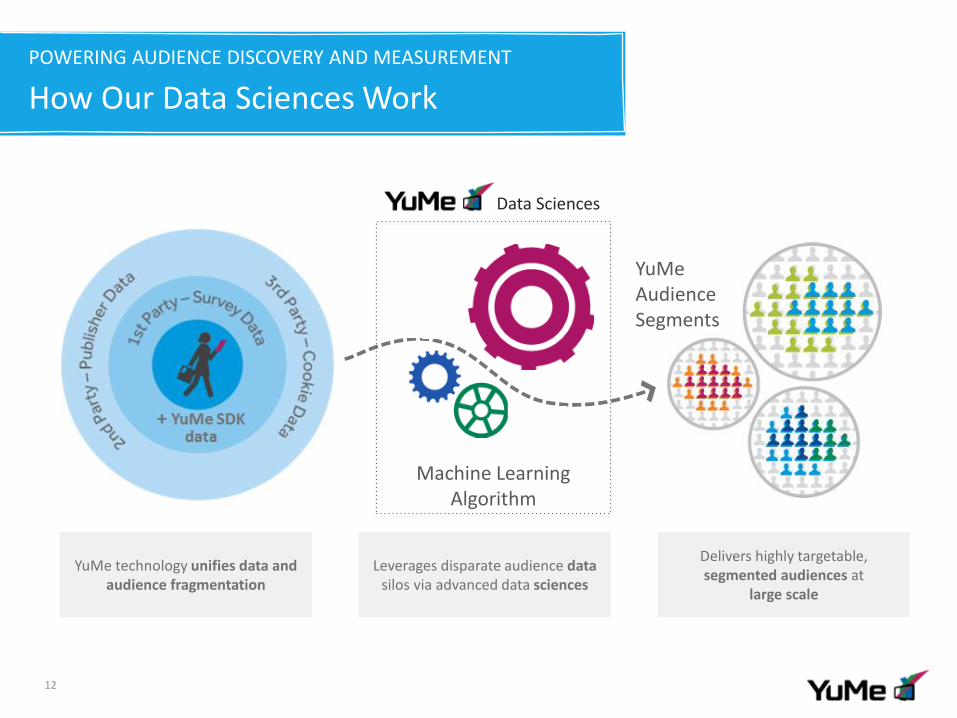
POWERING AUDIENCE DISCOVERY AND MEASUREMENT
How Our Data Sciences Work
12
YuMe technology unifies data and audience fragmentation
Machine Learning Algorithm
Data Sciences
Leverages disparate audience data silos via advanced data sciences
YuMe Audience Segments
Delivers highly targetable, segmented audiences at
large scale
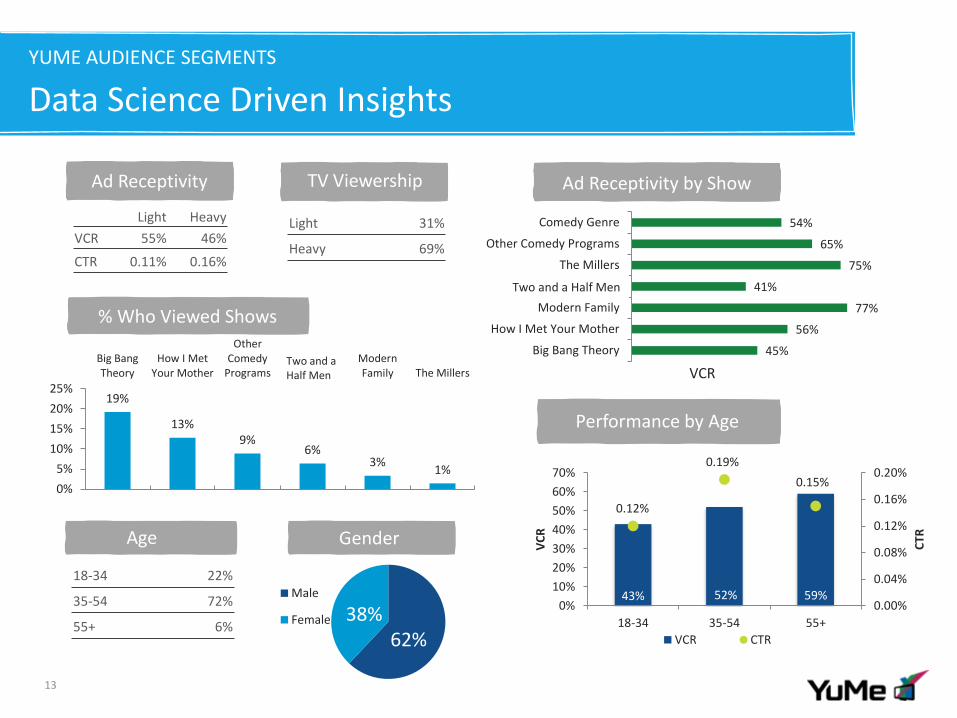
YUME AUDIENCE SEGMENTS
Data Science Driven Insights
13
18-34 22%
35-54 72%
55+ 6%
Gender Age
Light 31%
Heavy 69%
Light Heavy
VCR 55% 46%
CTR 0.11% 0.16%
Performance by Age
TV Viewership Ad Receptivity Ad Receptivity by Show
VCR
43% 52% 59%
0.12%
0.19%
0.15%
0.00%
0.04%
0.08%
0.12%
0.16%
0.20%
0%
10%
20%
30%
40%
50%
60%
70%
18-34 35-54 55+
CTR
VC
R
VCR CTR
45%
56%
77%
41%
75%
65%
54%
Big Bang Theory
How I Met Your Mother
Modern Family
Two and a Half Man
The Millers
Other Comedy Programs
Comedy Genre
% Who Viewed Shows
19%
13% 9%
6% 3%
1%
0%
5%
10%
15%
20%
25%
Big BangTheory
How I MetYour Mother
OtherComedy
ProgramsTwo and aHalf Man
ModernFamily The Millers
62% 38%
Male
Female
Two and a Half Men
Two and a Half Men
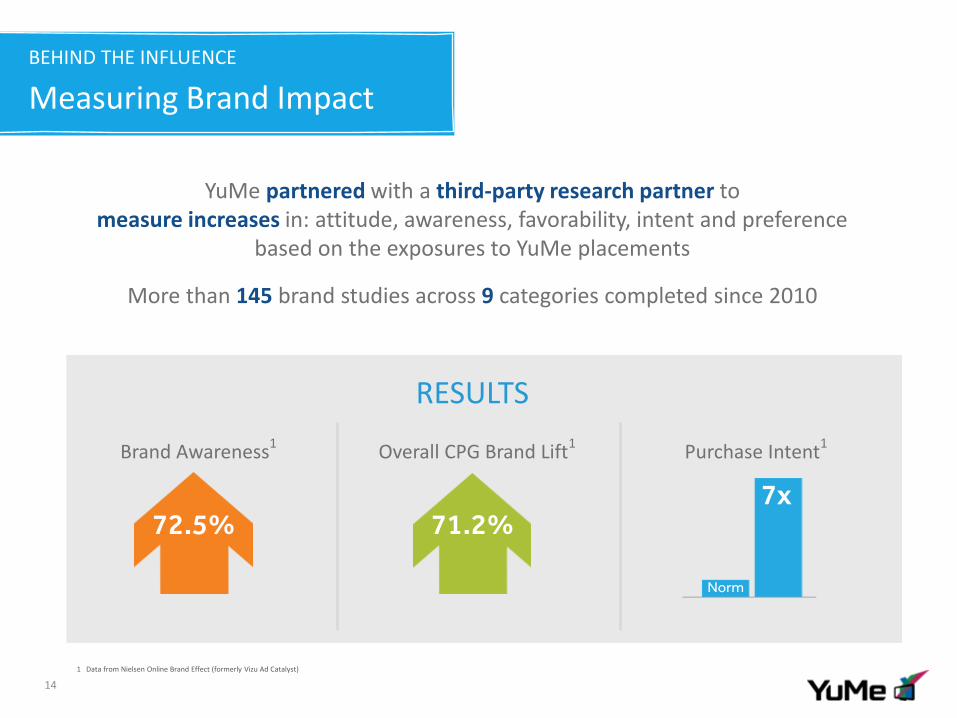
BEHIND THE INFLUENCE
Measuring Brand Impact
YuMe partnered with a third-party research partner to measure increases in: attitude, awareness, favorability, intent and preference
based on the exposures to YuMe placements
More than 145 brand studies across 9 categories completed since 2010
14
RESULTS
Brand Awareness1 Overall CPG Brand Lift
1 Purchase Intent
1
71.2% 72.5% 7x
Norm
1 Data from Nielsen Online Brand Effect (formerly Vizu Ad Catalyst)
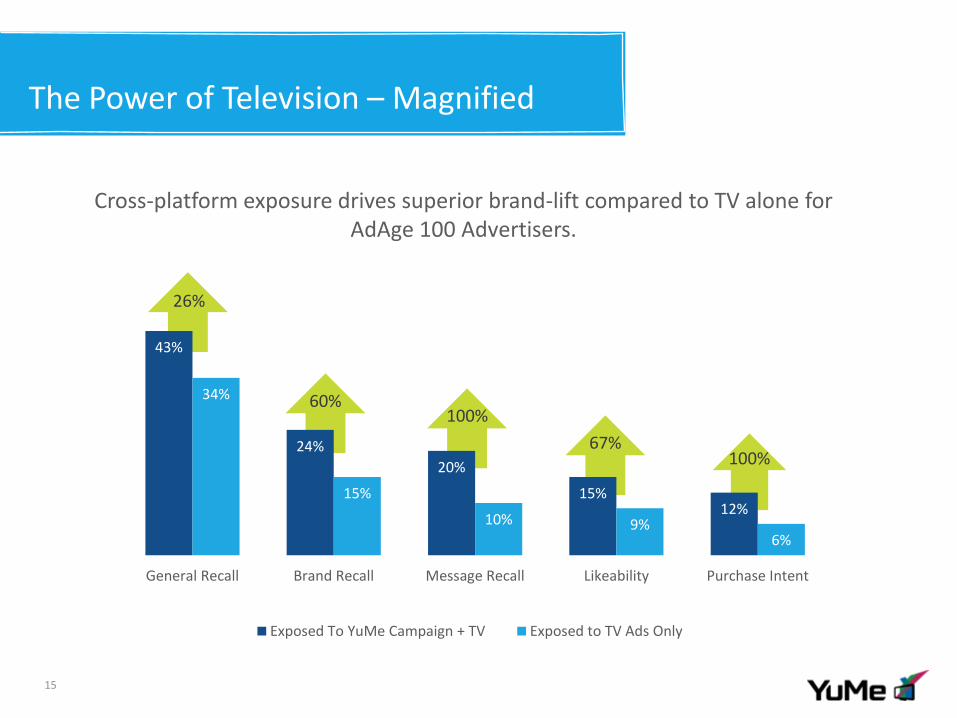
100%
100% 67%
60%
26%
The Power of Television – Magnified
Cross-platform exposure drives superior brand-lift compared to TV alone for AdAge 100 Advertisers.
15
43%
24%
20%
15% 12%
34%
15%
10% 9% 6%
General Recall Brand Recall Message Recall Likeability Purchase Intent
Exposed To YuMe Campaign + TV Exposed to TV Ads Only
Source: Nielsen TV Brand Effect, A21+ Norm data from January 1, 2011 – January 1, 2012 Data is limited to same brands on TV & Online: Data is based on viewers exposure to the brand in the prior 7 days. Data is limited to exposure to video ads only on non-full episode player sites. Purchase intent is top 2 box. Same brands include: Hornitos Premium Tequila, Jim Beam Bourbon, Kahlua Coffee Liqueur, Maker's Mark Bourbon, & Pucker Flavored Vodka )
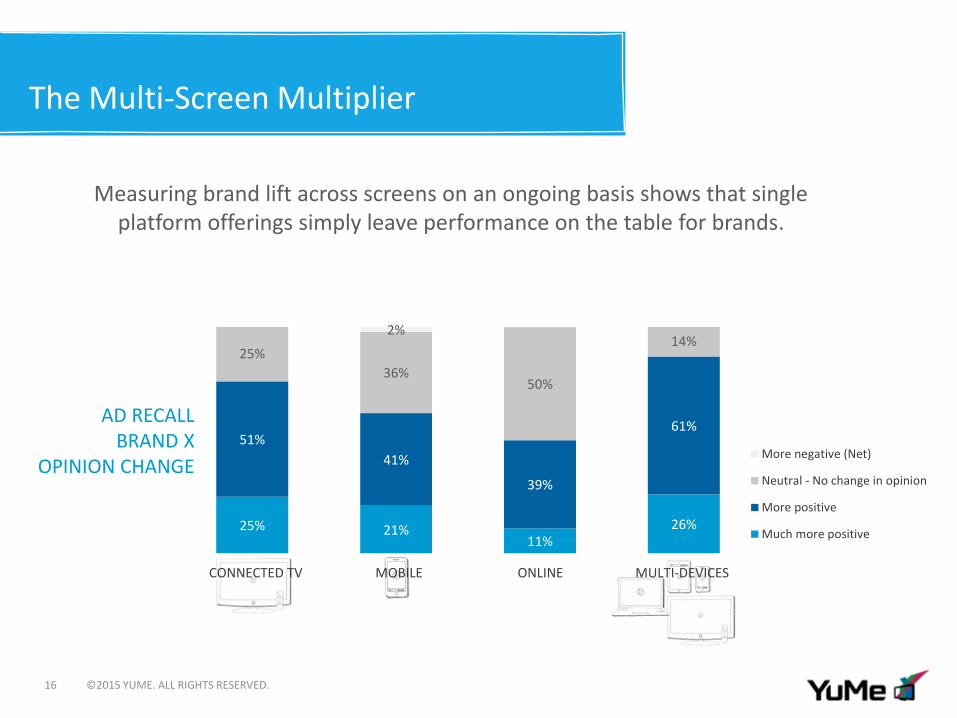
The Multi-Screen Multiplier
©2015 YUME. ALL RIGHTS RESERVED. 16
AD RECALL BRAND X
OPINION CHANGE
25% 21% 11%
26%
51%
41%
39%
61%
25%
36% 50%
14% 2%
More negative (Net)
Neutral - No change in opinion
More positive
Much more positive
CONNECTED TV MOBILE ONLINE MULTI-DEVICES
Measuring brand lift across screens on an ongoing basis shows that single platform offerings simply leave performance on the table for brands.
25% 21% 11%
26%
51%
41%
39%
61%
25%
36% 50%
14% 2%
More negative (Net)
Neutral - No change in opinion
More positive
Much more positive
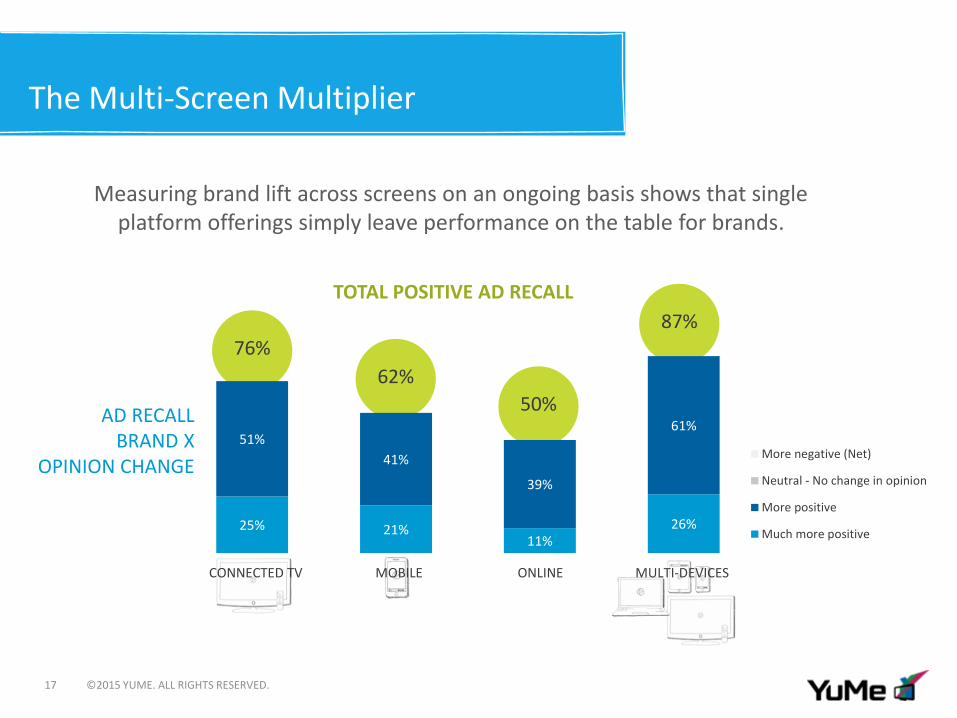
The Multi-Screen Multiplier
©2015 YUME. ALL RIGHTS RESERVED. 17
AD RECALL BRAND X
OPINION CHANGE
CONNECTED TV MOBILE ONLINE MULTI-DEVICES
Measuring brand lift across screens on an ongoing basis shows that single platform offerings simply leave performance on the table for brands.
76%
62%
50%
87%
25% 21% 11%
26%
51%
41%
39%
61%
TOTAL POSITIVE AD RECALL
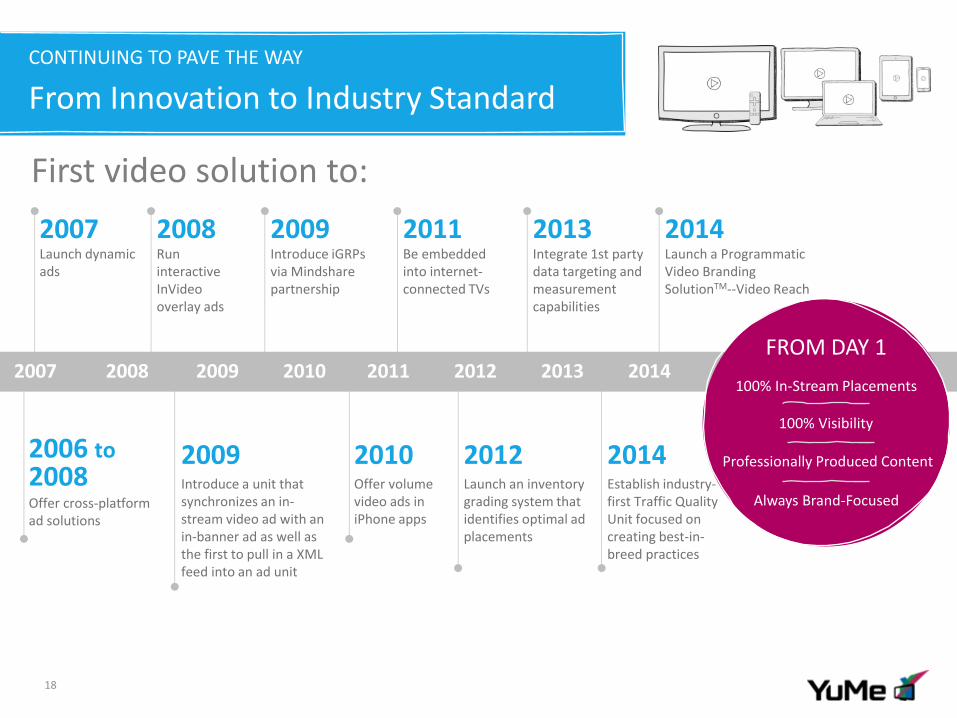
Launch an inventory grading system that identifies optimal ad placements
2012
CONTINUING TO PAVE THE WAY
From Innovation to Industry Standard
18
Offer cross-platform ad solutions
2006 to 2008 Introduce a unit that
synchronizes an in-stream video ad with an in-banner ad as well as the first to pull in a XML feed into an ad unit
2009
Launch dynamic ads
2007 Introduce iGRPs via Mindshare partnership
2009 Integrate 1st party data targeting and measurement capabilities
2013
First video solution to:
FROM DAY 1
100% In-Stream Placements
Professionally Produced Content
Always Brand-Focused
100% Visibility
Launch a Programmatic Video Branding SolutionTM--Video Reach
2014 Run interactive InVideo overlay ads
2008 Be embedded into internet-connected TVs
2011
Offer volume video ads in iPhone apps
2010 Establish industry-first Traffic Quality Unit focused on creating best-in-breed practices
2014
2008 2007 2009 2010 2013 2012 2011 2014
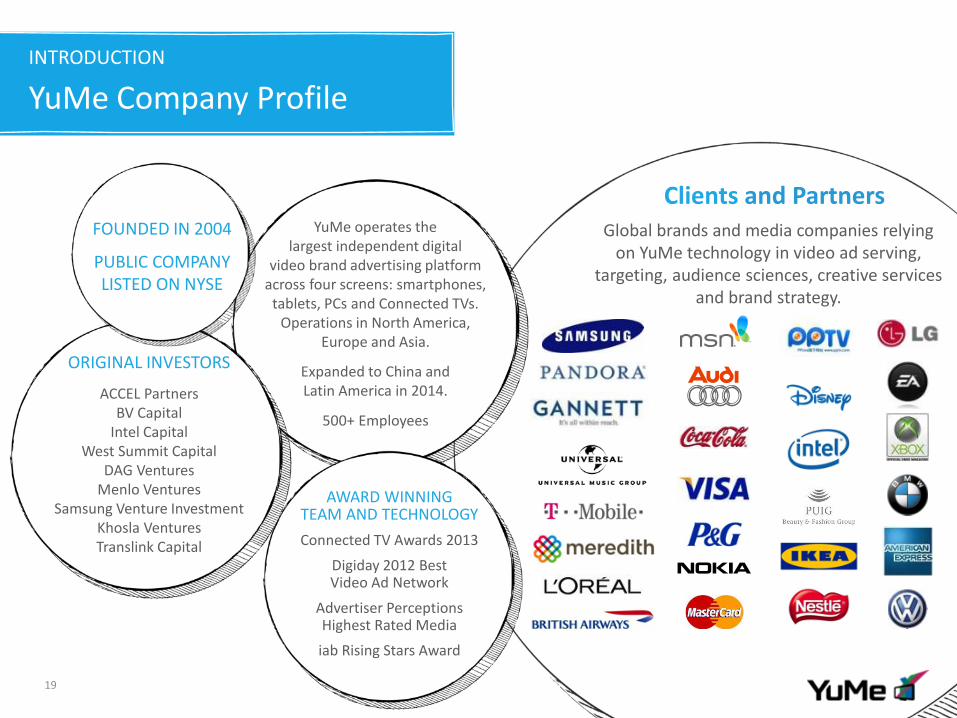
INTRODUCTION
YuMe Company Profile
19
Clients and Partners FOUNDED IN 2004
PUBLIC COMPANY LISTED ON NYSE
ORIGINAL INVESTORS
ACCEL Partners BV Capital
Intel Capital West Summit Capital
DAG Ventures Menlo Ventures
Samsung Venture Investment Khosla Ventures Translink Capital
YuMe operates the largest independent digital
video brand advertising platform across four screens: smartphones,
tablets, PCs and Connected TVs. Operations in North America,
Europe and Asia.
Expanded to China and Latin America in 2014.
500+ Employees
Global brands and media companies relying on YuMe technology in video ad serving,
targeting, audience sciences, creative services and brand strategy.
AWARD WINNING TEAM AND TECHNOLOGY
Connected TV Awards 2013
Digiday 2012 Best Video Ad Network
Advertiser Perceptions Highest Rated Media
iab Rising Stars Award
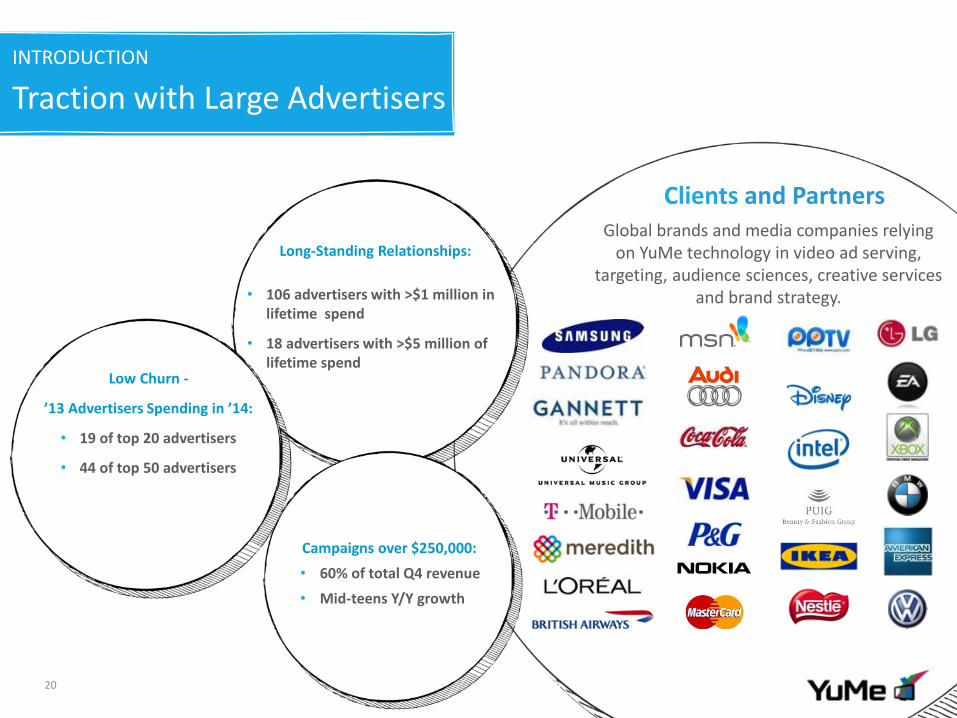
INTRODUCTION
Traction with Large Advertisers
20
Clients and Partners Global brands and media companies relying
on YuMe technology in video ad serving, targeting, audience sciences, creative services
and brand strategy.
Long-Standing Relationships:
• 106 advertisers with >$1 million in lifetime spend
• 18 advertisers with >$5 million of lifetime spend
Campaigns over $250,000:
• 60% of total Q4 revenue
• Mid-teens Y/Y growth
Low Churn -
’13 Advertisers Spending in ’14:
• 19 of top 20 advertisers
• 44 of top 50 advertisers
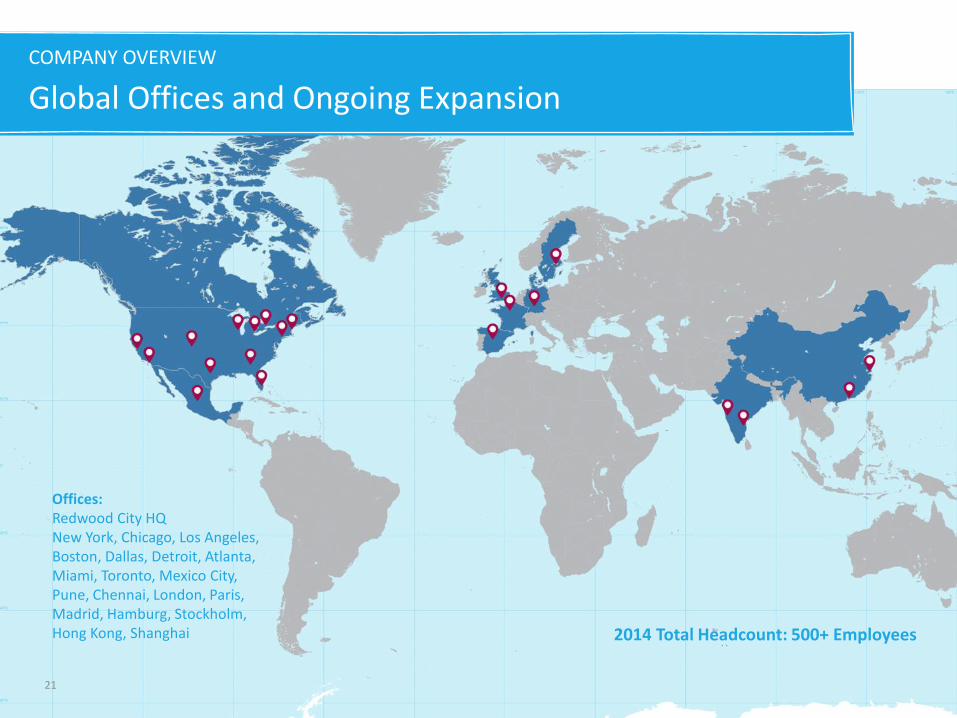
21
COMPANY OVERVIEW
Global Offices and Ongoing Expansion
2014 Total Headcount: 500+ Employees
Offices: Redwood City HQ New York, Chicago, Los Angeles, Boston, Dallas, Detroit, Atlanta, Miami, Toronto, Mexico City, Pune, Chennai, London, Paris, Madrid, Hamburg, Stockholm, Hong Kong, Shanghai
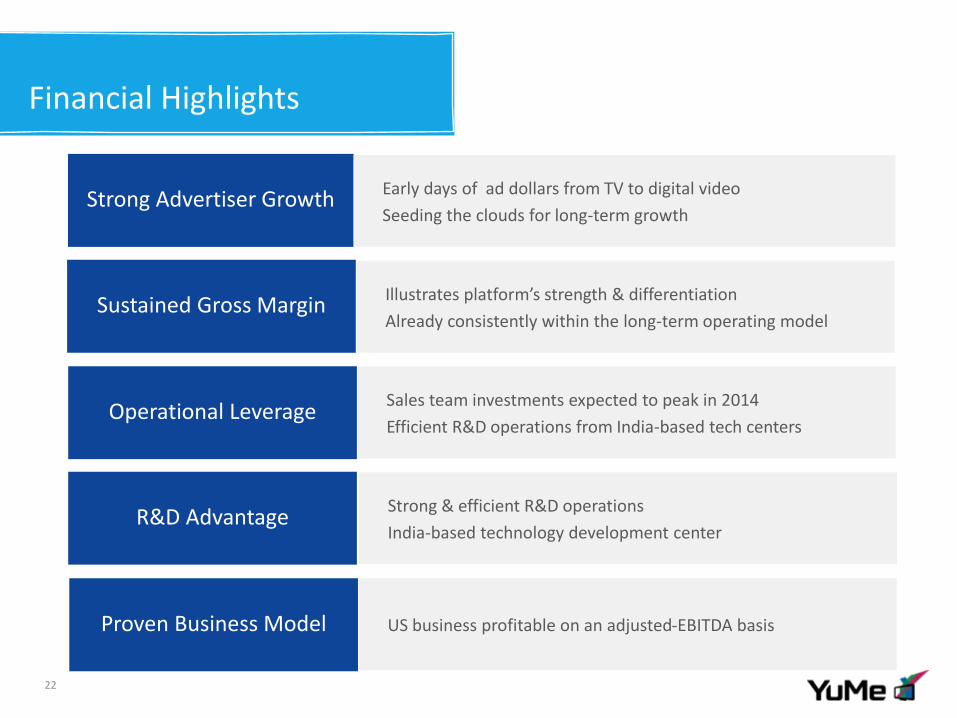
Financial Highlights
22
Proven Business Model US business profitable on an adjusted-EBITDA basis
Operational Leverage Sales team investments expected to peak in 2014
Efficient R&D operations from India-based tech centers
R&D Advantage Strong & efficient R&D operations
India-based technology development center
Sustained Gross Margin Illustrates platform’s strength & differentiation
Already consistently within the long-term operating model
Strong Advertiser Growth Early days of ad dollars from TV to digital video
Seeding the clouds for long-term growth
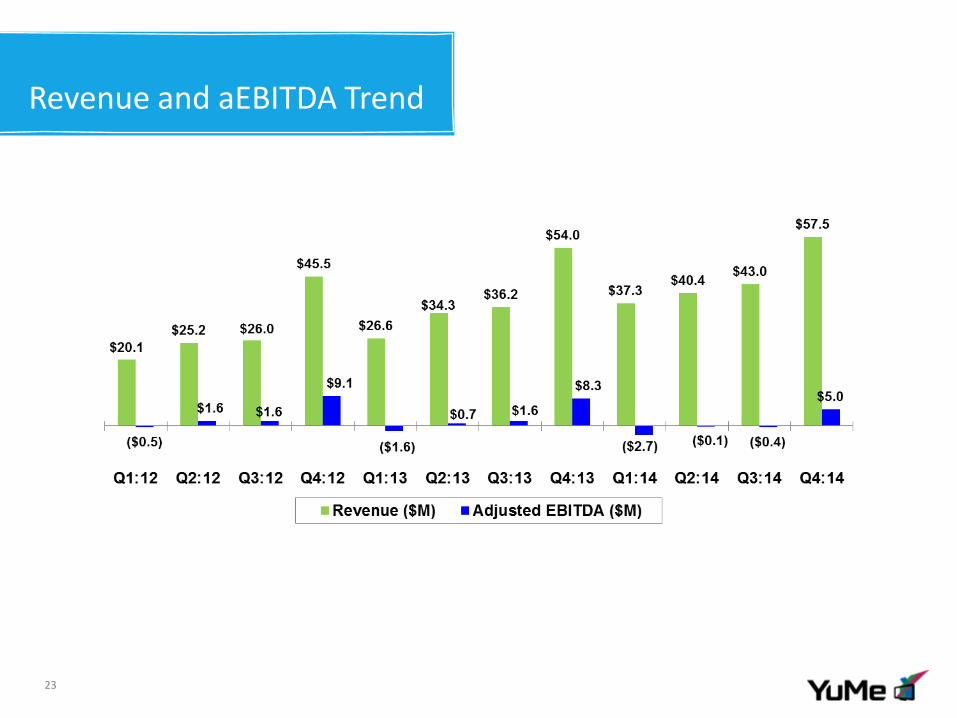
Revenue and aEBITDA Trend
23
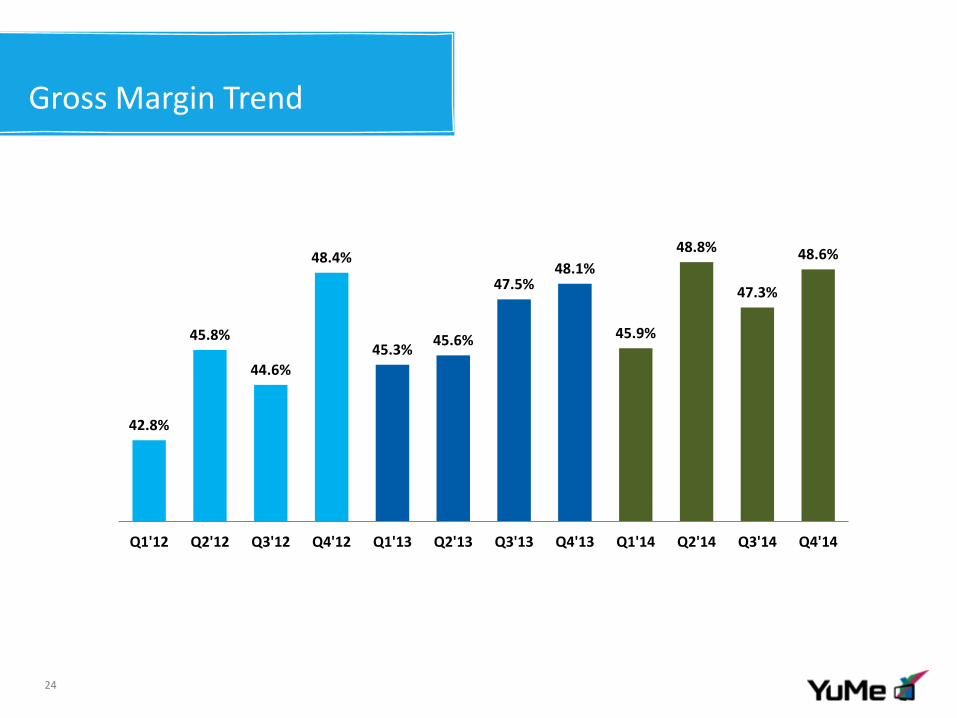
Gross Margin Trend
24
42.8%
45.8%
44.6%
48.4%
45.3% 45.6%
47.5% 48.1%
45.9%
48.8%
47.3%
48.6%
Q1'12 Q2'12 Q3'12 Q4'12 Q1'13 Q2'13 Q3'13 Q4'13 Q1'14 Q2'14 Q3'14 Q4'14
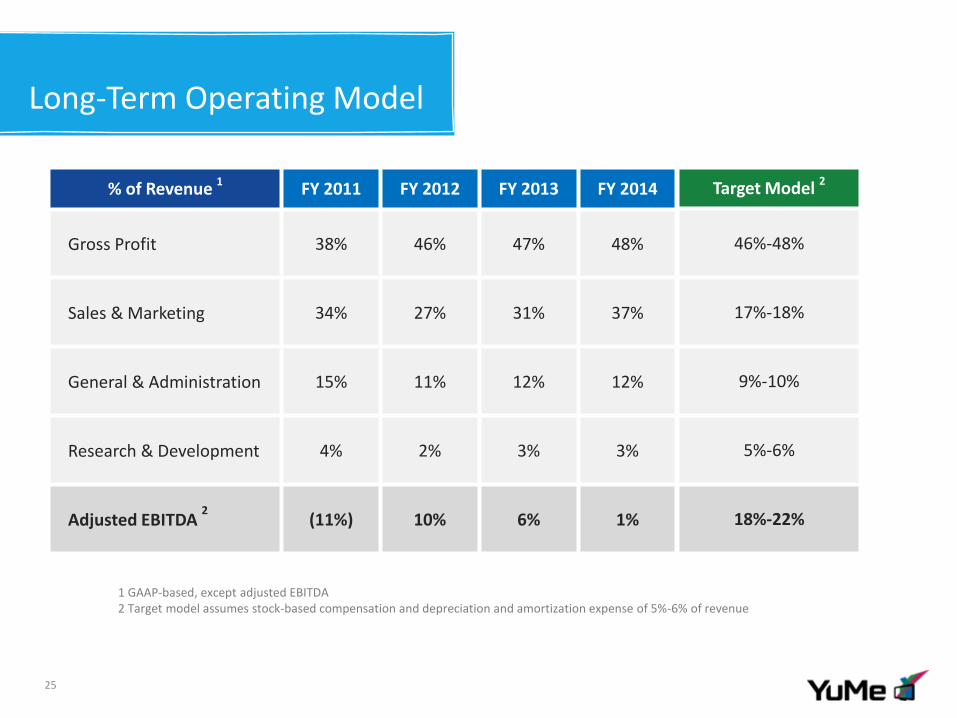
Long-Term Operating Model
25
Target Model 2
46%-48%
17%-18%
9%-10%
5%-6%
18%-22%
% of Revenue 1 FY 2011 FY 2012 FY 2013 FY 2014
Gross Profit 38% 46% 47% 48%
Sales & Marketing 34% 27% 31% 37%
General & Administration 15% 11% 12% 12%
Research & Development 4% 2% 3% 3%
Adjusted EBITDA 2
(11%) 10% 6% 1%
1 GAAP-based, except adjusted EBITDA 2 Target model assumes stock-based compensation and depreciation and amortization expense of 5%-6% of revenue

©2013 YUME. ALL RIGHTS RESERVED. 26
Thank you.