Embed Size (px)
Citation preview
W H I T E PA P E R O N S I L E N T S PA C E S
2ST800-104, Rev. 000 © Swisstom AG 2015
Swisstom BB2 Silent Spaces
Clinically Meaningful Electrical Impedance Tomography
Lung Function Parameters explained
Real-time tomographic images for organ function monitoring and diagnosis
electricalimpedancetomography
Introduction
2 Swisstom BB2 Silent Spaces 2ST800-104 Rev. 000
Introduction
In this document you will find background information on all Swisstom BB2 screens which
show the lung´s regional ventilation. Next to explanations of the dynamic images shown in the VentView we introduce each one of the lung function parameters which comprise Swisstom´s BB
2 LuFuView and explain the way they are calculated.
Lung function parameters explained
2ST800-104 Rev. 000 Swisstom BB2 Silent Spaces
3
1 Lung function parameters explained
1.1 VENTVIEW ........................................................................................................................... 4 1.1.1 PLETHYSMOGRAM.............................................................................................................. 4 1.1.2 VIEWING THE GLOBAL IMPEDANCE SIGNAL ........................................................................... 5 1.1.3 VENTVIEW TREND ............................................................................................................. 5 1.2 LUFUVIEW ........................................................................................................................... 6 1.2.1 RELATIVE TIDAL STRETCH................................................................................................... 6 1.2.2 RELATIVE TIDAL STRETCH CALCULATIONS ........................................................................... 7 1.2.3 RELATIVE TIDAL STRETCH TRENDVIEW ............................................................................... 8 1.2.4 SILENT SPACES ................................................................................................................. 9 1.2.5 SILENT SPACES CALCULATIONS ........................................................................................ 11 1.2.6 SILENT SPACE TRENDVIEW .............................................................................................. 12 1.6 BIBLIOGRAPHY ................................................................................................................... 14
Lung function parameters explained
4 Swisstom BB2 Silent Spaces 2ST800-104 Rev. 000
1.1 VentView
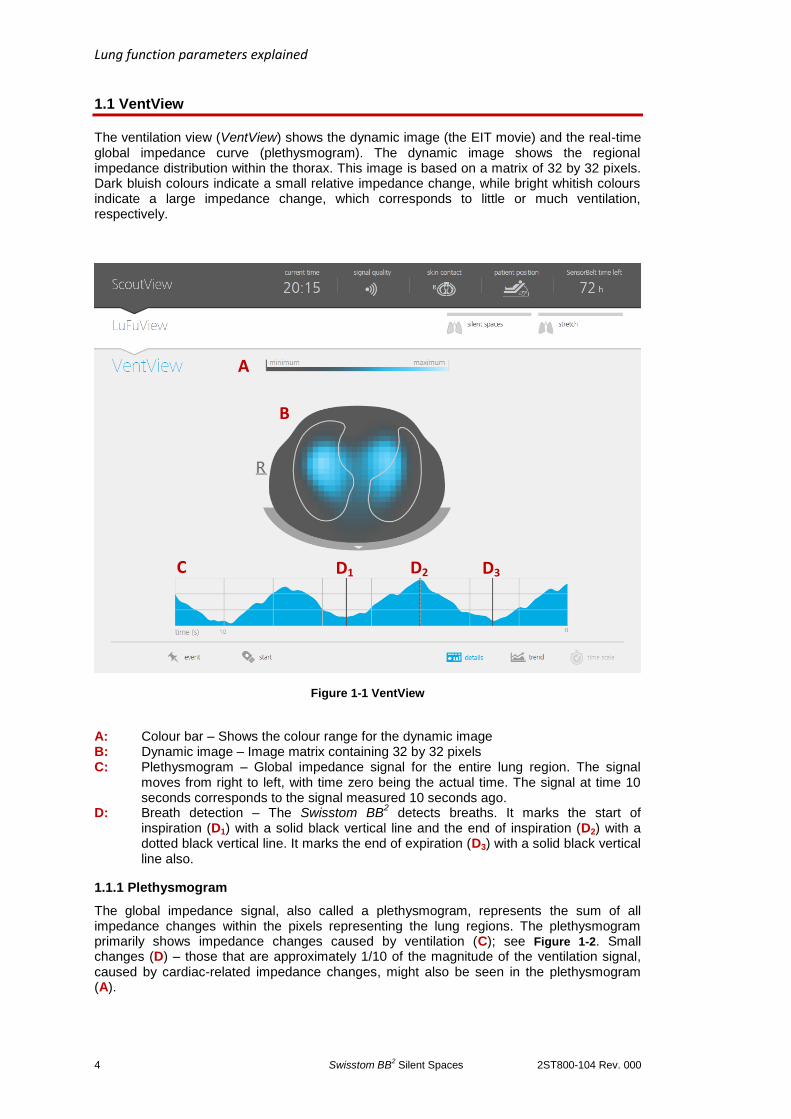
The ventilation view (VentView) shows the dynamic image (the EIT movie) and the real-time global impedance curve (plethysmogram). The dynamic image shows the regional impedance distribution within the thorax. This image is based on a matrix of 32 by 32 pixels. Dark bluish colours indicate a small relative impedance change, while bright whitish colours indicate a large impedance change, which corresponds to little or much ventilation, respectively.
Figure 1-1 VentView
A: Colour bar – Shows the colour range for the dynamic image B: Dynamic image – Image matrix containing 32 by 32 pixels C: Plethysmogram – Global impedance signal for the entire lung region. The signal
moves from right to left, with time zero being the actual time. The signal at time 10 seconds corresponds to the signal measured 10 seconds ago.
D: Breath detection – The Swisstom BB2 detects breaths. It marks the start of
inspiration (D1) with a solid black vertical line and the end of inspiration (D2) with a dotted black vertical line. It marks the end of expiration (D3) with a solid black vertical line also.
1.1.1 Plethysmogram
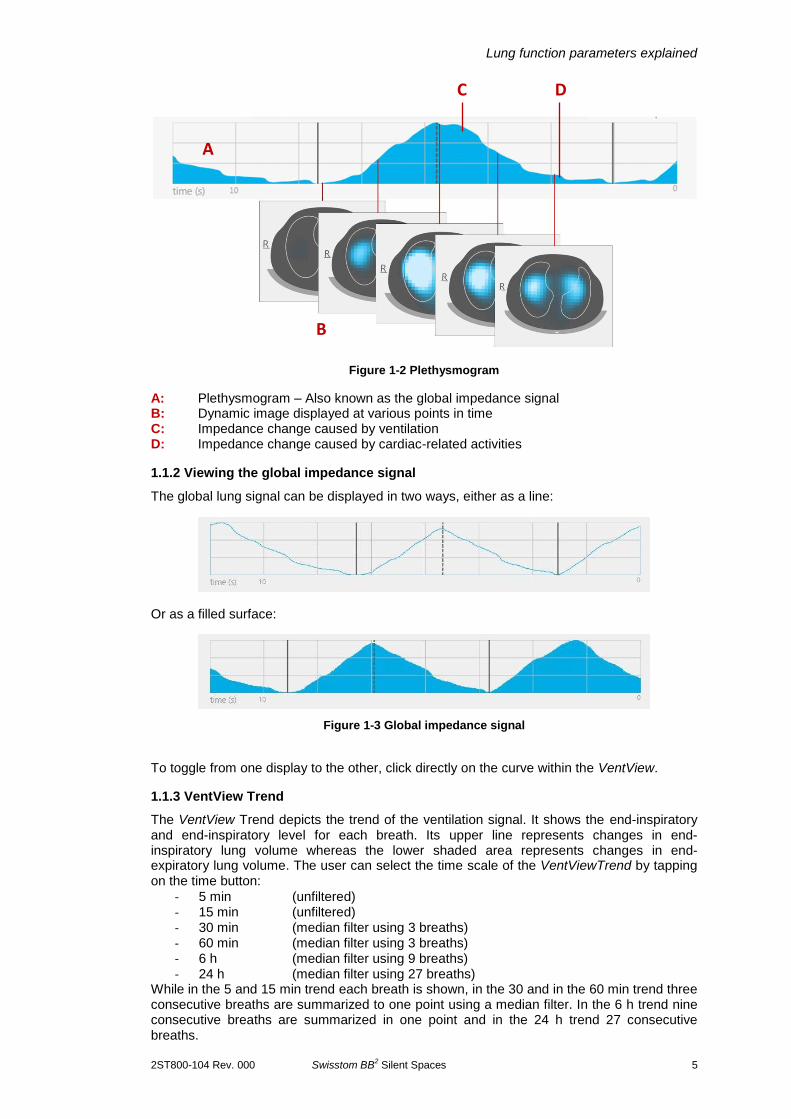
The global impedance signal, also called a plethysmogram, represents the sum of all impedance changes within the pixels representing the lung regions. The plethysmogram primarily shows impedance changes caused by ventilation (C); see Figure 1-2. Small changes (D) – those that are approximately 1/10 of the magnitude of the ventilation signal, caused by cardiac-related impedance changes, might also be seen in the plethysmogram (A).
B
A
C D1 D2 D3
Lung function parameters explained
2ST800-104 Rev. 000 Swisstom BB2 Silent Spaces
5
Figure 1-2 Plethysmogram
A: Plethysmogram – Also known as the global impedance signal B: Dynamic image displayed at various points in time C: Impedance change caused by ventilation D: Impedance change caused by cardiac-related activities
1.1.2 Viewing the global impedance signal
The global lung signal can be displayed in two ways, either as a line:
Or as a filled surface:
Figure 1-3 Global impedance signal
To toggle from one display to the other, click directly on the curve within the VentView.
1.1.3 VentView Trend
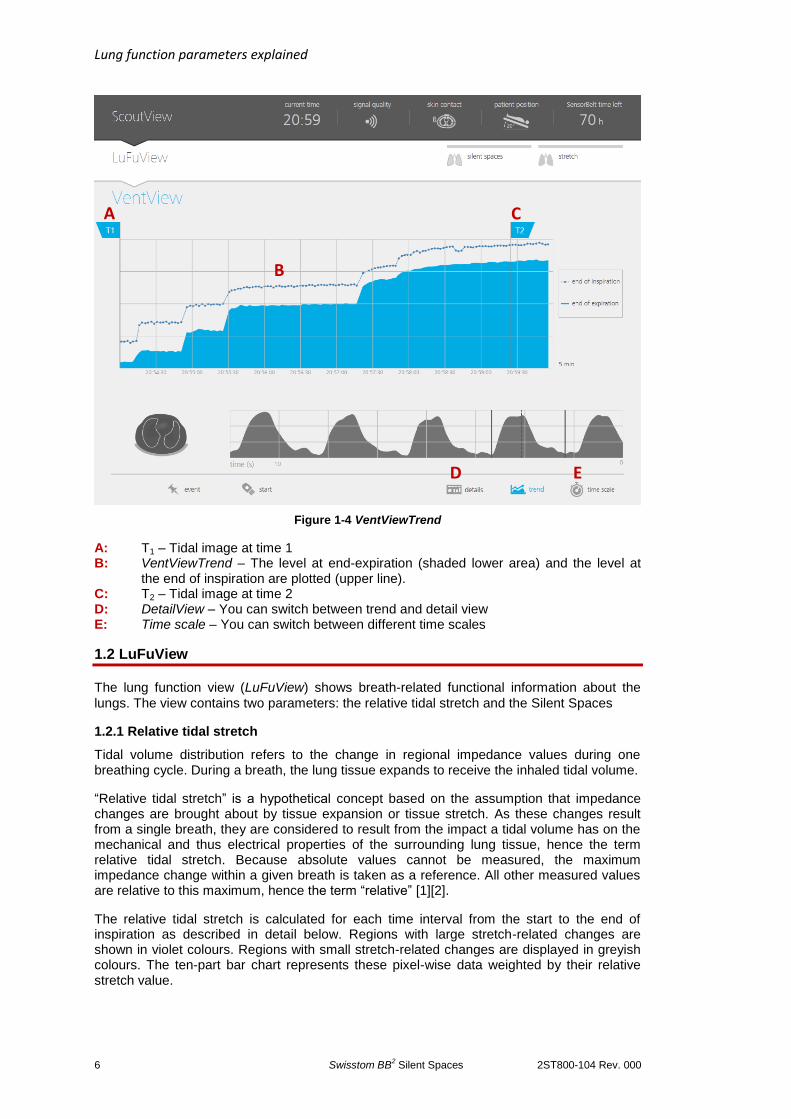
The VentView Trend depicts the trend of the ventilation signal. It shows the end-inspiratory and end-inspiratory level for each breath. Its upper line represents changes in end-inspiratory lung volume whereas the lower shaded area represents changes in end-expiratory lung volume. The user can select the time scale of the VentViewTrend by tapping on the time button:
- 5 min (unfiltered) - 15 min (unfiltered) - 30 min (median filter using 3 breaths) - 60 min (median filter using 3 breaths) - 6 h (median filter using 9 breaths) - 24 h (median filter using 27 breaths)
While in the 5 and 15 min trend each breath is shown, in the 30 and in the 60 min trend three consecutive breaths are summarized to one point using a median filter. In the 6 h trend nine consecutive breaths are summarized in one point and in the 24 h trend 27 consecutive breaths.
A
B
C D
Lung function parameters explained
6 Swisstom BB2 Silent Spaces 2ST800-104 Rev. 000
Figure 1-4 VentViewTrend
A: T1 – Tidal image at time 1 B: VentViewTrend – The level at end-expiration (shaded lower area) and the level at
the end of inspiration are plotted (upper line). C: T2 – Tidal image at time 2 D: DetailView – You can switch between trend and detail view E: Time scale – You can switch between different time scales
1.2 LuFuView
The lung function view (LuFuView) shows breath-related functional information about the
lungs. The view contains two parameters: the relative tidal stretch and the Silent Spaces
1.2.1 Relative tidal stretch
Tidal volume distribution refers to the change in regional impedance values during one breathing cycle. During a breath, the lung tissue expands to receive the inhaled tidal volume.
“Relative tidal stretch” is a hypothetical concept based on the assumption that impedance changes are brought about by tissue expansion or tissue stretch. As these changes result from a single breath, they are considered to result from the impact a tidal volume has on the mechanical and thus electrical properties of the surrounding lung tissue, hence the term relative tidal stretch. Because absolute values cannot be measured, the maximum impedance change within a given breath is taken as a reference. All other measured values are relative to this maximum, hence the term “relative” [1][2].
The relative tidal stretch is calculated for each time interval from the start to the end of inspiration as described in detail below. Regions with large stretch-related changes are shown in violet colours. Regions with small stretch-related changes are displayed in greyish colours. The ten-part bar chart represents these pixel-wise data weighted by their relative stretch value.
A C
B
D E
Lung function parameters explained
2ST800-104 Rev. 000 Swisstom BB2 Silent Spaces
7
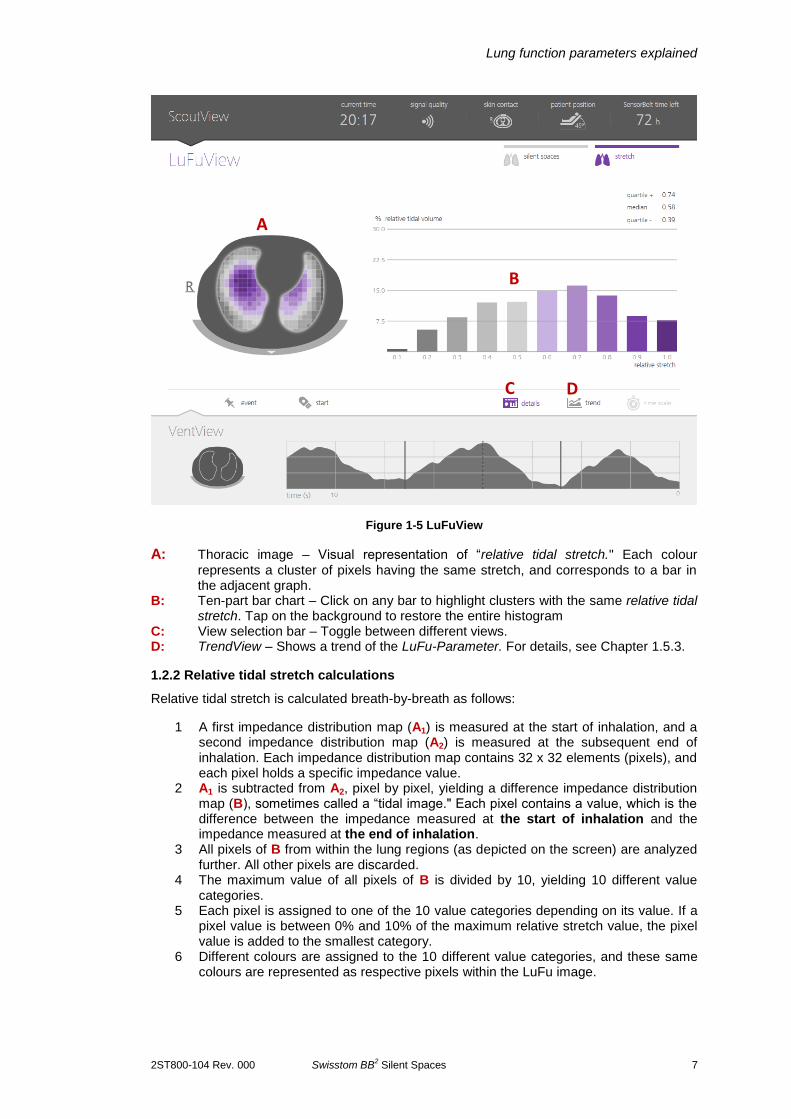
Figure 1-5 LuFuView
A: Thoracic image – Visual representation of “relative tidal stretch." Each colour
represents a cluster of pixels having the same stretch, and corresponds to a bar in the adjacent graph.
B: Ten-part bar chart – Click on any bar to highlight clusters with the same relative tidal stretch. Tap on the background to restore the entire histogram
C: View selection bar – Toggle between different views. D: TrendView – Shows a trend of the LuFu-Parameter. For details, see Chapter 1.5.3.
1.2.2 Relative tidal stretch calculations
Relative tidal stretch is calculated breath-by-breath as follows:
1 A first impedance distribution map (A1) is measured at the start of inhalation, and a second impedance distribution map (A2) is measured at the subsequent end of inhalation. Each impedance distribution map contains 32 x 32 elements (pixels), and each pixel holds a specific impedance value.
2 A1 is subtracted from A2, pixel by pixel, yielding a difference impedance distribution map (B), sometimes called a “tidal image." Each pixel contains a value, which is the difference between the impedance measured at the start of inhalation and the impedance measured at the end of inhalation.
3 All pixels of B from within the lung regions (as depicted on the screen) are analyzed further. All other pixels are discarded.
4 The maximum value of all pixels of B is divided by 10, yielding 10 different value categories.
5 Each pixel is assigned to one of the 10 value categories depending on its value. If a pixel value is between 0% and 10% of the maximum relative stretch value, the pixel value is added to the smallest category.
6 Different colours are assigned to the 10 different value categories, and these same colours are represented as respective pixels within the LuFu image.
A
B
C D
Lung function parameters explained
8 Swisstom BB2 Silent Spaces 2ST800-104 Rev. 000
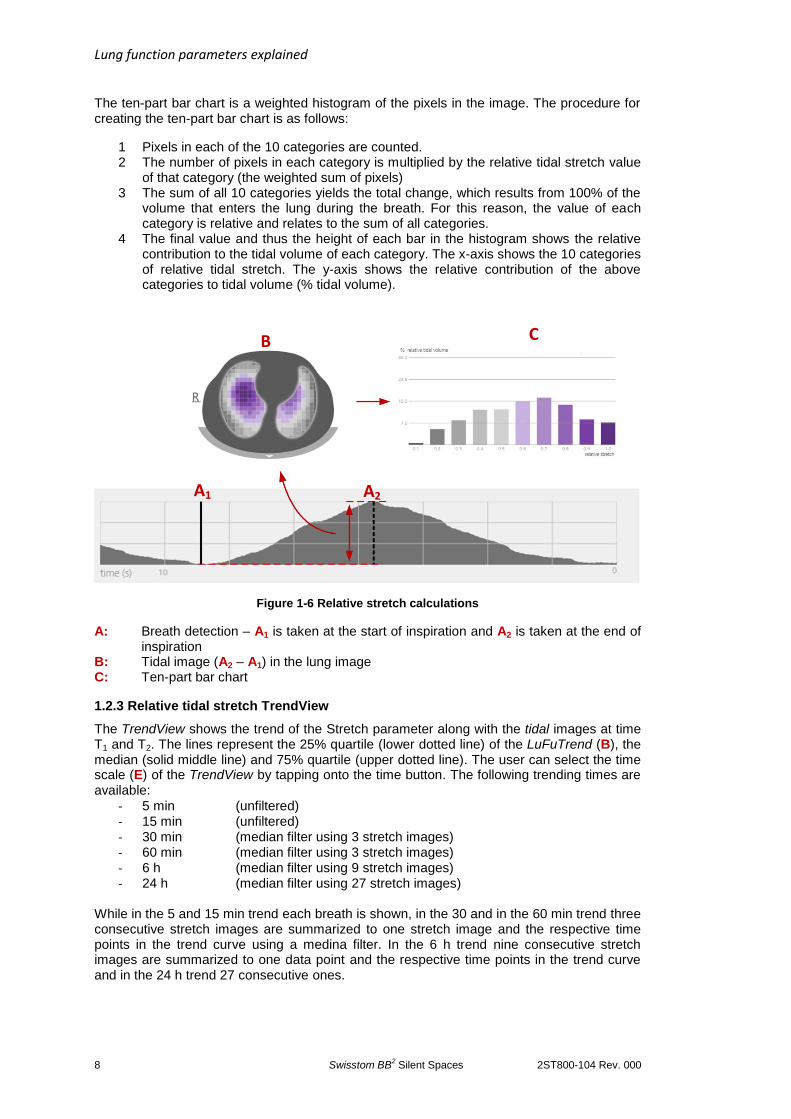
The ten-part bar chart is a weighted histogram of the pixels in the image. The procedure for creating the ten-part bar chart is as follows:
1 Pixels in each of the 10 categories are counted. 2 The number of pixels in each category is multiplied by the relative tidal stretch value
of that category (the weighted sum of pixels) 3 The sum of all 10 categories yields the total change, which results from 100% of the
volume that enters the lung during the breath. For this reason, the value of each category is relative and relates to the sum of all categories.
4 The final value and thus the height of each bar in the histogram shows the relative contribution to the tidal volume of each category. The x-axis shows the 10 categories of relative tidal stretch. The y-axis shows the relative contribution of the above categories to tidal volume (% tidal volume).
Figure 1-6 Relative stretch calculations
A: Breath detection – A1 is taken at the start of inspiration and A2 is taken at the end of inspiration B: Tidal image (A2 – A1) in the lung image C: Ten-part bar chart
1.2.3 Relative tidal stretch TrendView
The TrendView shows the trend of the Stretch parameter along with the tidal images at time T1 and T2. The lines represent the 25% quartile (lower dotted line) of the LuFuTrend (B), the median (solid middle line) and 75% quartile (upper dotted line). The user can select the time scale (E) of the TrendView by tapping onto the time button. The following trending times are available:
- 5 min (unfiltered) - 15 min (unfiltered) - 30 min (median filter using 3 stretch images) - 60 min (median filter using 3 stretch images) - 6 h (median filter using 9 stretch images) - 24 h (median filter using 27 stretch images)
While in the 5 and 15 min trend each breath is shown, in the 30 and in the 60 min trend three consecutive stretch images are summarized to one stretch image and the respective time points in the trend curve using a medina filter. In the 6 h trend nine consecutive stretch images are summarized to one data point and the respective time points in the trend curve and in the 24 h trend 27 consecutive ones.
B
A1
C
A2
Lung function parameters explained
2ST800-104 Rev. 000 Swisstom BB2 Silent Spaces
9
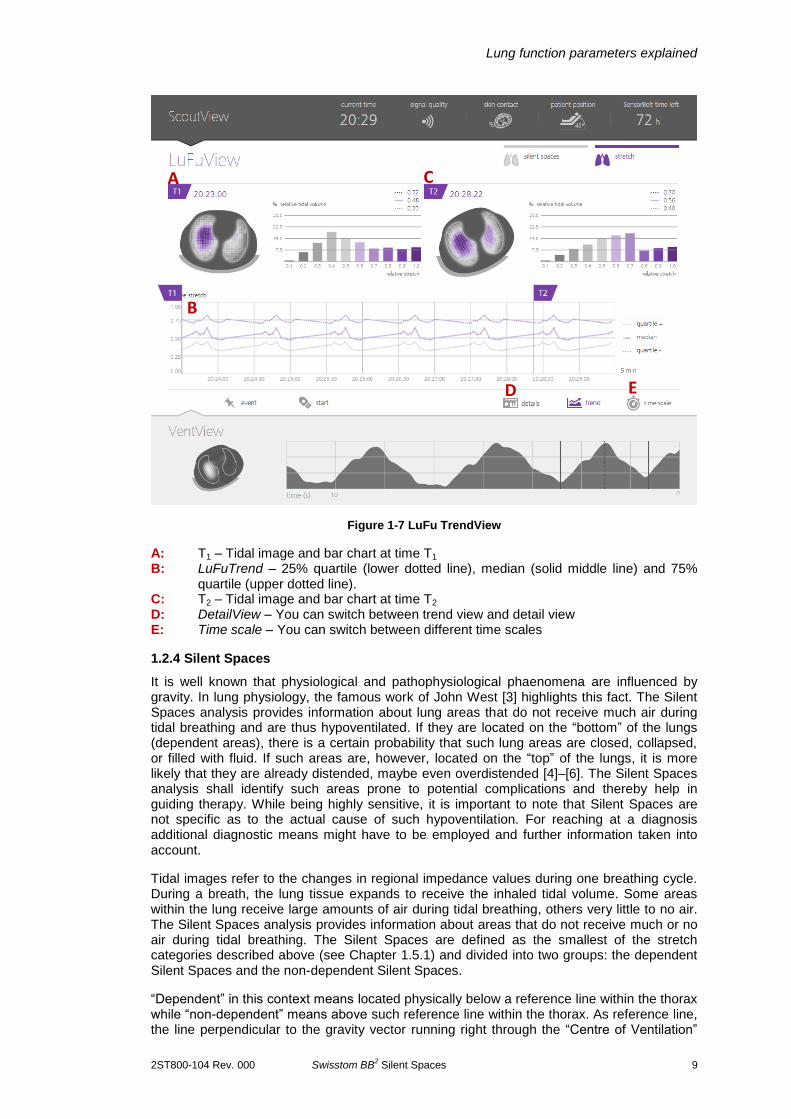
Figure 1-7 LuFu TrendView
A: T1 – Tidal image and bar chart at time T1 B: LuFuTrend – 25% quartile (lower dotted line), median (solid middle line) and 75% quartile (upper dotted line). C: T2 – Tidal image and bar chart at time T2 D: DetailView – You can switch between trend view and detail view E: Time scale – You can switch between different time scales
1.2.4 Silent Spaces
It is well known that physiological and pathophysiological phaenomena are influenced by gravity. In lung physiology, the famous work of John West [3] highlights this fact. The Silent Spaces analysis provides information about lung areas that do not receive much air during tidal breathing and are thus hypoventilated. If they are located on the “bottom” of the lungs (dependent areas), there is a certain probability that such lung areas are closed, collapsed, or filled with fluid. If such areas are, however, located on the “top” of the lungs, it is more likely that they are already distended, maybe even overdistended [4]–[6]. The Silent Spaces analysis shall identify such areas prone to potential complications and thereby help in guiding therapy. While being highly sensitive, it is important to note that Silent Spaces are not specific as to the actual cause of such hypoventilation. For reaching at a diagnosis additional diagnostic means might have to be employed and further information taken into account.
Tidal images refer to the changes in regional impedance values during one breathing cycle. During a breath, the lung tissue expands to receive the inhaled tidal volume. Some areas within the lung receive large amounts of air during tidal breathing, others very little to no air. The Silent Spaces analysis provides information about areas that do not receive much or no air during tidal breathing. The Silent Spaces are defined as the smallest of the stretch categories described above (see Chapter 1.5.1) and divided into two groups: the dependent Silent Spaces and the non-dependent Silent Spaces.
“Dependent” in this context means located physically below a reference line within the thorax while “non-dependent” means above such reference line within the thorax. As reference line, the line perpendicular to the gravity vector running right through the “Centre of Ventilation”
A C
B
D E
Lung function parameters explained
10 Swisstom BB2 Silent Spaces 2ST800-104 Rev. 000
(CoV) is taken. This line is called “ventilation horizon” and used to sort the pixels of the lowest stretch category into dependent and non-dependent Silence Spaces. The value attributed to the dependent Silent Spaces is the relative number of pixels located “below” the ventilation horizon, expressed as percent of the total number of pixels within the lung contour. The nondependent Silent Spaces is the relative number of pixels located “above” the ventilation horizon, expressed as percent of the total number of pixels within the lung contour.
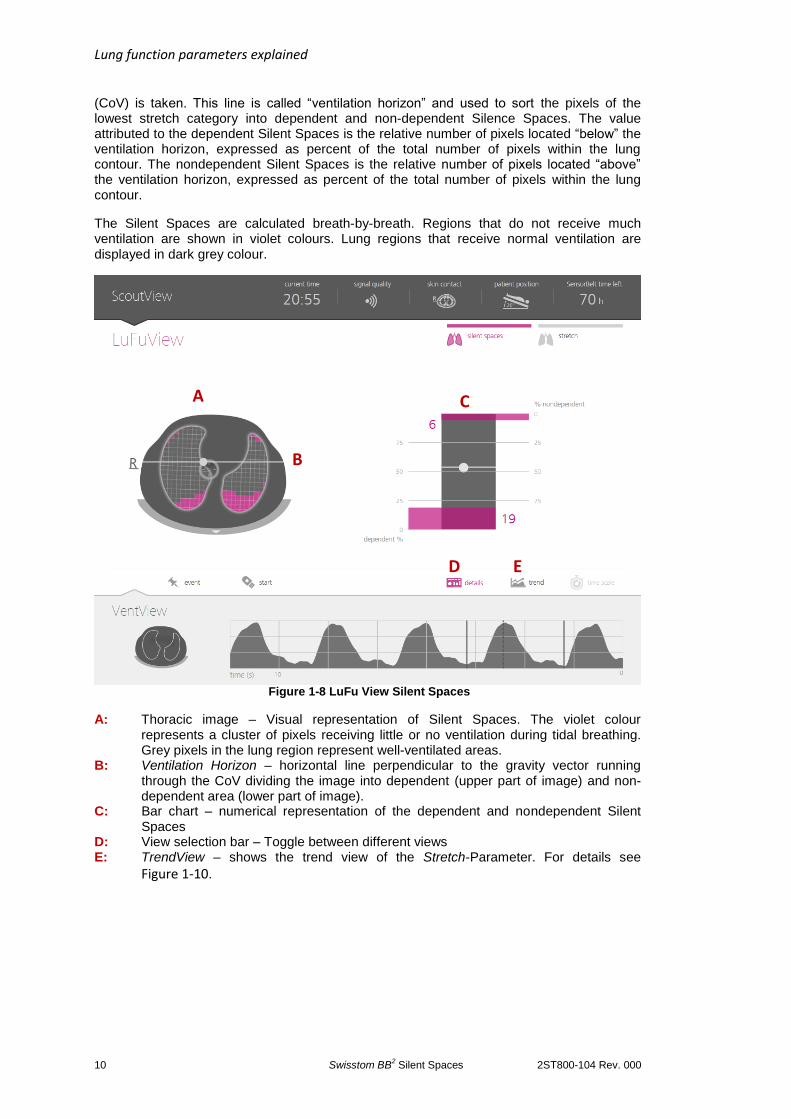
The Silent Spaces are calculated breath-by-breath. Regions that do not receive much ventilation are shown in violet colours. Lung regions that receive normal ventilation are displayed in dark grey colour.
Figure 1-8 LuFu View Silent Spaces
A: Thoracic image – Visual representation of Silent Spaces. The violet colour represents a cluster of pixels receiving little or no ventilation during tidal breathing. Grey pixels in the lung region represent well-ventilated areas.
B: Ventilation Horizon – horizontal line perpendicular to the gravity vector running through the CoV dividing the image into dependent (upper part of image) and non-dependent area (lower part of image).
C: Bar chart – numerical representation of the dependent and nondependent Silent Spaces D: View selection bar – Toggle between different views E: TrendView – shows the trend view of the Stretch-Parameter. For details see
Figure 1-10.
C A
D E
B
Lung function parameters explained
2ST800-104 Rev. 000 Swisstom BB2 Silent Spaces
11
1.2.5 Silent Spaces calculations
The Silent Spaces display consists of two complementary parameters: the Centre of Ventilation, describing the well-ventilated areas of the lung and the Silent Spaces, describing
lung areas that receive minimal or no ventilation, see Figure 1-9. The Centre of Ventilation was used in several studies to describe the ventilation distribution [7], [8]. It is calculated breath-by-breath as follows:
1 The Centre of Ventilation (D) is calculated as follows: a. from right to left (CoVrl) along the x-axis, b. and in the ventral to dorsal direction (CoVvd) along the y-axis:
CoVrl = ∑ 𝑥∙TI[𝑥,𝑦]{𝑥,𝑦}∈𝑙𝑢𝑛𝑔
∑ TI[𝑥,𝑦]{𝑥,𝑦}∈𝑙𝑢𝑛𝑔 CoVvd =
∑ 𝑦∙𝑇𝐼[𝑥,𝑦]{𝑥,𝑦}∈𝑙𝑢𝑛𝑔
∑ 𝑇𝐼[𝑥,𝑦]{𝑥,𝑦}∈𝑙𝑢𝑛𝑔
where, x is the right to left distance of each pixel, where zero is at the right lateral side
y is the ventral dorsal distance of each pixel, where zeros is at the ventral side TI is the tidal image containing all pixels within the lung region
2 The expected CoV (E) or target CoV is calculated analogously, but assuming that ventilation was homogenously distributed, i.e. TI contains identical values.
3 The percentage values of Centre of Ventilation, with respect to the scale on the left hand side, are summarized again in the form of a bar chart.
The Silent Spaces are calculated breath-by-breath as follows:
1 A first impedance distribution map (F1) is measured at the start of inhalation, and a second impedance distribution map (F2) is measured at the subsequent end of inhalation. Each impedance distribution map contains 32 x 32 elements (pixels), and each pixel holds a specific impedance values.
2 F1 is subtracted, pixel by pixel, from F2 yielding a difference impedance distribution map, sometimes called “tidal image (TI)”. Each pixel contains a value, which is the difference between the impedance at start of inhalation and the impedance measured at end of inhalation.
3 All pixels of the TI falling within the lung regions are analysed in the same way at the stretch analysis described above. The pixels of the lowest stretch category are identified as “Silent Spaces” and then used for further analysis. All other pixels are discarded.
4 The Ventilation Horizon is calculated as the line perpendicular to the gravity vector (measured by the SensorBeltConnector) running through the CoV.
5 The Silent Spaces value “above” the ventilation horizon is expressed as percentage of the total number of pixels within the lung contour and called non-dependent Silent Spaces
6 The Silent Spaces value “below” the ventilation horizon is expressed as percentage of the total number of pixels within the lung contour and called dependent Silent Spaces.
Lung function parameters explained
12 Swisstom BB2 Silent Spaces 2ST800-104 Rev. 000
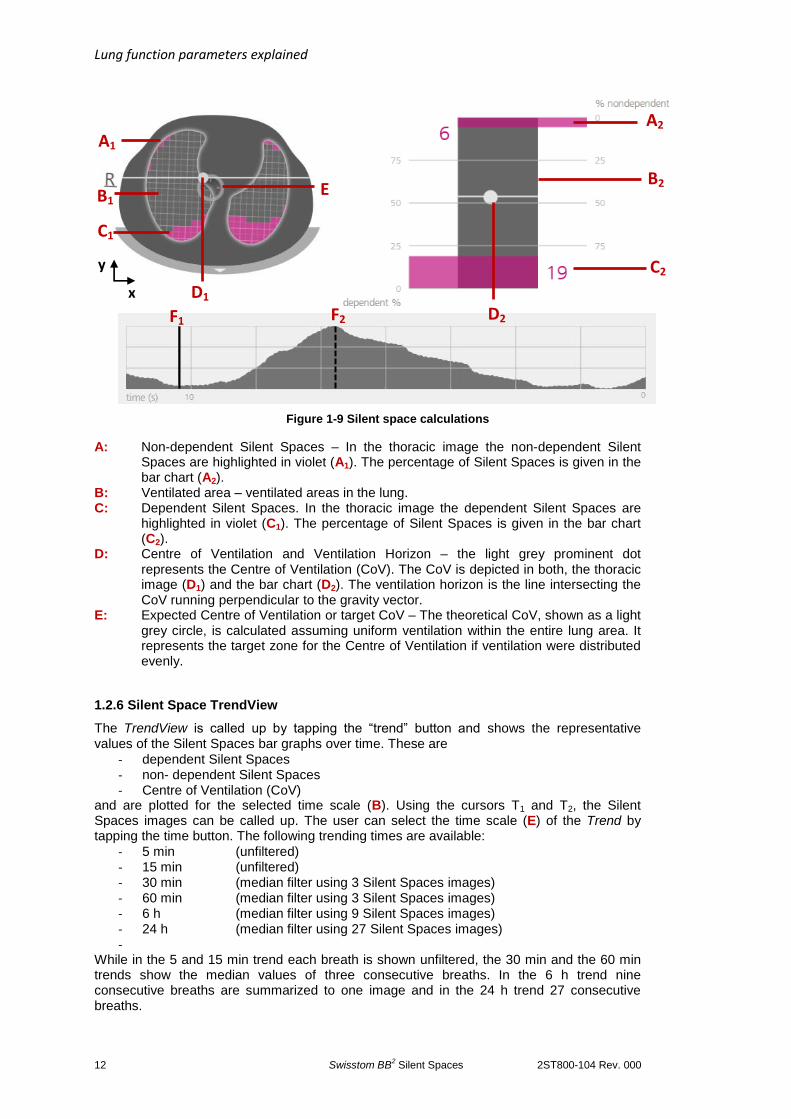
Figure 1-9 Silent space calculations
A: Non-dependent Silent Spaces – In the thoracic image the non-dependent Silent Spaces are highlighted in violet (A1). The percentage of Silent Spaces is given in the bar chart (A2).
B: Ventilated area – ventilated areas in the lung. C: Dependent Silent Spaces. In the thoracic image the dependent Silent Spaces are
highlighted in violet (C1). The percentage of Silent Spaces is given in the bar chart (C2).
D: Centre of Ventilation and Ventilation Horizon – the light grey prominent dot represents the Centre of Ventilation (CoV). The CoV is depicted in both, the thoracic image (D1) and the bar chart (D2). The ventilation horizon is the line intersecting the CoV running perpendicular to the gravity vector.
E: Expected Centre of Ventilation or target CoV – The theoretical CoV, shown as a light grey circle, is calculated assuming uniform ventilation within the entire lung area. It represents the target zone for the Centre of Ventilation if ventilation were distributed evenly.
1.2.6 Silent Space TrendView
The TrendView is called up by tapping the “trend” button and shows the representative values of the Silent Spaces bar graphs over time. These are
- dependent Silent Spaces - non- dependent Silent Spaces - Centre of Ventilation (CoV)
and are plotted for the selected time scale (B). Using the cursors T1 and T2, the Silent Spaces images can be called up. The user can select the time scale (E) of the Trend by tapping the time button. The following trending times are available:
- 5 min (unfiltered) - 15 min (unfiltered) - 30 min (median filter using 3 Silent Spaces images) - 60 min (median filter using 3 Silent Spaces images) - 6 h (median filter using 9 Silent Spaces images) - 24 h (median filter using 27 Silent Spaces images) -
While in the 5 and 15 min trend each breath is shown unfiltered, the 30 min and the 60 min trends show the median values of three consecutive breaths. In the 6 h trend nine consecutive breaths are summarized to one image and in the 24 h trend 27 consecutive breaths.
F1 F2 x
y
A1
B1
C1
E
D1
A2
B2
C2
D2
Lung function parameters explained
2ST800-104 Rev. 000 Swisstom BB2 Silent Spaces
13
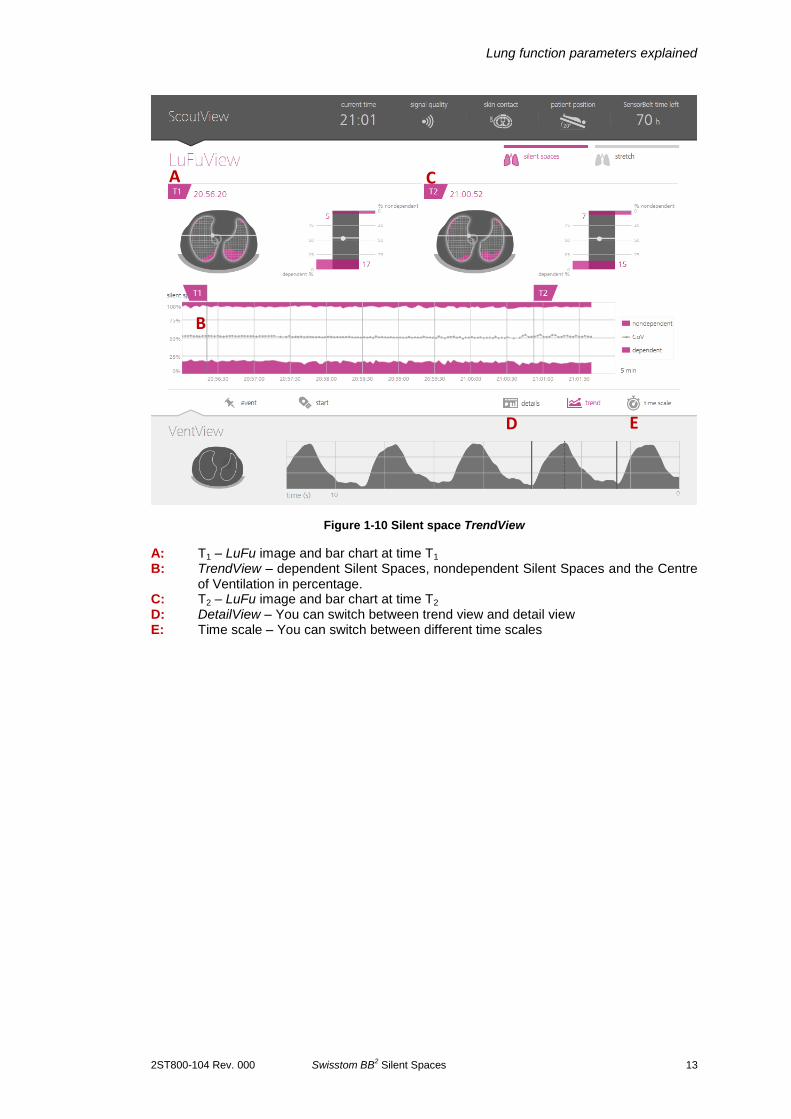
Figure 1-10 Silent space TrendView
A: T1 – LuFu image and bar chart at time T1
B: TrendView – dependent Silent Spaces, nondependent Silent Spaces and the Centre of Ventilation in percentage.
C: T2 – LuFu image and bar chart at time T2 D: DetailView – You can switch between trend view and detail view E: Time scale – You can switch between different time scales
A C
B
D E
Lung function parameters explained
14 Swisstom BB2 Silent Spaces 2ST800-104 Rev. 000
1.6 Bibliography
[1] P. Nopp, E. Rapp, H. Pfützner, H. Nakesch, and C. Ruhsam, “Dielectric properties of lung tissue as a function of air content.,” Phys. Med. Biol., vol. 38, no. 6, pp. 699–716, Jun. 1993.
[2] P. Nopp, N. D. Harris, T. X. Zhao, and B. H. Brown, “Model for the dielectric properties of human lung tissue against frequency and air content.,” Med. Biol. Eng. Comput., vol. 35, no. 6, pp. 695–702, Nov. 1997.
[3] J. B. West, C. T. Dollery, and B. E. Heard, “Increased Pulmonary Vascular Resistance in the Dependent Zone of the Isolated Dog Lung Caused by Perivascular Edema,” Circ. Res., vol. 17, no. 3, pp. 191–206, Sep. 1965.
[4] E. L. V Costa, J. B. Borges, A. Melo, F. Suarez-Sipmann, C. Toufen, S. H. Bohm, and M. B. P. Amato, “Bedside estimation of recruitable alveolar collapse and hyperdistension by electrical impedance tomography.,” Intensive Care Med., vol. 35, no. 6, pp. 1132–7, Jun. 2009.
[5] H. Luepschen, T. Meier, M. Grossherr, T. Leibecke, J. Karsten, and S. Leonhardt, “Protective ventilation using electrical impedance tomography.,” Physiol. Meas., vol. 28, no. 7, pp. S247–60, Jul. 2007.
[6] J. B. Borges, V. N. Okamoto, G. F. J. Matos, M. P. R. Caramez, P. R. Arantes, F. Barros, C. E. Souza, J. a Victorino, R. M. Kacmarek, C. S. V Barbas, C. R. R. Carvalho, and M. B. P. Amato, “Reversibility of lung collapse and hypoxemia in early acute respiratory distress syndrome.,” Am. J. Respir. Crit. Care Med., vol. 174, no. 3, pp. 268–78, Aug. 2006.
[7] G. Zick, G. Elke, T. Becher, D. Schädler, S. Pulletz, S. Freitag-Wolf, N. Weiler, and I. Frerichs, “Effect of PEEP and tidal volume on ventilation distribution and end-expiratory lung volume: a prospective experimental animal and pilot clinical study.,” PLoS One, vol. 8, no. 8, p. e72675, Jan. 2013.
[8] O. C. Radke, T. Schneider, A. R. Heller, and T. Koch, “Spontaneous breathing during general anesthesia prevents the ventral redistribution of ventilation as detected by electrical impedance tomography: a randomized trial.,” Anesthesiology, vol. 116, no. 6, pp. 1227–34, Jun. 2012.

W H I T E PA P E R O N S I L E N T S PA C E S
ZW
EIZ
EIT
16
02
20
15
C
on
ten
t: D
r. S
tep
han
Bö
hm
; C
on
cep
t &
Des
ign
: Zw
eize
it B
ran
d D
evel
op
men
t
Made in Switzerland
electricalimpedancetomography
Real-time tomographic images for organ function monitoring and diagnosis
Contact us!
call: + 41 (0) 81 330 09 72 mail: [email protected]: www.swisstom.com
Swisstom AGSchulstrasse 1, CH-7302 Landquart, Switzerland
Swisstom AGSwisstom AG, located in Landquart, Switzerland, develops and manufactures innovative medical devices. Our new lung function monitor enables life-saving treatments for patients in intensive care and during general anesthesia.
Unlike traditional tomography, Swisstom´s bedside imaging is based on non-radiating principles: Electrical Impedance Tomography (EIT). To date, no comparable devices can show such regional organ function continuously and in real-time at the patient’s bedside.
Swisstom creates its competitive edge by passionate leadership in non-invasive tomography with the goal to improve individual lives and therapies.
2ST800-104, Rev. 000 © Swisstom AG 2015