Embed Size (px)
Citation preview

Quality Improvement
in Action
Reducing patient turn away at a NC County STI Clinic
Samantha Charm, Jennifer Hill, Ashley Marshall, Eva Fernández, Brianne Kallam, and Jaimie Lea

Presentation Objectives
• Overview of approach
• Data collection and baseline data
• Changes
• Results
• Next steps

MODEL FOR IMPROVEMENT
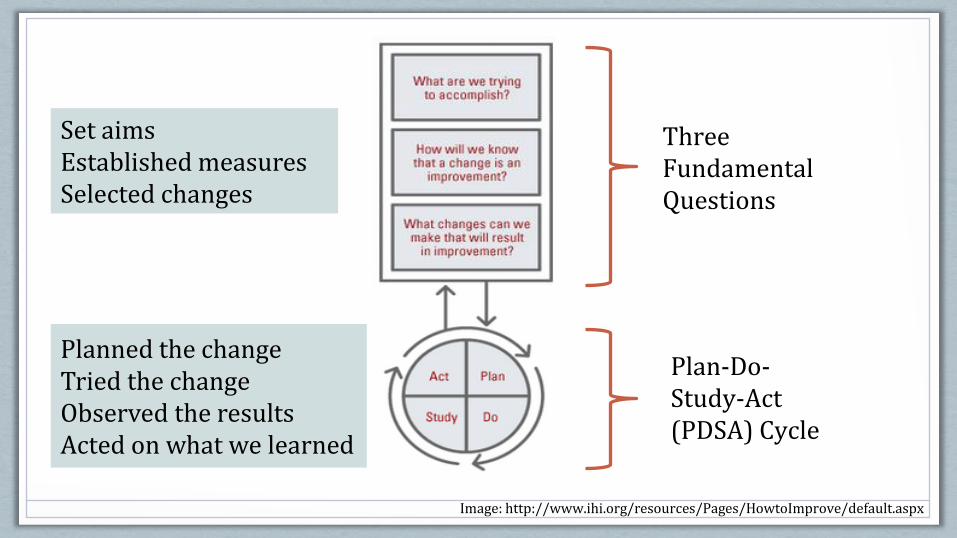
Image: http://www.ihi.org/resources/Pages/HowtoImprove/default.aspx
Plan-Do-Study-Act (PDSA) Cycle
Three Fundamental Questions
Set aims Established measures Selected changes
Planned the change Tried the change Observed the results Acted on what we learned

PDSA Cycles
Small scale changes that are refined through multiple rounds of testing.
Image: http://sisep.fpg.unc.edu/news/sisep-enotes-july-2012
Aim for Our Project
Reduce the weekly number of patients turned away from the NC County STI Clinic.
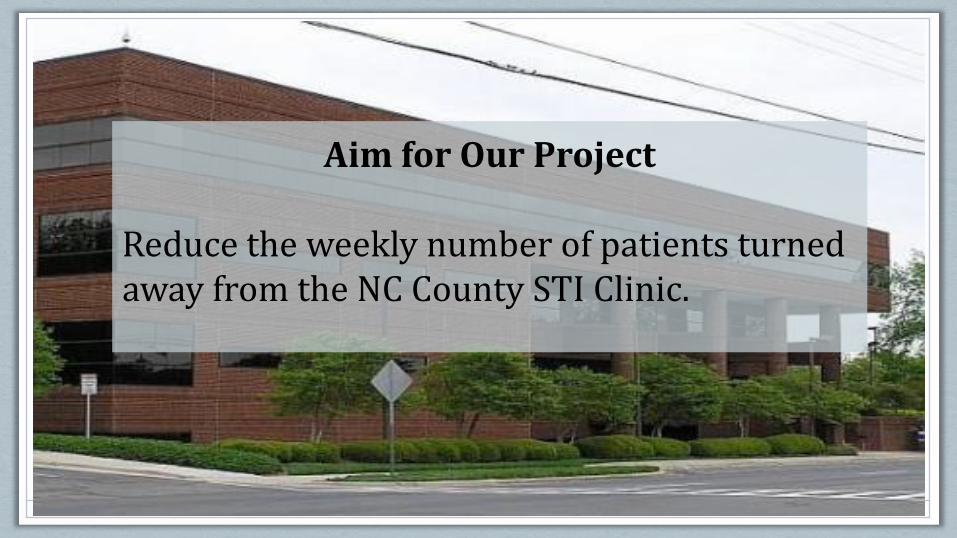
Understanding the Clinic
• Observations and shadowing
• Patient and staff interviews
• Mapping work flows
• Timing steps of work flow

What We Observed
Observations: • Busy staff with varied responsibilities • Reliance on verbal communication • Long wait times at registration
Hypotheses: • Bottlenecks → Longer patient wait times → Turn away • Potential to see more patients

Data Collection

Data Collection Methods
Returning Client Tickets
Clinic Volume
Wait Time of Registration

Definitions of Turn Away
NC HHS Definition: Patient who is unable to be seen within 24 hours of first attempt at seeing a provider.
Project Definition: Patient who is told they cannot be seen during that clinic and will need to return at a later time.

Measuring Turn Away

Measuring Clinic Volume
The weekly number of patients seen by a clinic provider.

Measuring Wait Time
Complete Intake Process
Place the Chart in the box for
provider use
Give patient number or add
them to the wait list
= Time recorded
The amount of time it takes after a patient is given a number to when their chart is ready for provider use.
Complete Registration

Baseline Results

Patients Turned Away at Baseline
State Definition
21 Patients turned away
= 10% 214 Patients who walked
in the door
Alternate Definition
29 Patients turned away
= 14% 214 Patients who walked
in the door

Wait Time in Minutes at Baseline
0
1
2
3
4
5
6
7
8
9
10
0-10 11-20 21-30 31-40 41-50 51-60 61-70 71-80 81-90 91-100 101-110 111-120 121-130 131-140
Fre
qu
en
cy
Wait time between registration and chart up (minutes)
Under 1 hour: 59% 1-1.5 hours: 19% Over 1.5 hours: 22%

Changes

Implemented Package of Changes
Intake and Registration Process
• Expedited registration for first two patients
• Clipboard for patient information collection
Appointments and Scheduling
• Chart of initial number of walk-in appointments
• Same/next day appointments for patients turned away
Staff Communication
• Communication board

Expedited Registration Process

Image credit: Eva Fernandez
Clipboard for Patient Information Collection


Same Day & Next Day Appointments

Staff Communication Board
Image credit: Samantha Charm

What We Learned

Percent of Patients Turned Away After Changes
13.6%
9.8%
3.5%
0.0%
Project Defintion State Defintion
Before
After

• An increase in the number of patients seen • 185 at baseline compared to 217 at follow up
• One less intake staff member
Patient Turn Away Decreased Despite...

Patient Wait Time After Changes
0
2
4
6
8
10
12
14F
requ
en
cy
Wait time between registration and chart up (minutes)
Before
After

Limitations of Data
• Problem with first set of outcome data
• Biases towards time of data collection

What to do next

Initial Changes
• Continue using implemented changes
• Refine initial changes
• Registration forms included on clipboards
• Timing of collection of registration forms
• Consider the sustainability of these changes

Reduce Interruptions to Flow
• Changes in outgoing message • Internal Instant Messaging system

Technology to Reduce Steps Reduce Steps Through Technology
• Different avenues for chart requests • Use of new EMR system

What Else?