Embed Size (px)
Citation preview

Digital Pathology, FDA Approval and
Precision Medicine
Joel SaltzDepartment of Biomedical Informatics
Stony Brook University
August 24 2017
Digital Pathology as Clinical Informatics
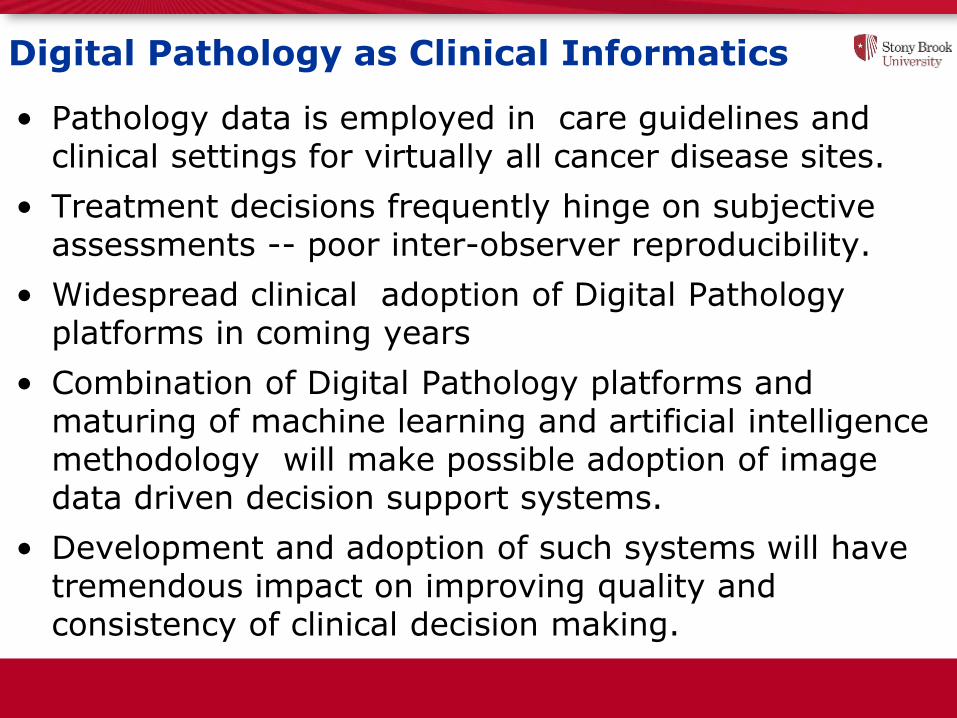
• Pathology data is employed in care guidelines and clinical settings for virtually all cancer disease sites.
• Treatment decisions frequently hinge on subjective assessments -- poor inter-observer reproducibility.
• Widespread clinical adoption of Digital Pathology platforms in coming years
• Combination of Digital Pathology platforms and maturing of machine learning and artificial intelligence methodology will make possible adoption of image data driven decision support systems.
• Development and adoption of such systems will have tremendous impact on improving quality and consistency of clinical decision making.
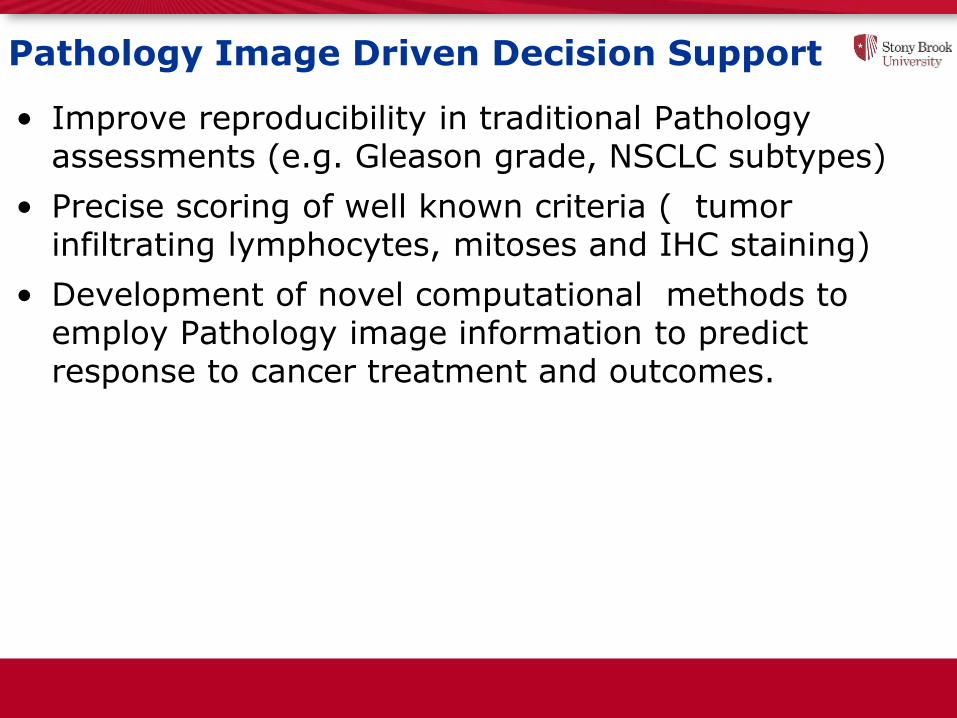
• Improve reproducibility in traditional Pathology assessments (e.g. Gleason grade, NSCLC subtypes)
• Precise scoring of well known criteria ( tumor infiltrating lymphocytes, mitoses and IHC staining)
• Development of novel computational methods to employ Pathology image information to predict response to cancer treatment and outcomes.
Pathology Image Driven Decision Support
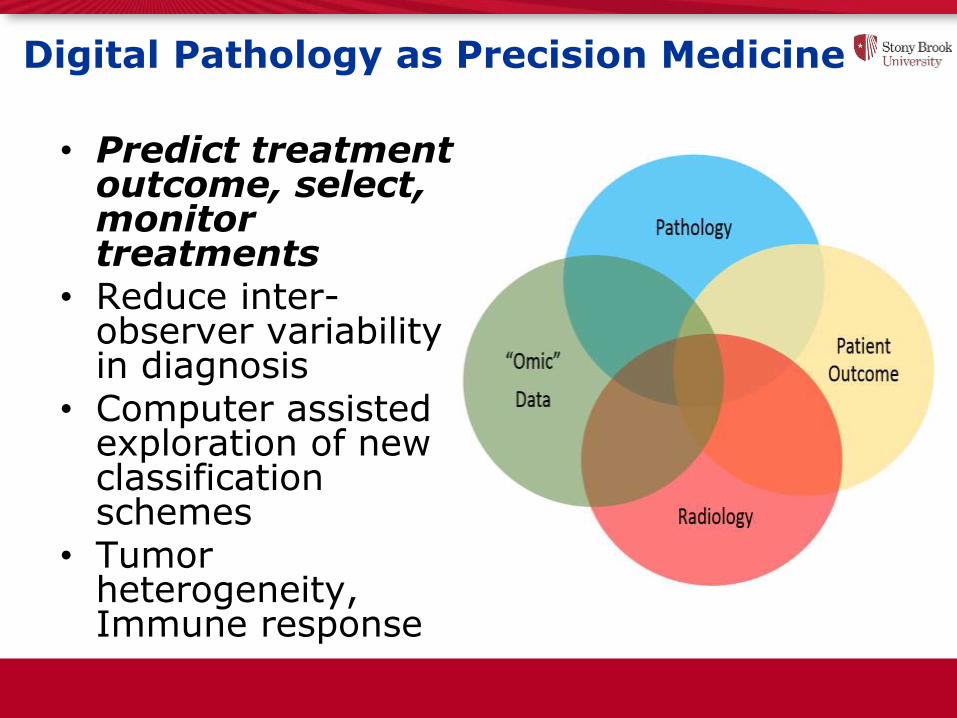
Digital Pathology as Precision Medicine
• Predict treatment outcome, select, monitor treatments
• Reduce inter-observer variability in diagnosis
• Computer assisted exploration of new classification schemes
• Tumor heterogeneity, Immune response
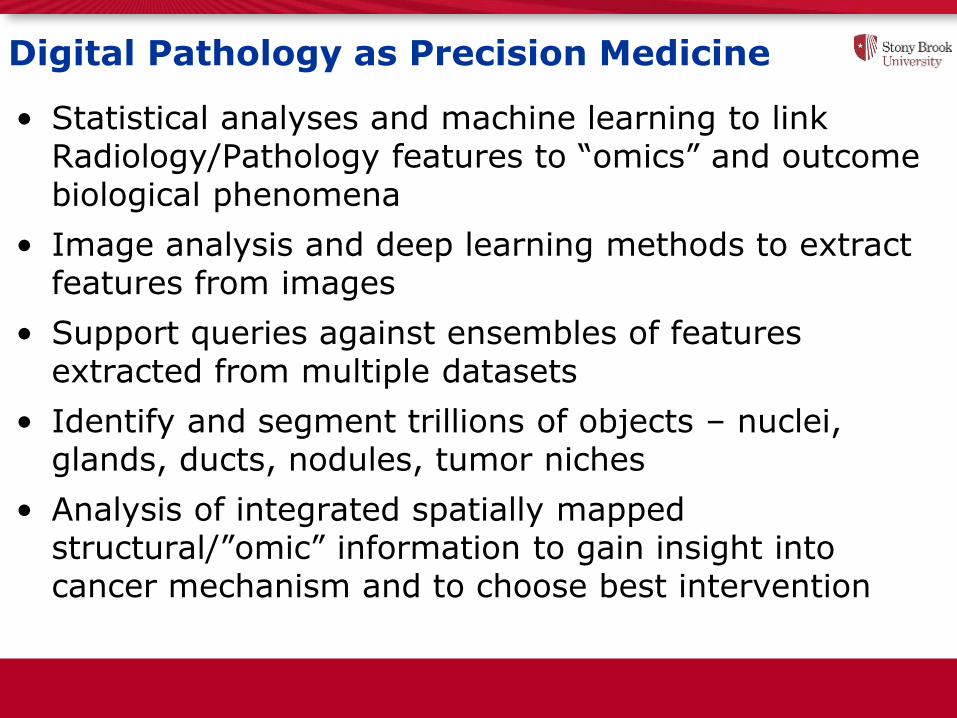
Digital Pathology as Precision Medicine
• Statistical analyses and machine learning to link Radiology/Pathology features to “omics” and outcome biological phenomena
• Image analysis and deep learning methods to extract features from images
• Support queries against ensembles of features extracted from multiple datasets
• Identify and segment trillions of objects – nuclei, glands, ducts, nodules, tumor niches
• Analysis of integrated spatially mapped structural/”omic” information to gain insight into cancer mechanism and to choose best intervention

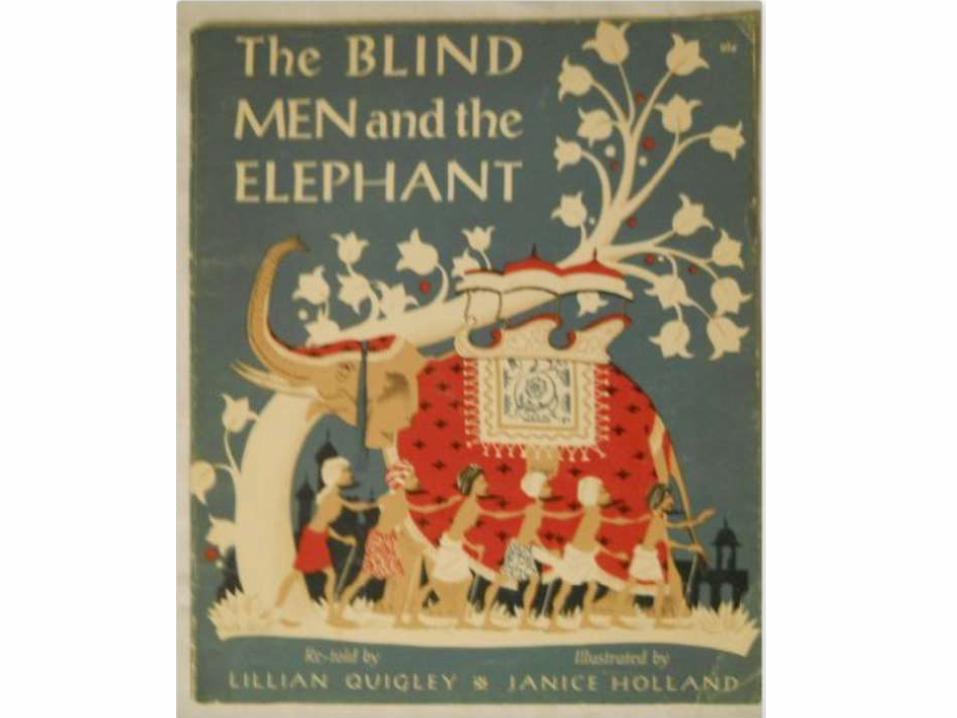
Why We Need Data Analytics and AIOrA Story Concerning Elephants and Pathology
Rolling Hills
Mountains
Aggressive Bear
Wilted Salad
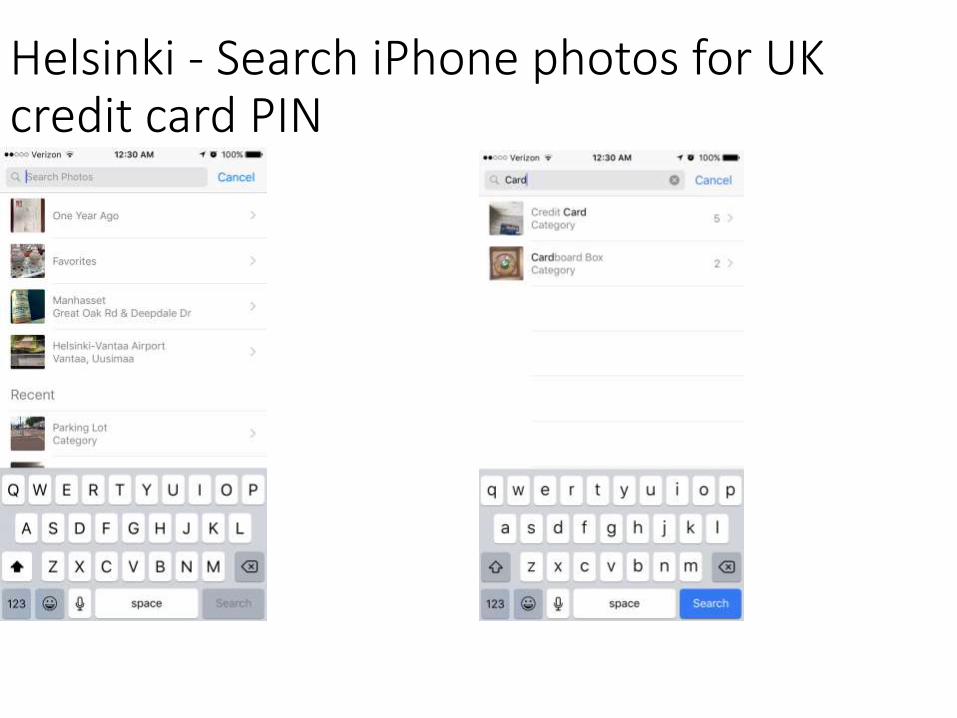
Helsinki - Search iPhone photos for UK credit card PIN

Successful Lunch
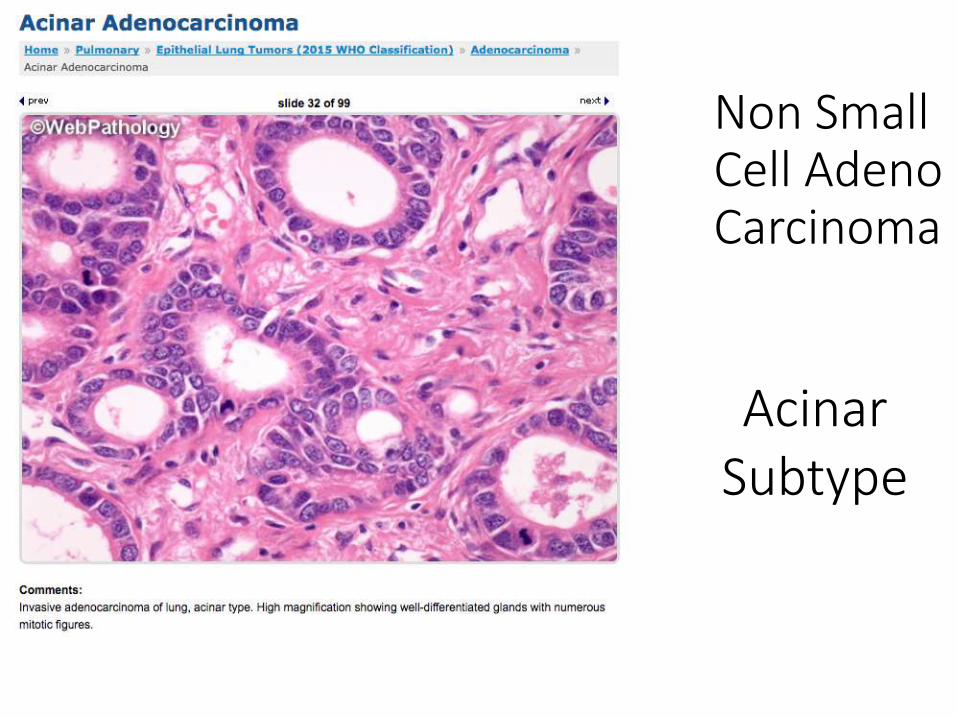
Non Small Cell Adeno Carcinoma
Acinar Subtype
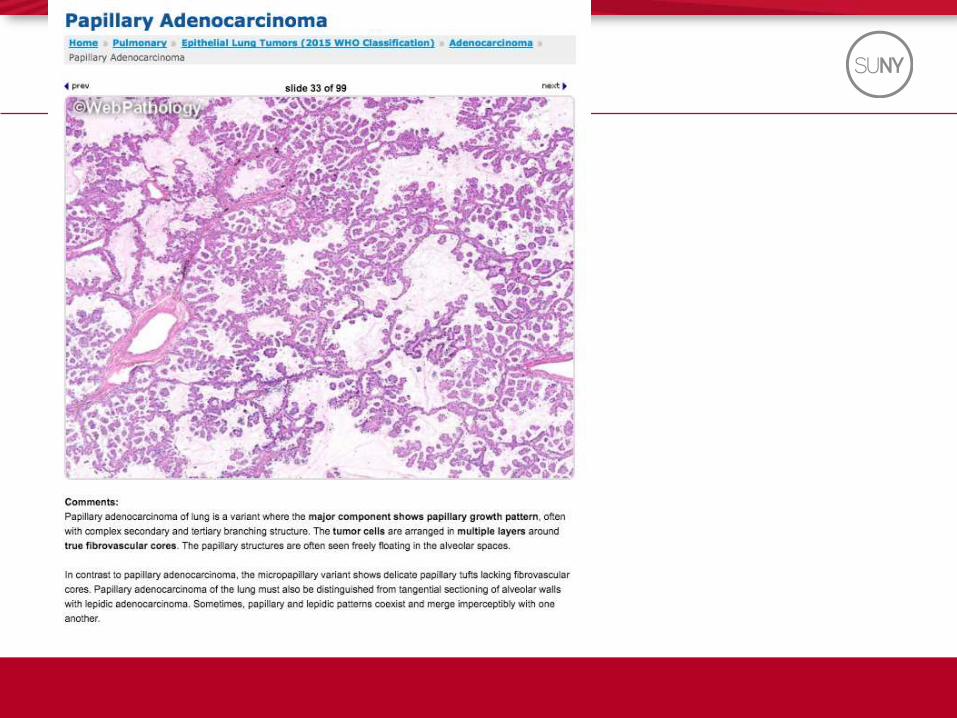
Papillary
Subtype

Lepidic Subtype
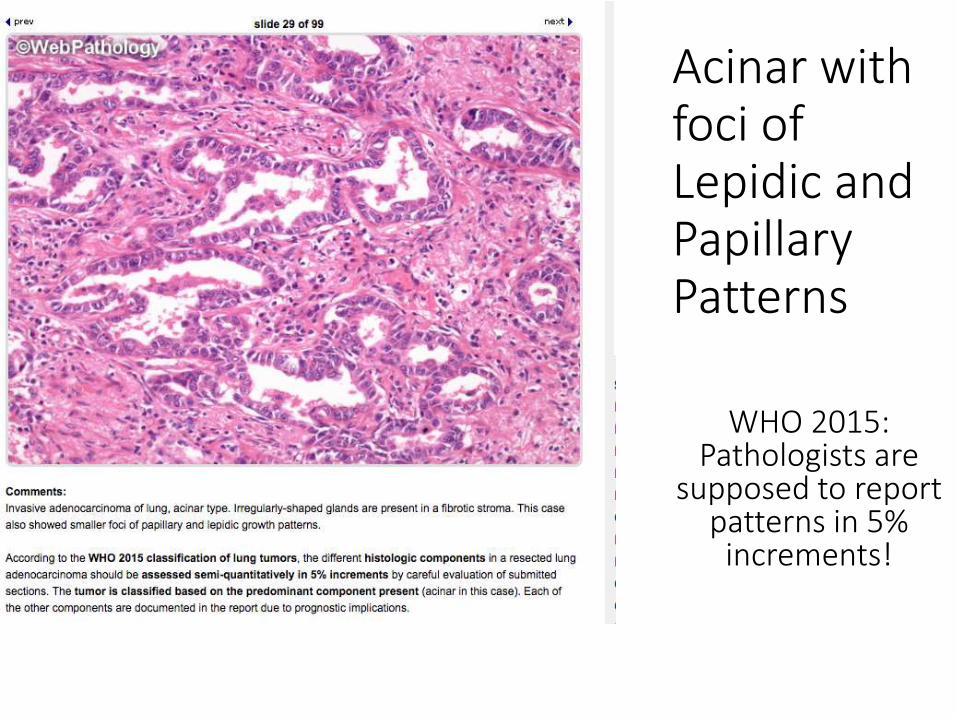
Acinar with foci of Lepidic and Papillary Patterns
WHO 2015: Pathologists are
supposed to report patterns in 5%
increments!
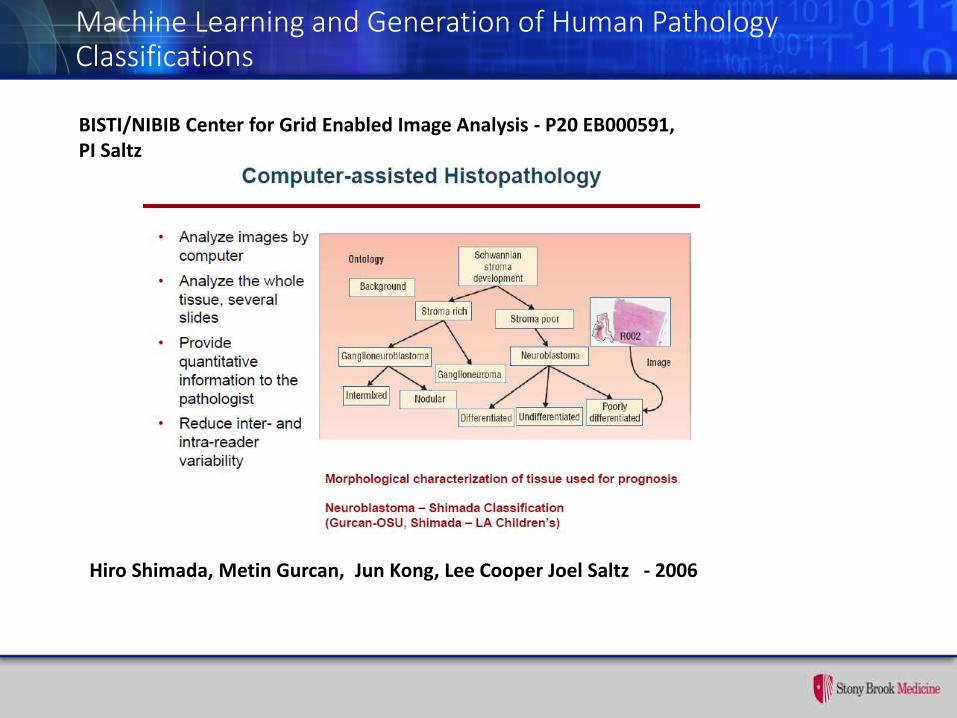
Machine Learning and Generation of Human Pathology Classifications
Hiro Shimada, Metin Gurcan, Jun Kong, Lee Cooper Joel Saltz - 2006
BISTI/NIBIB Center for Grid Enabled Image Analysis - P20 EB000591, PI Saltz
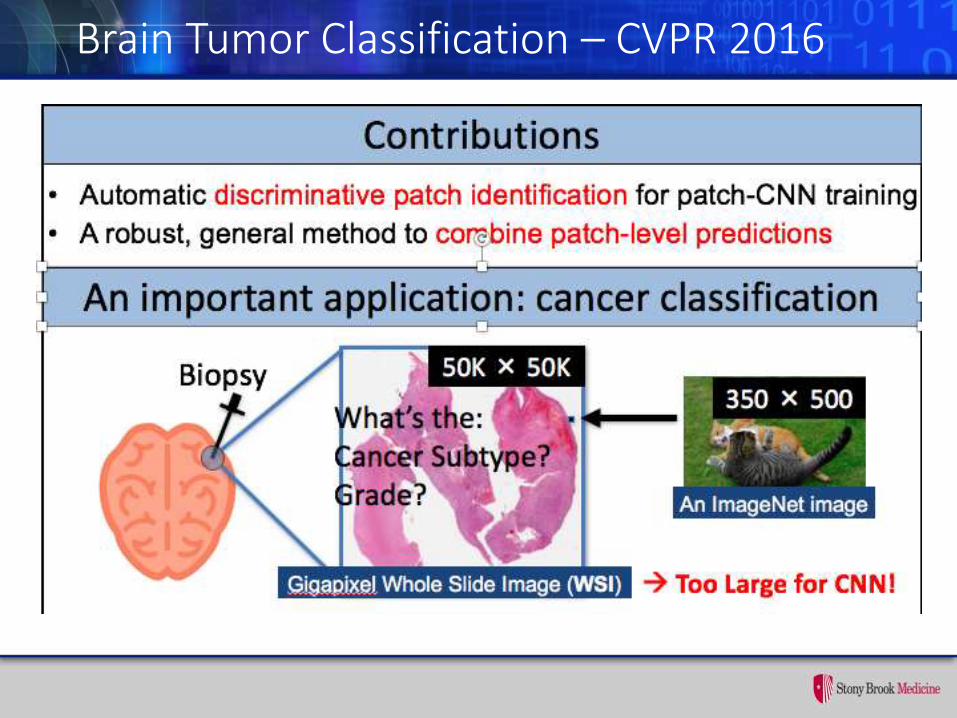
Brain Tumor Classification – CVPR 2016
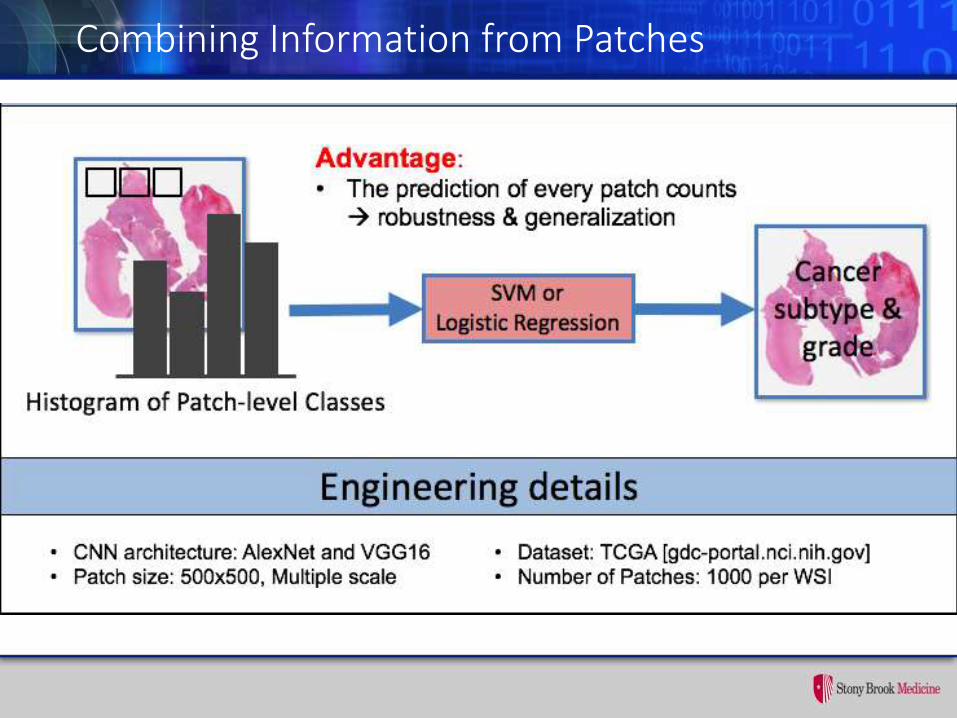
Combining Information from Patches
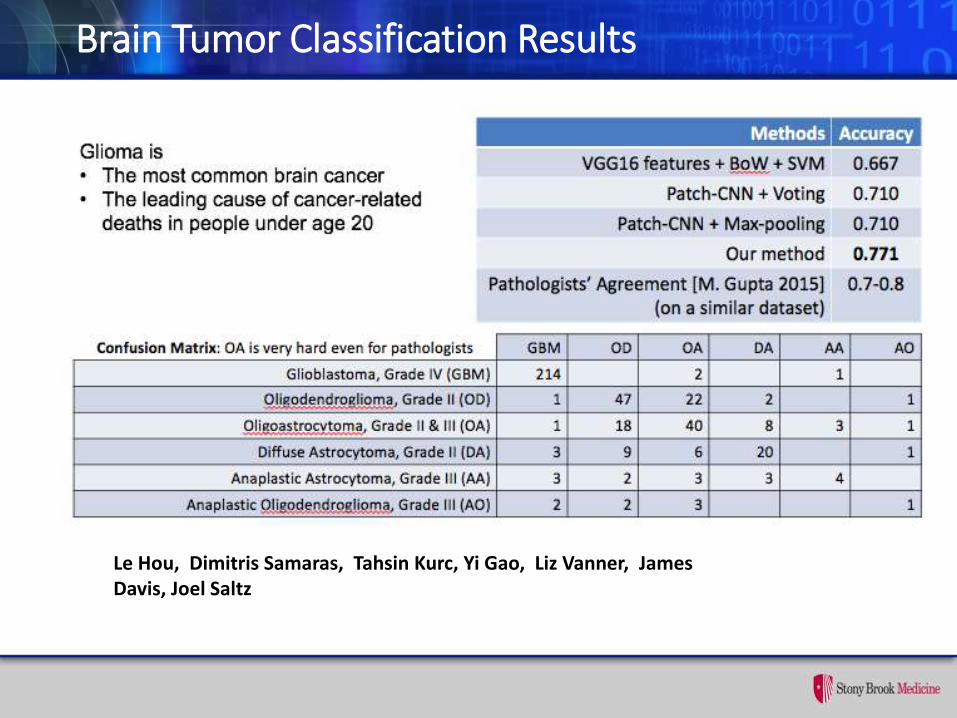
Brain Tumor Classification Results
Le Hou, Dimitris Samaras, Tahsin Kurc, Yi Gao, Liz Vanner, James Davis, Joel Saltz
Moonshot group
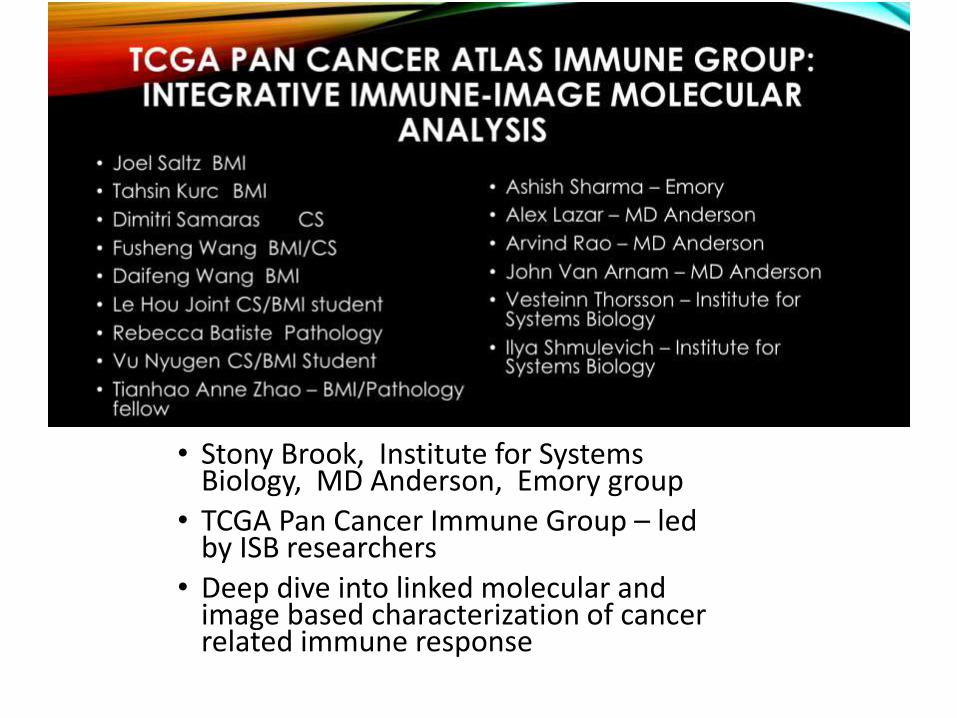
• Stony Brook, Institute for Systems Biology, MD Anderson, Emory group
• TCGA Pan Cancer Immune Group – led by ISB researchers
• Deep dive into linked molecular and image based characterization of cancer related immune response
TIL Quantitation and Distribution
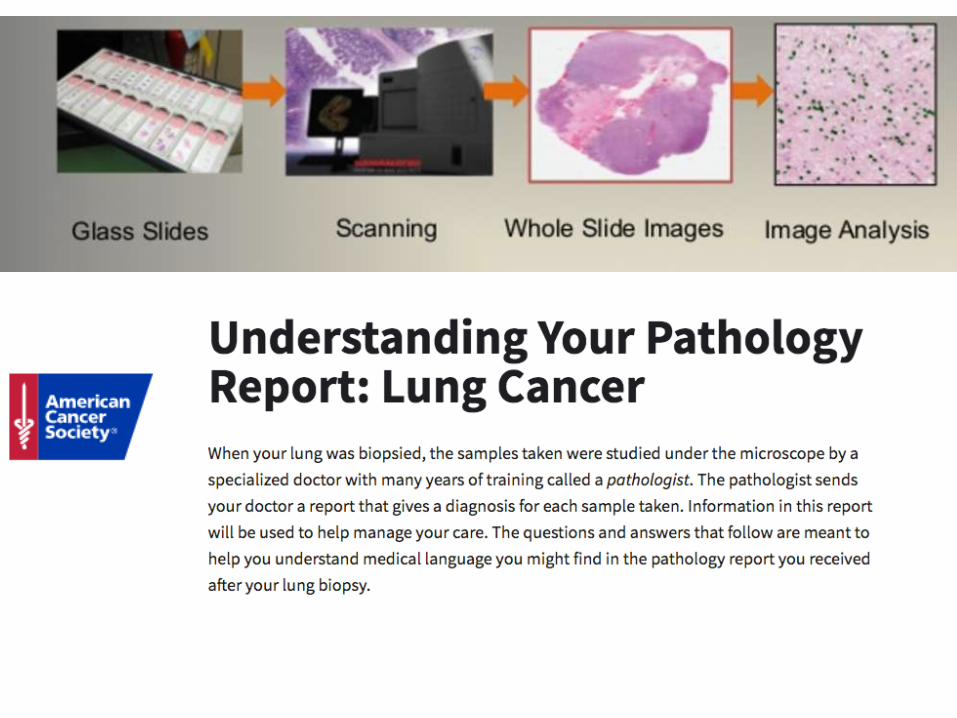
• The most common diagnostic tool in pathology is the H&E tissue image
• FDA just approved use of whole slide images in primary Pathology diagnosis
• TCGA dataset, which comprises 33 tumor types, contains over 30,000 tissue slide images.
• Link pattern of tumor infiltrating distribution to outcome, “omics”, treatment
• Deep Learning TIL method requires modest training and curation – suitable for high throughput analyses
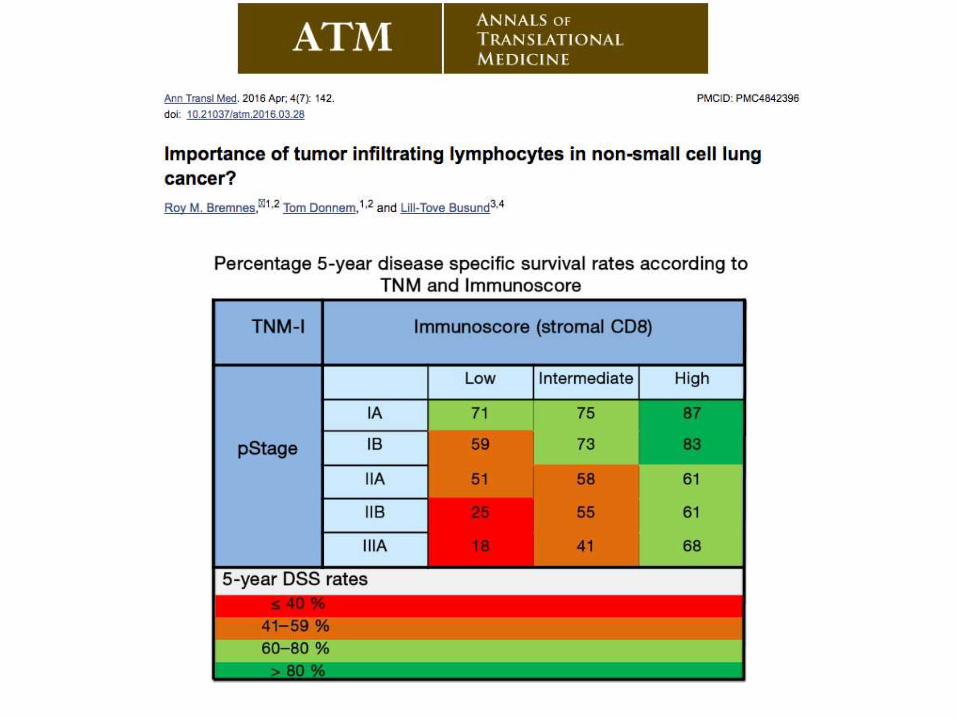
Importance of Immune System in Cancer Treatment and Prognosis
• Spatial context and the nature of cellular heterogeneity of the tumor microenvironment, in terms of the immune infiltrate into the tumor center and invasive margin, are important in cancer prognosis
• Prognostic factors that quantify such spatial TIL densities in different tumor regions have been shown to have high prognostic value – they may be superior to the standard TNM classification
• Immune related assays employed in determining Checkpoint Inhibitor immune therapy in several cancer types
Imaging Based TIL Analysis Workflow
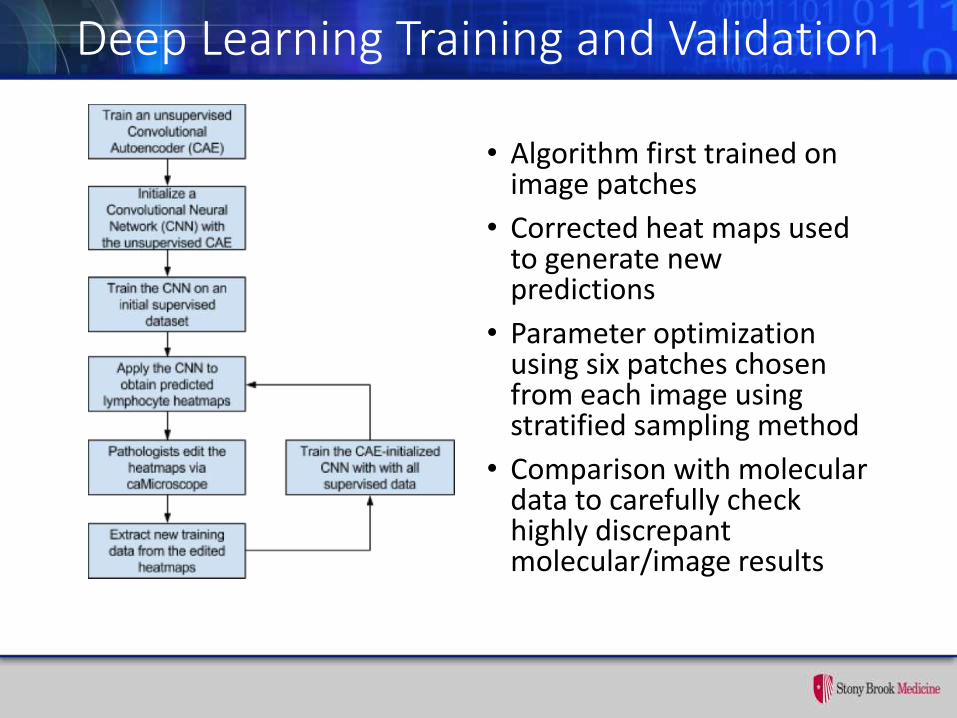
Deep Learning Training and Validation
• Algorithm first trained on image patches
• Corrected heat maps used to generate new predictions
• Parameter optimization using six patches chosen from each image using stratified sampling method
• Comparison with molecular data to carefully check highly discrepant molecular/image results
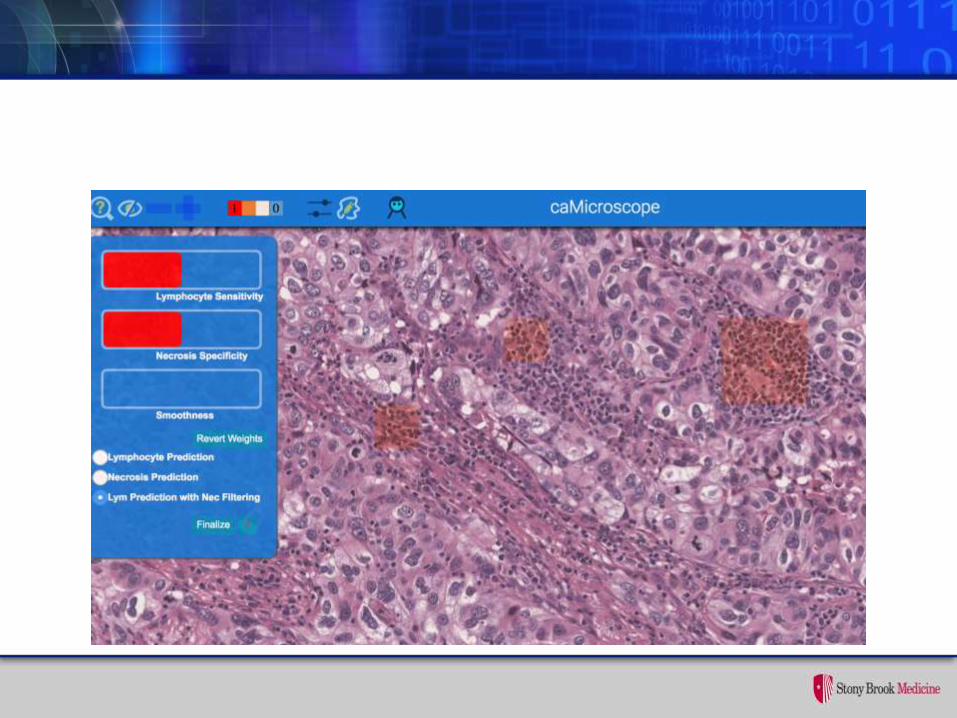
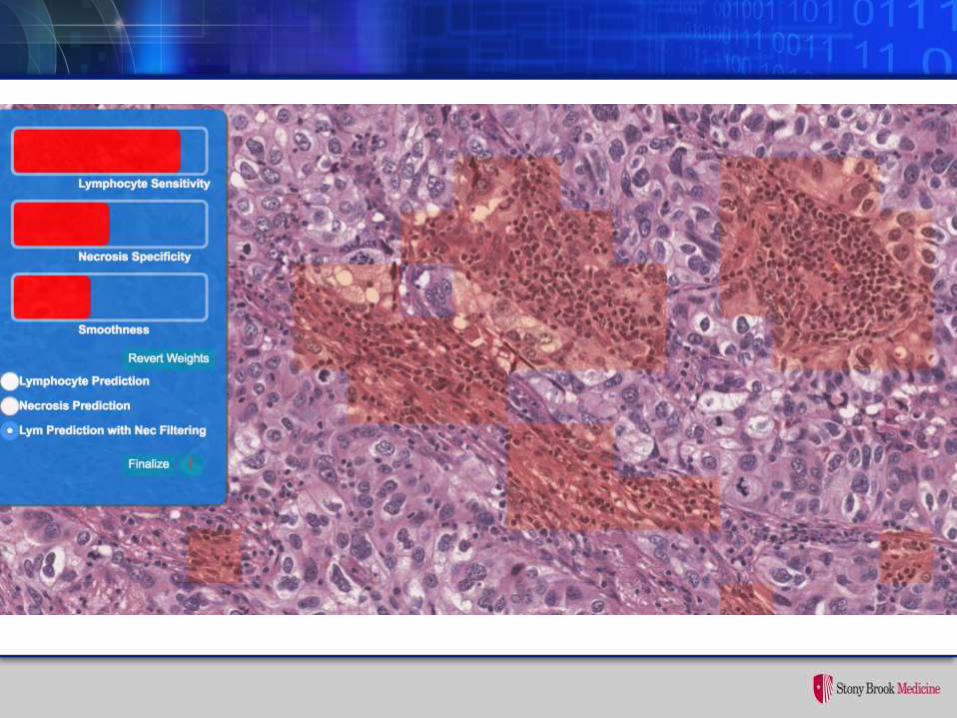
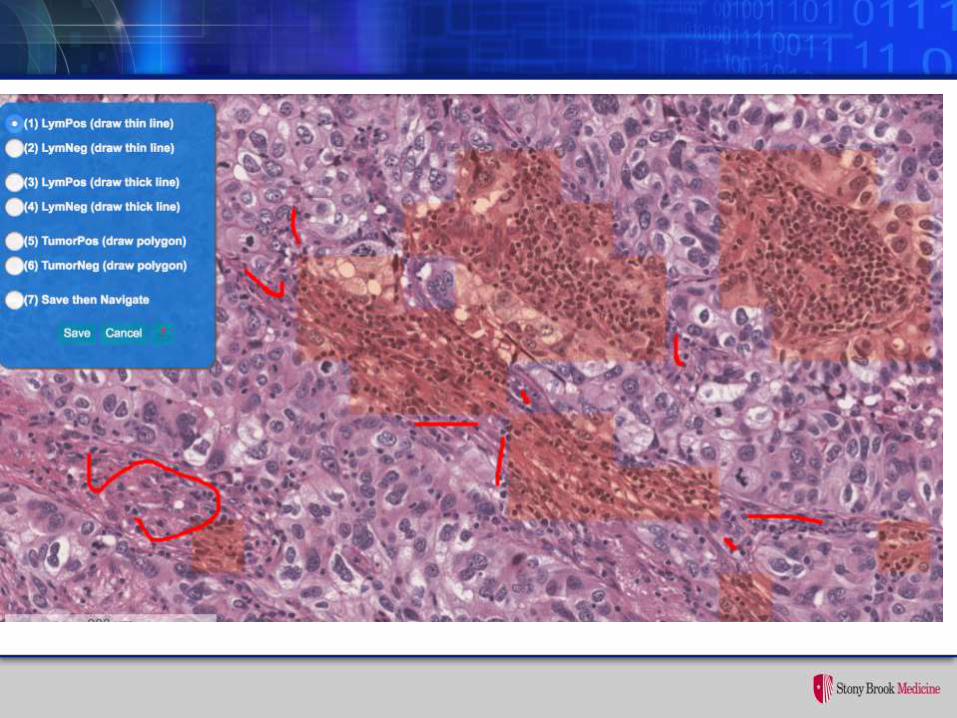
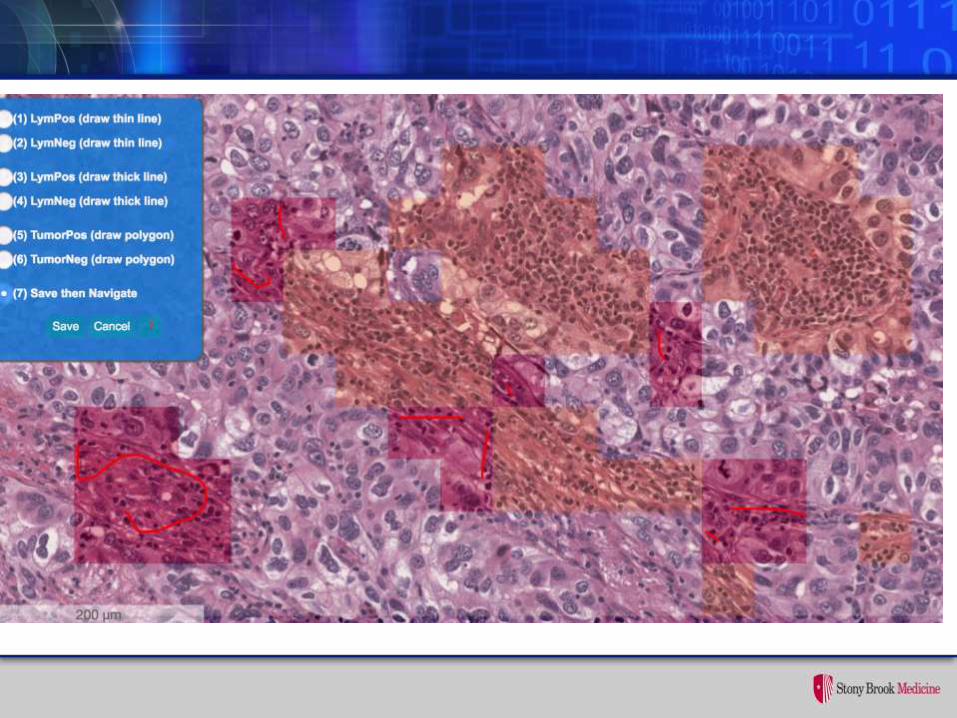
Interactive Deep Learning Training ToolAnne Zhao MD, Pathology Informatics Fellow
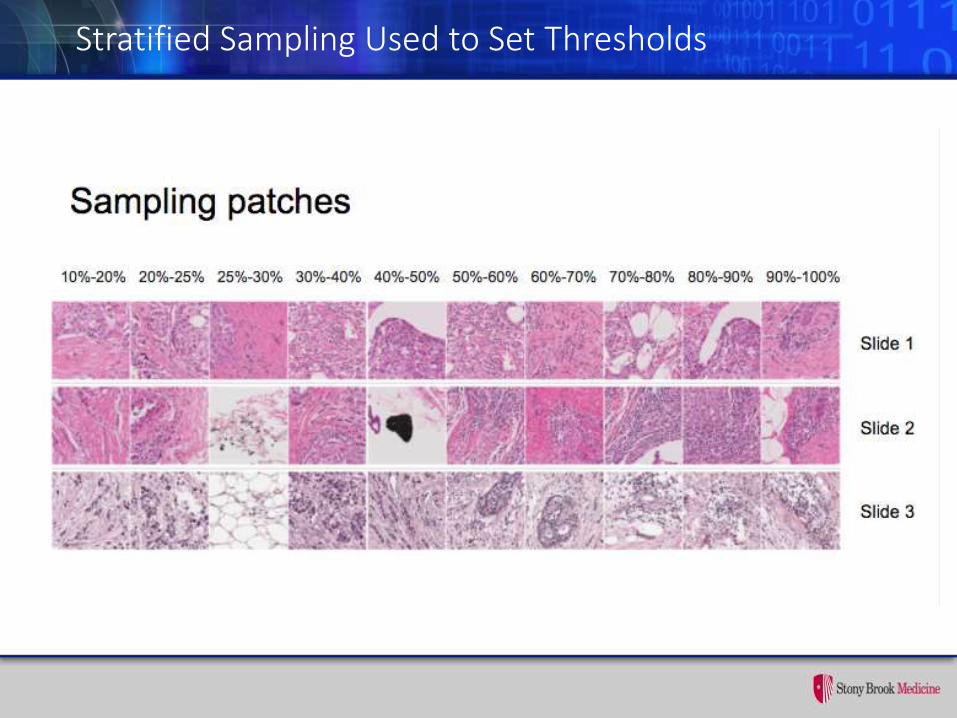
Stratified Sampling Used to Set Thresholds
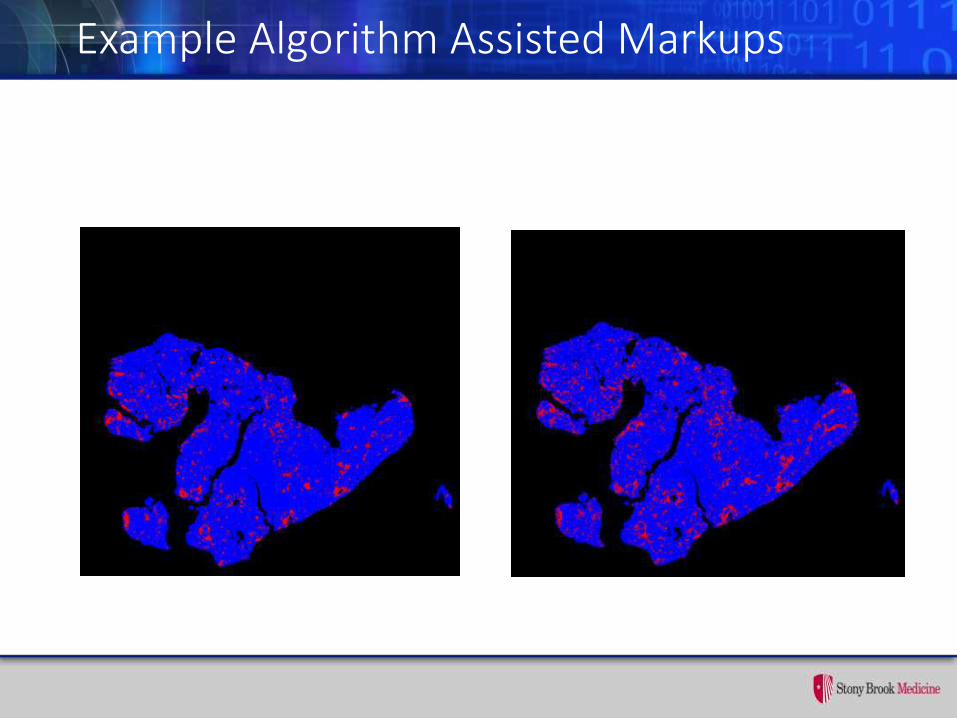
Example Algorithm Assisted Markups
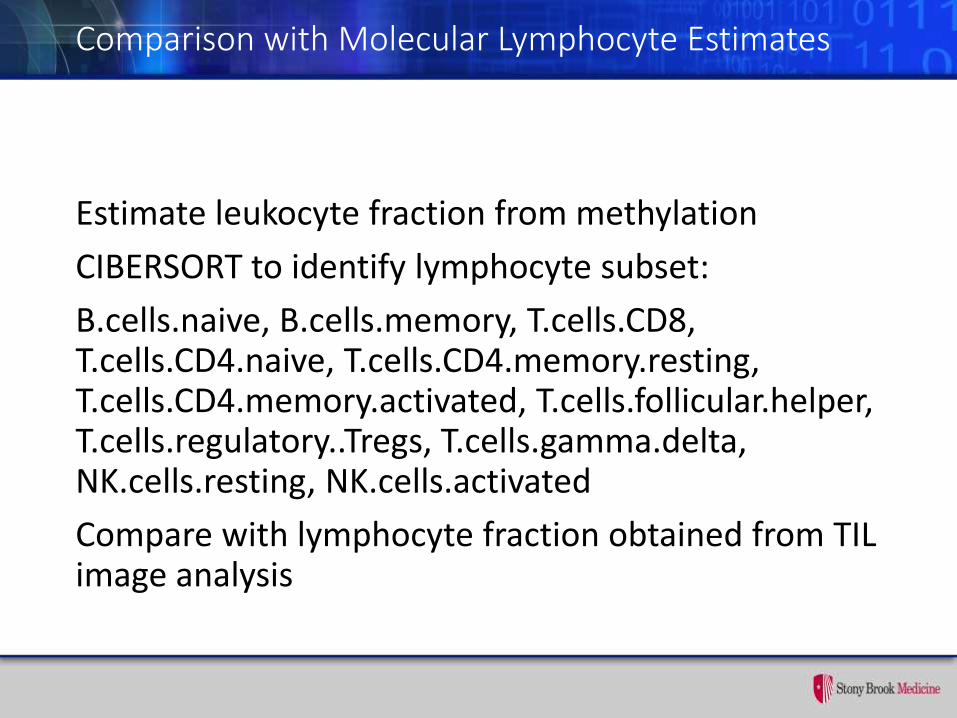
Comparison with Molecular Lymphocyte Estimates
Estimate leukocyte fraction from methylation
CIBERSORT to identify lymphocyte subset:
B.cells.naive, B.cells.memory, T.cells.CD8, T.cells.CD4.naive, T.cells.CD4.memory.resting, T.cells.CD4.memory.activated, T.cells.follicular.helper, T.cells.regulatory..Tregs, T.cells.gamma.delta, NK.cells.resting, NK.cells.activated
Compare with lymphocyte fraction obtained from TIL image analysis
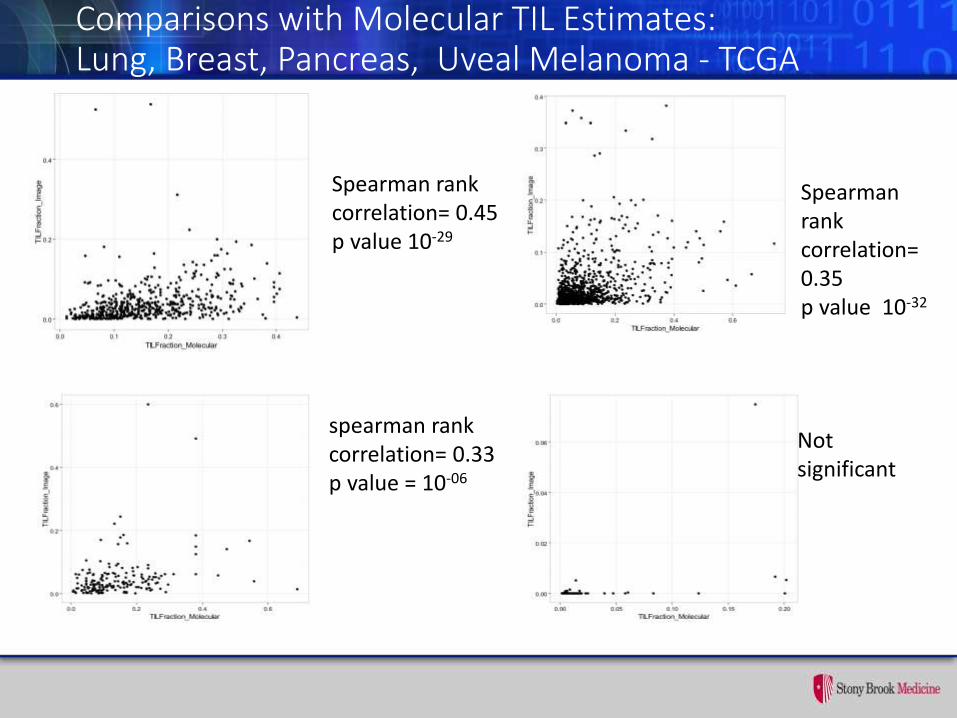
Spearman rankcorrelation= 0.45p value 10-29
Spearman rank correlation= 0.35p value 10-32
spearman rank correlation= 0.33p value = 10-06
Not significant
Comparisons with Molecular TIL Estimates: Lung, Breast, Pancreas, Uveal Melanoma - TCGA
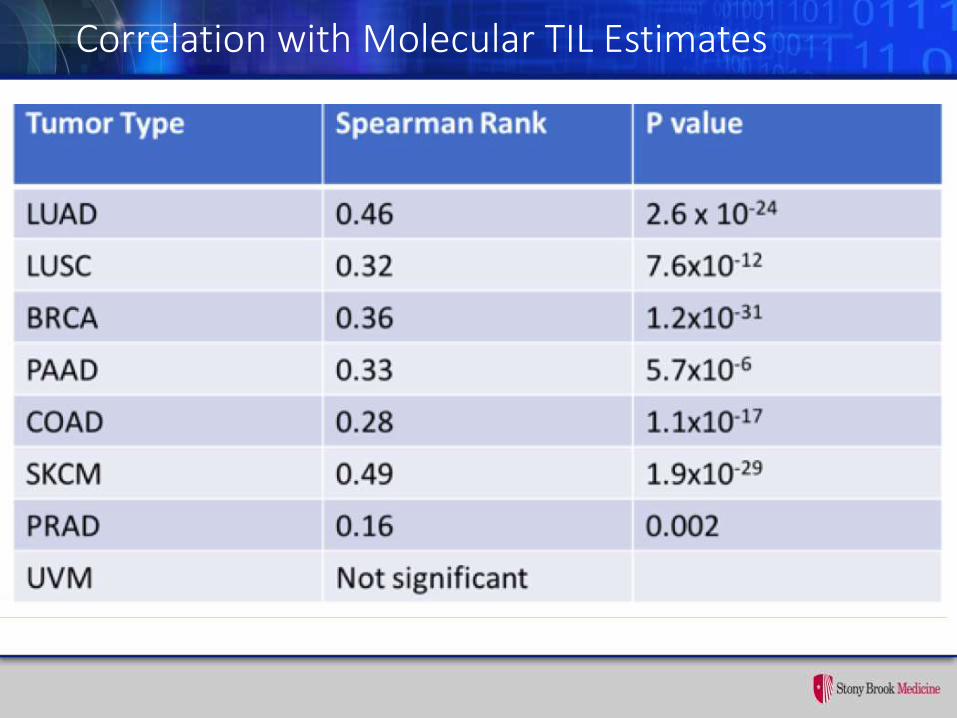
Correlation with Molecular TIL Estimates
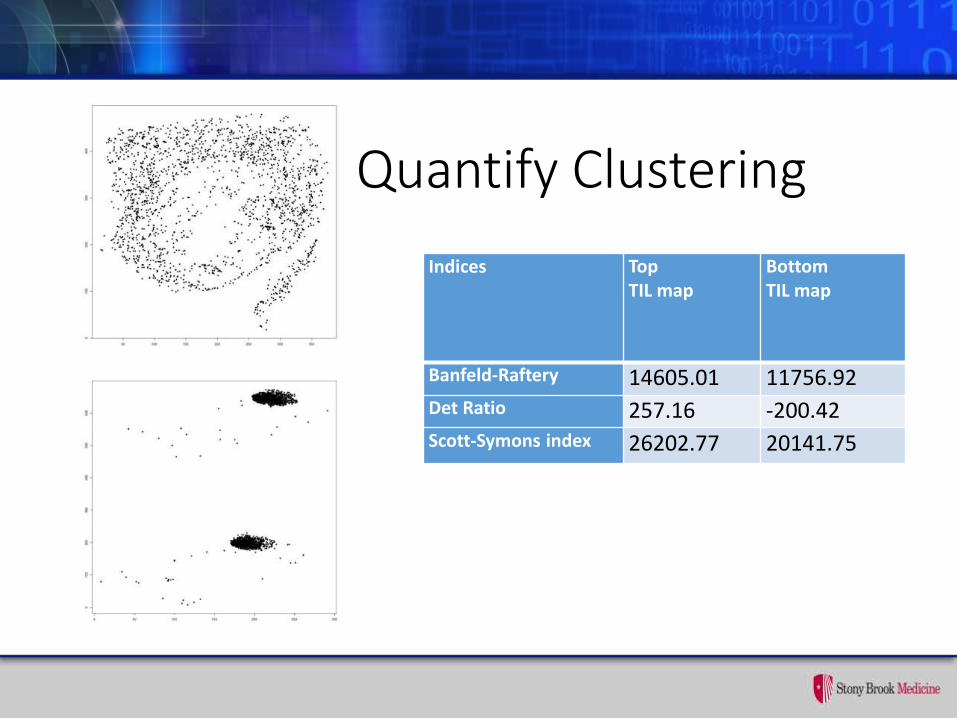
Quantify Clustering
Indices TopTIL map
BottomTIL map
Banfeld-Raftery 14605.01 11756.92Det Ratio 257.16 -200.42Scott-Symons index 26202.77 20141.75
Preliminary Results on Relationship Between TIL Pattern and Outcome
• Preliminary studies based on SKCM within TCGA suggest that these 4 indices are significantly associated with outcome (OS) after adjusting for clinical and molecular correlates (age at diagnosis, gender, mutation load etc.). Further, these were found to retain significance even after adjustment for multiple hypothesis testing
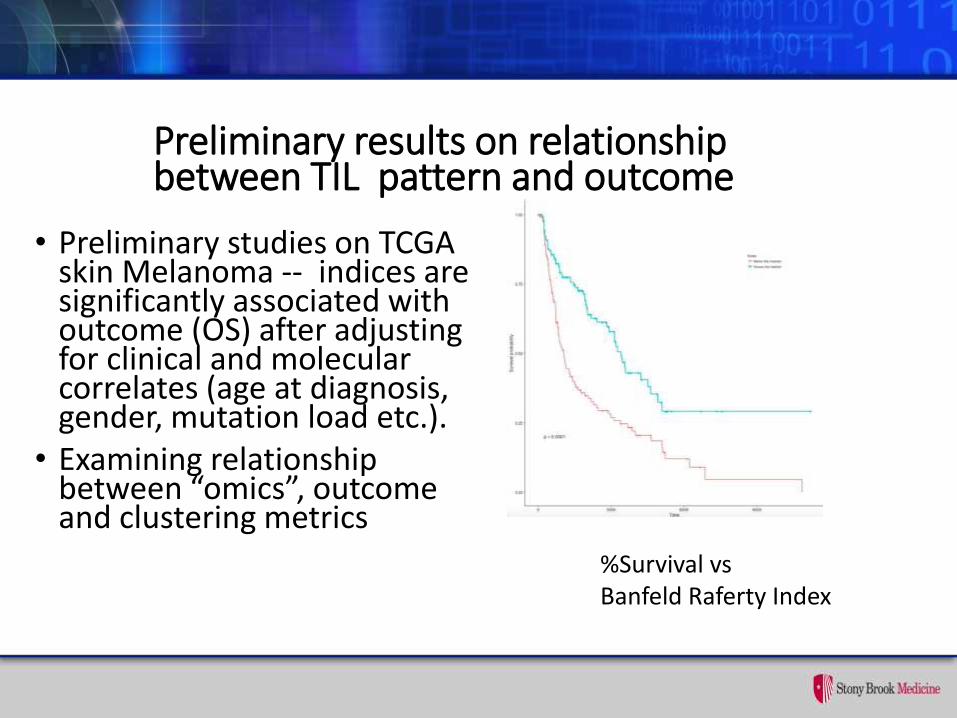
Preliminary results on relationship between TIL pattern and outcome
• Preliminary studies on TCGA skin Melanoma -- indices are significantly associated with outcome (OS) after adjusting for clinical and molecular correlates (age at diagnosis, gender, mutation load etc.).
• Examining relationship between “omics”, outcome and clustering metrics
%Survival vsBanfeld Raferty Index
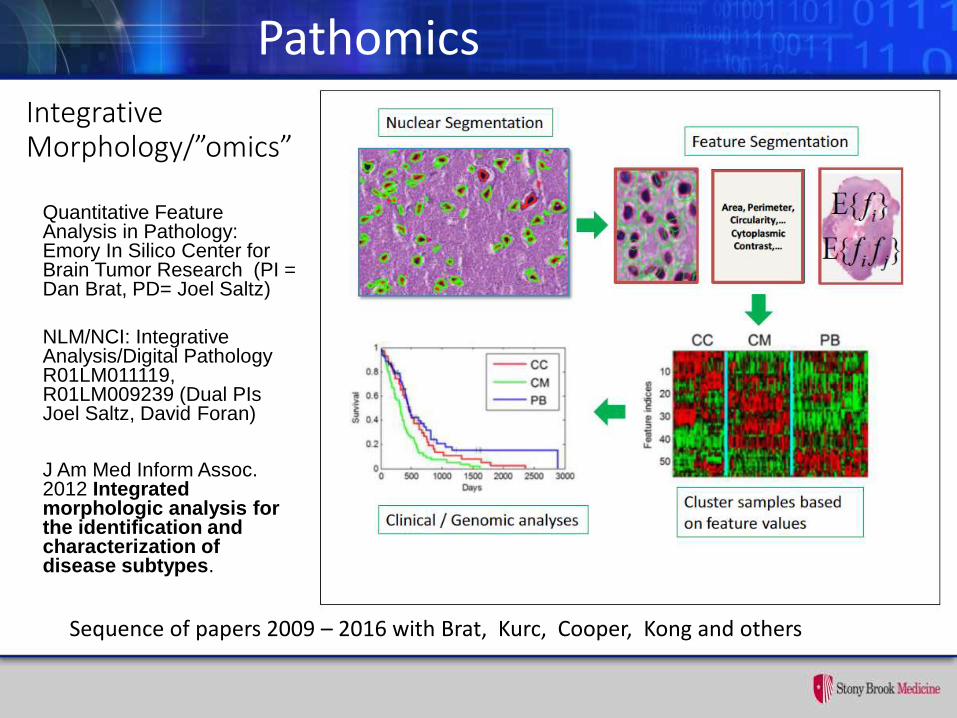
Integrative Morphology/”omics”
Quantitative Feature Analysis in Pathology: Emory In Silico Center for Brain Tumor Research (PI = Dan Brat, PD= Joel Saltz)
NLM/NCI: Integrative Analysis/Digital Pathology R01LM011119, R01LM009239 (Dual PIs Joel Saltz, David Foran)
J Am Med Inform Assoc. 2012 Integrated morphologic analysis for the identification and characterization of disease subtypes.
Pathomics
Sequence of papers 2009 – 2016 with Brat, Kurc, Cooper, Kong and others
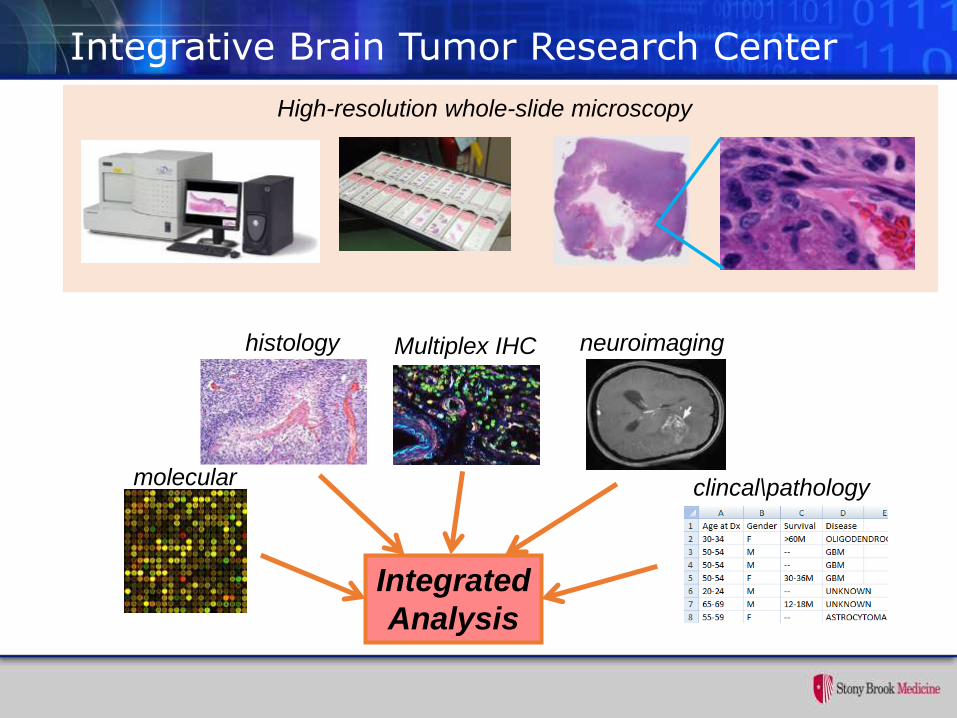
Integrative Brain Tumor Research Center
histology neuroimaging
clincal\pathology
Integrated
Analysis
molecular
High-resolution whole-slide microscopy
Multiplex IHC
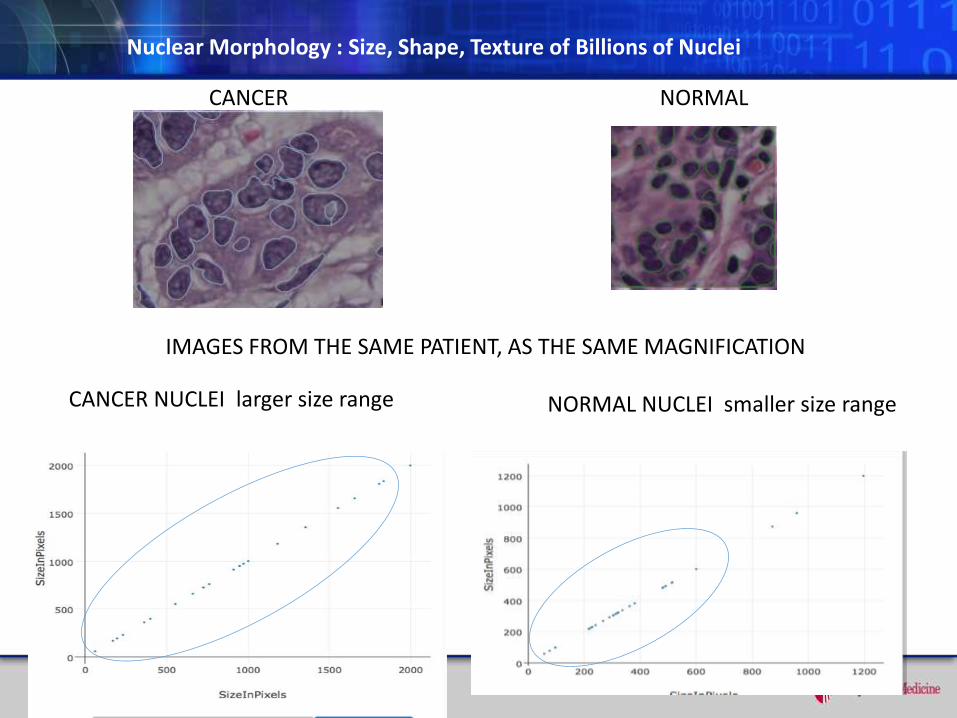
CANCER NUCLEI larger size range NORMAL NUCLEI smaller size range
IMAGES FROM THE SAME PATIENT, AS THE SAME MAGNIFICATION
CANCER NORMAL
Nuclear Morphology : Size, Shape, Texture of Billions of Nuclei
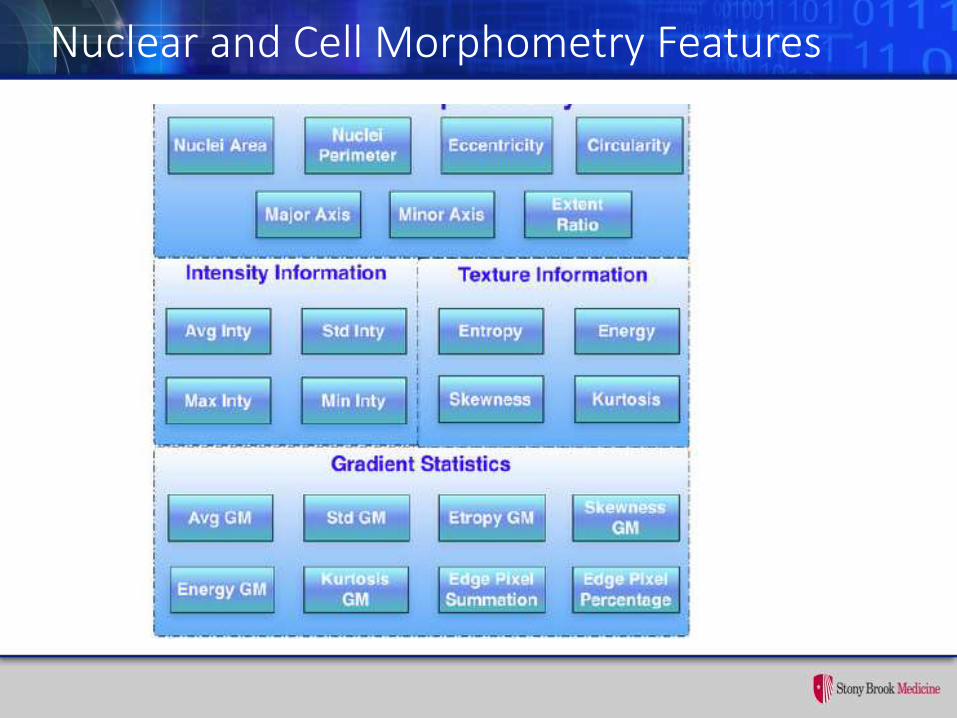
Nuclear and Cell Morphometry Features
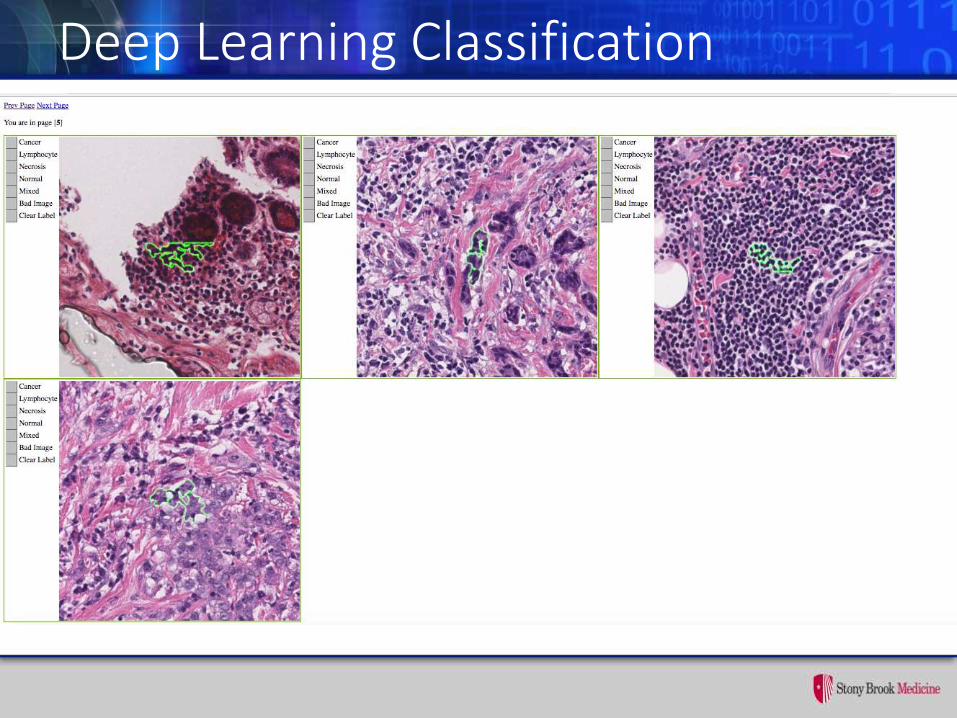
Deep Learning Classification
Tools to Analyze Morphology and Spatially Mapped Molecular Data - U24 CA180924
• Aim 1 Analysis pipelines for multi- scale, integrative image analysis.
• Aim 2: Database infrastructure to manage and query Pathomics features.
• Aim 3: HPC software that targets clusters, cloud computing, and leadership scale systems.
• Aim 4: Develop visualization middleware to relate Pathomics feature and image data and to integrate Pathomics image and “omic” data.
SEER Virtual Tissue Repository
• Lynne Penberthy MD, MPH NCI SEER
• Ed Helton PhD NCI CBIIT Clinical Imaging Program
• Ulrike Wagner CBIIT Clinical Imaging Program
• Radim Moravec NCI PhD, NCI SEER
• Ashish Sharma PhD Biomedical Informatics Emory
• Joel Saltz MD, PhD Biomedical Informatics Stony Brook
• Tahsin Kurc PhD Biomedical Informatics Stony Brook
• Georgia Tourassi, Oak Ridge National Laboratory
Vision – Enable population/epidemiological cancer research that leverages rich cancer phenotype information available from Pathology tissue studies
NCIP/Leidos 14X138 and HHSN261200800001E - NCI

SEER Virtual Tissue Repository
SEER Virtual Tissue Repository
• Create linked collection of de-identified clinical data and whole slide images
• Extract features from a sample set of images (pancreas and breast cancer).
• Enable search, analysis, epidemiological characterization
• Pilot focus on extreme outcome Breast Cancer, Pancreatic Cancer cases
• Display images and analyzed features
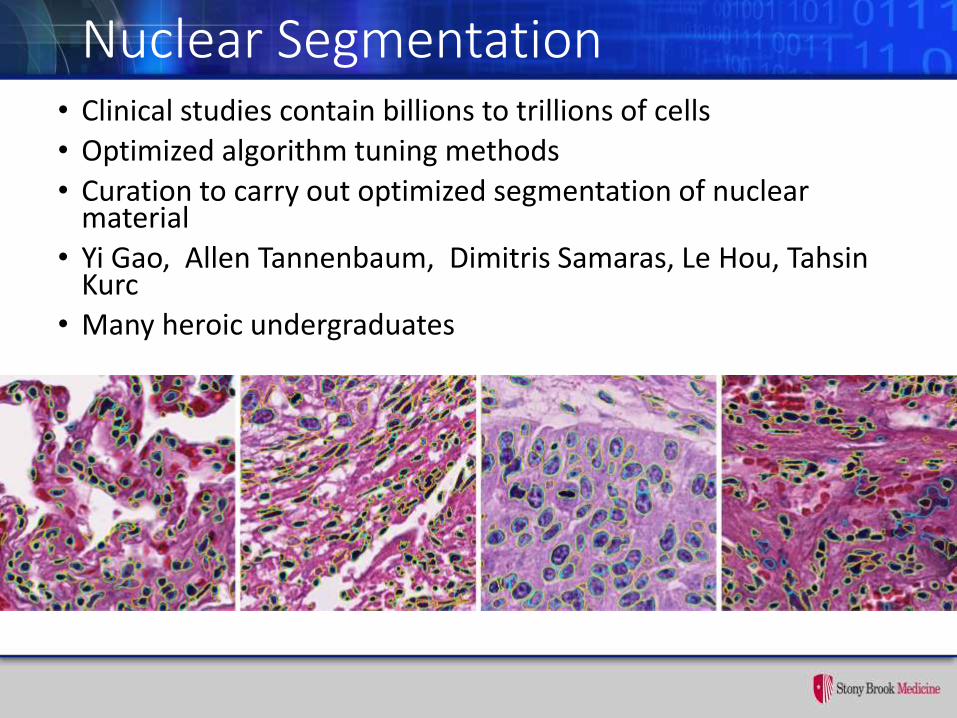
Nuclear Segmentation• Clinical studies contain billions to trillions of cells
• Optimized algorithm tuning methods
• Curation to carry out optimized segmentation of nuclear material
• Yi Gao, Allen Tannenbaum, Dimitris Samaras, Le Hou, TahsinKurc
• Many heroic undergraduates
52
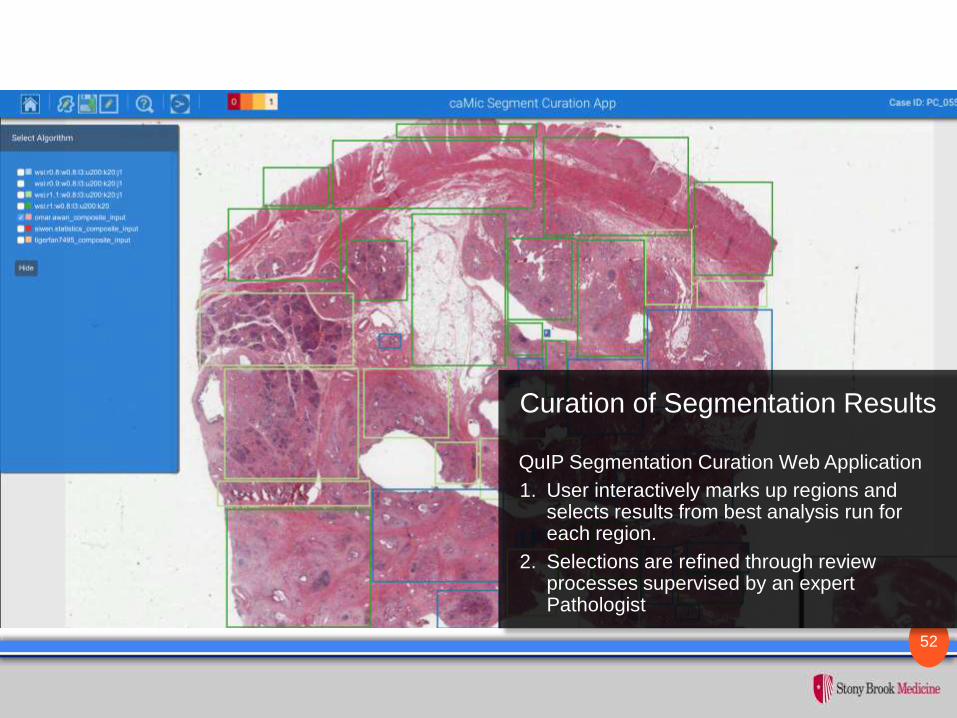
QuIP Segmentation Curation Web Application
1. User interactively marks up regions and selects results from best analysis run for each region.
2. Selections are refined through review processes supervised by an expert Pathologist
Curation of Segmentation Results
Feature Explorer Suite
• Explore Relationship Between Imaging Features, Outcome, ”omics”
• Explore relationships between features and explore how features relate to images
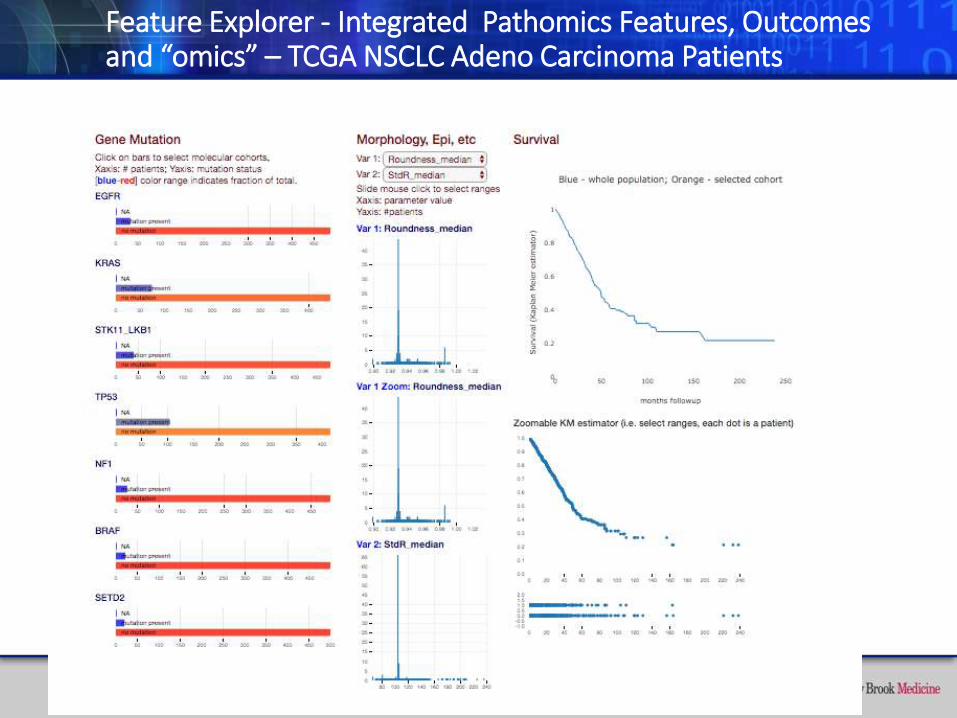
Feature Explorer - Integrated Pathomics Features, Outcomes and “omics” – TCGA NSCLC Adeno Carcinoma Patients
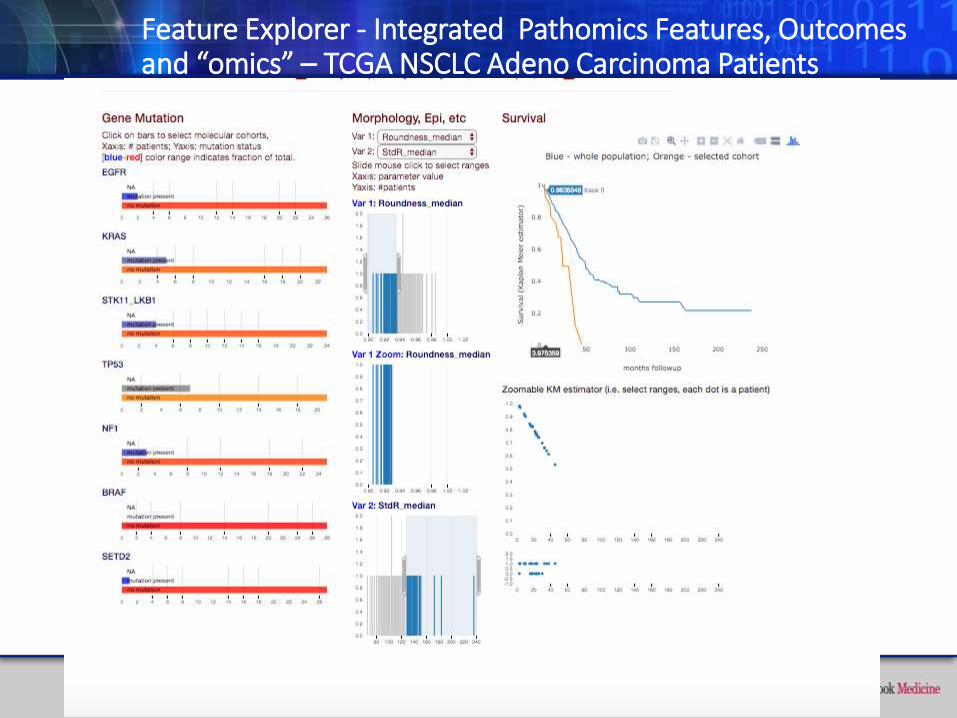
Feature Explorer - Integrated Pathomics Features, Outcomes and “omics” – TCGA NSCLC Adeno Carcinoma Patients
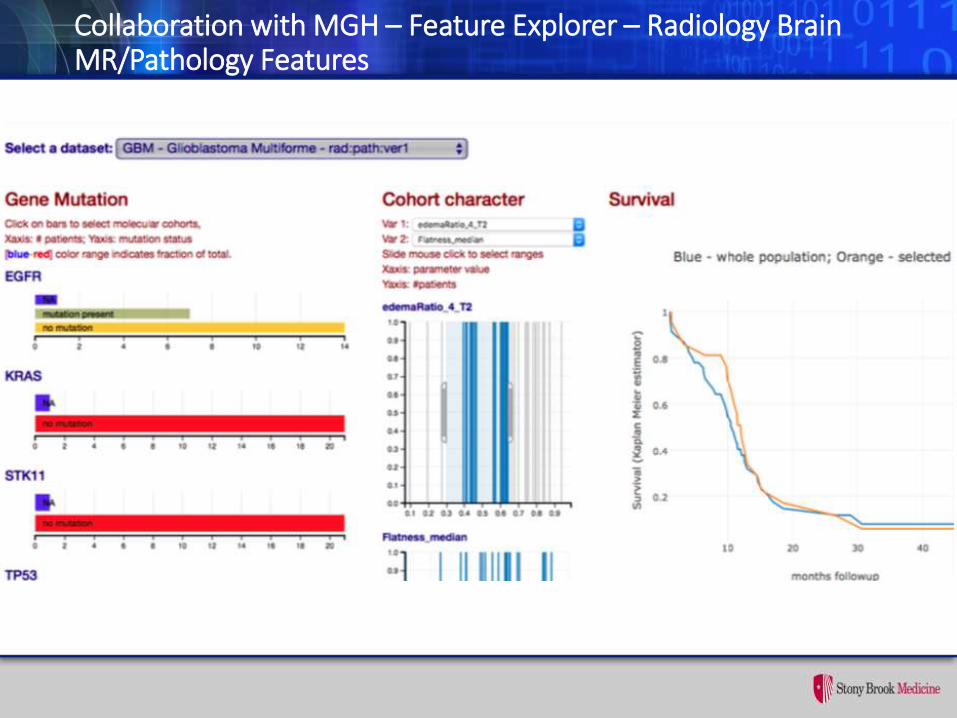
Collaboration with MGH – Feature Explorer – Radiology Brain MR/Pathology Features
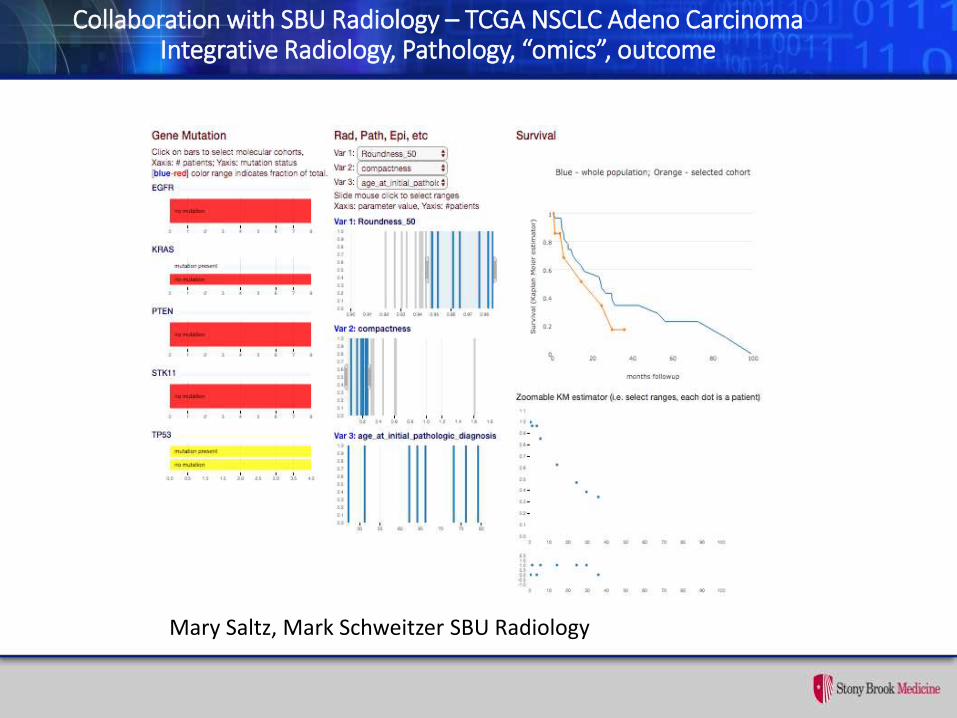
Collaboration with SBU Radiology – TCGA NSCLC Adeno CarcinomaIntegrative Radiology, Pathology, “omics”, outcome
Mary Saltz, Mark Schweitzer SBU Radiology

Pathomics
Relationship Between Image and FeaturesLeveraging Visualization to Aid in Feature Management
Step 1: Choose a case from the TCGA atlas (case #20)Step 2: Select two features of interest; X axis (area), Y axis (perimeter)
Step 3: Zoom in on region of interest
Step 4: Pick a specific nucleus of interest. Each dot represents a single nucleus
Step 5: Evaluate the features selected in the context of the specific nucleus and where this nucleus is located within the whole slide image
The tool provides visual context for feature evaluation. This technique maps both intuitive features (i.e. size, shape, color) and non-intuitive features (i.e. wavelets, texture) to the ground truth of source images through an interactive web-based user interface.
Selected nucleus geolocated within whole slide image
Detects elongated nucleus
Going from the whole slide data set to selected features and back to the image Adding a visual perspective by using a live web-based interactive tool (http://sbu-bmi.github.io/featurescape/u24/Preview.html)
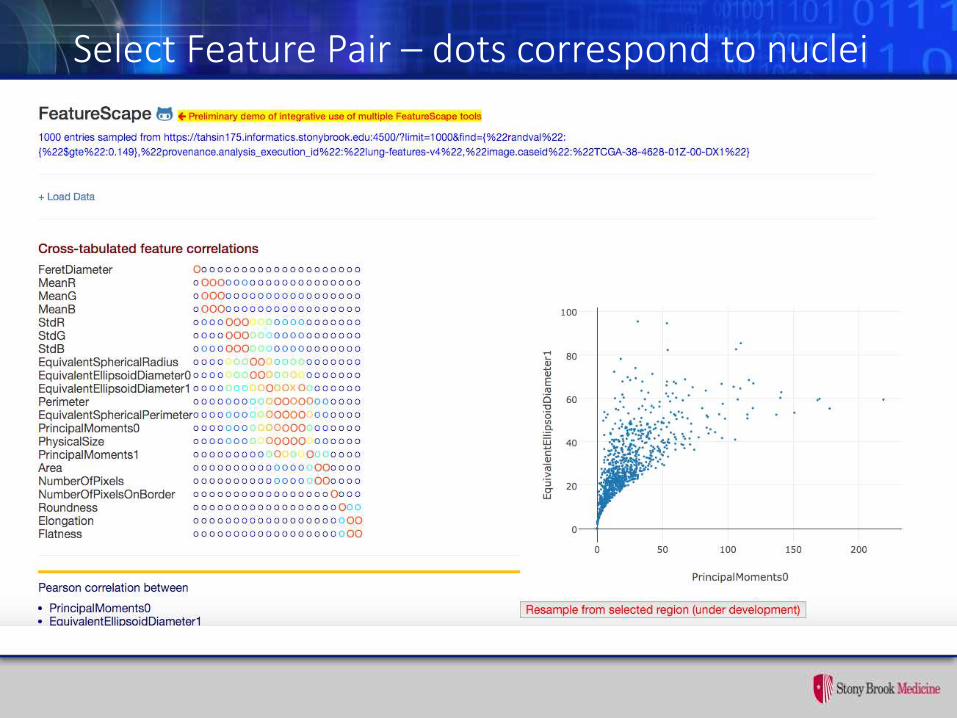
Select Feature Pair – dots correspond to nuclei
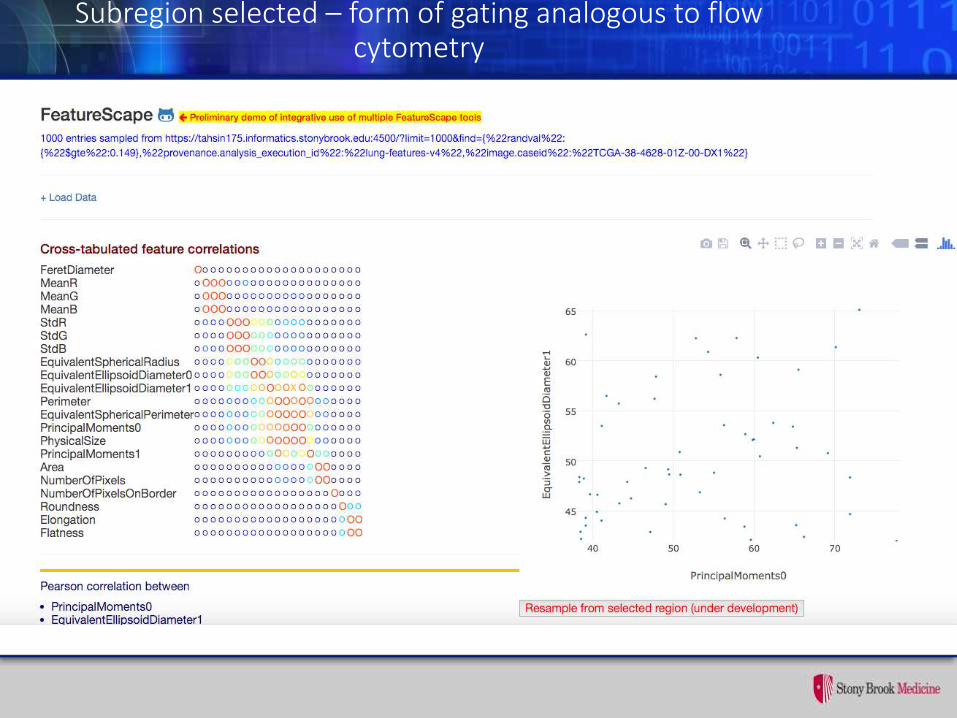
Subregion selected – form of gating analogous to flow cytometry
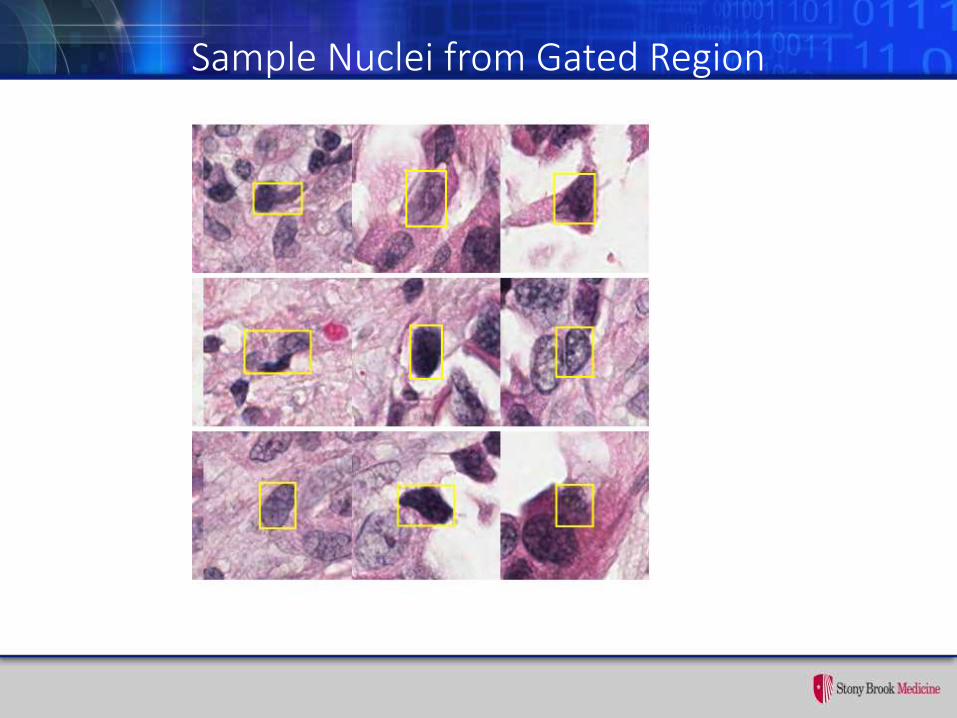
Sample Nuclei from Gated Region

Gated Nuclei in Context
Dissemination
• Containers • Containerized segmentation algorithm/FeatureDB Employed
to support TIES, MICCAI, and competitions supported through Kalpathy-Kramer ITCR
• Full containerized implementation of caMicroscope/FeatureDB/Segmentation algorithm/Feature Scape - Feb 1 2017
• Cloud Pilots• TCIA• HPC via NSF and DOE• TCGA – PanCanAtlas – Lymphocyte characterization• Integrated Features/NLP joint with TIES
ITCR Team
Stony Brook University
Joel Saltz
Tahsin Kurc
Yi Gao
Allen Tannenbaum
Erich Bremer
Jonas Almeida
Alina Jasniewski
Fusheng Wang
Tammy DiPrima
Andrew White
Le Hou
Furqan Baig
Mary Saltz
Emory University
Ashish Sharma
Adam Marcus
Oak Ridge National Laboratory
Scott Klasky
Dave Pugmire
Jeremy Logan
Yale University
Michael Krauthammer
Harvard University
Rick Cummings

Funding – Thanks!
• This work was supported in part by U24CA180924-01, NCIP/Leidos 14X138 and HHSN261200800001E from the NCI; R01LM011119-01 and R01LM009239 from the NLM
• This research used resources provided by the National Science Foundation XSEDE Science Gateways program under grant TG-ASC130023 and the Keeneland Computing Facility at the Georgia Institute of Technology, which is supported by the NSF under Contract OCI-0910735.

Thanks!