Embed Size (px)
Citation preview
Registered charity number 268369
CAF WORLD GIVING INDEX 2015A global view of giving trends
November 2015
3
Contents Foreword
Copyright © Charities Aid Foundation 2015
All rights reserved. No part of this publication may be reproduced, stored in a retrieval system, or transmitted in any form or by any means, including electronic, mechanical, photocopying, recording or otherwise, without the prior written permission of the copyright owner.
Foreword 3 About this report 4Key findings and conclusions 5Universal recommendations 7CAF World Giving Index 2015 map 8
1 Global view 1.1 The CAF World Giving Index Top 20 10 1.2 Global trends across behaviours 13
2 Three giving behaviours 2.1 Helping a stranger 2.1.1 Top 10 countries for helping a stranger,
by participation and population 16 2.1.2 Helping a stranger and gender 17 2.1.3 Helping a stranger and age 18
2.2 Donating money to charity 2.2.1 Top 10 countries for donating money,
by participation and population 19 2.2.2 Donating money and gender 20 2.2.3 Donating money and age 21
2.3 Volunteering time 2.3.1 Top 10 countries for volunteering time,
by participation and population 22 2.3.2 Volunteering time and gender 23 2.3.3 Volunteering time and age 24
3 Continental comparisons 3.1 Continental World Giving Index scores 25 3.2 Continental giving behaviour scores 26
4 Most improved countries 4.1 Most improved countries for 2015 27 4.2 Most improved countries over time 28
Appendices 1 Alphabetical CAF World Giving Index full table 30 2 CAF World Giving Index full table 32 3 Helping a stranger full table 35 4 Donating money full table 37 5 Volunteering time full table 39 6 Methodology 41 7 Surveyed countries 42
The CAF World Giving Index is known around the world as the leading comparative measure of generosity across the globe. By measuring three kinds of generosity – giving money, giving time and helping a stranger – it provides a simple but universally understood picture of global generosity.
The impulse to give, to help others if you can, is a natural human instinct. Many factors affect the capacity and willingness of people to give. The World Giving Index continues to confound attempts to generalise about what makes a nation generous. The aim of the Index is to track how rates of giving change year by year and to stimulate debate about why rates of giving differ between nations and how we can encourage more people to give, in whatever way they can, to help others and strengthen society.
Against a backdrop of continuing global economic uncertainty, it is particularly heartening that the willingness of people to donate money has increased this year. While many Western economies have seen only modest growth in recent years, other economies are experiencing profound and transformative growth. In this context, it is more important than ever that we seize the once-in-a-generation opportunity to encourage those enjoying decent incomes for the first time to support good causes.
That means more than just asking them to give. It means building trusted institutions, good regulation, open and transparent organisations and strong governance so that people can give easily and with confidence.
This applies not just to the developing world, but also to the developed world, where civil society needs constantly to earn people’s trust, so they feel confident that money and time freely given will have the maximum social impact.
Throughout the history of the World Giving Index, we have been surprised and humbled by how people in countries which have suffered adversity continue to score highly, and even give more in some instances – an indication that people really do rally round in times of need. This empathetic reaction is also evident in the reaction to natural and humanitarian disasters which continue to drive giving, even across borders.
In a world still riven by conflict, war and uncertainty, that natural desire of people to help others is something which we should cherish, and nurture.
Dr John LowChief ExecutiveCharities Aid Foundation
54
About this report Key findings and conclusions
Background
The aim of the CAF World Giving Index is to provide insight into the scope and nature of giving around the world. In order to ensure that giving is understood in its various forms, the report looks at three aspects of giving behaviour. The questions that lie at the heart of the report are:
Have you done any of the following in the past month?
Helped a stranger, or someone you didn’t know who needed help?
Donated money to a charity?
Volunteered your time to an organisation?
Fieldwork is conducted by the market research firm, Gallup,1 as part of its World Poll initiative2 that operates in more than 140 countries.
CAF World Giving Index 2015
This sixth edition of the World Giving Index again presents giving data from across the globe over a five year period (2010-2014). The World Giving Index 2015 includes data from 145 countries across the globe that was collected throughout the calendar year of 2014. A full explanation of the methodology used is included in the appendices.
CAF World Giving Index ranking and scores
The method used to calculate World Giving Index scores remains identical to previous years. In order to establish a rounded measure of giving behaviour across the world, the World Giving Index relies on a simple averaging of the responses from the three key questions asked in each country. Each country is given a percentage score and countries are ranked on the basis of these scores.
About us
Charities Aid Foundation (CAF) is a leading international charity registered in the United Kingdom, with nine offices covering six continents. Our mission is to motivate society to give ever more effectively and help transform lives and communities around the world. We do this by working globally to increase the flow of funds to the charity and non-profit sectors through the provision of philanthropy advice and services.
1 Gallup website: www.gallup.com/home.aspx2 Gallup World Poll website: www.gallup.com/strategicconsulting/worldpoll.aspx
Myanmar tops the CAF World Giving Index
As well as maintaining its top ranking for donating money, Myanmar also secures first place for volunteering time – the first country to be placed top for two of the three ways of giving since 2010. As highlighted previously, Myanmar’s strong culture of Theravada Buddhism,3 in which devotees practice Sangha Dana,4 continues to drive high levels of giving. Myanmar deserves to be lauded for its culture of generosity but sadly, the achievement will inevitably be contrasted to the continuing plight of the Rohingya people within the country.
Religious practices are also at the root of some of the other changes seen within the Index
In addition to the impact of Theravada Buddhism in Myanmar, religious holidays are seen to have an impact elsewhere. Muslim populations are responsible for the significant improvement in world rankings this year for Kyrgyzstan and Kazakhstan5 (up sixty-five and forty-five places respectively). For this year’s report, both countries were surveyed either during or just after Ramadan, when generosity is particularly encouraged, and both countries experienced a year-on-year increase for all three ways of giving, but most notably donating money.
The cultural heritage of a country can also impact on giving behaviours
Turkmenistan, previously ranked number one for volunteering in every year surveyed for the World Giving Index, dropped to sixty-sixth position this year. This reflects the cancellation of ‘Saturday subbotniks’ in Turkmenistan during 2014. Subbotniks – the giving up of a Saturday to volunteer or perform unpaid labour, sometimes by mandatory instruction – are widespread in many former Soviet States and, as highlighted in previous reports, are likely to inflate volunteering levels reported in these countries.6
And disruptive events continue to have an influence
As the World Giving Index demonstrates repeatedly, across all different geographies and cultures, people universally appear to respond to those in need. The proportion of people donating money in Ukraine more than quadrupled in 2014 compared to the previous year, likely due to fundraising efforts for those affected by the conflict.7 Iraq comes top in helping a stranger for the first time despite continuing security concerns in the country. Indeed, the remarkable resilience of genersoity in Iraq, which has a strong and diverse culture of religious, tribal and community giving, may well be in some part a response to increased need. Finally, Croatia, Montenegro, Serbia and Bosnia and Herzegovina all experienced notable increases in donating money, reflecting the fundraising efforts following extensive flooding throughout Southern Europe in May 2014.
At a global level, donating money is up this year
Almost a third (31.5%) gave money to a charity in the month prior to interview – a rise of 3.2 percentage points since 2013. Encouragingly, participation levels for donating money have increased across all world economy types, where previously developed and developing economies had experienced marginal declines in giving money between 2012 and 2013.
3 Approximately 89% of Myanmarese are Buddhist https://www.cia.gov/library/publications/the-world-factbook/geos/th.html 4 Sangha defined as ‘ordained monks and nuns’, Dana defined as ‘charitable giving’, resulting in a broad definition of ‘charity to the community of
monks’. Myanmar has an estimated 500,000 monks (the highest proportion of monks to population of any Buddhist country), all receiving support from lay devotees.
5 The majority of the population in these countries is Muslim: Kazakhstan 70%, Kyrgyzstan 75% Source: https://www.cia.gov/library/publications/resources/the-world-factbook/
6 World Giving Index 2014, section 2.3.1: https://www.cafonline.org/pdf/CAF_WGI2014_Report_1555AWEBFinal.pdf7 http://www.eurasianet.org/node/70816 and http://www.bbc.co.uk/news/world-europe-28459772 and http://www.reuters.com/
article/2014/12/18/us-ukraine-crisis-volunteers-idUSKBN0JW26Z20141218
76
Although, behaviour in a few very large countries can impact significantly on the number of people giving worldwide
Despite an increase in average global participation levels for donating money and helping a stranger, the actual number of people taking part in all three ways of giving has fallen. This is due to a number of large countries, most notably India and China, where decreased participation translates to tens of millions fewer people giving. Indeed, of the world’s ten most populous countries (which constitute sixty per cent of the world’s population aged 15 and over),8 seven rank outside of the World Giving Index Top 50 this year, with five even outside of the Top 100.
For the first time since 2008, men are more likely to give money than women
Whilst women in developed economies still remain more likely to donate money than men, the differential has narrowed to the smallest gap ever recorded by the World Giving Index. This, combined with the already higher participation level of men in both transitioning and developing economies, means that, at a global level, men are now marginally ahead of women in terms of donating money.
Having fallen back last year, there has been a recovery in younger people giving this year
Those in the youngest age group (15-29) increased participation in all three ways of giving the most, with donating money more than recovering the ground lost in 2013.
8 World Population Prospects, the 2012 Revision, June 2013, United Nations Department of Economic and Social Affairs: http://esa.un.org/wpp/
Universal recommendations
Governments around the world should:
n make sure not-for-profit organisations are regulated in a fair, consistent and open way
n make it easy for people to give and offer incentives for giving where possible
n promote civil society as an independent voice in public life and respect the right of not-for-profit organisations to campaign
n ensure not-for-profit organisations are transparent and inform the public about their work
n encourage charitable giving as nations develop their economies, taking advantage of the world’s growing middle classes.
Through our Future World Giving programme, we have developed a framework of more detailed recommendations that, if followed by governments, should future proof the growth of generosity and provide an enabling environment for improved civil society.
Further information on CAF’s Future World Giving programme can be found at: http://futureworldgiving.org
98
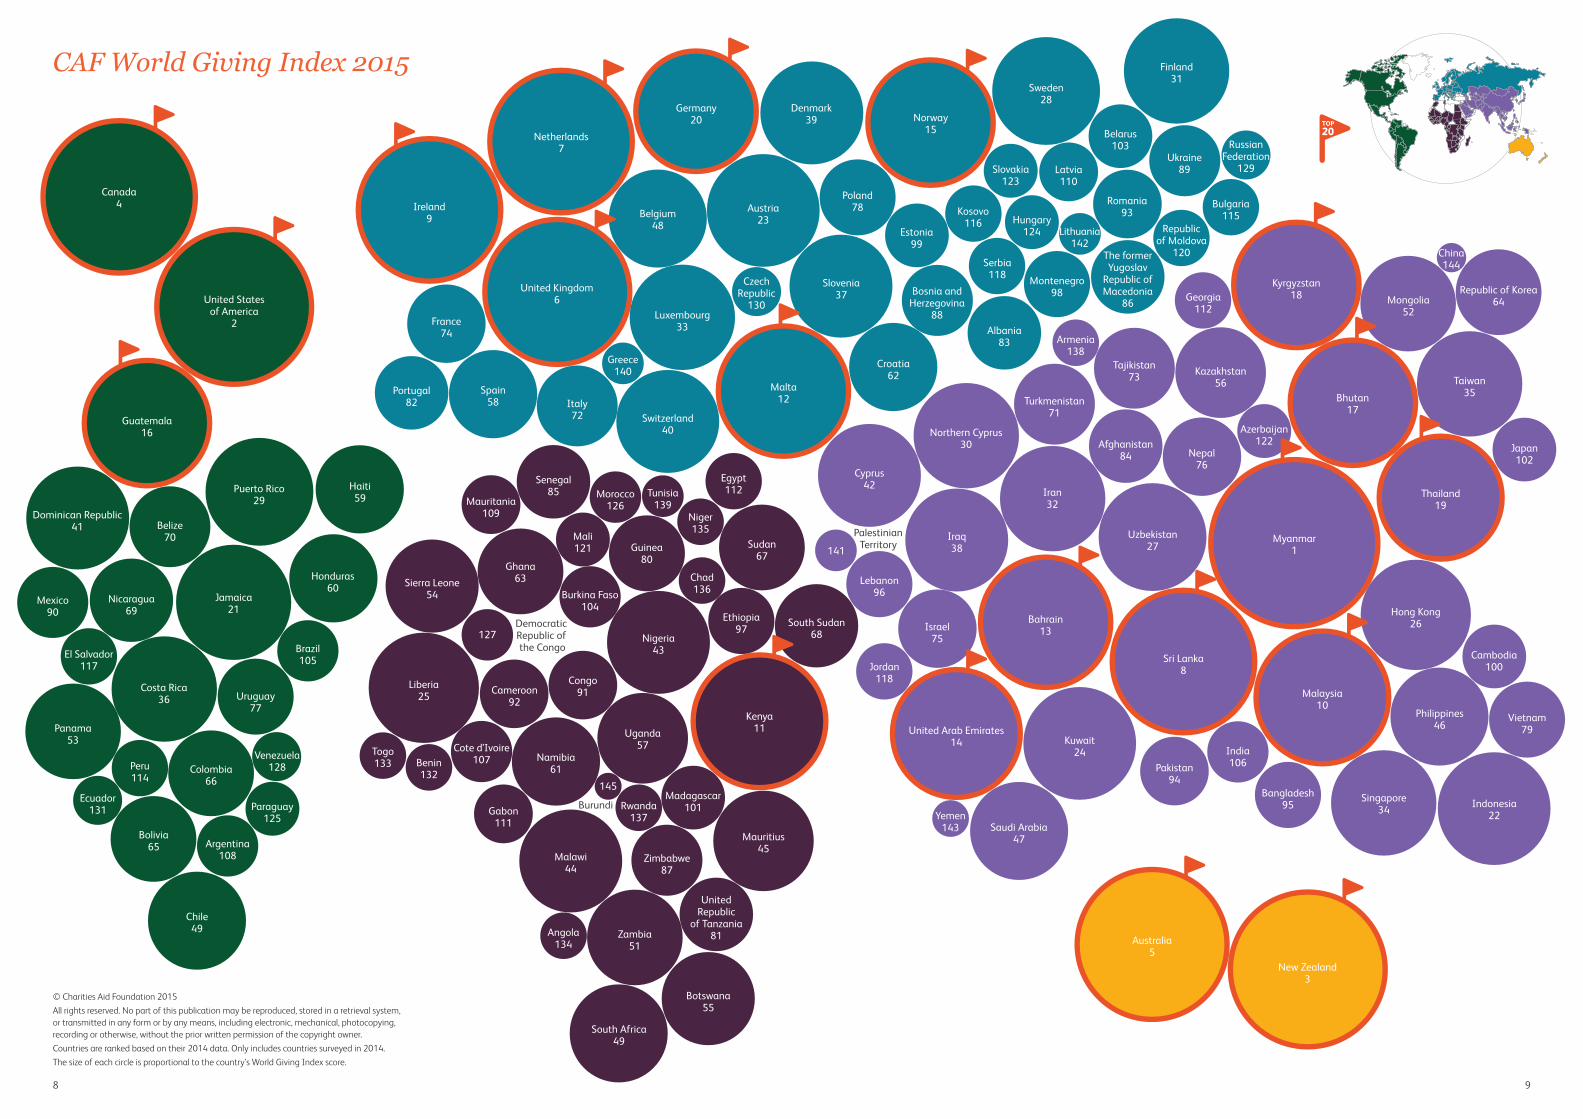
© Charities Aid Foundation 2015All rights reserved. No part of this publication may be reproduced, stored in a retrieval system, or transmitted in any form or by any means, including electronic, mechanical, photocopying, recording or otherwise, without the prior written permission of the copyright owner.Countries are ranked based on their 2014 data. Only includes countries surveyed in 2014. The size of each circle is proportional to the country’s World Giving Index score.
CAF World Giving Index 2015
TOP 20
United States of America
2
Canada4
Jamaica21
Guatemala16
Honduras60
Uruguay77
Nicaragua69
Belize70
Peru114
Paraguay125
Argentina108
Mexico90
El Salvador117
Ecuador131
Venezuela128
Brazil105
Panama53
Costa Rica36
Chile49
Bolivia65
Colombia66
Dominican Republic41
Puerto Rico29
Haiti59
New Zealand3
Australia5
Kenya11
Nigeria43
Namibia61
Uganda57
Cameroon92
Botswana55
Cote d’Ivoire107
Gabon111
Togo133
Ethiopia97
Senegal85
United Republic
of Tanzania81
Burkina Faso104
Zimbabwe87
Angola134
Congo91
Niger135
Benin132
Madagascar101Rwanda
137
127
Morocco126
Chad136
Mauritania109
Mali121
Egypt112Tunisia
139
Liberia25
Sudan67
South Sudan68
Zambia51
Malawi44
Mauritius45
Guinea80
Ghana63Sierra Leone
54
South Africa49
145
Burundi
Democratic Republic of the Congo
Germany20
Ireland9
United Kingdom6
Malta12
Spain58
Hungary124
Portugal82 Italy
72
Belarus103
Albania83
Latvia110
France74
Slovakia123
Republic of Moldova
120
Bosnia and Herzegovina
88
Estonia99
Ukraine89
Romania93
CzechRepublic
130
Lithuania142
Greece140
Serbia118
Bulgaria115
Croatia62
Montenegro98
Poland78
The former Yugoslav
Republic of Macedonia
86Luxembourg
33
Finland31
Slovenia37
Kosovo116
Sweden28
Austria23
Switzerland40
Denmark39
Netherlands7
Norway15
Belgium48
RussianFederation
129
Thailand19
Mongolia52
Myanmar1
Vietnam79
Kyrgyzstan18
Indonesia22
Singapore34
Philippines46
Sri Lanka8
Bhutan17
Tajikistan73 Taiwan
35
Republic of Korea64
Japan102
Cambodia100
China144
Turkmenistan71
Iran32
Iraq38
Lebanon96
Jordan118
141
PalestinianTerritory
Yemen143
Nepal76
Israel75
Saudi Arabia47
India106
Bangladesh95
Afghanistan84
Azerbaijan122
Armenia138
Pakistan94
Cyprus42
Georgia112
Northern Cyprus30
Uzbekistan27
Bahrain13
United Arab Emirates14 Kuwait
24
Kazakhstan56
Malaysia10
Hong Kong26

1110
1 Global view
Table 1 Top 20 countries in the World Giving Index, with score and participation in giving behaviours
CAF World Giving Index
ranking
CAF World Giving Index
score (%)
Helping a stranger score (%)
Donating money
score (%)
Volunteeringtime
score (%)
Myanmar 1 66 55 92 50
United States of America 2 61 76 63 44
New Zealand 3 61 65 73 45
Canada 4 60 69 67 44
Australia 5 59 66 72 40
United Kingdom 6 57 63 75 32
Netherlands 7 56 59 73 36
Sri Lanka 8 56 60 59 48
Ireland 9 56 59 67 41
Malaysia 10 52 62 58 37
Kenya 11 52 74 39 43
Malta 12 51 50 78 26
Bahrain 13 51 71 51 30
United Arab Emirates 14 50 69 59 22
Norway 15 49 55 60 32
Guatemala 16 49 68 38 41
Bhutan 17 49 53 55 38
Kyrgyzstan 18 49 53 57 36
Thailand 19 48 44 87 14
Germany 20 47 61 49 32 Only includes countries surveyed in 2014.
Data relate to participation in giving behaviours during one month prior to interview.
World Giving Index scores are shown to the nearest whole number but the rankings are determined using two decimal points.
Analysis covering the five-year period 2010-201410 (Table 2) shows that nine countries are included in the five-year Top 20 that do not appear in this year’s list: Qatar, Indonesia, Hong Kong, Iran, Denmark, Liberia, Austria, Jamaica and Cyprus. These countries were either not surveyed during 2014, were displaced by new entrants or were found not to have engagement levels as high as in previous years.
Myanmar, with its consistently strong performance since joining the Index in 2012, debuts at number one in this average over-time Top 20 list.
Only five of the countries appearing in this five-year average Top 20 are also members of the Group of Twenty (G20), one less than last year. This group is made up of the world’s largest economies plus a representative from the European Union.11
10 Relates to the year that surveying took place – equates to 2011-2015 World Giving Index reports11 Members of the G20 are; Argentina, Australia, Brazil, Canada, China, France, Germany, India, Indonesia, Italy, Japan, the Republic of Korea, Mexico,
Russia, Saudi Arabia, South Africa, Turkey, the United Kingdom, the United States of America plus the European Union. Turkey is not featured in this year’s World Giving Index
1.1 The CAF World Giving Index Top 20
Myanmar is ranked first in the World Giving Index for 2015, having previously shared this position with the United States last year. The score of 66% achieved is the highest on record (see Table 1). Myanmar once again records the highest incidence of donating money (92%), and this year it also leads the world in terms of volunteering (50%) – the first country to come top in two of the three ways of giving since Liberia in 2010.
As highlighted in last year’s report, the majority of Myanmarese people are highly devout Theravada Buddhists, regularly giving money and time to ordained monks and nuns, and for the upkeep of temples. Such charitable giving is integral to religious observance among Theravada Buddhists and whilst, in many cases, the amounts given will be very small, they still have significant religious meaning and so individuals give regularly, sometimes even on a daily basis. By topping the World Giving Index ranking Myanmar will likely, and rightly, receive a lot of attention, not least because as a country classified by the World Bank as Lower Middle Income, it confounds assumptions about the association between wealth and generosity. Inevitably, such an achievement will be contrasted with recent reports about the suffering, and contested rights of the Rohingya people. At this point, it is important to remember that the World Giving Index measures only the charitable activities of the general population within a country, and does not take wider issues affecting society into account. As such, we make no attempt to rationalise negative or mitigating factors in the World Giving Index ranking.
The United States is now placed second in the World Giving Index, with an overall score of 61%. This is directionally down from the 64% reported in last year’s report, which appears to be driven primarily by a fall in the proportion of people donating money (63% vs. 68%), with a drop from ninth to twelfth position in the world for this behaviour.
The countries which comprise the Top 10 remain largely the same as those reported in 2014. Following its first ever placement outside of the Top 10 last year, the Netherlands reappears in seventh place, with uplifts reported across all three ways of giving. Malaysia and Kenya, both among the most improved countries last year, have maintained these increases in giving to remain in the Top 20 for 2015.
Bahrain, United Arab Emirates, Guatemala and Kyrgyzstan are all in the Top 20 for the first time, whilst Norway, Thailand and Germany have returned to the Top 20 having featured in previous years. Rankings result from a mix of improved performance, countries new to the survey entering the Index, and other countries not being surveyed this year.9
Kyrgyzstan has experienced the second biggest move up the rankings, rising sixty-five places to eighteenth thanks largely to a fourfold increase in donating money compared to the previous year. This is due, at least in part, to interviewing occurring during the month of Ramadan at which time followers of Islam are encouraged to give money and to help those in need. In previous years Kyrgyzstan has usually been surveyed before Ramadan has begun, so it would not have affected giving levels.
Ranked eighteenth in last year’s report, Denmark has fallen twenty-one places to thirty-ninth in the World Giving Index this year, reflecting a 10 percentage point drop in the proportion of people donating money, returning it to the level recorded in 2012.
9 Countries in the Top 20 for the 2014 report that were not surveyed for this 2015 report are Trinidad and Tobago, and Iceland. Countries that are in the Top 20 for 2015, but were not surveyed for the 2014 report are Norway, Bahrain and the United Arab Emirates

1312
Table 2 Top 20 countries in the 5 year World Giving Index, with score and participation in giving behaviours
Five-year score and averages: data represents average participation in countries surveyed in three or more different calendar years in period 2010–2014.
One-year score: only includes countries surveyed in 2014.
Data relate to participation in giving behaviours during one month prior to interview.
CAF World Giving Index and difference scores are shown to the nearest whole number but the rankings are determined using two decimal points.
1.2 Global trends across behaviours
Globally, the most notable movement in giving is for donating money, with an uplift of 3.2 percentage points between 2013 and 2014 (see Figure 1). This follows a marginal decline in participation between 2012 and 2013, with increased donation levels potentially a result of the stabilisation in GDP growth following a decline in 2012.
Helping a stranger has seen a small uplift this year, whilst volunteering time experiences a small downturn.
Figure 1 Global gross domestic product (GDP) growth rate and global participation in donating money, volunteering time and helping a stranger, over 5 years
CAF World Giving Index
5 year ranking
CAF World Giving Index
5 year score (%)
Helping a stranger 5 year
average (%)
Donating money 5 year
average (%)
Volunteeringtime
5 year average (%)
CAF World Giving Index
1 year score (%)
Difference between
1 and 5 year score (%)
Myanmar 1 63 50 89 48 66 3
United States of America
2 61 75 63 44 61 1
Ireland 3 58 64 73 38 56 -3
New Zealand 4 58 68 66 41 61 3
Canada 5 58 66 67 41 60 2
Australia 6 58 66 70 37 59 1
United Kingdom 7 55 62 75 29 57 1
Netherlands 8 54 54 72 36 56 2
Sri Lanka 9 51 56 51 47 56 5
Qatar 10 47 71 55 16 n/a n/a
Malta 11 47 45 72 25 51 4
Indonesia 12 46 38 68 32 46 0
Hong Kong 13 46 57 66 15 45 0
Iran 14 46 61 52 24 43 -3
Denmark 15 45 53 60 22 42 -3
Thailand 16 45 42 78 15 48 3
Liberia 17 45 78 10 45 45 1
Austria 18 45 53 53 28 46 2
Jamaica 19 44 71 25 35 47 3
Cyprus 20 43 55 47 26 42 -1
Data represents average participation in countries surveyed in three or more different calendar years in period 2010-2014.
Data relate to participation in giving behaviours during one month prior to interview.
GDP data is sourced from the International Monetary Fund’s World Economic Outlook database. Data is given in terms of constant year-on-year prices.
Reviewing giving by broad economic groups12 (see Figure 2), shows that donating money has increased across all economy types, but most notably those countries classified as ‘in transition’ from a Soviet-style planned economy to a market economy (up 11.5 percentage points year-on-year). Of the 17 countries comprising this group, only four failed to report an increase in donating money participation between 2013 and 2014.
A number of countries in this group were surveyed during or just following Ramadan when charitable giving is particularly encouraged, whilst others corresponded with fundraising efforts for the unprecedented flooding which affected countries including Bosnia and Herzegovina and Serbia in May-June 2014.13 In addition, the proportion of people donating money in Ukraine more than quadrupled in 2014 compared to the previous year, where fundraising efforts for those affected by the conflict ran
12 Based on UN classifications, countries are classified into three broad categories: developed economies, economies in transition and developing economies. These groups reflect basic economic conditions in the country and are mutually exclusive for the purposes of analysis. ‘Developing’ describes economies that are generally in the process of industrialisation with less infrastructure and lower living standards than a ‘developed’ economy. ‘Transitioning’ economies are those that, while they may also be looking to develop, are in the process of transitioning from a Soviet-style planned economy to a market economy. Full list available: http://www.un.org/en/development/desa/policy/wesp/wesp_archive/2015wesp-stats-en.pdf
13 http://www.bbc.co.uk/news/world-europe-27501401
GDP 5.4 GDP 4.2 GDP 3.4 GDP 3.4 GDP 3.4
30.227.5 28.6 28.3
31.5
0
10
20
30
40
50
60
0
1.0
2.0
3.0
4.0
5.0
6.0
2010 2011 2012 2013 2014
47.345.4
47.4 48.5 48.9
20.0 18.7 19.7 21.3 21.0
Figure 1: Global gross domestic product (GDP) growth rate and global participation in donating money, volunteering time and helping a stranger, over 5 years
1514
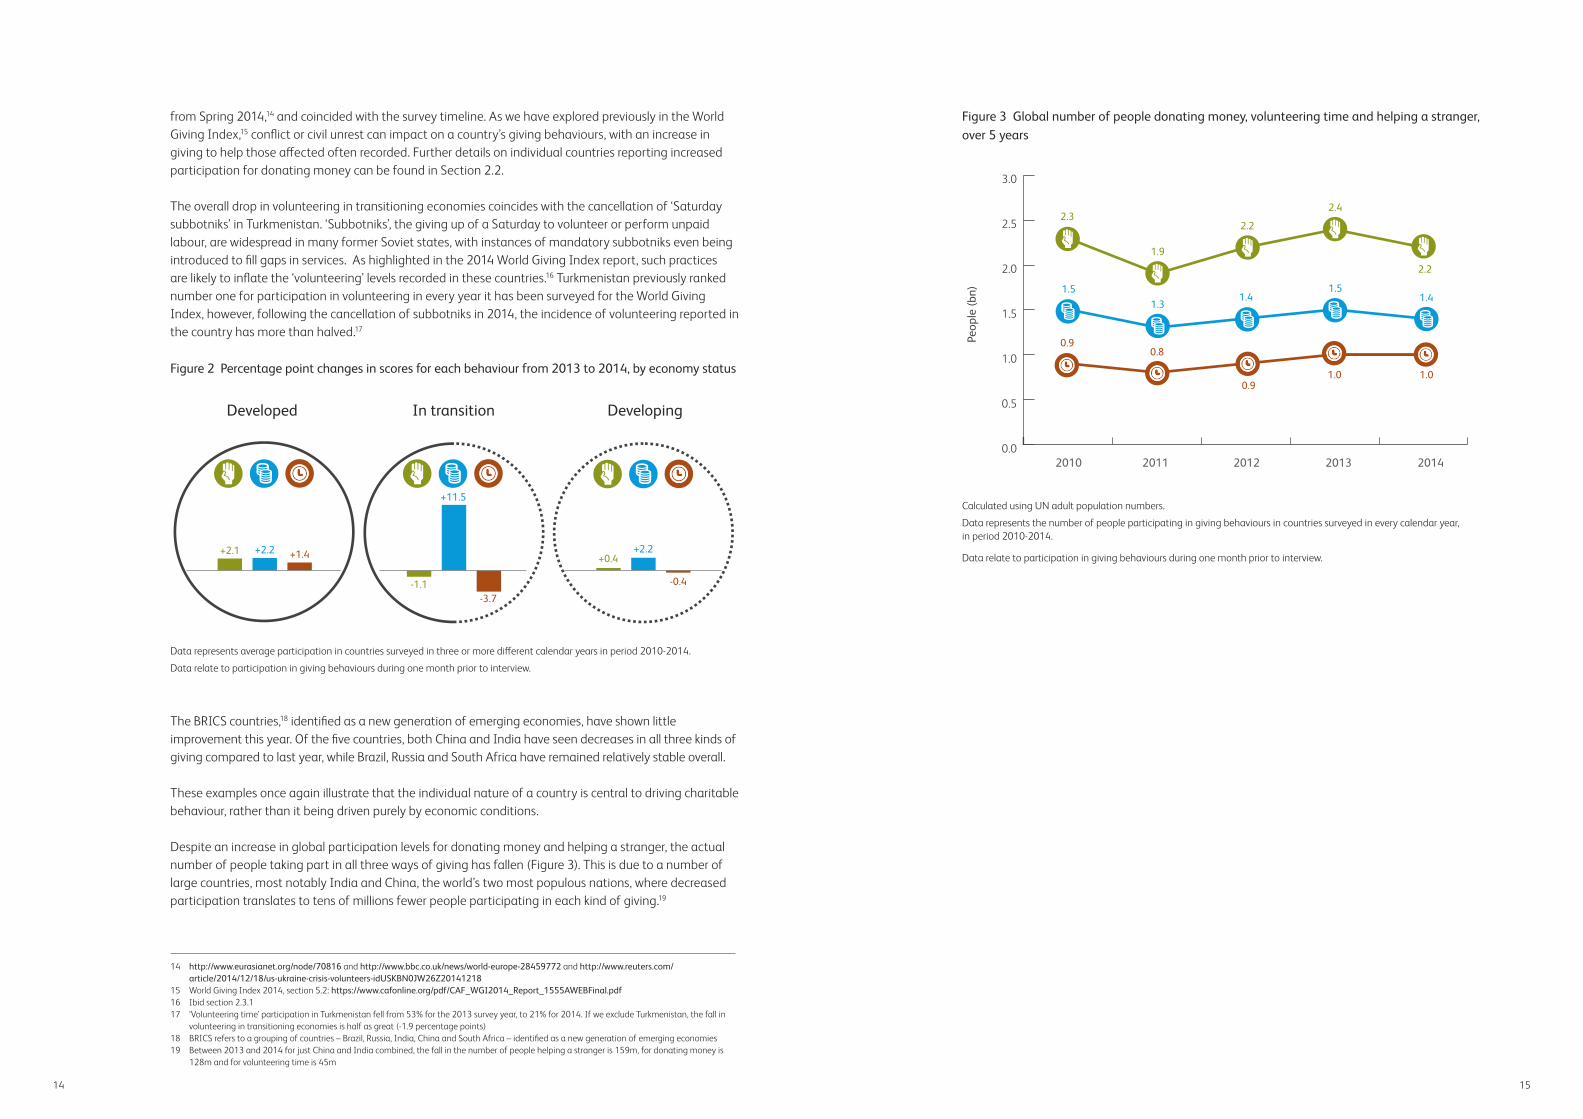
from Spring 2014,14 and coincided with the survey timeline. As we have explored previously in the World Giving Index,15 conflict or civil unrest can impact on a country’s giving behaviours, with an increase in giving to help those affected often recorded. Further details on individual countries reporting increased participation for donating money can be found in Section 2.2.
The overall drop in volunteering in transitioning economies coincides with the cancellation of ‘Saturday subbotniks’ in Turkmenistan. ‘Subbotniks’, the giving up of a Saturday to volunteer or perform unpaid labour, are widespread in many former Soviet states, with instances of mandatory subbotniks even being introduced to fill gaps in services. As highlighted in the 2014 World Giving Index report, such practices are likely to inflate the ‘volunteering’ levels recorded in these countries.16 Turkmenistan previously ranked number one for participation in volunteering in every year it has been surveyed for the World Giving Index, however, following the cancellation of subbotniks in 2014, the incidence of volunteering reported in the country has more than halved.17
Figure 2 Percentage point changes in scores for each behaviour from 2013 to 2014, by economy status
Data represents average participation in countries surveyed in three or more different calendar years in period 2010-2014.
Data relate to participation in giving behaviours during one month prior to interview.
The BRICS countries,18 identified as a new generation of emerging economies, have shown little improvement this year. Of the five countries, both China and India have seen decreases in all three kinds of giving compared to last year, while Brazil, Russia and South Africa have remained relatively stable overall.
These examples once again illustrate that the individual nature of a country is central to driving charitable behaviour, rather than it being driven purely by economic conditions.
Despite an increase in global participation levels for donating money and helping a stranger, the actual number of people taking part in all three ways of giving has fallen (Figure 3). This is due to a number of large countries, most notably India and China, the world’s two most populous nations, where decreased participation translates to tens of millions fewer people participating in each kind of giving.19
14 http://www.eurasianet.org/node/70816 and http://www.bbc.co.uk/news/world-europe-28459772 and http://www.reuters.com/article/2014/12/18/us-ukraine-crisis-volunteers-idUSKBN0JW26Z20141218
15 World Giving Index 2014, section 5.2: https://www.cafonline.org/pdf/CAF_WGI2014_Report_1555AWEBFinal.pdf16 Ibid section 2.3.117 ‘Volunteering time’ participation in Turkmenistan fell from 53% for the 2013 survey year, to 21% for 2014. If we exclude Turkmenistan, the fall in
volunteering in transitioning economies is half as great (-1.9 percentage points)18 BRICS refers to a grouping of countries – Brazil, Russia, India, China and South Africa – identified as a new generation of emerging economies19 Between 2013 and 2014 for just China and India combined, the fall in the number of people helping a stranger is 159m, for donating money is
128m and for volunteering time is 45m
Figure 3 Global number of people donating money, volunteering time and helping a stranger, over 5 years
Calculated using UN adult population numbers.
Data represents the number of people participating in giving behaviours in countries surveyed in every calendar year, in period 2010-2014.
Data relate to participation in giving behaviours during one month prior to interview.
Developed In transition Developing
+2.1 +2.2 +1.4
-1.1-3.7
+11.5
+0.4+2.2
-0.4
Figure 2: Percentage point changes in scores for each behaviour from 2013 to 2014, by economy status
0.0
0.5
1.0
1.5
2.0
2.5
3.0
2010 2011 2012 2013 2014
2.3
1.9
2.2
2.4
2.2
1.51.3
1.41.5
1.4
0.90.8
0.91.0
1.0
Figure 3: Global number of people donating money, volunteering time and helping a stranger, over 5 years

1716
2 Three giving behaviours
Kenya’s helping a stranger score has risen every year since the first World Giving Index. This year saw the biggest year-on-year increase in that time, at seven percentage points.
China ranks second from bottom for helping a stranger this year, due to participation falling by 13 percentage points, which translates to almost 150 million fewer people lending a helping hand. As a result, and despite China being more populous, India is now placed first in terms of the number of people who have helped a stranger in the last month (Table 4).
The countries comprising the Top 10 by number of people remains largely the same as last year, with the United States the only country appearing in both this and the participation Top 10. Russia no longer appears in the Top 10 having been surpassed by Mexico for the number of people helping a stranger.
2.1.2 Helping a stranger and gender
Reflecting the overall uplift, the proportion of both men and women who have helped strangers in the last month has increased marginally by 0.4 percentage points. This continues the improving trend seen since 2011, with the participation rates of 50.6% for men and 47.3% for women the highest levels recorded to date.
Men have always reported higher levels of helping a stranger, and this continues to be the case, with their participation 3.3 percentage points higher than women.
Figure 4 Global participation in helping a stranger, by gender, over five years
Data represents average participation in countries surveyed in three or more different calendar years in period 2010-2014.
Data relate to participation in helping a stranger during one month prior to interview.
2.1 Helping a stranger
2.1.1 Top 10 countries for helping a stranger, by participation and population
The two tables below show the countries with the highest percentage of people helping strangers and the countries with the highest actual number of people doing so.
Iraq ranks first for participation in helping a stranger for the first time, displacing the United States which falls to third place.
Iraq’s position consolidates the uplift reported last year, when it moved from ninetieth to second place for participation in helping a stranger. Iraq has a rich cultural, religious and tribal heritage and informal giving has long been integral within communities across the country. It is remarkable that Iraqis continue to exhibit such generosity amidst ongoing security concerns. Indeed, it may even be that the recent increase in helping a stranger is a response to growing need.
Namibia, Kuwait, Malawi and South Africa enter the participation Top 10 for the first time. This is the first time Namibia has featured in the World Giving Index, having not been surveyed previously. Kuwait has not been surveyed since 2010 when it was placed forty-ninth for participation, while Malawi’s previous highest ranking was twenty-sixth in 2012.
For the second consecutive year South Africa has seen a notable increase in the proportion of people ‘helping a stranger’ in the month prior to interview – rising by a further nine percentage points, following the ten percentage point increase already reported last year. This increase sees South Africa appear in the Top 10 for the first time for any of the three ways of giving, and further supports the belief that ‘ubuntu’ – the interconnectedness between people which underpins charitable giving – is still a strong motivator within South Africa.20
Table 3 Top 10 countries by participation in helping a stranger
Helping a stranger country and ranking
People (%)
Iraq 1 79
Liberia 2 78
United States of America
3 76
Namibia 4 76
Jamaica 5 76
Kenya 6 74
Kuwait 7 74
Malawi 8 73
Saudi Arabia 9 73
South Africa 10 73
Only includes countries surveyed in 2014.
Data relate to participation in helping a stranger during one month prior to interview.
20 ‘I believe I can make a difference – Individual Giving by ‘Ordinary People’ living in Gauteng Province, South Africa’, CAF Southern Africa https://www.cafonline.org/about-us/publications/2015-publications/individual-giving-south-africa.aspx
Table 4 Top 10 countries by the number of people helping a stranger
Helping a stranger country and ranking
People (m)
India 1 335
China 2 262
United States of America
3 198
Bangladesh 4 69
Nigeria 5 68
Brazil 6 64
Indonesia 7 63
Germany 8 44
Pakistan 9 44
Mexico 10 39
Calculated using UN adult population numbers.
Only includes countries surveyed in 2014.
Data relate to participation in helping a stranger during one month prior to interview.
2010 2011 2012 2013 2014
48.7
46.4
48.9
50.2 50.6
45.9
44.5
46.146.9 47.3
Figure 4: Global participation in helping a stranger, by gender, over five years
35
40
45
50
55
1918
2.1.3 Helping a stranger and age
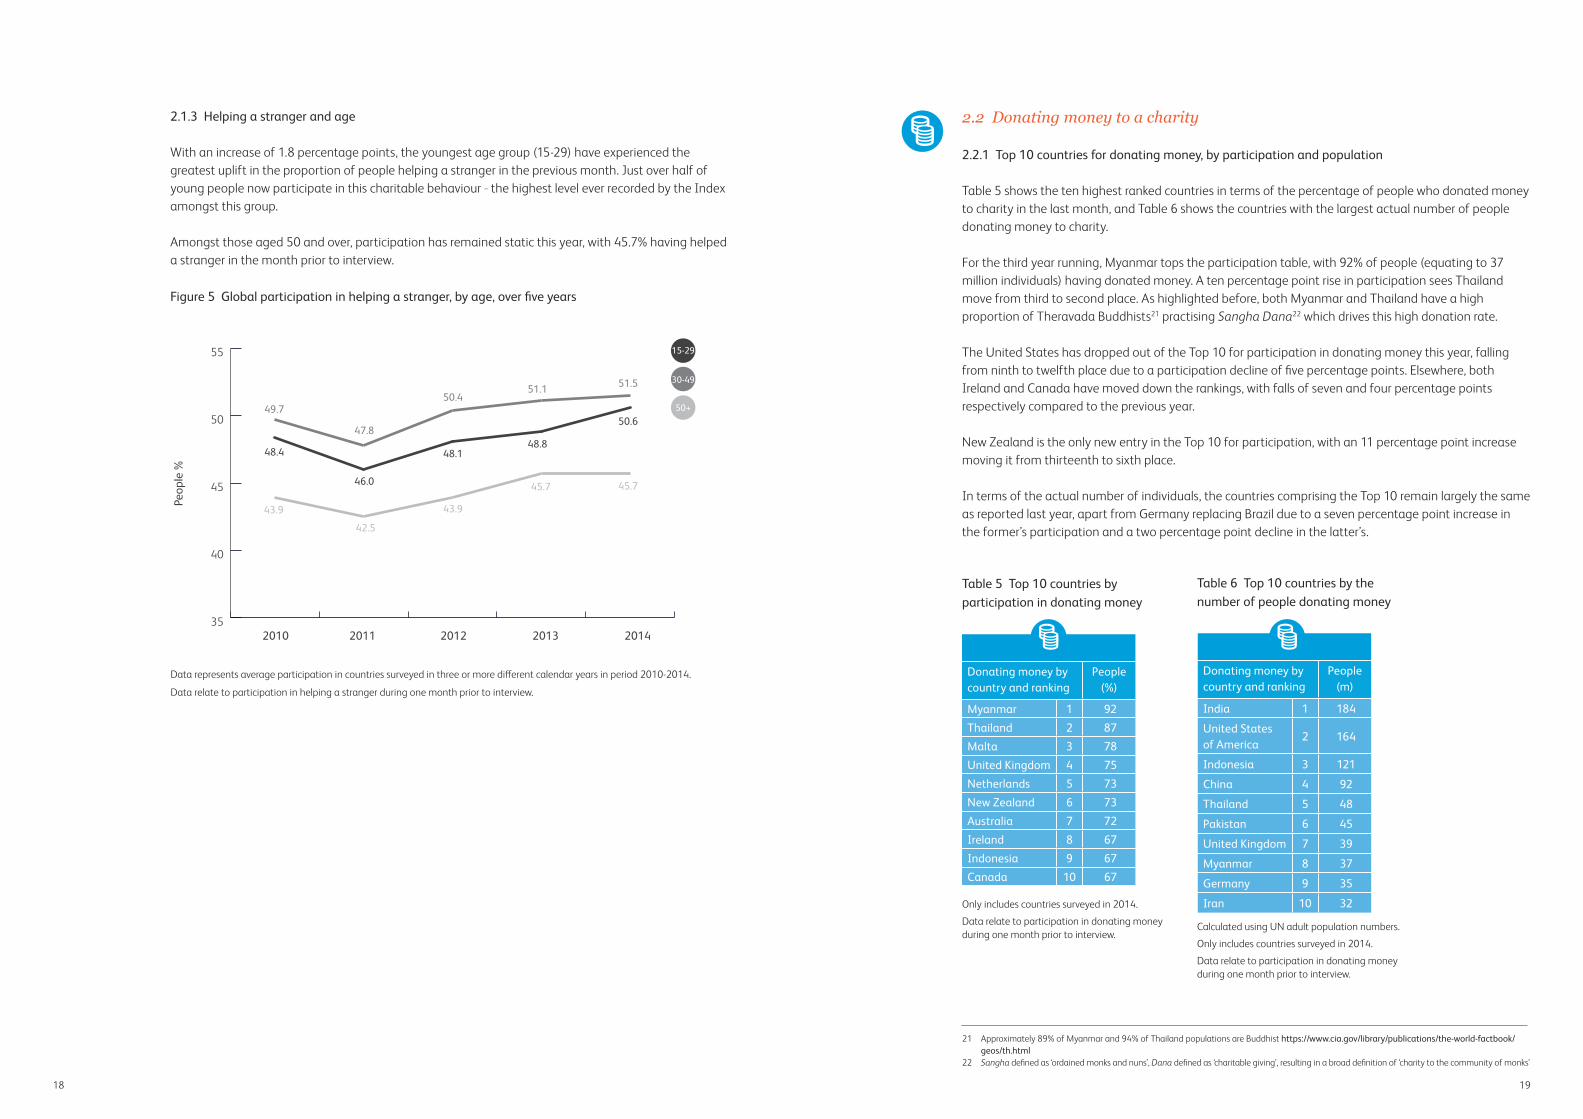
With an increase of 1.8 percentage points, the youngest age group (15-29) have experienced the greatest uplift in the proportion of people helping a stranger in the previous month. Just over half of young people now participate in this charitable behaviour _ the highest level ever recorded by the Index amongst this group.
Amongst those aged 50 and over, participation has remained static this year, with 45.7% having helped a stranger in the month prior to interview.
Figure 5 Global participation in helping a stranger, by age, over five years
2.2 Donating money to a charity
2.2.1 Top 10 countries for donating money, by participation and population
Table 5 shows the ten highest ranked countries in terms of the percentage of people who donated money to charity in the last month, and Table 6 shows the countries with the largest actual number of people donating money to charity.
For the third year running, Myanmar tops the participation table, with 92% of people (equating to 37 million individuals) having donated money. A ten percentage point rise in participation sees Thailand move from third to second place. As highlighted before, both Myanmar and Thailand have a high proportion of Theravada Buddhists21 practising Sangha Dana22 which drives this high donation rate.
The United States has dropped out of the Top 10 for participation in donating money this year, falling from ninth to twelfth place due to a participation decline of five percentage points. Elsewhere, both Ireland and Canada have moved down the rankings, with falls of seven and four percentage points respectively compared to the previous year.
New Zealand is the only new entry in the Top 10 for participation, with an 11 percentage point increase moving it from thirteenth to sixth place.
In terms of the actual number of individuals, the countries comprising the Top 10 remain largely the same as reported last year, apart from Germany replacing Brazil due to a seven percentage point increase in the former’s participation and a two percentage point decline in the latter’s.
Table 5 Top 10 countries by participation in donating money
Donating money by country and ranking
People (%)
Myanmar 1 92 Thailand 2 87 Malta 3 78 United Kingdom 4 75 Netherlands 5 73 New Zealand 6 73 Australia 7 72 Ireland 8 67 Indonesia 9 67 Canada 10 67
Only includes countries surveyed in 2014.
Data relate to participation in donating money during one month prior to interview.
21 Approximately 89% of Myanmar and 94% of Thailand populations are Buddhist https://www.cia.gov/library/publications/the-world-factbook/geos/th.html
22 Sangha defined as ‘ordained monks and nuns’, Dana defined as ‘charitable giving’, resulting in a broad definition of ‘charity to the community of monks’
Data represents average participation in countries surveyed in three or more different calendar years in period 2010-2014.
Data relate to participation in helping a stranger during one month prior to interview.
Table 6 Top 10 countries by the number of people donating money
Calculated using UN adult population numbers.
Only includes countries surveyed in 2014.
Data relate to participation in donating money during one month prior to interview.
Donating money by country and ranking
People (m)
India 1 184
United States of America
2 164
Indonesia 3 121
China 4 92
Thailand 5 48
Pakistan 6 45
United Kingdom 7 39
Myanmar 8 37
Germany 9 35
Iran 10 32
2010 2011 2012 2013 2014
49.7
47.8
50.451.1 51.5
43.9
42.5
43.9
45.7
48.4
46.0
48.148.8
50.6
45.7
35
40
45
50
55
Figure 5: Global participation in helping a stranger, by age, over five years
15-29
30-49
50+

2120
In addition to India and the United States, Indonesia now also has more individuals who have given money to charity in the last month than China. This is despite having a much smaller adult population than China (181 million vs. 1,142 million respectively),23 and reflects the participation differential, 67% for Indonesia compared to 8% in China, which equates to a difference of approximately 29 million people.
With a population of 40.5m, Myanmar is the least populous country to appear in any of the Top Tens for the number of people participating.
2.2.2 Donating money and gender
Last year we noted that, despite a higher global participation rate, women were actually only more likely to donate money than men in developed economies, with men recording higher participation in both transitioning and developing economies.
This year, men in developed economies have narrowed the differential in participation rates to four percentage points (compared to the seven recorded previously), which is the smallest gap recorded in the last five years of the World Giving Index. This smaller differential, combined with the continued higher participation in both transitioning and developing economies, means that for the first time since 2008 men have overtaken women in terms of the proportion that donate money globally.
Figure 6 Global participation in donating money, by gender, over five years
Data represents average participation in countries surveyed in three or more different calendar years in period 2010-2014.
Data relate to participation in donating money during one month prior to interview.
23 World Population Prospects, the 2012 Revision, June 2013, United Nations Department of Economic and Social Affairs: http://esa.un.org/wpp/ for those aged 15+
2.2.3 Donating money and age
As has been the case since the World Giving Index was first published in 2010, older people are more likely to give money to charitable causes. At 33.8% this year’s global participation rate amongst those aged 50 and older is the highest recorded to date.
The global uplift in donating money seen this year is experienced across all of the age groups. Most notable is the apparent uplift of 5.4 percentage points amongst the youngest age group. It is worth noting that some of this uplift is due to differences in the age-by-country data available in 2013 and in 2014, but even when conducting analysis on a matched year-on-year sample, participation still increases by 3.1 percentage points for this age group. This uplift more than recovers the ground lost between 2012 and 2013.
The increase is strongest in Oceania and Europe, with both continents reporting a ten percentage point uplift in donating money amongst this youngest age group.
Figure 7 Global participation in donating money, by age, over five years
Data represents average participation in countries surveyed in three or more different calendar years in period 2010-2014.
Data relate to participation in donating money during one month prior to interview.
31.7
2010 2011 2012 2013 2014
30.4
27.8
28.9
31.3
24
25
26
27
28
29
30
31
32
33
Figure 6: Global participation in donating money, by gender, over five years
29.9
27.1
28.227.9
28.6
2010 2011 2012 2013 2014
33.3
30.3 30.8 31.0
33.8
31.7
28.9
30.329.8
24.5
22.3
23.8
21.9
27.3
33.0
15
20
25
30
35 15-29
30-49
50+
Figure 7: Global participation in donating money, by age, over five years

2322
The Top 10 for the number of individuals volunteering their time remains much as last year, but with Germany now replacing Myanmar in the countries represented (see Table 8). Germany has moved into the Top 10 through a seven percentage point year-on-year increase in the proportion who had volunteered in the month prior to interview. Although no longer in the Top Ten, Myanmar has almost as many individuals volunteering as Brazil (20.3m vs. 20.8m respectively) despite having only a quarter of the population.
2.3.2 Volunteering time and gender
Globally, volunteering time has remained relatively stable this year. Indeed, in developed economies, volunteering is at its highest level for both men and women, with women having increased participation by almost two percentage points to now match men (24%).
However, participation has fallen by at least three percentage points for both men and women in economies which are ‘in transition’. This will be due, at least in part, to the cancellation of ‘subbotniks’ within Turkmenistan (see Section 2.3.1). Within developing economies volunteering has remained relatively stable for both men and women.
In the last year, 25 countries have seen a fall of five percentage points or more for volunteering by men, whilst women have only experienced such falls in 12 countries.
Figure 8 Global participation in volunteering time, by gender, over five years
Data represents average participation in countries surveyed in three or more different calendar years in period 2010-2014.
Data relate to participation in volunteering time during one month prior to interview.
2.3 Volunteering time
2.3.1 Top 10 countries for volunteering time, by participation and population
The Top 10 highest-ranked countries in terms of the proportion of people who volunteer are shown in Table 7, whilst Table 8 shows the ten countries with the highest number of individuals volunteering.
Only six of this year’s Top 10 for participation also featured last year: Myanmar, Sri Lanka, New Zealand, Canada, the United States of America and Uzbekistan, with Turkmenistan, Tajikistan, Bhutan, Ireland, Malaysia and Nigeria all leaving the Top Ten.24
Of these, the most notable is Turkmenistan which had topped the volunteering table since 2011, but has fallen dramatically (by 32 percentage points) to now find itself ranked sixty-sixth. As highlighted already in Section 1.2, this reflects the cancellation of ‘Saturday subbotniks’ during 2014. This practice of giving up a Saturday to volunteer or perform unpaid labour, in some cases under a mandatory instruction, was likely to inflate ‘volunteering’ levels and so their cancellation has naturally led to this corresponding fall.
Liberia re-enters the Top 10 with a notable increase of 12 percentage points, moving from twenty-first to third place, although participation at 46% still remains below the country’s high of 55% previously recorded in 2011.
As with helping a stranger, China ranks second from bottom for the proportion of people volunteering time.
Table 7 Top 10 countries by participation in volunteering time
Volunteering time country and ranking
People (%)
Myanmar 1 50
Sri Lanka 2 48
Liberia 3 46
New Zealand 4 45
Canada 5 44
United States of America
6 44
Uzbekistan 7 43
Kenya 8 43
Philippines 9 42
Guatemala 10 41
Only includes countries surveyed in 2014.
Data relate to participation in volunteering time during one month prior to interview.
24 Last year a number of countries tied for both fifth and tenth place in the top ten countries by participation in volunteering time, so the list featured 12 countries in total
Volunteering time country and ranking
People (m)
India 1 157
United States of America
2 115
Indonesia 3 68
China 4 47
Nigeria 5 32
Japan 6 29
Philippines 7 28
Russia 8 23
Germany 9 23
Brazil 10 21
Table 8 Top 10 countries by the number of people volunteering time
Calculated using UN adult population numbers.
Only includes countries surveyed in 2014.
Data relate to participation in volunteering time during one month prior to interview.
19.6
21.1
23.2
22.4
2010 2011 2012 2013 2014
18.417.8
18.3
19.5 19.6
15
17
19
21
23
25
21.7
Figure 8: Global participation in volunteering time, by gender, over �ve years
2524
2.3.3 Volunteering time and age
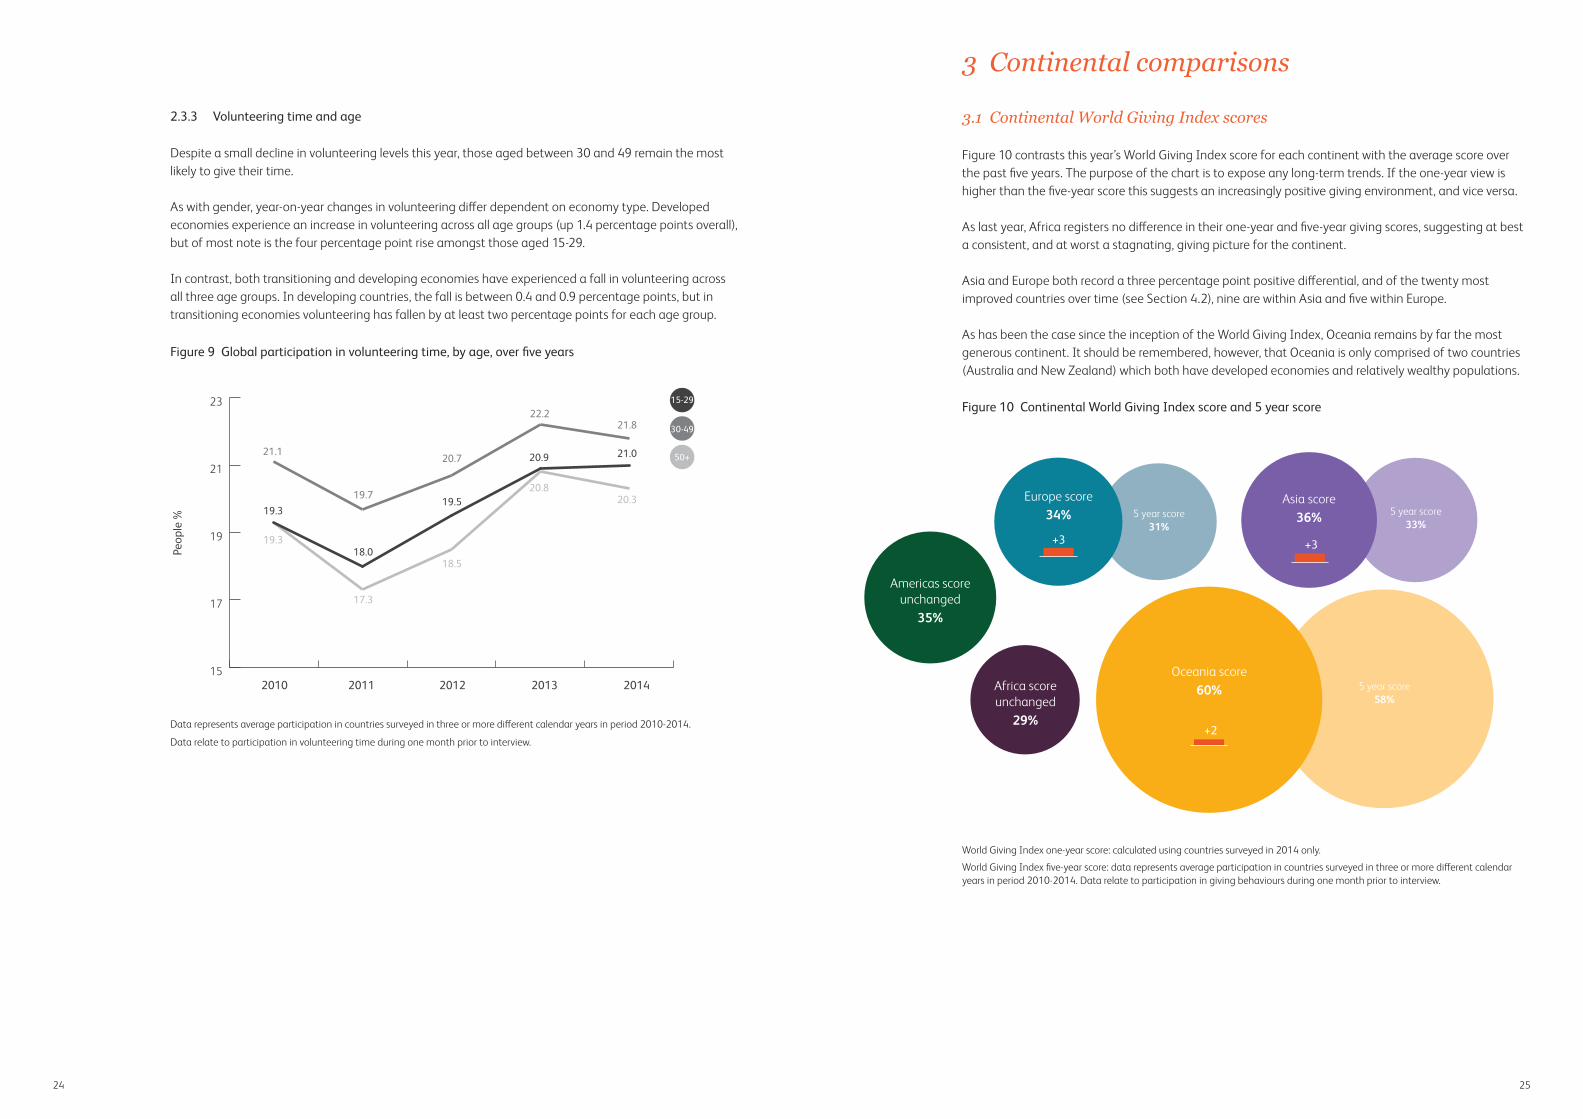
Despite a small decline in volunteering levels this year, those aged between 30 and 49 remain the most likely to give their time.
As with gender, year-on-year changes in volunteering differ dependent on economy type. Developed economies experience an increase in volunteering across all age groups (up 1.4 percentage points overall), but of most note is the four percentage point rise amongst those aged 15-29.
In contrast, both transitioning and developing economies have experienced a fall in volunteering across all three age groups. In developing countries, the fall is between 0.4 and 0.9 percentage points, but in transitioning economies volunteering has fallen by at least two percentage points for each age group.
Figure 9 Global participation in volunteering time, by age, over five years
Data represents average participation in countries surveyed in three or more different calendar years in period 2010-2014.
Data relate to participation in volunteering time during one month prior to interview.
3 Continental comparisons
3.1 Continental World Giving Index scores
Figure 10 contrasts this year’s World Giving Index score for each continent with the average score over the past five years. The purpose of the chart is to expose any long-term trends. If the one-year view is higher than the five-year score this suggests an increasingly positive giving environment, and vice versa.
As last year, Africa registers no difference in their one-year and five-year giving scores, suggesting at best a consistent, and at worst a stagnating, giving picture for the continent.
Asia and Europe both record a three percentage point positive differential, and of the twenty most improved countries over time (see Section 4.2), nine are within Asia and five within Europe.
As has been the case since the inception of the World Giving Index, Oceania remains by far the most generous continent. It should be remembered, however, that Oceania is only comprised of two countries (Australia and New Zealand) which both have developed economies and relatively wealthy populations.
Figure 10 Continental World Giving Index score and 5 year score
World Giving Index one-year score: calculated using countries surveyed in 2014 only.
World Giving Index five-year score: data represents average participation in countries surveyed in three or more different calendar years in period 2010-2014. Data relate to participation in giving behaviours during one month prior to interview.
2010 2011 2012 2013 2014
19.3
17.3
18.5
20.820.3
21.1
19.7
20.7
22.2
19.3
18.0
19.5
20.9 21.0
21.8
15
17
19
21
23 15-29
30-49
50+
Figure 9: Global participation in volunteering time, by age, over �ve years
Figure 10: Continental World Giving Index score and 5 year score
Americas score
unchanged35%
Africa score unchanged
29%
+3
5 year score 31%
Europe score 34%
+3
5 year score 33%
Asia score 36%
5 year score 58%
+2
Oceania score 60%
2726
3.2 Continental giving behaviour scores
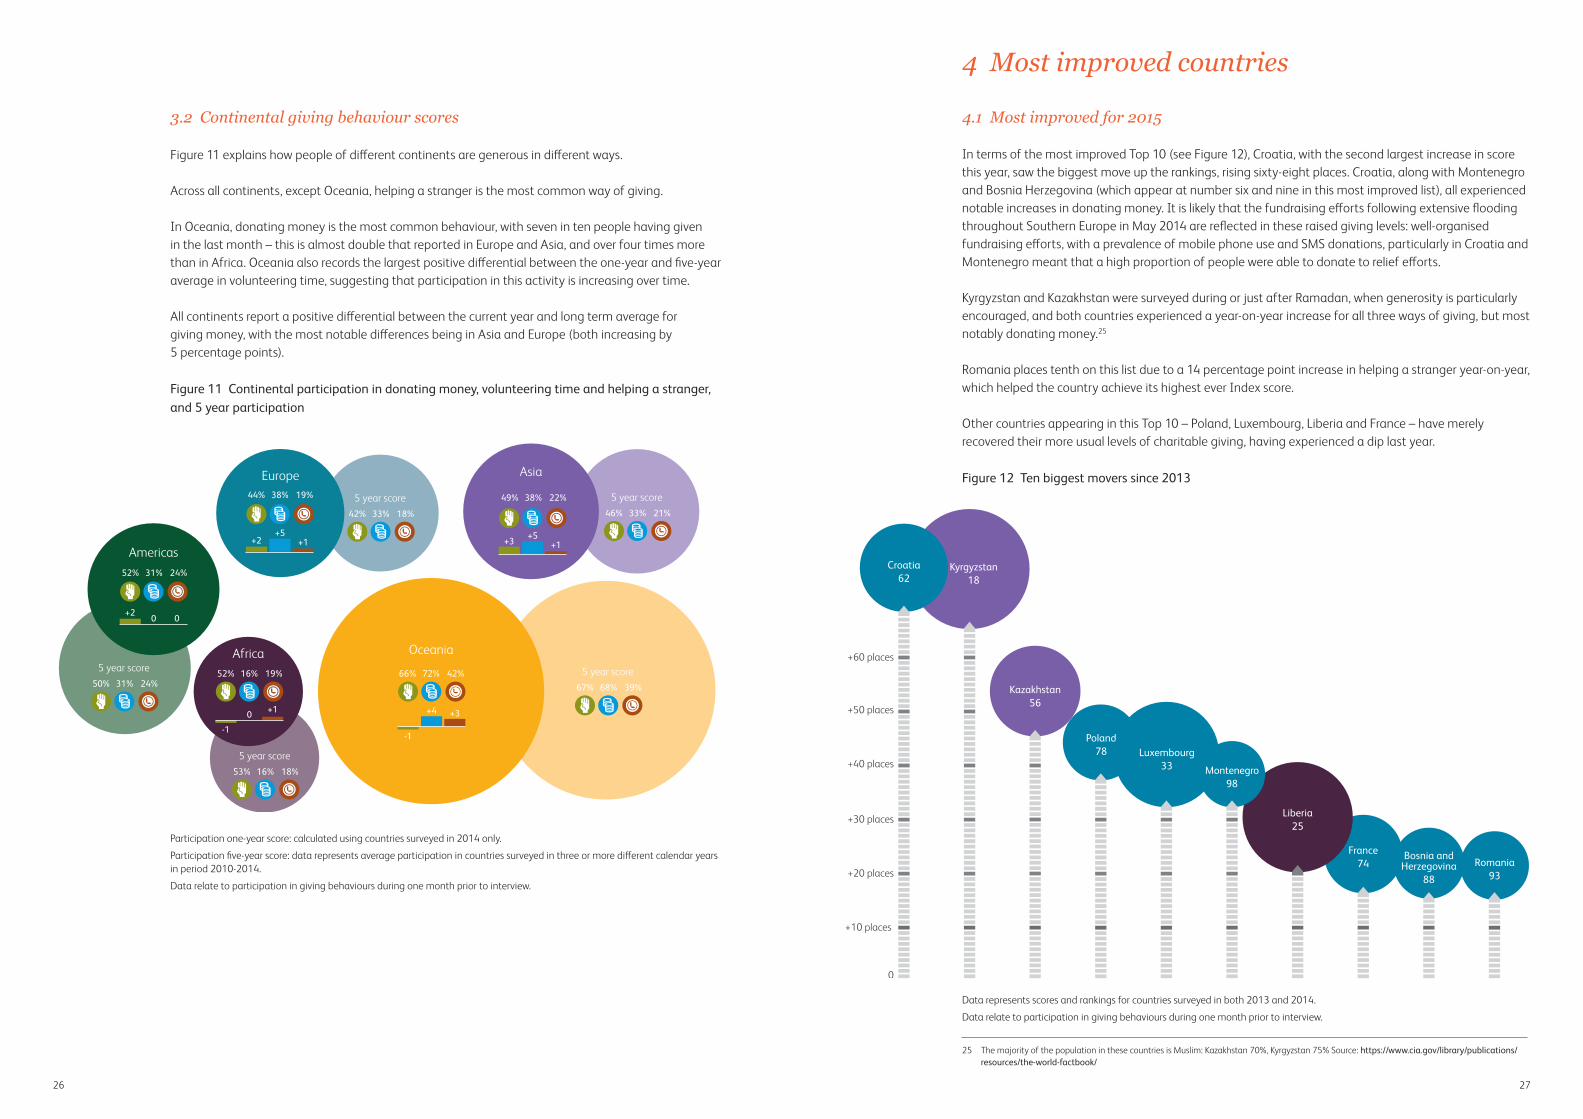
Figure 11 explains how people of different continents are generous in different ways.
Across all continents, except Oceania, helping a stranger is the most common way of giving.
In Oceania, donating money is the most common behaviour, with seven in ten people having given in the last month – this is almost double that reported in Europe and Asia, and over four times more than in Africa. Oceania also records the largest positive differential between the one-year and five-year average in volunteering time, suggesting that participation in this activity is increasing over time.
All continents report a positive differential between the current year and long term average for giving money, with the most notable differences being in Asia and Europe (both increasing by 5 percentage points).
Figure 11 Continental participation in donating money, volunteering time and helping a stranger, and 5 year participation
Participation one-year score: calculated using countries surveyed in 2014 only.
Participation five-year score: data represents average participation in countries surveyed in three or more different calendar years in period 2010-2014.
Data relate to participation in giving behaviours during one month prior to interview.
4 Most improved countries
4.1 Most improved for 2015
In terms of the most improved Top 10 (see Figure 12), Croatia, with the second largest increase in score this year, saw the biggest move up the rankings, rising sixty-eight places. Croatia, along with Montenegro and Bosnia Herzegovina (which appear at number six and nine in this most improved list), all experienced notable increases in donating money. It is likely that the fundraising efforts following extensive flooding throughout Southern Europe in May 2014 are reflected in these raised giving levels: well-organised fundraising efforts, with a prevalence of mobile phone use and SMS donations, particularly in Croatia and Montenegro meant that a high proportion of people were able to donate to relief efforts.
Kyrgyzstan and Kazakhstan were surveyed during or just after Ramadan, when generosity is particularly encouraged, and both countries experienced a year-on-year increase for all three ways of giving, but most notably donating money.25
Romania places tenth on this list due to a 14 percentage point increase in helping a stranger year-on-year, which helped the country achieve its highest ever Index score.
Other countries appearing in this Top 10 – Poland, Luxembourg, Liberia and France – have merely recovered their more usual levels of charitable giving, having experienced a dip last year.
Figure 12 Ten biggest movers since 2013
Data represents scores and rankings for countries surveyed in both 2013 and 2014.
Data relate to participation in giving behaviours during one month prior to interview.
25 The majority of the population in these countries is Muslim: Kazakhstan 70%, Kyrgyzstan 75% Source: https://www.cia.gov/library/publications/resources/the-world-factbook/
53% 16% 18%
Figure 11: Continental participation in donating money, volunteering time and helping a stranger, and 5 year participation
Americas
Africa
Europe
Asia
Oceania
-1
+4 +3
+2+5
+1 +3 +5+1
-1
0 +1
+2 0 0
5 year score
67% 68% 39%
5 year score 50% 31% 24%
5 year score
42% 33% 18%
5 year score 46% 33% 21%
5 year score
52% 16% 19% 66% 72% 42%
52% 31% 24%
44% 38% 19% 49% 38% 22%
Poland 78
Romania 93
Bosnia and Herzegovina
88
France 74
Liberia 25
Luxembourg33
Figure 12: Ten biggest movers since 2013
Kyrgyzstan 18
Croatia 62
Kazakhstan 56
0
+10 places
+20 places
+30 places
+40 places
+50 places
+60 places
Montenegro98
2928
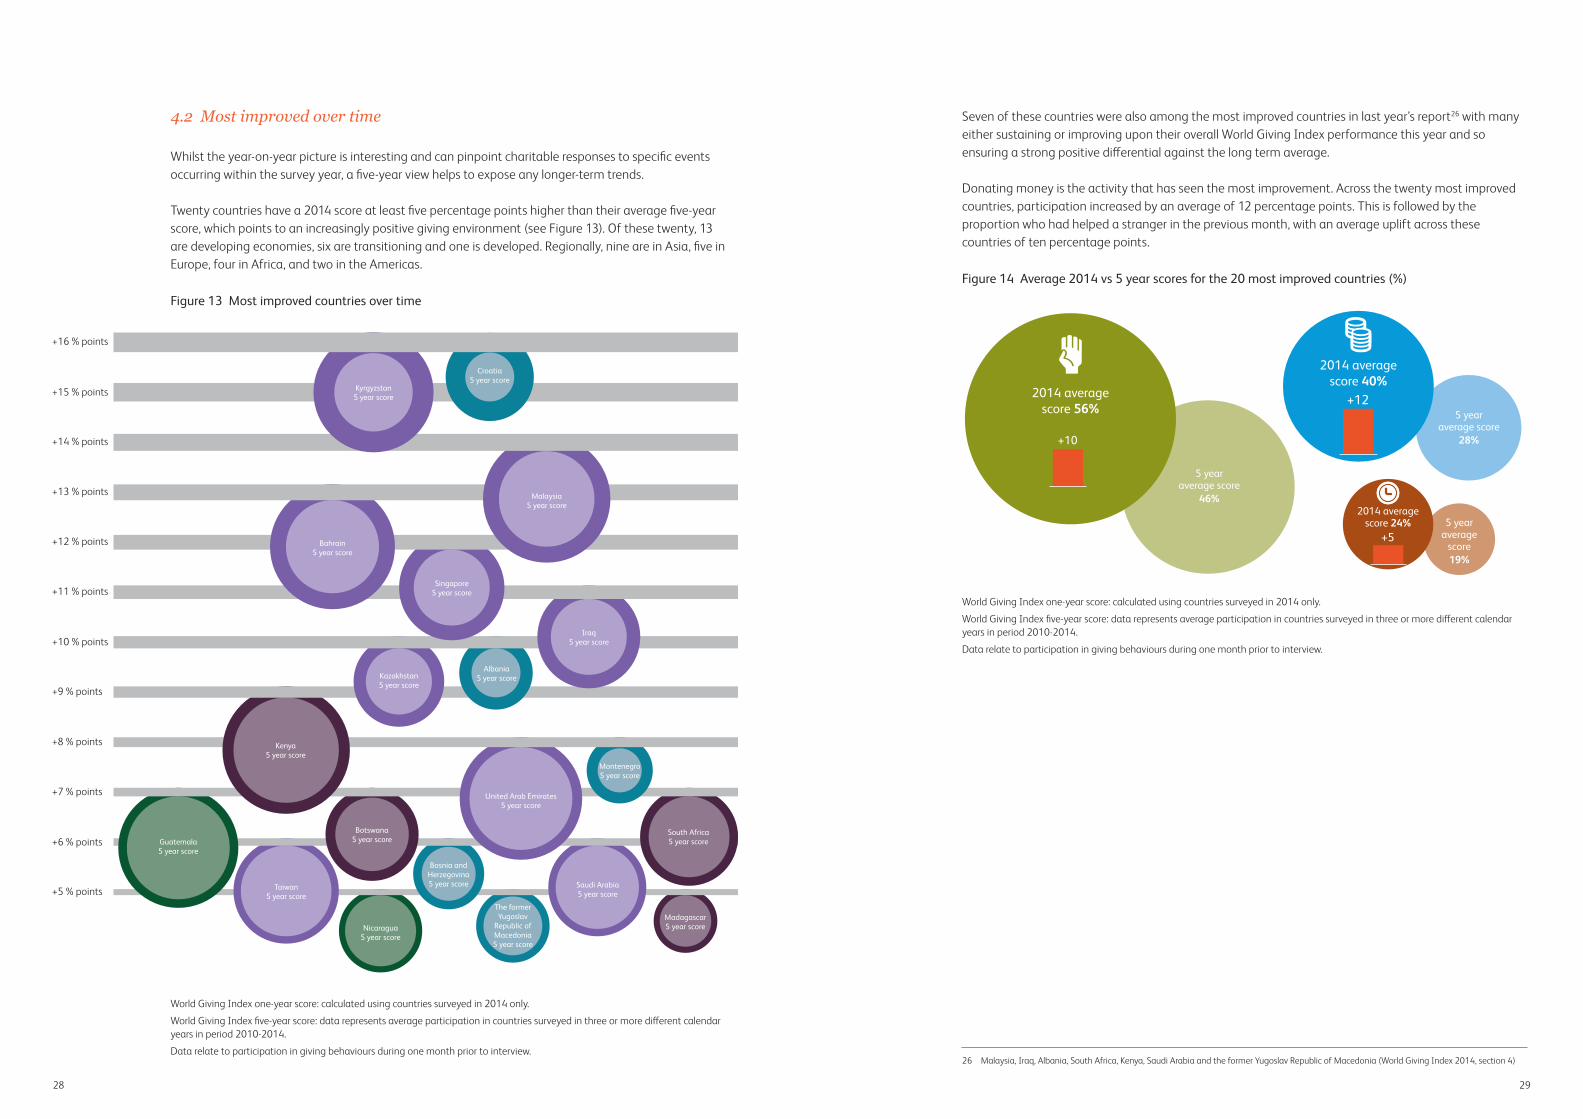
4.2 Most improved over time
Whilst the year-on-year picture is interesting and can pinpoint charitable responses to specific events occurring within the survey year, a five-year view helps to expose any longer-term trends.
Twenty countries have a 2014 score at least five percentage points higher than their average five-year score, which points to an increasingly positive giving environment (see Figure 13). Of these twenty, 13 are developing economies, six are transitioning and one is developed. Regionally, nine are in Asia, five in Europe, four in Africa, and two in the Americas.
Figure 13 Most improved countries over time
World Giving Index one-year score: calculated using countries surveyed in 2014 only.
World Giving Index five-year score: data represents average participation in countries surveyed in three or more different calendar years in period 2010-2014.
Data relate to participation in giving behaviours during one month prior to interview.
Seven of these countries were also among the most improved countries in last year’s report26 with many either sustaining or improving upon their overall World Giving Index performance this year and so ensuring a strong positive differential against the long term average.
Donating money is the activity that has seen the most improvement. Across the twenty most improved countries, participation increased by an average of 12 percentage points. This is followed by the proportion who had helped a stranger in the previous month, with an average uplift across these countries of ten percentage points.
Figure 14 Average 2014 vs 5 year scores for the 20 most improved countries (%)
World Giving Index one-year score: calculated using countries surveyed in 2014 only.
World Giving Index five-year score: data represents average participation in countries surveyed in three or more different calendar years in period 2010-2014.
Data relate to participation in giving behaviours during one month prior to interview.
26 Malaysia, Iraq, Albania, South Africa, Kenya, Saudi Arabia and the former Yugoslav Republic of Macedonia (World Giving Index 2014, section 4)
Figure 13: Countries with a 2014 score at least five percentage points higher than average five year score
Madagascar5 year scoreNicaragua
5 year score
The former Yugoslav
Republic of Macedonia5 year score
Bosnia and Herzegovina5 year scoreTaiwan
5 year scoreSaudi Arabia5 year score
Guatemala5 year score
Botswana5 year score
South Africa5 year score
Montenegro5 year score
United Arab Emirates5 year score
Kenya5 year score
Albania5 year scoreKazakhstan
5 year score
Iraq5 year score
Singapore5 year score
Bahrain5 year score
Malaysia5 year score
Kyrgyzstan5 year score
Croatia5 year score
+16 % points
+15 % points
+14 % points
+13 % points
+12 % points
+11 % points
+10 % points
+9 % points
+8 % points
+7 % points
+6 % points
+5 % points
Figure 14: Average 2014 vs 5 year scores for the 20 most improved countries (%)
5 year average score
46%
5 year average
score19%
5 yearaverage score
28%
2014 average score 40%
2014 average score 24%
2014 average score 56%
+10
+12
+5

3130
Appendices 1 Alphabetical CAF World Giving Index full table continued
Country Region Ranking Score(%)
Afghanistan Southern Asia 84 30
Albania Southern Europe 83 30
Angola Middle Africa 134 19
Argentina South America 108 25
Armenia Western Asia 138 19
AustraliaAustralia and New Zealand
5 59
Austria Western Europe 23 46
Azerbaijan Western Asia 122 22
Bahrain Western Asia 13 51
Bangladesh Southern Asia 95 27
Belarus Eastern Europe 103 26
Belgium Western Europe 48 40
Belize Central America 70 33
Benin Western Africa 132 19
Bhutan Southern Asia 17 49
Bolivia South America 65 35
Bosnia and Herzegovina
Southern Europe 88 29
Botswana Southern Africa 55 38
Brazil South America 105 25
Bulgaria Eastern Europe 115 23
Burkina Faso Western Africa 104 25
Burundi Eastern Africa 145 11
Cambodia South Eastern Asia 100 26
Cameroon Middle Africa 92 28
Canada North America 4 60
Chad Middle Africa 136 19
Chile South America 49 40
China Eastern Asia 144 12
Colombia South America 66 35
Congo Middle Africa 91 28
Costa Rica Central America 36 43
Cote d'Ivoire Western Africa 107 25
Croatia Southern Europe 62 36
Cyprus Western Asia 42 42
Czech Republic Eastern Europe 130 20
Democratic Republic of the Congo
Middle Africa 127 21
Denmark Northern Europe 39 42
Dominican Republic Caribbean 41 42
Ecuador South America 131 20
Egypt Northern Africa 112 23
El Salvador Central America 117 23
Country Region Ranking Score(%)
Estonia Northern Europe 99 26
Ethiopia Eastern Africa 97 27
Finland Northern Europe 31 43
France Western Europe 74 32
Gabon Middle Africa 111 24
Georgia Western Asia 112 23
Germany Western Europe 20 47
Ghana Western Africa 63 35
Greece Southern Europe 140 17
Guatemala Central America 16 49
Guinea Western Africa 80 31
Haiti Caribbean 59 36
Honduras Central America 60 36
Hong Kong Eastern Asia 26 45
Hungary Eastern Europe 124 22
India Southern Asia 106 25
Indonesia South Eastern Asia 22 46
Iran Southern Asia 32 43
Iraq Western Asia 38 42
Ireland Northern Europe 9 56
Israel Western Asia 75 32
Italy Southern Europe 72 33
Jamaica Caribbean 21 47
Japan Eastern Asia 102 26
Jordan Western Asia 118 23
Kazakhstan Central Asia 56 37
Kenya Eastern Africa 11 52
Kosovo Southern Europe 116 23
Kuwait Western Asia 24 46
Kyrgyzstan Central Asia 18 49
Latvia Northern Europe 110 24
Lebanon Western Asia 96 27
Liberia Western Africa 25 45
Lithuania Northern Europe 142 17
Luxembourg Western Europe 33 43
Madagascar Eastern Africa 101 26
Malawi Eastern Africa 44 42
Malaysia South Eastern Asia 10 52
Mali Western Africa 121 22
Malta Southern Europe 12 51
Mauritania Western Africa 109 24
Mauritius Eastern Africa 45 41
Mexico Central America 90 29
Mongolia Eastern Asia 52 39
Country Region Ranking Score(%)
Montenegro Southern Europe 98 27
Morocco Northern Africa 126 21
Myanmar South Eastern Asia 1 66
Namibia Southern Africa 61 36
Nepal Southern Asia 76 32
Netherlands Western Europe 7 56
New ZealandAustralia and New Zealand
3 61
Nicaragua Central America 69 34
Niger Western Africa 135 19
Nigeria Western Africa 43 42
Northern Cyprus Western Asia 30 43
Norway Northern Europe 15 49
Pakistan Southern Asia 94 28
Palestinian Territory Western Asia 141 17
Panama Central America 53 39
Paraguay South America 125 22
Peru South America 114 23
Philippines South Eastern Asia 46 40
Poland Eastern Europe 78 31
Portugal Southern Europe 82 30
Puerto Rico Caribbean 29 44
Republic of Korea Eastern Asia 64 35
Republic of Moldova Eastern Europe 120 23
Romania Eastern Europe 93 28
Russian Federation Eastern Europe 129 20
Rwanda Eastern Africa 137 19
Saudi Arabia Western Asia 47 40
Senegal Western Africa 85 30
Serbia Southern Europe 118 23
Sierra Leone Western Africa 54 38
Singapore South Eastern Asia 34 43
Slovakia Eastern Europe 123 22
Slovenia Southern Europe 37 42
South Africa Southern Africa 49 40
South Sudan Northern Africa 68 34
Spain Southern Europe 58 36
Sri Lanka Southern Asia 8 56
Sudan Northern Africa 67 35
Sweden Northern Europe 28 44
Switzerland Western Europe 40 42
Taiwan Eastern Asia 35 43
Tajikistan Central Asia 73 33
Thailand South Eastern Asia 19 48
The former Yugoslav Republic of Macedonia
Southern Europe 86 30
Country Region Ranking Score(%)
Togo Western Africa 133 19
Tunisia Northern Africa 139 17
Turkmenistan Central Asia 71 33
Uganda Eastern Africa 57 37
Ukraine Eastern Europe 89 29
United Arab Emirates Western Asia 14 50
United Kingdom Northern Europe 6 57
United Republic of Tanzania
Eastern Africa 81 30
United States of America
North America 2 61
Uruguay South America 77 31
Uzbekistan Central Asia 27 44
Venezuela South America 128 20
Vietnam South Eastern Asia 79 31
Yemen Western Asia 143 15
Zambia Eastern Africa 51 39
Zimbabwe Eastern Africa 87 29
Countries’ scores indicate a rise or fall in score of 3 percentage points or more since the 2013 survey.
Scores have increased by at least three percentage points.
Scores have decreased by at least three percentage points.
Scores in plain text have seen a change of less than three percentage points either way, or were not surveyed in 2013.
Only includes 2014 data.
World Giving Index scores are shown to the nearest whole number but the rankings are determined using two decimal points.
1 Alphabetical CAF World Giving Index full table
3332
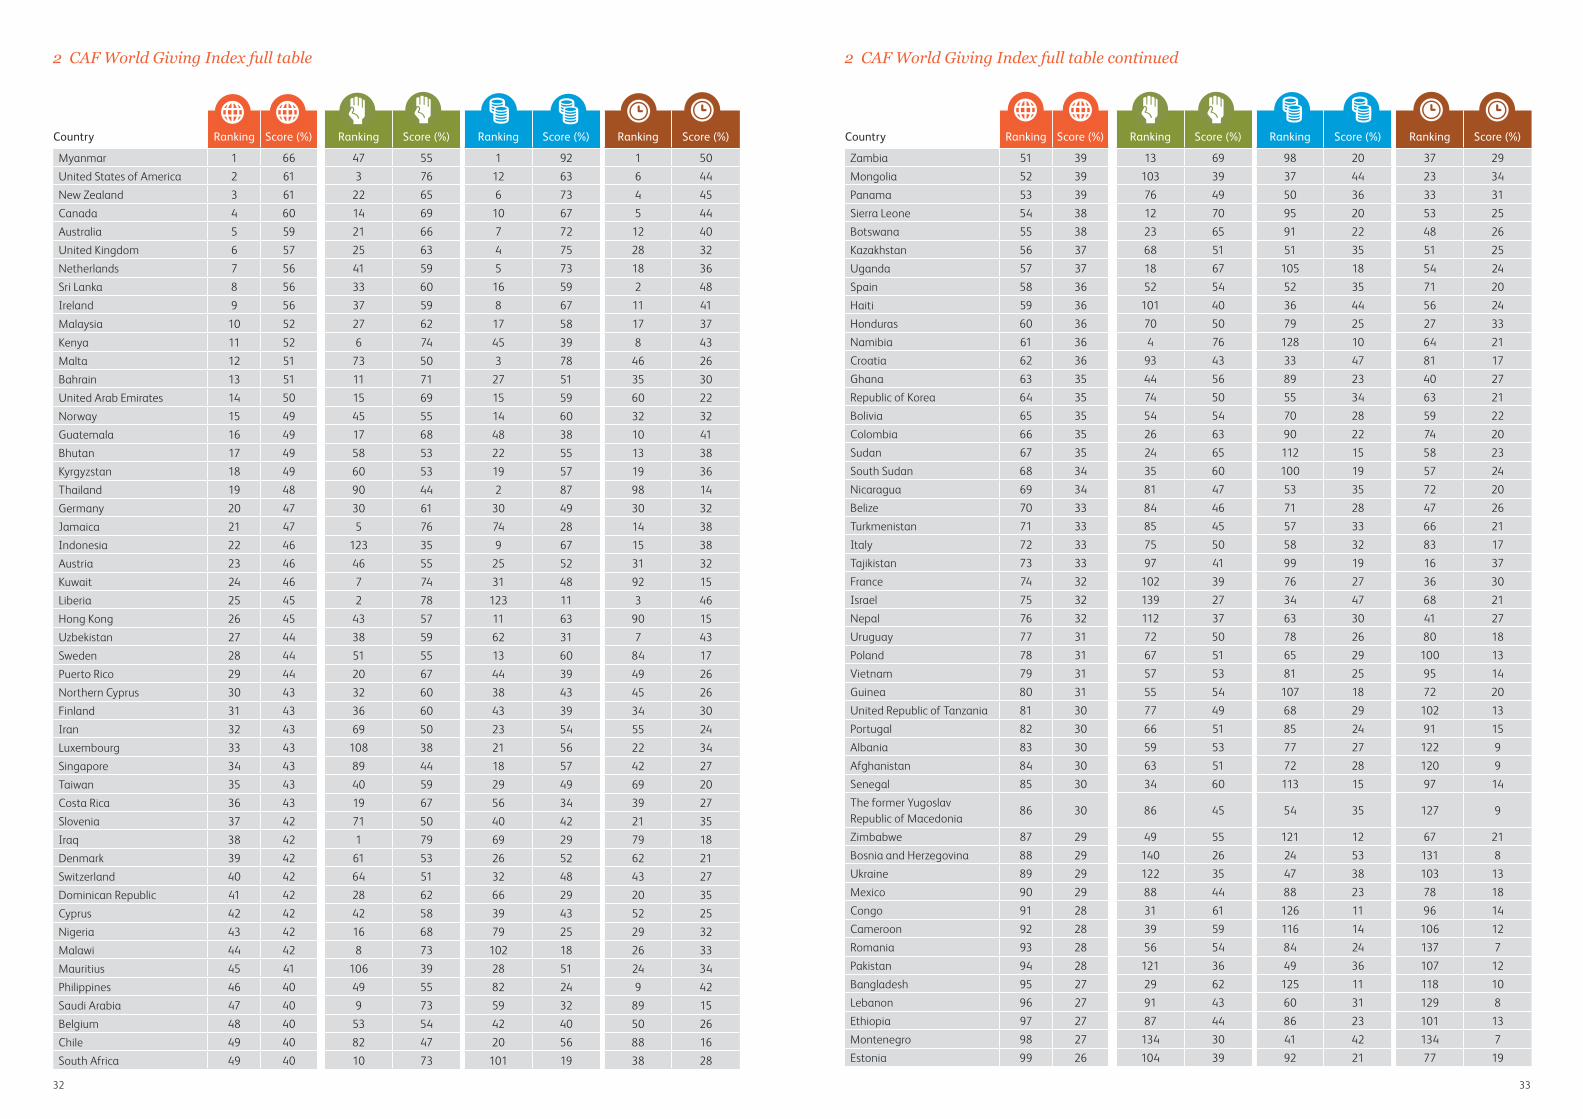
2 CAF World Giving Index full table continued
Country Ranking Score (%) Ranking Score (%) Ranking Score (%) Ranking Score (%)
Myanmar 1 66 47 55 1 92 1 50United States of America 2 61 3 76 12 63 6 44New Zealand 3 61 22 65 6 73 4 45Canada 4 60 14 69 10 67 5 44Australia 5 59 21 66 7 72 12 40United Kingdom 6 57 25 63 4 75 28 32Netherlands 7 56 41 59 5 73 18 36Sri Lanka 8 56 33 60 16 59 2 48Ireland 9 56 37 59 8 67 11 41Malaysia 10 52 27 62 17 58 17 37Kenya 11 52 6 74 45 39 8 43Malta 12 51 73 50 3 78 46 26Bahrain 13 51 11 71 27 51 35 30United Arab Emirates 14 50 15 69 15 59 60 22Norway 15 49 45 55 14 60 32 32Guatemala 16 49 17 68 48 38 10 41Bhutan 17 49 58 53 22 55 13 38Kyrgyzstan 18 49 60 53 19 57 19 36Thailand 19 48 90 44 2 87 98 14Germany 20 47 30 61 30 49 30 32Jamaica 21 47 5 76 74 28 14 38Indonesia 22 46 123 35 9 67 15 38Austria 23 46 46 55 25 52 31 32Kuwait 24 46 7 74 31 48 92 15Liberia 25 45 2 78 123 11 3 46Hong Kong 26 45 43 57 11 63 90 15Uzbekistan 27 44 38 59 62 31 7 43Sweden 28 44 51 55 13 60 84 17Puerto Rico 29 44 20 67 44 39 49 26Northern Cyprus 30 43 32 60 38 43 45 26Finland 31 43 36 60 43 39 34 30Iran 32 43 69 50 23 54 55 24Luxembourg 33 43 108 38 21 56 22 34Singapore 34 43 89 44 18 57 42 27Taiwan 35 43 40 59 29 49 69 20Costa Rica 36 43 19 67 56 34 39 27Slovenia 37 42 71 50 40 42 21 35Iraq 38 42 1 79 69 29 79 18Denmark 39 42 61 53 26 52 62 21Switzerland 40 42 64 51 32 48 43 27Dominican Republic 41 42 28 62 66 29 20 35Cyprus 42 42 42 58 39 43 52 25Nigeria 43 42 16 68 79 25 29 32Malawi 44 42 8 73 102 18 26 33Mauritius 45 41 106 39 28 51 24 34Philippines 46 40 49 55 82 24 9 42Saudi Arabia 47 40 9 73 59 32 89 15Belgium 48 40 53 54 42 40 50 26Chile 49 40 82 47 20 56 88 16South Africa 49 40 10 73 101 19 38 28
Country Ranking Score (%) Ranking Score (%) Ranking Score (%) Ranking Score (%)
Zambia 51 39 13 69 98 20 37 29Mongolia 52 39 103 39 37 44 23 34Panama 53 39 76 49 50 36 33 31Sierra Leone 54 38 12 70 95 20 53 25Botswana 55 38 23 65 91 22 48 26Kazakhstan 56 37 68 51 51 35 51 25Uganda 57 37 18 67 105 18 54 24Spain 58 36 52 54 52 35 71 20Haiti 59 36 101 40 36 44 56 24Honduras 60 36 70 50 79 25 27 33Namibia 61 36 4 76 128 10 64 21Croatia 62 36 93 43 33 47 81 17Ghana 63 35 44 56 89 23 40 27Republic of Korea 64 35 74 50 55 34 63 21Bolivia 65 35 54 54 70 28 59 22Colombia 66 35 26 63 90 22 74 20Sudan 67 35 24 65 112 15 58 23South Sudan 68 34 35 60 100 19 57 24Nicaragua 69 34 81 47 53 35 72 20Belize 70 33 84 46 71 28 47 26Turkmenistan 71 33 85 45 57 33 66 21Italy 72 33 75 50 58 32 83 17Tajikistan 73 33 97 41 99 19 16 37France 74 32 102 39 76 27 36 30Israel 75 32 139 27 34 47 68 21Nepal 76 32 112 37 63 30 41 27Uruguay 77 31 72 50 78 26 80 18Poland 78 31 67 51 65 29 100 13Vietnam 79 31 57 53 81 25 95 14Guinea 80 31 55 54 107 18 72 20United Republic of Tanzania 81 30 77 49 68 29 102 13Portugal 82 30 66 51 85 24 91 15Albania 83 30 59 53 77 27 122 9Afghanistan 84 30 63 51 72 28 120 9Senegal 85 30 34 60 113 15 97 14The former Yugoslav Republic of Macedonia
86 30 86 45 54 35 127 9
Zimbabwe 87 29 49 55 121 12 67 21Bosnia and Herzegovina 88 29 140 26 24 53 131 8Ukraine 89 29 122 35 47 38 103 13Mexico 90 29 88 44 88 23 78 18Congo 91 28 31 61 126 11 96 14Cameroon 92 28 39 59 116 14 106 12Romania 93 28 56 54 84 24 137 7Pakistan 94 28 121 36 49 36 107 12Bangladesh 95 27 29 62 125 11 118 10Lebanon 96 27 91 43 60 31 129 8Ethiopia 97 27 87 44 86 23 101 13Montenegro 98 27 134 30 41 42 134 7Estonia 99 26 104 39 92 21 77 19
2 CAF World Giving Index full table
3534
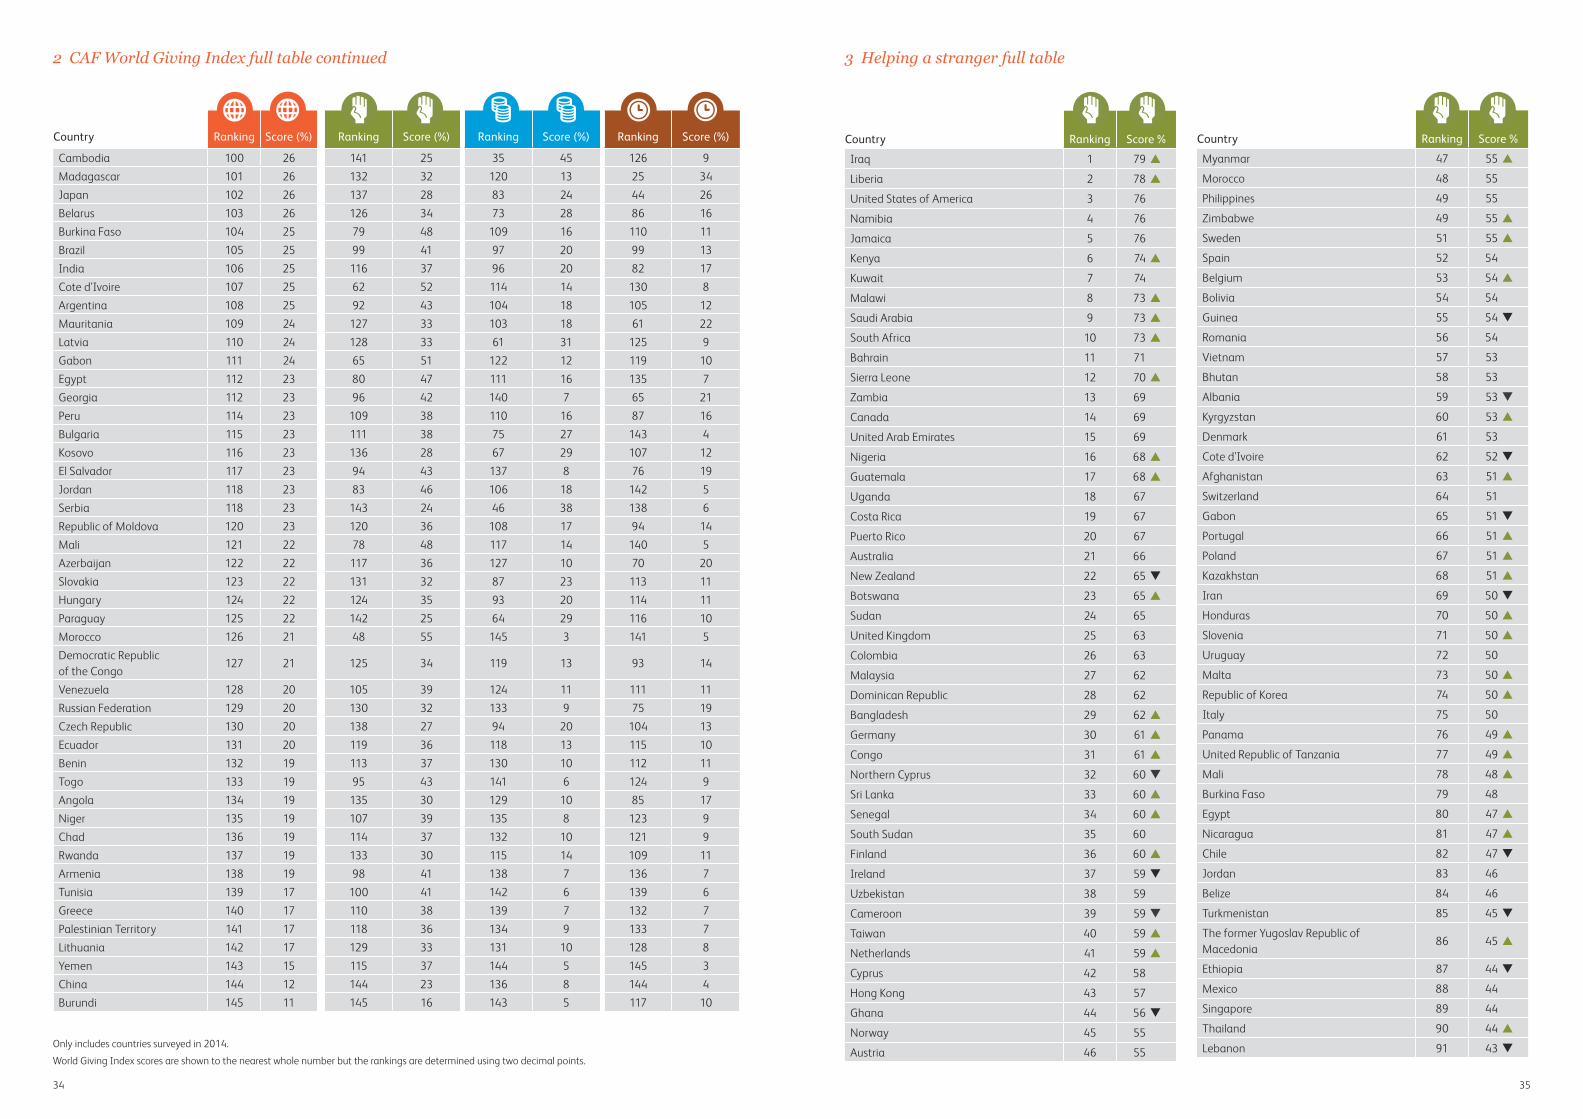
2 CAF World Giving Index full table continued 3 Helping a stranger full table
Country Ranking Score (%) Ranking Score (%) Ranking Score (%) Ranking Score (%)
Cambodia 100 26 141 25 35 45 126 9Madagascar 101 26 132 32 120 13 25 34Japan 102 26 137 28 83 24 44 26Belarus 103 26 126 34 73 28 86 16Burkina Faso 104 25 79 48 109 16 110 11Brazil 105 25 99 41 97 20 99 13India 106 25 116 37 96 20 82 17Cote d'Ivoire 107 25 62 52 114 14 130 8Argentina 108 25 92 43 104 18 105 12Mauritania 109 24 127 33 103 18 61 22Latvia 110 24 128 33 61 31 125 9Gabon 111 24 65 51 122 12 119 10Egypt 112 23 80 47 111 16 135 7Georgia 112 23 96 42 140 7 65 21Peru 114 23 109 38 110 16 87 16Bulgaria 115 23 111 38 75 27 143 4Kosovo 116 23 136 28 67 29 107 12El Salvador 117 23 94 43 137 8 76 19Jordan 118 23 83 46 106 18 142 5Serbia 118 23 143 24 46 38 138 6Republic of Moldova 120 23 120 36 108 17 94 14Mali 121 22 78 48 117 14 140 5Azerbaijan 122 22 117 36 127 10 70 20Slovakia 123 22 131 32 87 23 113 11Hungary 124 22 124 35 93 20 114 11Paraguay 125 22 142 25 64 29 116 10Morocco 126 21 48 55 145 3 141 5Democratic Republic of the Congo
127 21 125 34 119 13 93 14
Venezuela 128 20 105 39 124 11 111 11Russian Federation 129 20 130 32 133 9 75 19Czech Republic 130 20 138 27 94 20 104 13Ecuador 131 20 119 36 118 13 115 10Benin 132 19 113 37 130 10 112 11Togo 133 19 95 43 141 6 124 9Angola 134 19 135 30 129 10 85 17Niger 135 19 107 39 135 8 123 9Chad 136 19 114 37 132 10 121 9Rwanda 137 19 133 30 115 14 109 11Armenia 138 19 98 41 138 7 136 7Tunisia 139 17 100 41 142 6 139 6Greece 140 17 110 38 139 7 132 7Palestinian Territory 141 17 118 36 134 9 133 7Lithuania 142 17 129 33 131 10 128 8Yemen 143 15 115 37 144 5 145 3China 144 12 144 23 136 8 144 4Burundi 145 11 145 16 143 5 117 10
Only includes countries surveyed in 2014.
World Giving Index scores are shown to the nearest whole number but the rankings are determined using two decimal points.
Country Ranking Score %
Myanmar 47 55
Morocco 48 55
Philippines 49 55
Zimbabwe 49 55
Sweden 51 55
Spain 52 54
Belgium 53 54
Bolivia 54 54
Guinea 55 54
Romania 56 54
Vietnam 57 53
Bhutan 58 53
Albania 59 53
Kyrgyzstan 60 53
Denmark 61 53
Cote d'Ivoire 62 52
Afghanistan 63 51
Switzerland 64 51
Gabon 65 51
Portugal 66 51
Poland 67 51
Kazakhstan 68 51
Iran 69 50
Honduras 70 50
Slovenia 71 50
Uruguay 72 50
Malta 73 50
Republic of Korea 74 50
Italy 75 50
Panama 76 49
United Republic of Tanzania 77 49
Mali 78 48
Burkina Faso 79 48
Egypt 80 47
Nicaragua 81 47
Chile 82 47
Jordan 83 46
Belize 84 46
Turkmenistan 85 45
The former Yugoslav Republic of Macedonia
86 45
Ethiopia 87 44
Mexico 88 44
Singapore 89 44
Thailand 90 44
Lebanon 91 43
Country Ranking Score %
Iraq 1 79
Liberia 2 78
United States of America 3 76
Namibia 4 76
Jamaica 5 76
Kenya 6 74
Kuwait 7 74
Malawi 8 73
Saudi Arabia 9 73
South Africa 10 73
Bahrain 11 71
Sierra Leone 12 70
Zambia 13 69
Canada 14 69
United Arab Emirates 15 69
Nigeria 16 68
Guatemala 17 68
Uganda 18 67
Costa Rica 19 67
Puerto Rico 20 67
Australia 21 66
New Zealand 22 65
Botswana 23 65
Sudan 24 65
United Kingdom 25 63
Colombia 26 63
Malaysia 27 62
Dominican Republic 28 62
Bangladesh 29 62
Germany 30 61
Congo 31 61
Northern Cyprus 32 60
Sri Lanka 33 60
Senegal 34 60
South Sudan 35 60
Finland 36 60
Ireland 37 59
Uzbekistan 38 59
Cameroon 39 59
Taiwan 40 59
Netherlands 41 59
Cyprus 42 58
Hong Kong 43 57
Ghana 44 56
Norway 45 55
Austria 46 55

3736
3 Helping a stranger full table continued
Country Ranking Score %
Argentina 92 43
Croatia 93 43
El Salvador 94 43
Togo 95 43
Georgia 96 42
Tajikistan 97 41
Armenia 98 41
Brazil 99 41
Tunisia 100 41
Haiti 101 40
France 102 39
Mongolia 103 39
Estonia 104 39
Venezuela 105 39
Mauritius 106 39
Niger 107 39
Luxembourg 108 38
Peru 109 38
Greece 110 38
Bulgaria 111 38
Nepal 112 37
Benin 113 37
Chad 114 37
Yemen 115 37
India 116 37
Azerbaijan 117 36
Palestinian Territory 118 36
Ecuador 119 36
Republic of Moldova 120 36
Pakistan 121 36
Ukraine 122 35
Indonesia 123 35
Hungary 124 35
Democratic Republic of the Congo 125 34
Belarus 126 34
Mauritania 127 33
Latvia 128 33
Lithuania 129 33
Russian Federation 130 32
Slovakia 131 32
Madagascar 132 32
Rwanda 133 30
Montenegro 134 30
Angola 135 30
Kosovo 136 28
Japan 137 28
Country Ranking Score %
Czech Republic 138 27
Israel 139 27
Bosnia and Herzegovina 140 26
Cambodia 141 25
Paraguay 142 25
Serbia 143 24
China 144 23
Burundi 145 16
Countries’ scores indicate a rise or fall in score of 3 percentage points or more since the 2013 survey.
Scores have increased by at least three percentage points.
Scores have decreased by at least three percentage points.
Scores in plain text have seen a change of less than three percentage points either way, or were not surveyed in 2013.
Only includes countries surveyed in 2014.
Data relate to participation in helping a stranger during one month prior to interview.
World Giving Index scores are shown to the nearest whole number but the rankings are determined using two decimal points.
Country Ranking Score %
Ukraine 47 38
Guatemala 48 38
Pakistan 49 36
Panama 50 36
Kazakhstan 51 35
Spain 52 35
Nicaragua 53 35
The former Yugoslav Republic of Macedonia
54 35
Republic of Korea 55 34
Costa Rica 56 34
Turkmenistan 57 33
Italy 58 32
Saudi Arabia 59 32
Lebanon 60 31
Latvia 61 31
Uzbekistan 62 31
Nepal 63 30
Paraguay 64 29
Poland 65 29
Dominican Republic 66 29
Kosovo 67 29
United Republic of Tanzania 68 29
Iraq 69 29
Bolivia 70 28
Belize 71 28
Afghanistan 72 28
Belarus 73 28
Jamaica 74 28
Bulgaria 75 27
France 76 27
Albania 77 27
Uruguay 78 26
Honduras 79 25
Nigeria 79 25
Vietnam 81 25
Philippines 82 24
Japan 83 24
Romania 84 24
Portugal 85 24
Ethiopia 86 23
Slovakia 87 23
Mexico 88 23
Ghana 89 23
Colombia 90 22
Botswana 91 22
Country Ranking Score %
Myanmar 1 92
Thailand 2 87
Malta 3 78
United Kingdom 4 75
Netherlands 5 73
New Zealand 6 73
Australia 7 72
Ireland 8 67
Indonesia 9 67
Canada 10 67
Hong Kong 11 63
United States of America 12 63
Sweden 13 60
Norway 14 60
United Arab Emirates 15 59
Sri Lanka 16 59
Malaysia 17 58
Singapore 18 57
Kyrgyzstan 19 57
Chile 20 56
Luxembourg 21 56
Bhutan 22 55
Iran 23 54
Bosnia and Herzegovina 24 53
Austria 25 52
Denmark 26 52
Bahrain 27 51
Mauritius 28 51
Taiwan 29 49
Germany 30 49
Kuwait 31 48
Switzerland 32 48
Croatia 33 47
Israel 34 47
Cambodia 35 45
Haiti 36 44
Mongolia 37 44
Northern Cyprus 38 43
Cyprus 39 43
Slovenia 40 42
Montenegro 41 42
Belgium 42 40
Finland 43 39
Puerto Rico 44 39
Kenya 45 39
Serbia 46 38
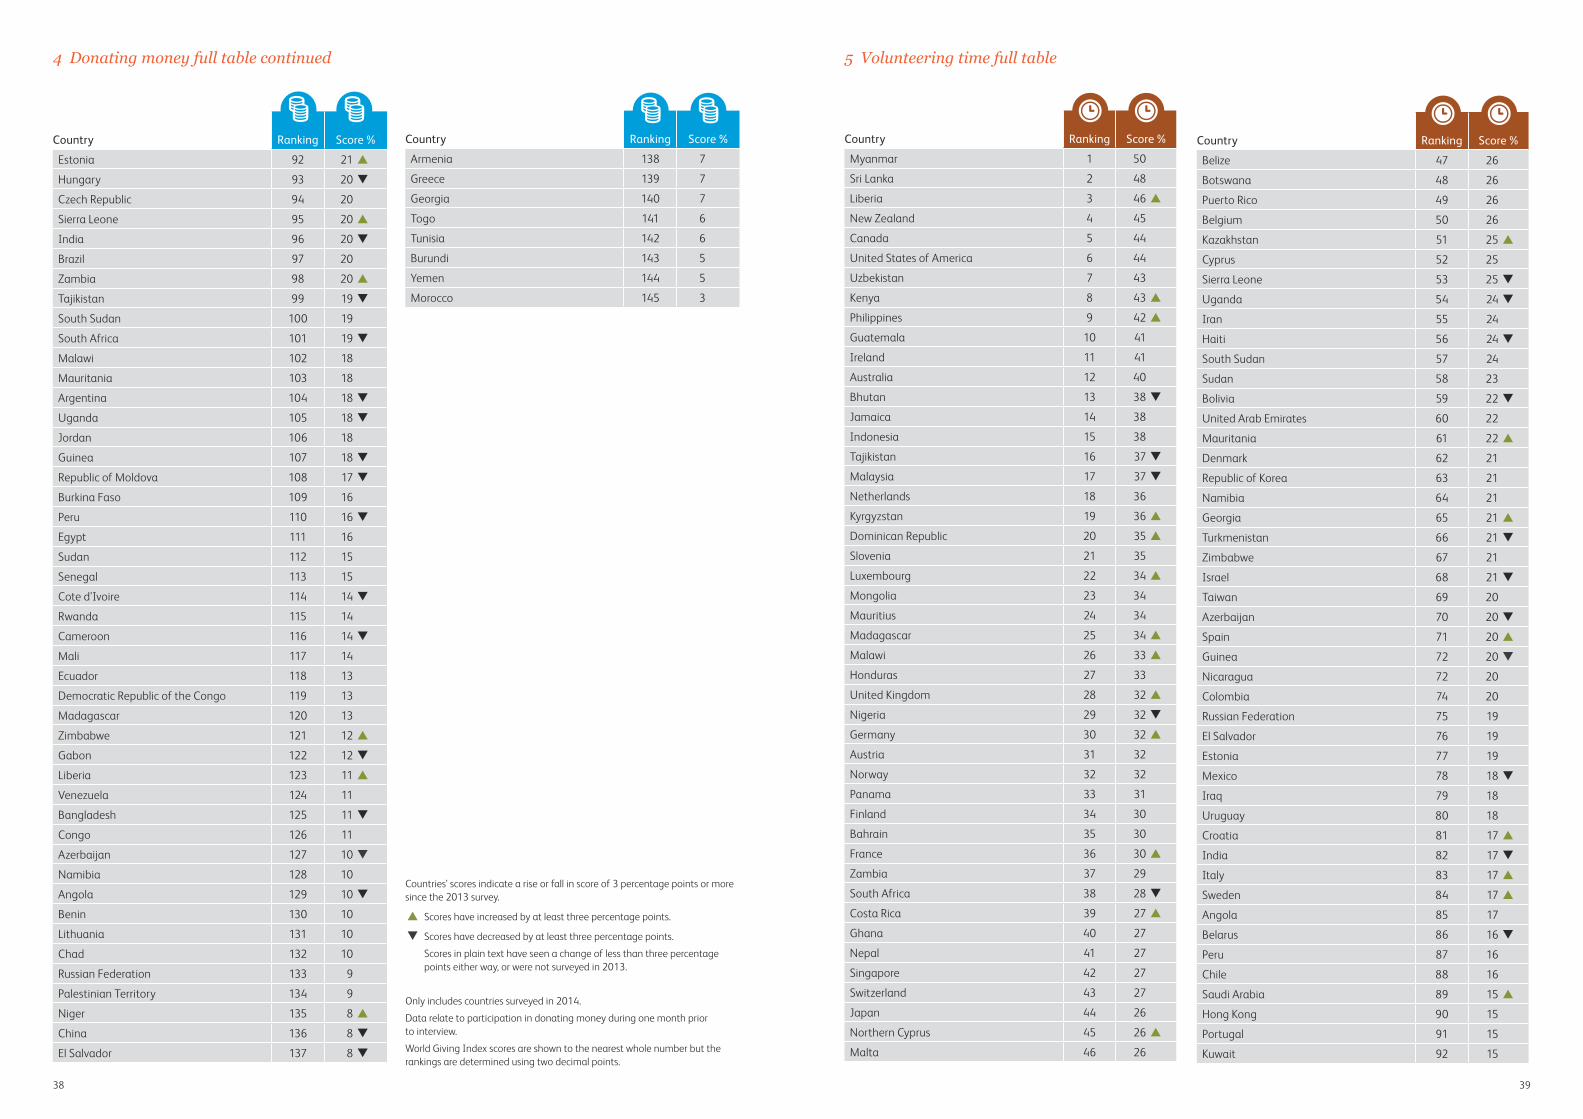
4 Donating money full table
3938
4 Donating money full table continued
Country Ranking Score %
Estonia 92 21
Hungary 93 20
Czech Republic 94 20
Sierra Leone 95 20
India 96 20
Brazil 97 20
Zambia 98 20
Tajikistan 99 19
South Sudan 100 19
South Africa 101 19
Malawi 102 18
Mauritania 103 18
Argentina 104 18
Uganda 105 18
Jordan 106 18
Guinea 107 18
Republic of Moldova 108 17
Burkina Faso 109 16
Peru 110 16
Egypt 111 16
Sudan 112 15
Senegal 113 15
Cote d'Ivoire 114 14
Rwanda 115 14
Cameroon 116 14
Mali 117 14
Ecuador 118 13
Democratic Republic of the Congo 119 13
Madagascar 120 13
Zimbabwe 121 12
Gabon 122 12
Liberia 123 11
Venezuela 124 11
Bangladesh 125 11
Congo 126 11
Azerbaijan 127 10
Namibia 128 10
Angola 129 10
Benin 130 10
Lithuania 131 10
Chad 132 10
Russian Federation 133 9
Palestinian Territory 134 9
Niger 135 8
China 136 8
El Salvador 137 8
Country Ranking Score %
Armenia 138 7
Greece 139 7
Georgia 140 7
Togo 141 6
Tunisia 142 6
Burundi 143 5
Yemen 144 5
Morocco 145 3
Countries’ scores indicate a rise or fall in score of 3 percentage points or more since the 2013 survey.
Scores have increased by at least three percentage points.
Scores have decreased by at least three percentage points.
Scores in plain text have seen a change of less than three percentage points either way, or were not surveyed in 2013.
Only includes countries surveyed in 2014.
Data relate to participation in donating money during one month prior to interview.
World Giving Index scores are shown to the nearest whole number but the rankings are determined using two decimal points.
Country Ranking Score %
Belize 47 26
Botswana 48 26
Puerto Rico 49 26
Belgium 50 26
Kazakhstan 51 25
Cyprus 52 25
Sierra Leone 53 25
Uganda 54 24
Iran 55 24
Haiti 56 24
South Sudan 57 24
Sudan 58 23
Bolivia 59 22
United Arab Emirates 60 22
Mauritania 61 22
Denmark 62 21
Republic of Korea 63 21
Namibia 64 21
Georgia 65 21
Turkmenistan 66 21
Zimbabwe 67 21
Israel 68 21
Taiwan 69 20
Azerbaijan 70 20
Spain 71 20
Guinea 72 20
Nicaragua 72 20
Colombia 74 20
Russian Federation 75 19
El Salvador 76 19
Estonia 77 19
Mexico 78 18
Iraq 79 18
Uruguay 80 18
Croatia 81 17
India 82 17
Italy 83 17
Sweden 84 17
Angola 85 17
Belarus 86 16
Peru 87 16
Chile 88 16
Saudi Arabia 89 15
Hong Kong 90 15
Portugal 91 15
Kuwait 92 15
Country Ranking Score %
Myanmar 1 50
Sri Lanka 2 48
Liberia 3 46
New Zealand 4 45
Canada 5 44
United States of America 6 44
Uzbekistan 7 43
Kenya 8 43
Philippines 9 42
Guatemala 10 41
Ireland 11 41
Australia 12 40
Bhutan 13 38
Jamaica 14 38
Indonesia 15 38
Tajikistan 16 37
Malaysia 17 37
Netherlands 18 36
Kyrgyzstan 19 36
Dominican Republic 20 35
Slovenia 21 35
Luxembourg 22 34
Mongolia 23 34
Mauritius 24 34
Madagascar 25 34
Malawi 26 33
Honduras 27 33
United Kingdom 28 32
Nigeria 29 32
Germany 30 32
Austria 31 32
Norway 32 32
Panama 33 31
Finland 34 30
Bahrain 35 30
France 36 30
Zambia 37 29
South Africa 38 28
Costa Rica 39 27
Ghana 40 27
Nepal 41 27
Singapore 42 27
Switzerland 43 27
Japan 44 26
Northern Cyprus 45 26
Malta 46 26
5 Volunteering time full table
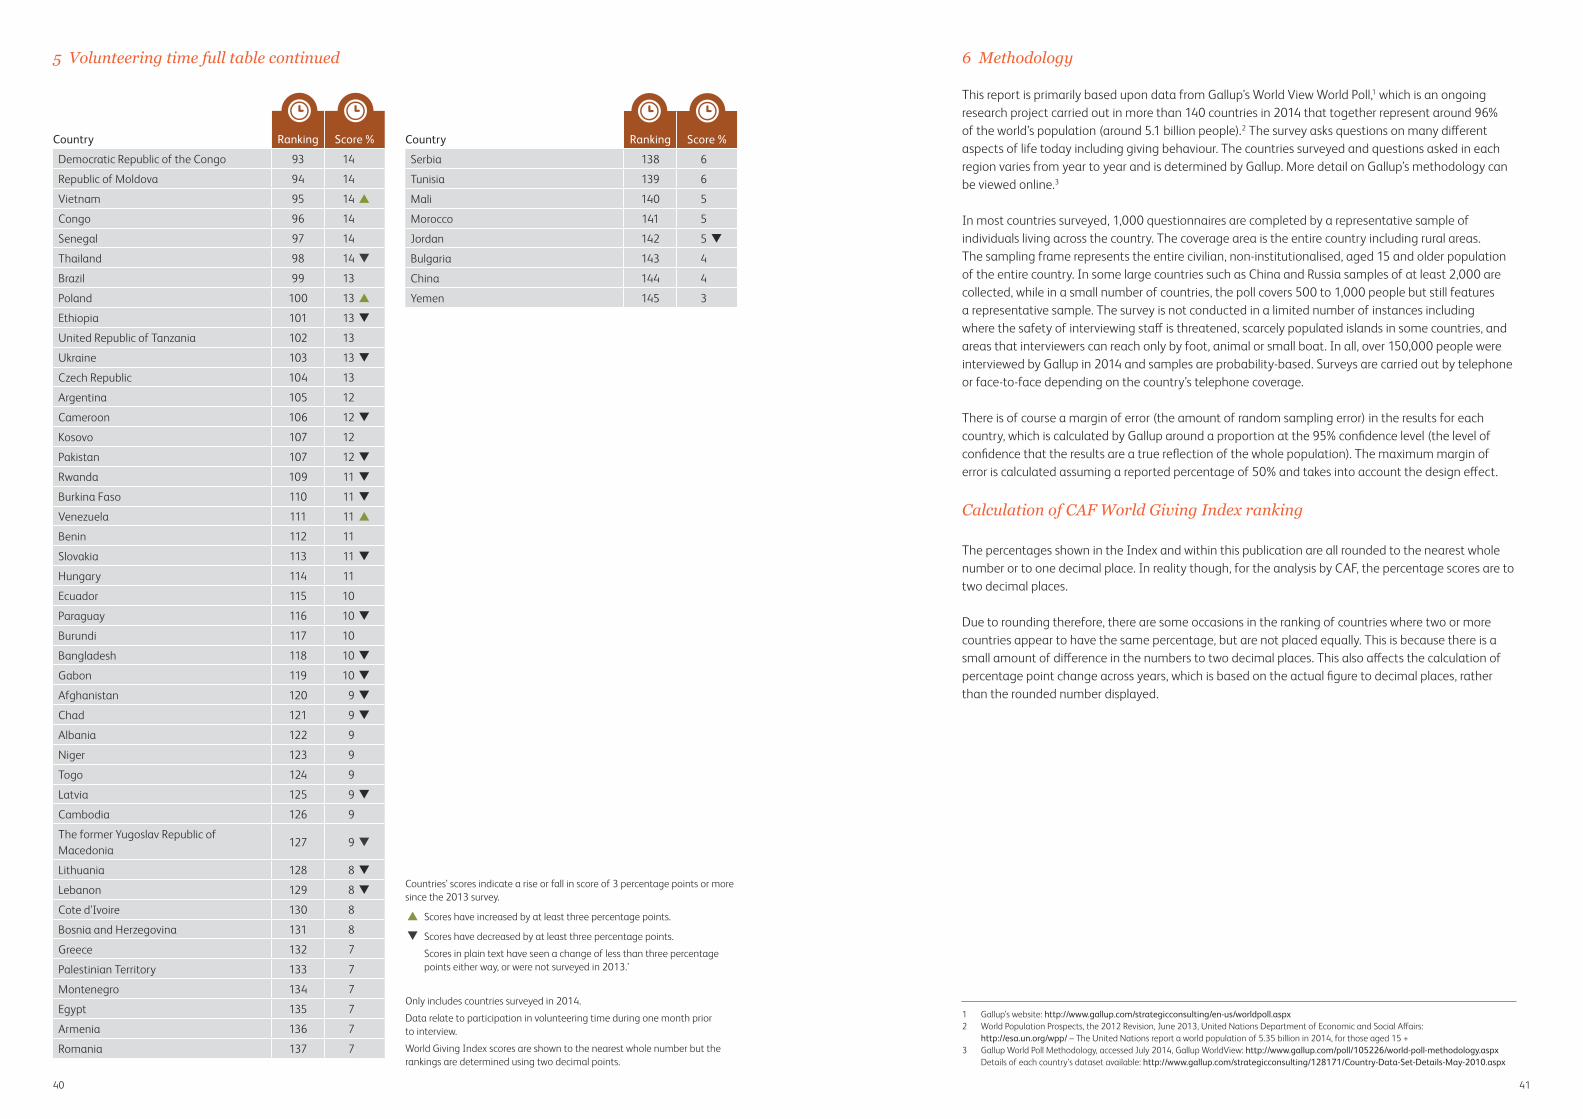
4140
6 Methodology
This report is primarily based upon data from Gallup’s World View World Poll,1 which is an ongoing research project carried out in more than 140 countries in 2014 that together represent around 96% of the world’s population (around 5.1 billion people).2 The survey asks questions on many different aspects of life today including giving behaviour. The countries surveyed and questions asked in each region varies from year to year and is determined by Gallup. More detail on Gallup’s methodology can be viewed online.3
In most countries surveyed, 1,000 questionnaires are completed by a representative sample of individuals living across the country. The coverage area is the entire country including rural areas. The sampling frame represents the entire civilian, non-institutionalised, aged 15 and older population of the entire country. In some large countries such as China and Russia samples of at least 2,000 are collected, while in a small number of countries, the poll covers 500 to 1,000 people but still features a representative sample. The survey is not conducted in a limited number of instances including where the safety of interviewing staff is threatened, scarcely populated islands in some countries, and areas that interviewers can reach only by foot, animal or small boat. In all, over 150,000 people were interviewed by Gallup in 2014 and samples are probability-based. Surveys are carried out by telephone or face-to-face depending on the country’s telephone coverage.
There is of course a margin of error (the amount of random sampling error) in the results for each country, which is calculated by Gallup around a proportion at the 95% confidence level (the level of confidence that the results are a true reflection of the whole population). The maximum margin of error is calculated assuming a reported percentage of 50% and takes into account the design effect.
Calculation of CAF World Giving Index ranking
The percentages shown in the Index and within this publication are all rounded to the nearest whole number or to one decimal place. In reality though, for the analysis by CAF, the percentage scores are to two decimal places. Due to rounding therefore, there are some occasions in the ranking of countries where two or more countries appear to have the same percentage, but are not placed equally. This is because there is a small amount of difference in the numbers to two decimal places. This also affects the calculation of percentage point change across years, which is based on the actual figure to decimal places, rather than the rounded number displayed.
1 Gallup’s website: http://www.gallup.com/strategicconsulting/en-us/worldpoll.aspx2 World Population Prospects, the 2012 Revision, June 2013, United Nations Department of Economic and Social Affairs:
http://esa.un.org/wpp/ – The United Nations report a world population of 5.35 billion in 2014, for those aged 15 +3 Gallup World Poll Methodology, accessed July 2014, Gallup WorldView: http://www.gallup.com/poll/105226/world-poll-methodology.aspx
Details of each country’s dataset available: http://www.gallup.com/strategicconsulting/128171/Country-Data-Set-Details-May-2010.aspx
5 Volunteering time full table continued
Country Ranking Score %
Democratic Republic of the Congo 93 14
Republic of Moldova 94 14
Vietnam 95 14
Congo 96 14
Senegal 97 14
Thailand 98 14
Brazil 99 13
Poland 100 13
Ethiopia 101 13
United Republic of Tanzania 102 13
Ukraine 103 13
Czech Republic 104 13
Argentina 105 12
Cameroon 106 12
Kosovo 107 12
Pakistan 107 12
Rwanda 109 11
Burkina Faso 110 11
Venezuela 111 11
Benin 112 11
Slovakia 113 11
Hungary 114 11
Ecuador 115 10
Paraguay 116 10
Burundi 117 10
Bangladesh 118 10
Gabon 119 10
Afghanistan 120 9
Chad 121 9
Albania 122 9
Niger 123 9
Togo 124 9
Latvia 125 9
Cambodia 126 9
The former Yugoslav Republic of Macedonia
127 9
Lithuania 128 8
Lebanon 129 8
Cote d'Ivoire 130 8
Bosnia and Herzegovina 131 8
Greece 132 7
Palestinian Territory 133 7
Montenegro 134 7
Egypt 135 7
Armenia 136 7
Romania 137 7
Country Ranking Score %
Serbia 138 6
Tunisia 139 6
Mali 140 5
Morocco 141 5
Jordan 142 5
Bulgaria 143 4
China 144 4
Yemen 145 3
Countries’ scores indicate a rise or fall in score of 3 percentage points or more since the 2013 survey.
Scores have increased by at least three percentage points.
Scores have decreased by at least three percentage points.
Scores in plain text have seen a change of less than three percentage points either way, or were not surveyed in 2013.’
Only includes countries surveyed in 2014.
Data relate to participation in volunteering time during one month prior to interview.
World Giving Index scores are shown to the nearest whole number but the rankings are determined using two decimal points.
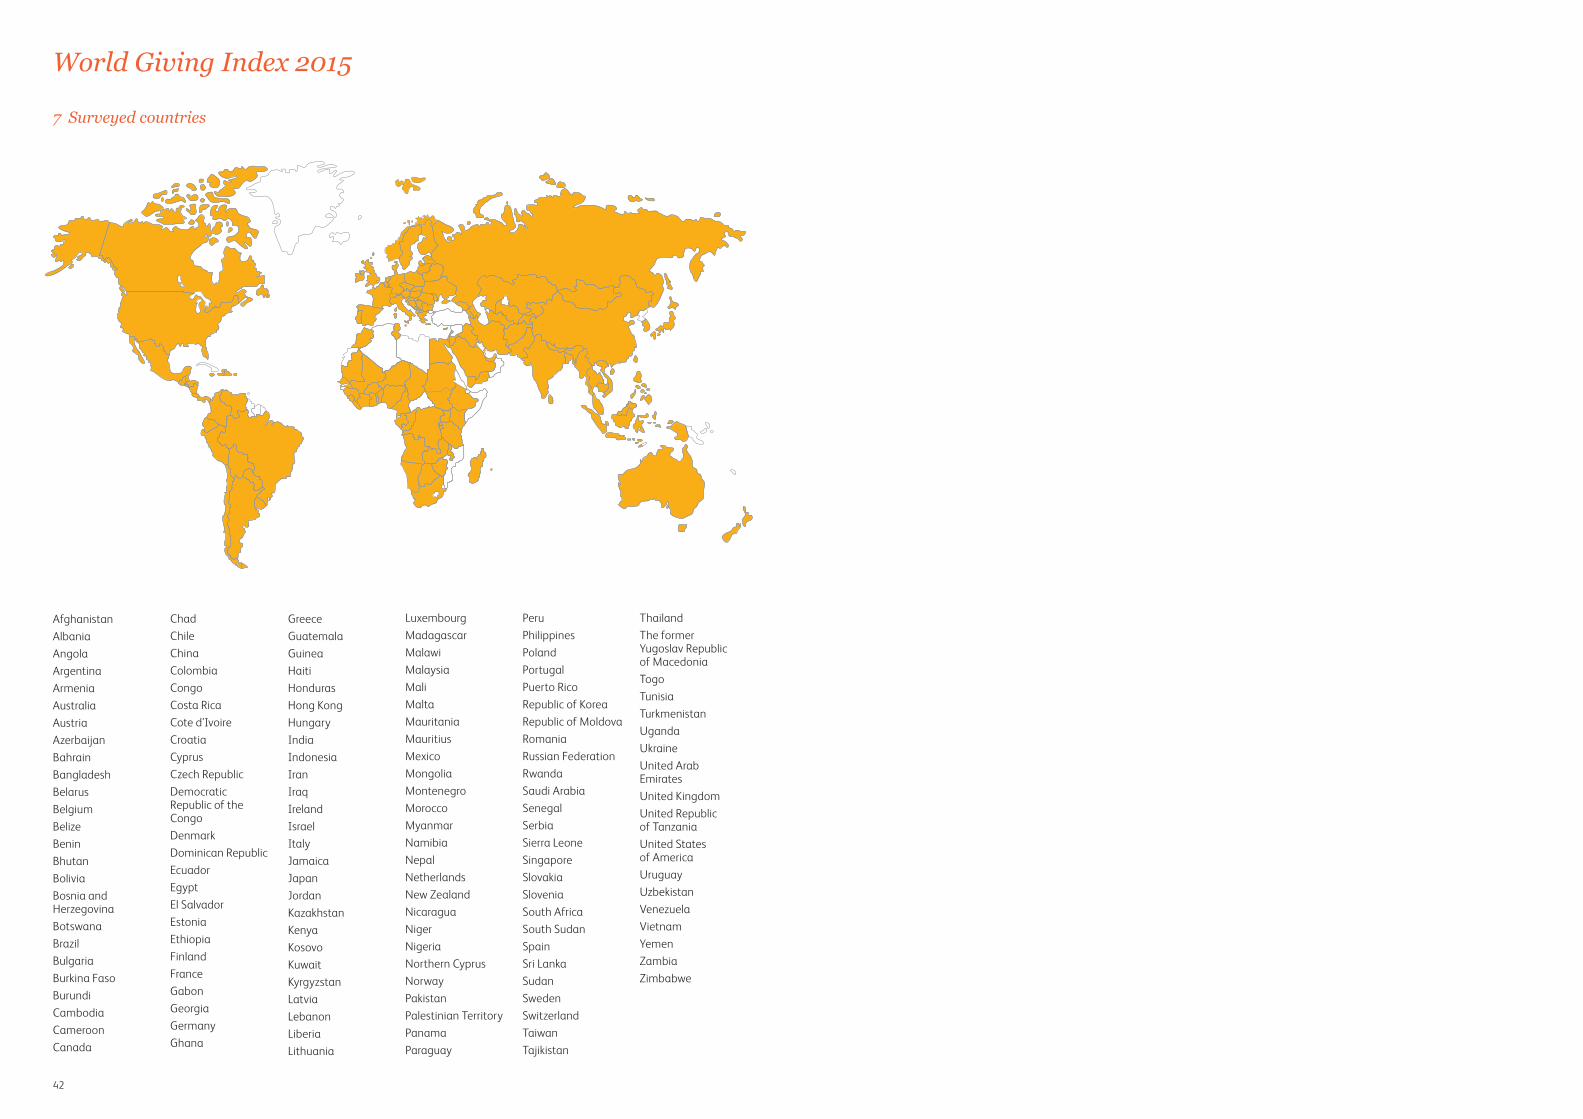
42
World Giving Index 2015
AfghanistanAlbaniaAngolaArgentinaArmeniaAustraliaAustriaAzerbaijanBahrainBangladeshBelarusBelgiumBelizeBeninBhutanBoliviaBosnia and HerzegovinaBotswanaBrazilBulgariaBurkina FasoBurundiCambodiaCameroonCanada
ChadChileChinaColombiaCongoCosta RicaCote d'IvoireCroatiaCyprusCzech RepublicDemocratic Republic of the CongoDenmarkDominican RepublicEcuadorEgyptEl SalvadorEstoniaEthiopiaFinlandFranceGabonGeorgiaGermanyGhana
GreeceGuatemalaGuineaHaitiHondurasHong KongHungaryIndiaIndonesiaIranIraqIrelandIsraelItalyJamaicaJapanJordanKazakhstanKenyaKosovoKuwaitKyrgyzstanLatviaLebanonLiberiaLithuania
LuxembourgMadagascarMalawiMalaysiaMaliMaltaMauritaniaMauritiusMexicoMongoliaMontenegroMoroccoMyanmarNamibiaNepalNetherlandsNew ZealandNicaraguaNigerNigeriaNorthern CyprusNorwayPakistanPalestinian TerritoryPanamaParaguay
PeruPhilippinesPolandPortugalPuerto RicoRepublic of KoreaRepublic of MoldovaRomaniaRussian FederationRwandaSaudi ArabiaSenegalSerbiaSierra LeoneSingaporeSlovakiaSloveniaSouth AfricaSouth SudanSpainSri LankaSudanSwedenSwitzerlandTaiwanTajikistan
ThailandThe former Yugoslav Republic of MacedoniaTogoTunisiaTurkmenistanUgandaUkraineUnited Arab EmiratesUnited KingdomUnited Republic of TanzaniaUnited States of AmericaUruguayUzbekistanVenezuelaVietnamYemenZambiaZimbabwe
7 Surveyed countries
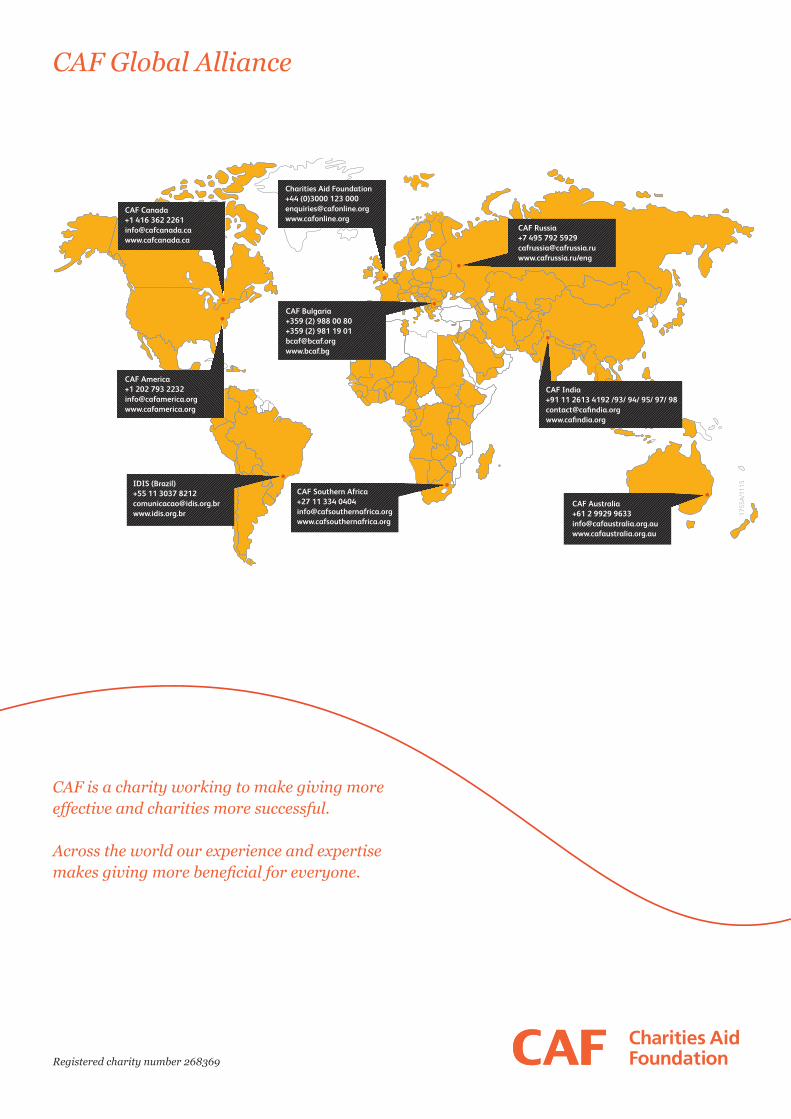
Registered charity number 268369
CAF is a charity working to make giving more effective and charities more successful.
Across the world our experience and expertise makes giving more beneficial for everyone.
1755
A/11
15
CAF Global Alliance
CAF Bulgaria+359 (2) 988 00 80+359 (2) 981 19 [email protected]
CAF Southern Africa+27 11 334 [email protected]
IDIS (Brazil)+55 11 3037 [email protected]
CAF India+91 11 2613 4192 /93/ 94/ 95/ 97/ [email protected]
CAF Australia+61 2 9929 [email protected]
CAF Russia+7 495 792 [email protected]/eng
Charities Aid Foundation+44 (0)3000 123 [email protected]
CAF Canada+1 416 362 [email protected]
CAF America+1 202 793 [email protected]