Embed Size (px)
Citation preview
Black & Veatch Insights Group
2017 STRATEGIC DIRECTIONS: SMART CITY/SMART UTILITY REPORT SURVEY RESULTS
30 January 2017Questions: [email protected]
Download the full report at www.bv.com/reports.
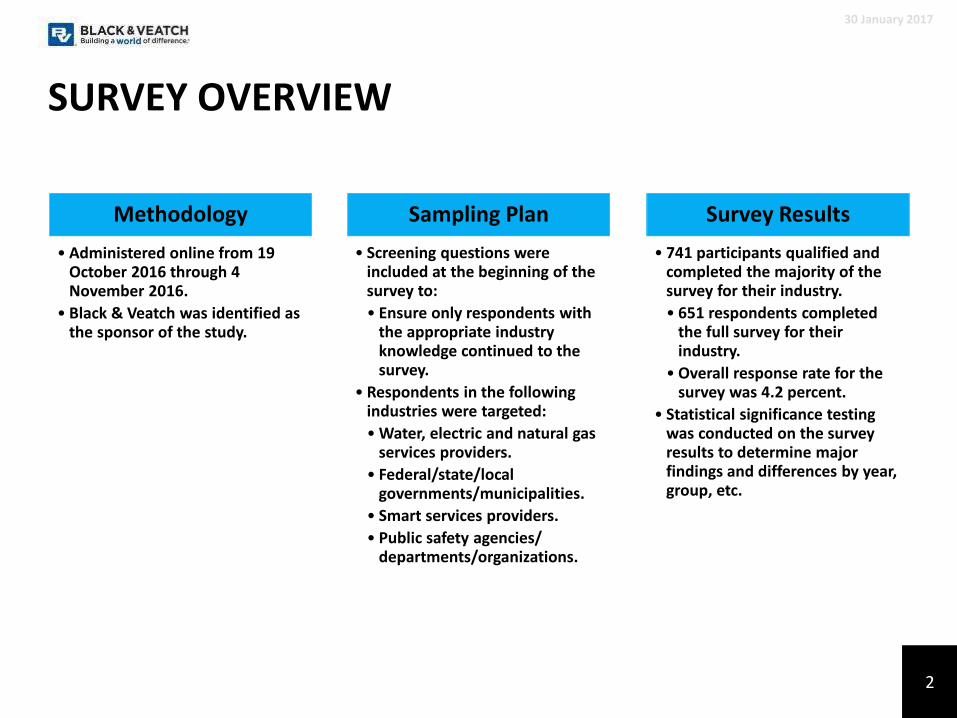
SURVEY OVERVIEW
30 January 2017
Methodology
• Administered online from 19 October 2016 through 4 November 2016.
• Black & Veatch was identified as the sponsor of the study.
Sampling Plan
• Screening questions were included at the beginning of the survey to:
• Ensure only respondents with the appropriate industry knowledge continued to the survey.
• Respondents in the following industries were targeted:
• Water, electric and natural gas services providers.
• Federal/state/local governments/municipalities.
• Smart services providers.
• Public safety agencies/ departments/organizations.
Survey Results
• 741 participants qualified and completed the majority of the survey for their industry.
• 651 respondents completed the full survey for their industry.
• Overall response rate for the survey was 4.2 percent.
• Statistical significance testing was conducted on the survey results to determine major findings and differences by year, group, etc.
2
SMART CITY PERCEPTIONS
30 January 2017
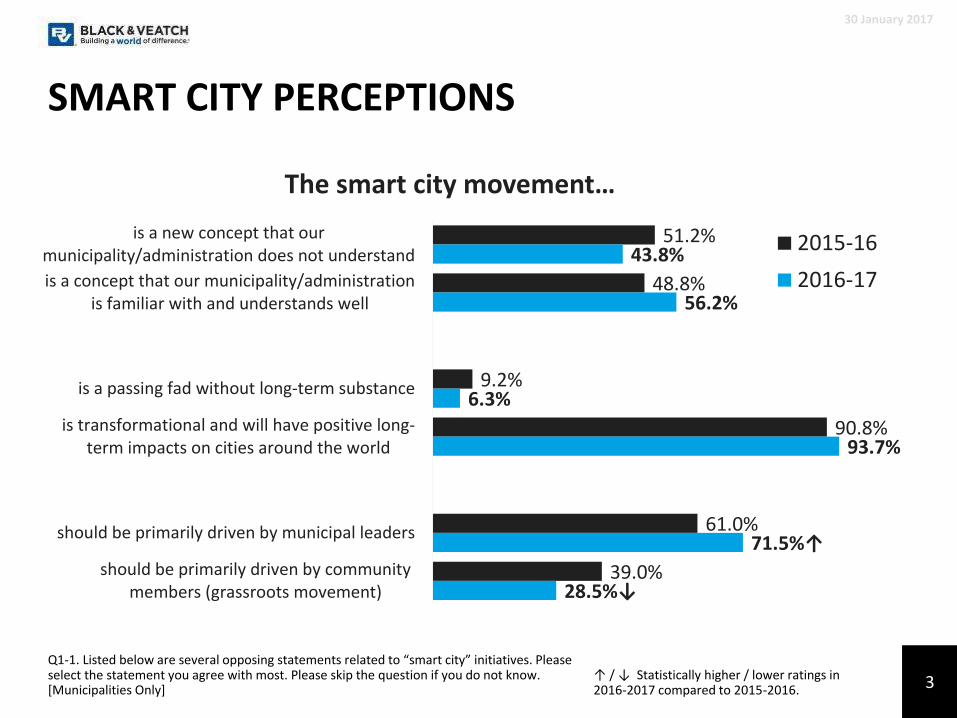
↑ / ↓ Statistically higher / lower ratings in 2016-2017 compared to 2015-2016.
Q1-1. Listed below are several opposing statements related to “smart city” initiatives. Please select the statement you agree with most. Please skip the question if you do not know. [Municipalities Only]
51.2%
48.8%
9.2%
90.8%
61.0%
39.0%
43.8%
56.2%
6.3%
93.7%
71.5%↑
28.5%↓
is a new concept that ourmunicipality/administration does not understand
is a concept that our municipality/administrationis familiar with and understands well
is a passing fad without long-term substance
is transformational and will have positive long-term impacts on cities around the world
should be primarily driven by municipal leaders
should be primarily driven by communitymembers (grassroots movement)
The smart city movement…
2015-16
2016-17
3
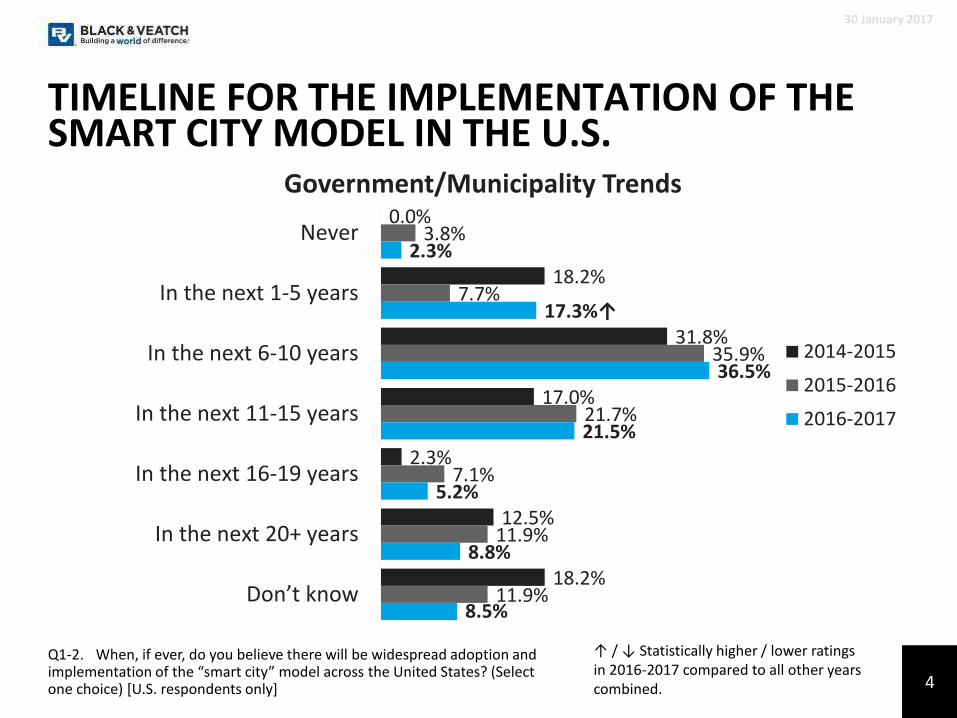
0.0%
18.2%
31.8%
17.0%
2.3%
12.5%
18.2%
3.8%
7.7%
35.9%
21.7%
7.1%
11.9%
11.9%
2.3%
17.3%↑
36.5%
21.5%
5.2%
8.8%
8.5%
Never
In the next 1-5 years
In the next 6-10 years
In the next 11-15 years
In the next 16-19 years
In the next 20+ years
Don’t know
Government/Municipality Trends
2014-2015
2015-2016
2016-2017
TIMELINE FOR THE IMPLEMENTATION OF THE SMART CITY MODEL IN THE U.S.
30 January 2017
↑ / ↓ Statistically higher / lower ratings in 2016-2017 compared to all other years combined.
Q1-2. When, if ever, do you believe there will be widespread adoption and implementation of the “smart city” model across the United States? (Select one choice) [U.S. respondents only] 4
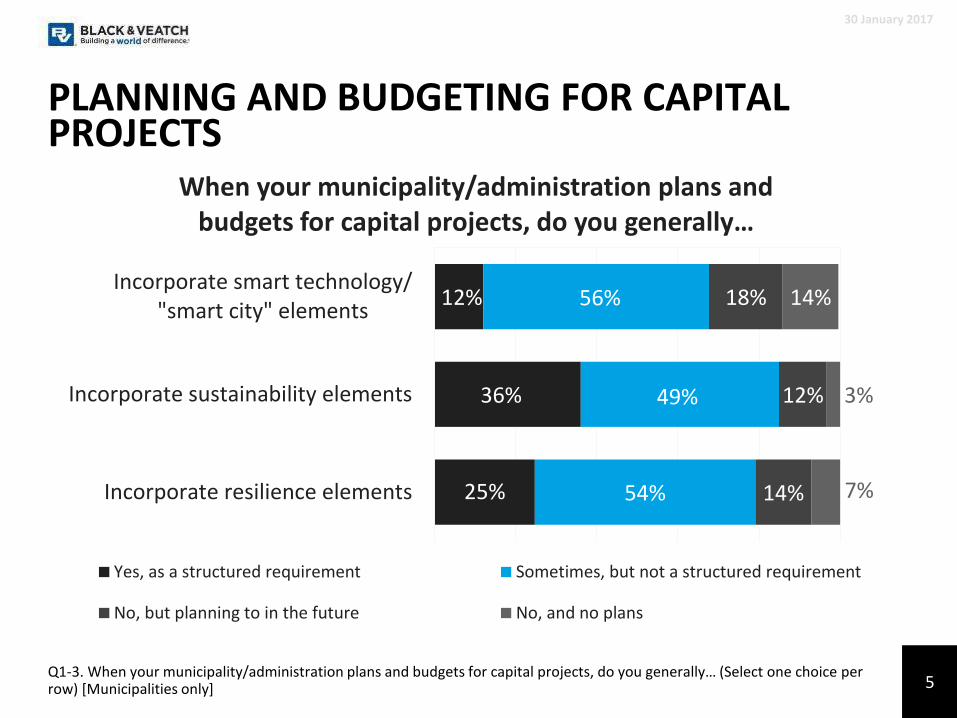
12%
36%
25%
56%
49%
54%
18%
12%
14%
14%
3%
7%
0% 20% 40% 60% 80% 100%
Incorporate smart technology/"smart city" elements
Incorporate sustainability elements
Incorporate resilience elements
When your municipality/administration plans and budgets for capital projects, do you generally…
Yes, as a structured requirement Sometimes, but not a structured requirement
No, but planning to in the future No, and no plans
PLANNING AND BUDGETING FOR CAPITAL PROJECTS
30 January 2017
Q1-3. When your municipality/administration plans and budgets for capital projects, do you generally… (Select one choice per row) [Municipalities only] 5
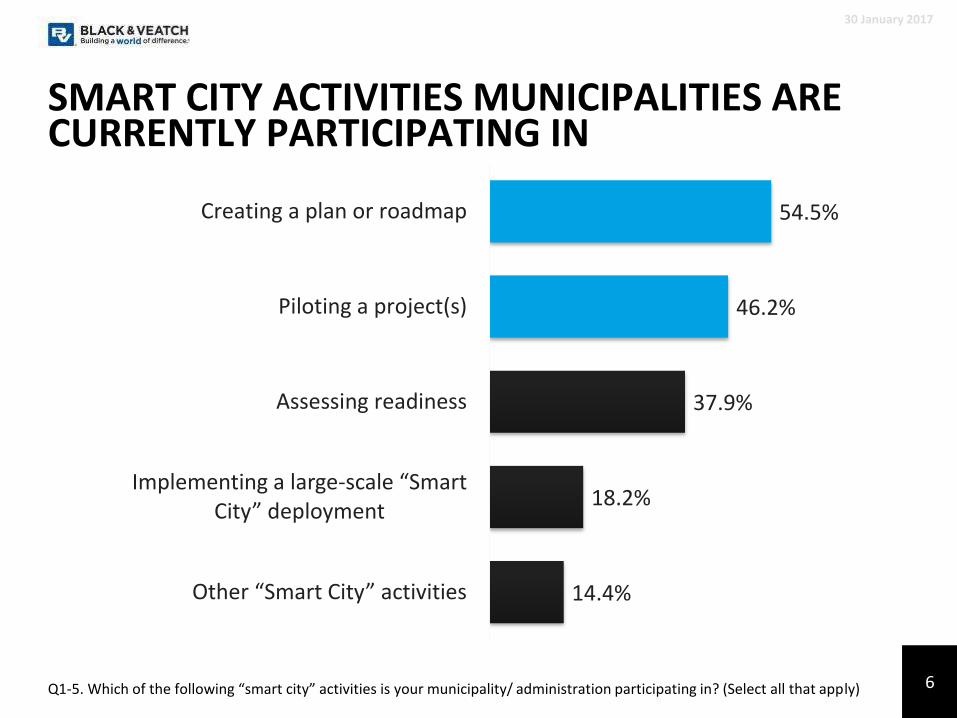
SMART CITY ACTIVITIES MUNICIPALITIES ARE CURRENTLY PARTICIPATING IN
30 January 2017
Q1-5. Which of the following “smart city” activities is your municipality/ administration participating in? (Select all that apply)
54.5%
46.2%
37.9%
18.2%
14.4%
Creating a plan or roadmap
Piloting a project(s)
Assessing readiness
Implementing a large-scale “Smart City” deployment
Other “Smart City” activities
6
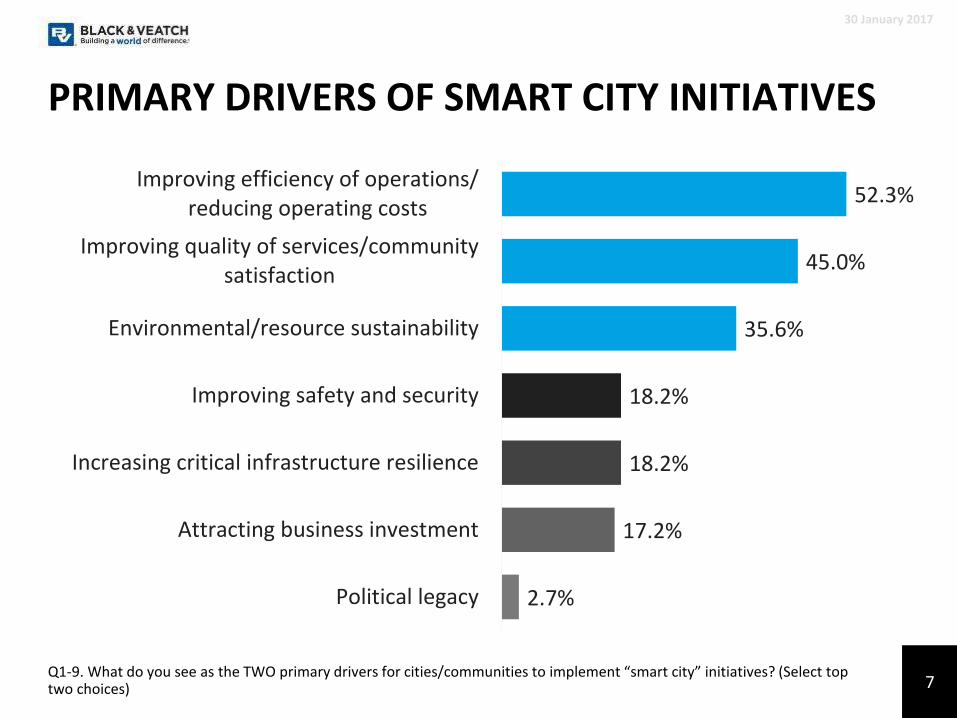
PRIMARY DRIVERS OF SMART CITY INITIATIVES
30 January 2017
Q1-9. What do you see as the TWO primary drivers for cities/communities to implement “smart city” initiatives? (Select top two choices)
52.3%
45.0%
35.6%
18.2%
18.2%
17.2%
2.7%
Improving efficiency of operations/reducing operating costs
Improving quality of services/communitysatisfaction
Environmental/resource sustainability
Improving safety and security
Increasing critical infrastructure resilience
Attracting business investment
Political legacy
7

MOST CRITICAL BUILDING BLOCKS OF A SMART COMMUNITY
30 January 2017
Q1-13. Beyond the foundational physical infrastructure, which of the following do you feel are the TOP THREE most critical building blocks of a “smart city”/“smart community?” (Select three choices)
47.9%
46.3%
39.0%
38.7%
35.1%
31.3%
31.0%
Integrated data repository/datamanagement system
“Smart City” plan/roadmap
Automation and control systems
Customer/citizen engagementplatforms or apps
Networks of smart sensors
Data visualization and analytics
Ubiquitous wide-area connectivity
8
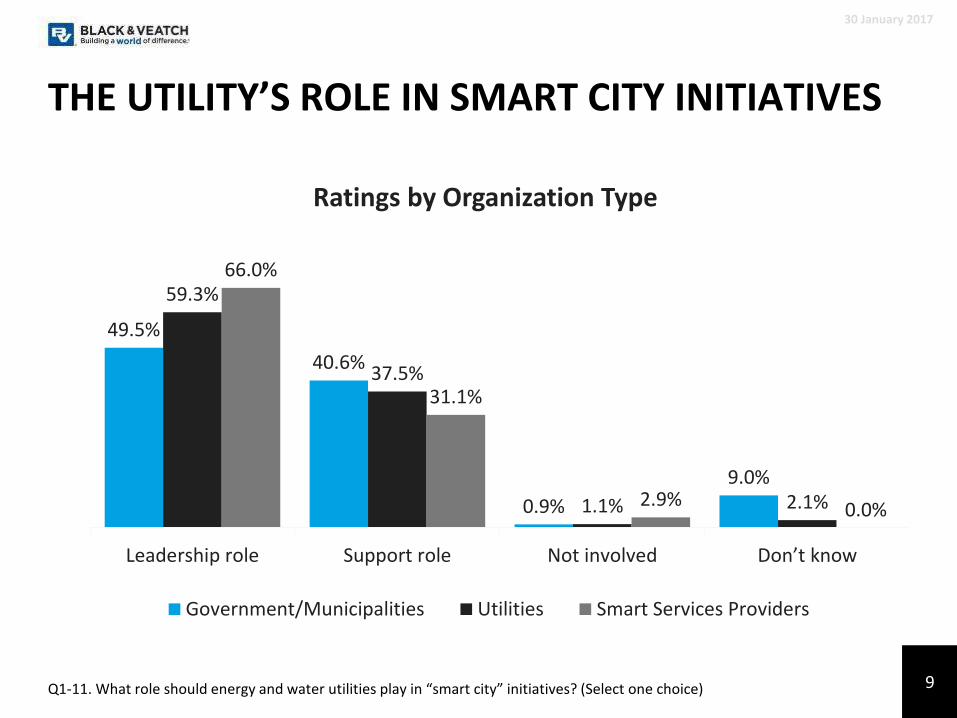
THE UTILITY’S ROLE IN SMART CITY INITIATIVES
30 January 2017
Q1-11. What role should energy and water utilities play in “smart city” initiatives? (Select one choice)
49.5%
40.6%
0.9%
9.0%
59.3%
37.5%
1.1% 2.1%
66.0%
31.1%
2.9% 0.0%
Leadership role Support role Not involved Don’t know
Ratings by Organization Type
Government/Municipalities Utilities Smart Services Providers
9
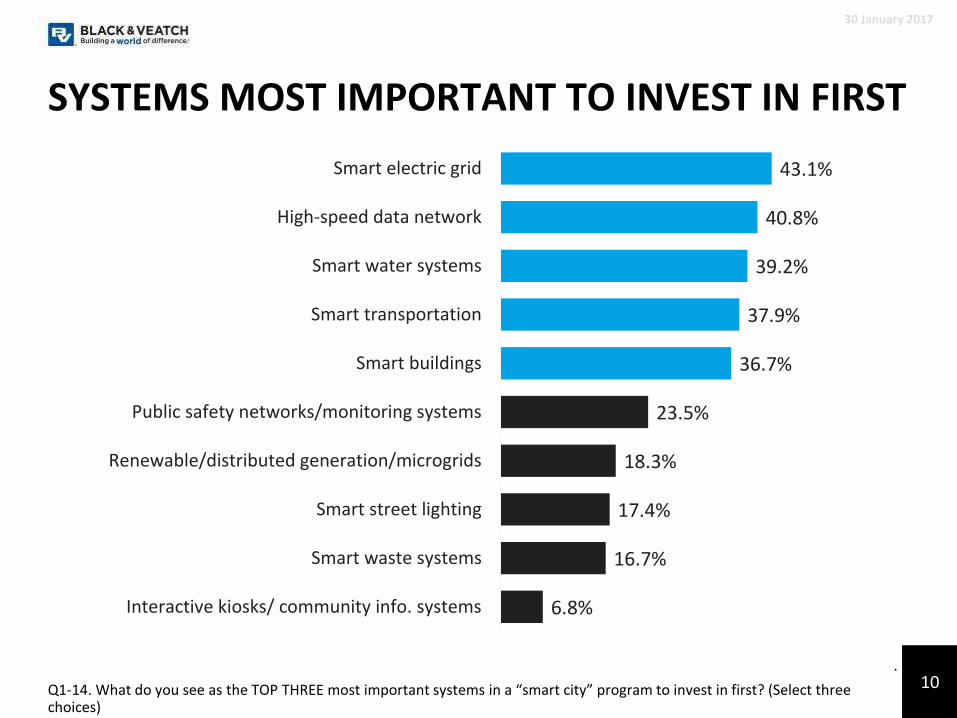
SYSTEMS MOST IMPORTANT TO INVEST IN FIRST
30 January 2017
Q1-14. What do you see as the TOP THREE most important systems in a “smart city” program to invest in first? (Select three choices)
.
43.1%
40.8%
39.2%
37.9%
36.7%
23.5%
18.3%
17.4%
16.7%
6.8%
Smart electric grid
High-speed data network
Smart water systems
Smart transportation
Smart buildings
Public safety networks/monitoring systems
Renewable/distributed generation/microgrids
Smart street lighting
Smart waste systems
Interactive kiosks/ community info. systems
10
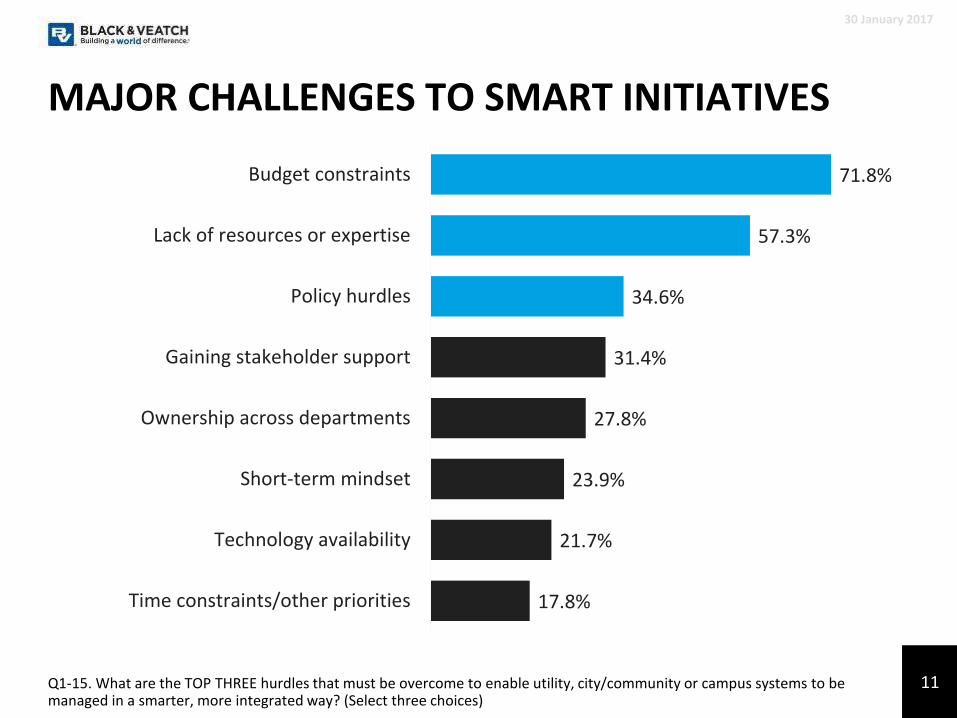
MAJOR CHALLENGES TO SMART INITIATIVES
30 January 2017
Q1-15. What are the TOP THREE hurdles that must be overcome to enable utility, city/community or campus systems to be managed in a smarter, more integrated way? (Select three choices)
71.8%
57.3%
34.6%
31.4%
27.8%
23.9%
21.7%
17.8%
Budget constraints
Lack of resources or expertise
Policy hurdles
Gaining stakeholder support
Ownership across departments
Short-term mindset
Technology availability
Time constraints/other priorities
11
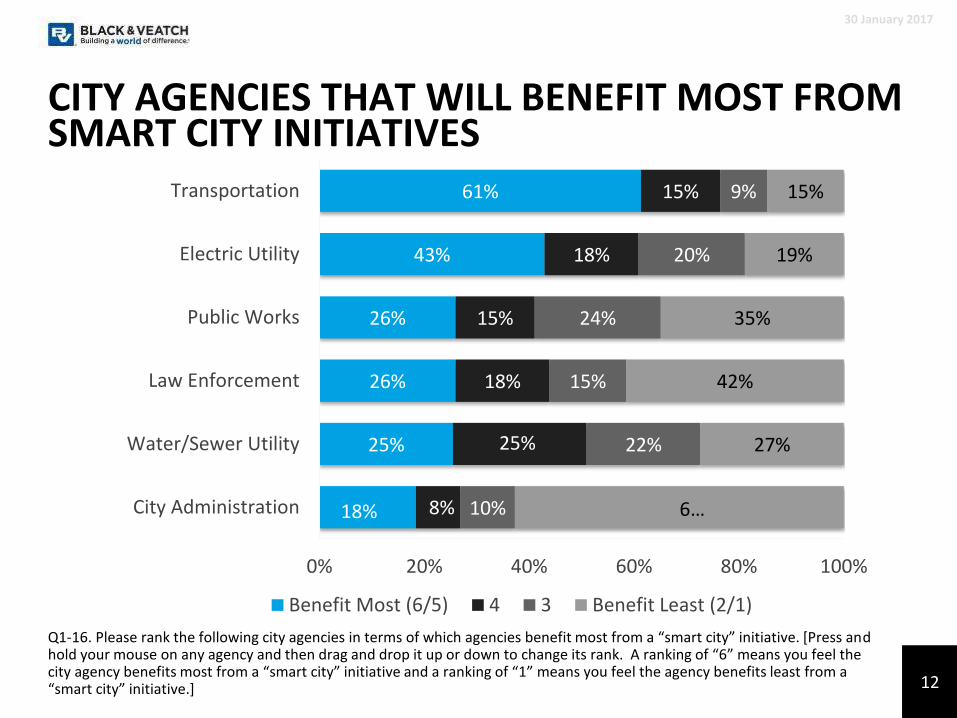
CITY AGENCIES THAT WILL BENEFIT MOST FROM SMART CITY INITIATIVES
30 January 2017
Q1-16. Please rank the following city agencies in terms of which agencies benefit most from a “smart city” initiative. [Press and hold your mouse on any agency and then drag and drop it up or down to change its rank. A ranking of “6” means you feel the city agency benefits most from a “smart city” initiative and a ranking of “1” means you feel the agency benefits least from a“smart city” initiative.]
18%
25%
26%
26%
43%
61%
8%
25%
18%
15%
18%
15%
10%
22%
15%
24%
20%
9%
6…
27%
42%
35%
19%
15%
0% 20% 40% 60% 80% 100%
City Administration
Water/Sewer Utility
Law Enforcement
Public Works
Electric Utility
Transportation
Benefit Most (6/5) 4 3 Benefit Least (2/1)
12
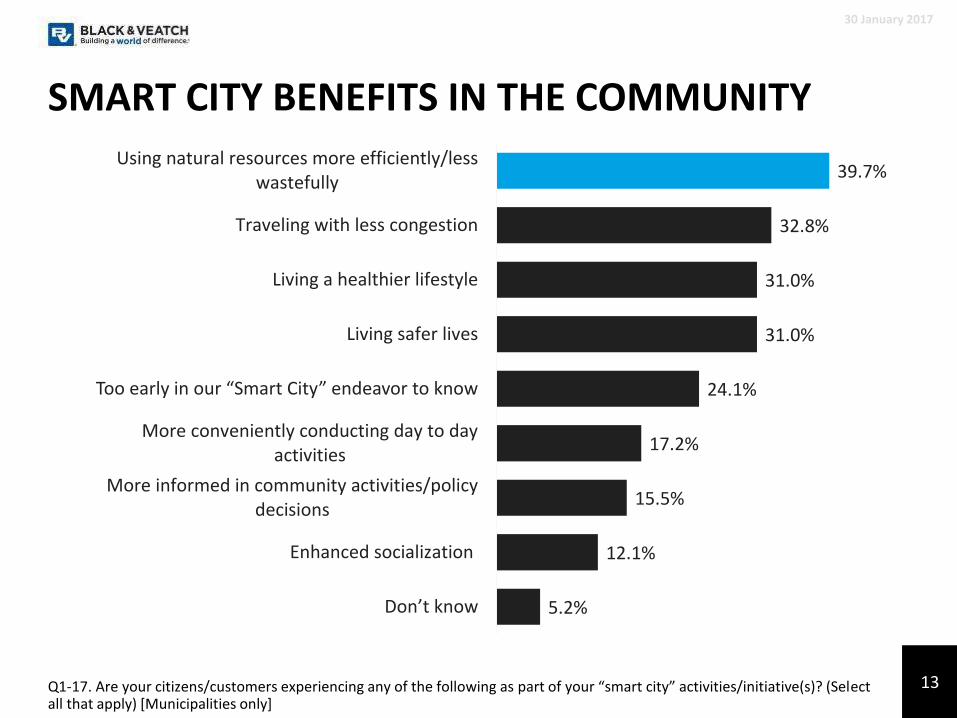
SMART CITY BENEFITS IN THE COMMUNITY
30 January 2017
Q1-17. Are your citizens/customers experiencing any of the following as part of your “smart city” activities/initiative(s)? (Select all that apply) [Municipalities only]
39.7%
32.8%
31.0%
31.0%
24.1%
17.2%
15.5%
12.1%
5.2%
Using natural resources more efficiently/lesswastefully
Traveling with less congestion
Living a healthier lifestyle
Living safer lives
Too early in our “Smart City” endeavor to know
More conveniently conducting day to dayactivities
More informed in community activities/policydecisions
Enhanced socialization
Don’t know
13
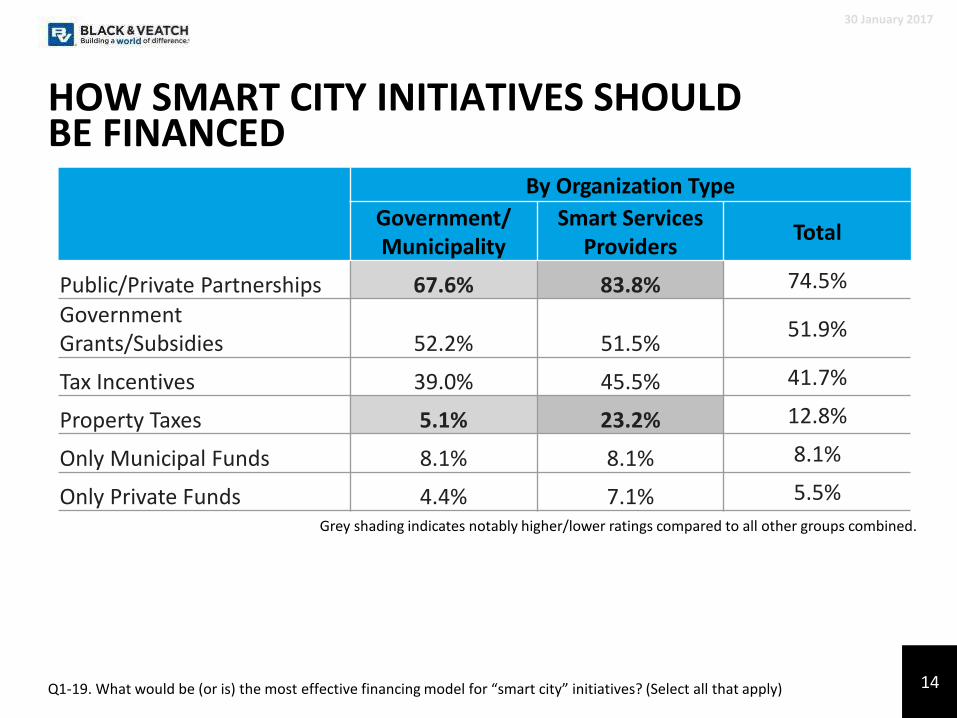
HOW SMART CITY INITIATIVES SHOULD BE FINANCED
30 January 2017
Q1-19. What would be (or is) the most effective financing model for “smart city” initiatives? (Select all that apply)
By Organization Type
Government/Municipality
Smart Services Providers
Total
Public/Private Partnerships 67.6% 83.8% 74.5%
Government Grants/Subsidies 52.2% 51.5%
51.9%
Tax Incentives 39.0% 45.5% 41.7%
Property Taxes 5.1% 23.2% 12.8%
Only Municipal Funds 8.1% 8.1% 8.1%
Only Private Funds 4.4% 7.1% 5.5%
Grey shading indicates notably higher/lower ratings compared to all other groups combined.
14
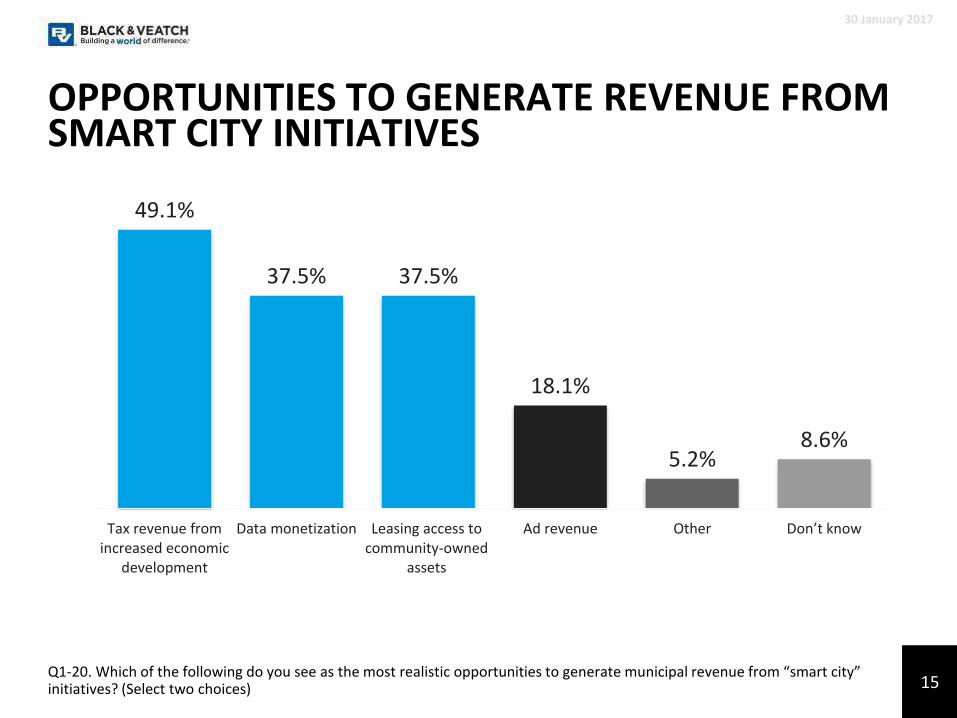
49.1%
37.5% 37.5%
18.1%
5.2%8.6%
Tax revenue fromincreased economic
development
Data monetization Leasing access tocommunity-owned
assets
Ad revenue Other Don’t know
OPPORTUNITIES TO GENERATE REVENUE FROM SMART CITY INITIATIVES
30 January 2017
Q1-20. Which of the following do you see as the most realistic opportunities to generate municipal revenue from “smart city” initiatives? (Select two choices) 15
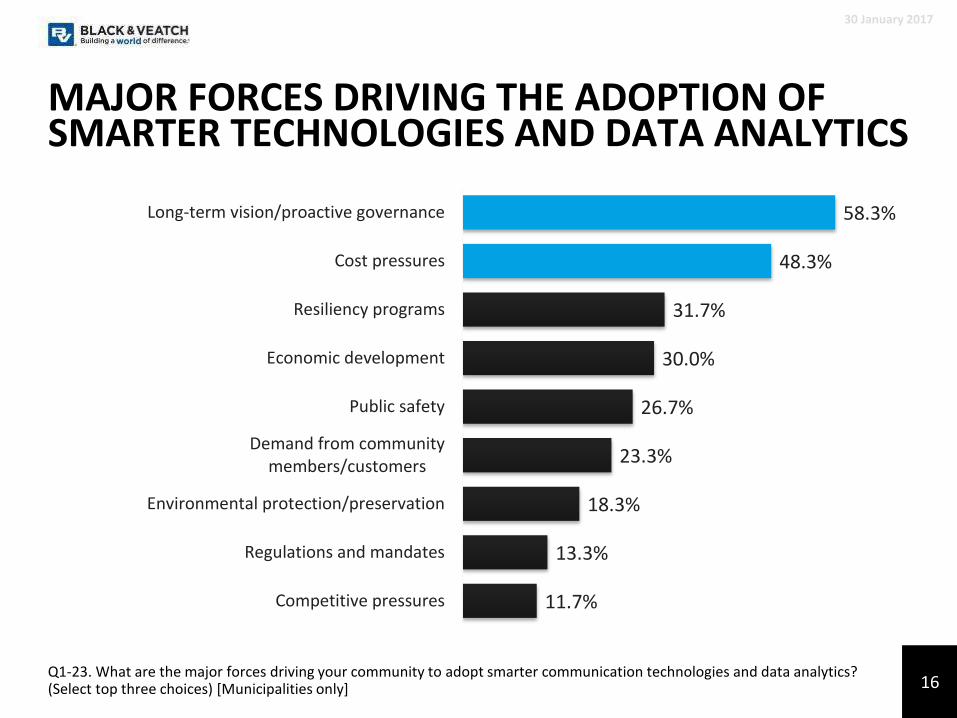
MAJOR FORCES DRIVING THE ADOPTION OF SMARTER TECHNOLOGIES AND DATA ANALYTICS
30 January 2017
Q1-23. What are the major forces driving your community to adopt smarter communication technologies and data analytics? (Select top three choices) [Municipalities only]
58.3%
48.3%
31.7%
30.0%
26.7%
23.3%
18.3%
13.3%
11.7%
Long-term vision/proactive governance
Cost pressures
Resiliency programs
Economic development
Public safety
Demand from communitymembers/customers
Environmental protection/preservation
Regulations and mandates
Competitive pressures
16
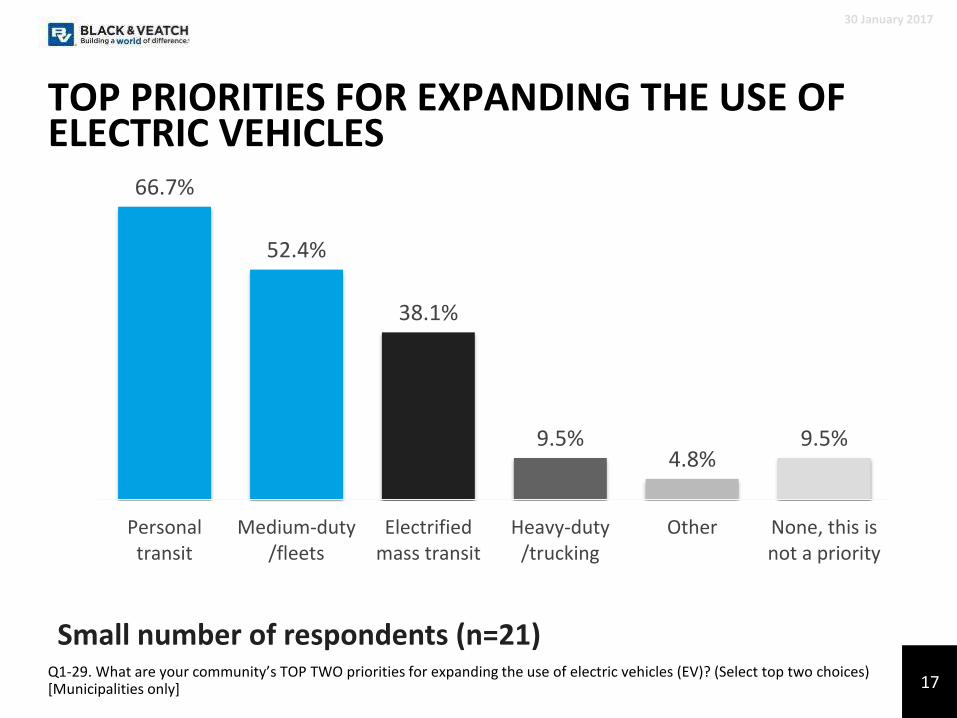
66.7%
52.4%
38.1%
9.5%4.8%
9.5%
Personaltransit
Medium-duty/fleets
Electrifiedmass transit
Heavy-duty/trucking
Other None, this isnot a priority
TOP PRIORITIES FOR EXPANDING THE USE OF ELECTRIC VEHICLES
30 January 2017
Q1-29. What are your community’s TOP TWO priorities for expanding the use of electric vehicles (EV)? (Select top two choices) [Municipalities only]
Small number of respondents (n=21)
17
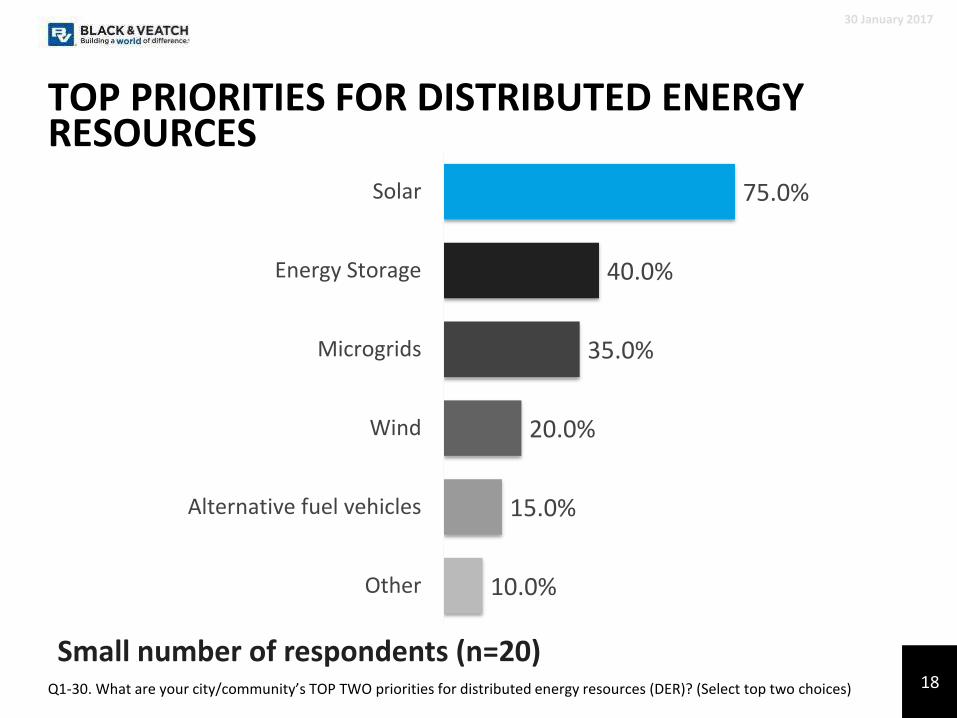
TOP PRIORITIES FOR DISTRIBUTED ENERGY RESOURCES
30 January 2017
Q1-30. What are your city/community’s TOP TWO priorities for distributed energy resources (DER)? (Select top two choices)
75.0%
40.0%
35.0%
20.0%
15.0%
10.0%
Solar
Energy Storage
Microgrids
Wind
Alternative fuel vehicles
Other
Small number of respondents (n=20)18
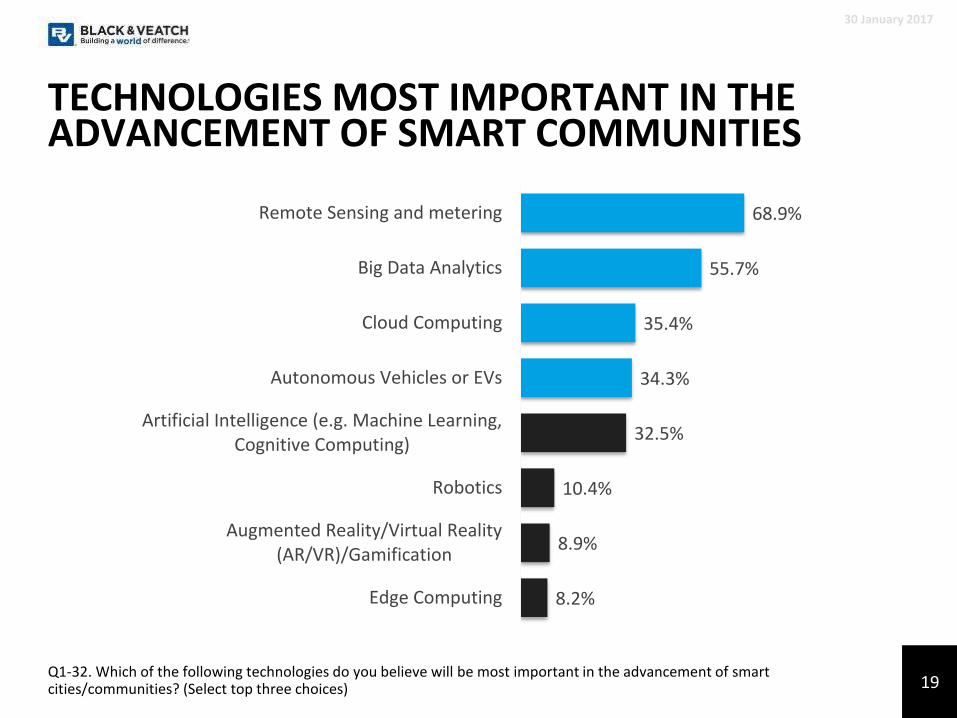
TECHNOLOGIES MOST IMPORTANT IN THE ADVANCEMENT OF SMART COMMUNITIES
30 January 2017
Q1-32. Which of the following technologies do you believe will be most important in the advancement of smart cities/communities? (Select top three choices)
68.9%
55.7%
35.4%
34.3%
32.5%
10.4%
8.9%
8.2%
Remote Sensing and metering
Big Data Analytics
Cloud Computing
Autonomous Vehicles or EVs
Artificial Intelligence (e.g. Machine Learning,Cognitive Computing)
Robotics
Augmented Reality/Virtual Reality(AR/VR)/Gamification
Edge Computing
19
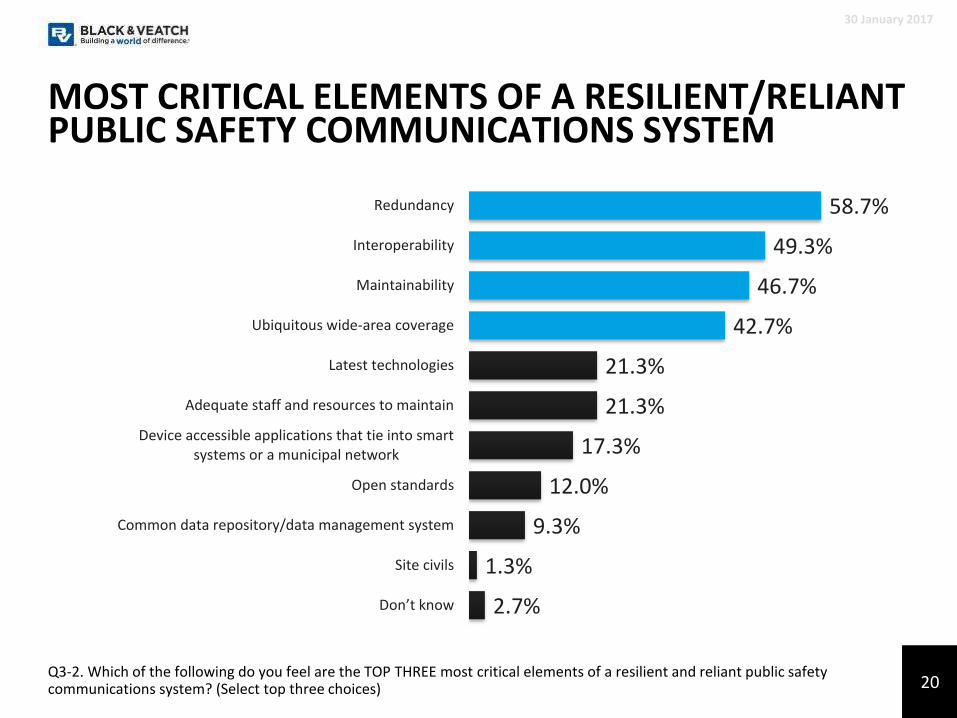
MOST CRITICAL ELEMENTS OF A RESILIENT/RELIANT PUBLIC SAFETY COMMUNICATIONS SYSTEM
30 January 2017
Q3-2. Which of the following do you feel are the TOP THREE most critical elements of a resilient and reliant public safety communications system? (Select top three choices)
58.7%
49.3%
46.7%
42.7%
21.3%
21.3%
17.3%
12.0%
9.3%
1.3%
2.7%
Redundancy
Interoperability
Maintainability
Ubiquitous wide-area coverage
Latest technologies
Adequate staff and resources to maintain
Device accessible applications that tie into smartsystems or a municipal network
Open standards
Common data repository/data management system
Site civils
Don’t know
20
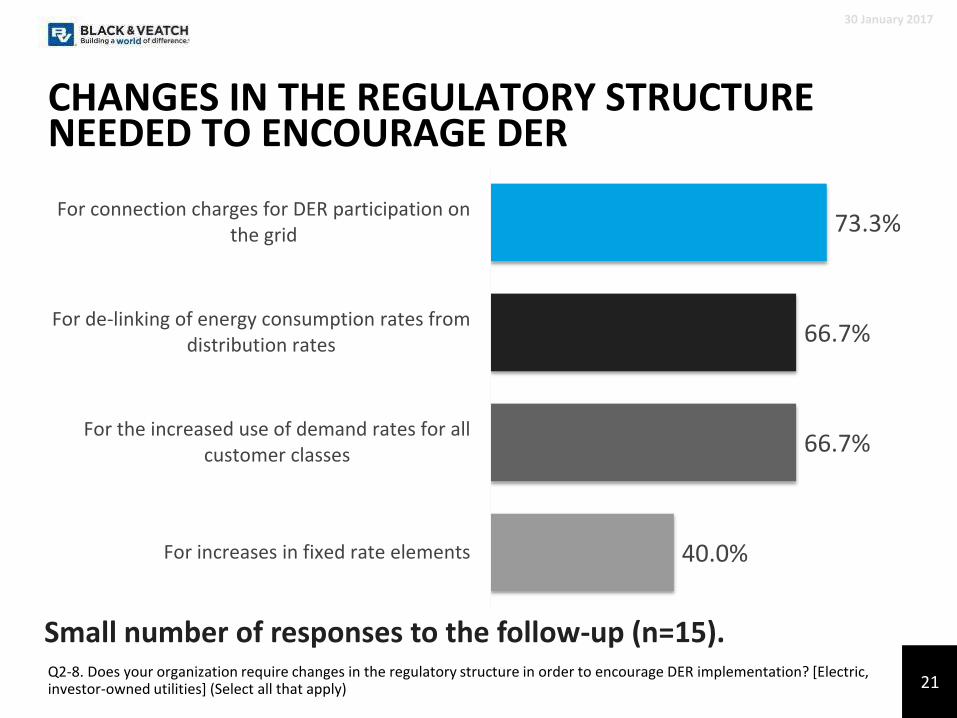
CHANGES IN THE REGULATORY STRUCTURE NEEDED TO ENCOURAGE DER
30 January 2017
21Q2-8. Does your organization require changes in the regulatory structure in order to encourage DER implementation? [Electric, investor-owned utilities] (Select all that apply)
73.3%
66.7%
66.7%
40.0%
For connection charges for DER participation onthe grid
For de-linking of energy consumption rates fromdistribution rates
For the increased use of demand rates for allcustomer classes
For increases in fixed rate elements
Small number of responses to the follow-up (n=15).
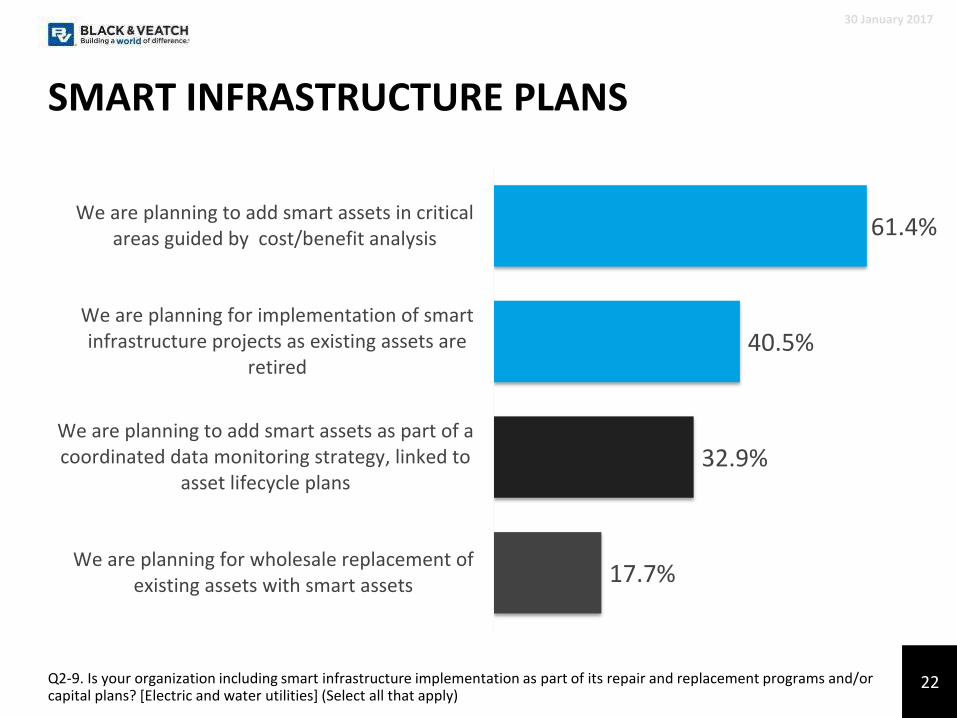
SMART INFRASTRUCTURE PLANS
30 January 2017
22Q2-9. Is your organization including smart infrastructure implementation as part of its repair and replacement programs and/or capital plans? [Electric and water utilities] (Select all that apply)
61.4%
40.5%
32.9%
17.7%
We are planning to add smart assets in criticalareas guided by cost/benefit analysis
We are planning for implementation of smartinfrastructure projects as existing assets are
retired
We are planning to add smart assets as part of acoordinated data monitoring strategy, linked to
asset lifecycle plans
We are planning for wholesale replacement ofexisting assets with smart assets
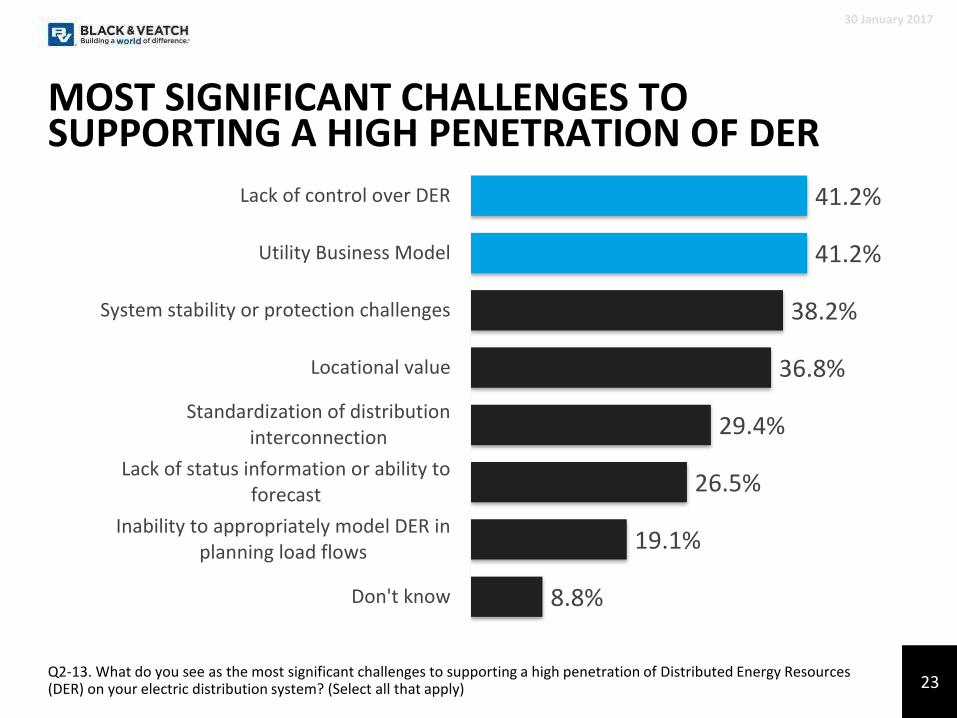
MOST SIGNIFICANT CHALLENGES TO SUPPORTING A HIGH PENETRATION OF DER
30 January 2017
23Q2-13. What do you see as the most significant challenges to supporting a high penetration of Distributed Energy Resources (DER) on your electric distribution system? (Select all that apply)
41.2%
41.2%
38.2%
36.8%
29.4%
26.5%
19.1%
8.8%
Lack of control over DER
Utility Business Model
System stability or protection challenges
Locational value
Standardization of distributioninterconnection
Lack of status information or ability toforecast
Inability to appropriately model DER inplanning load flows
Don't know
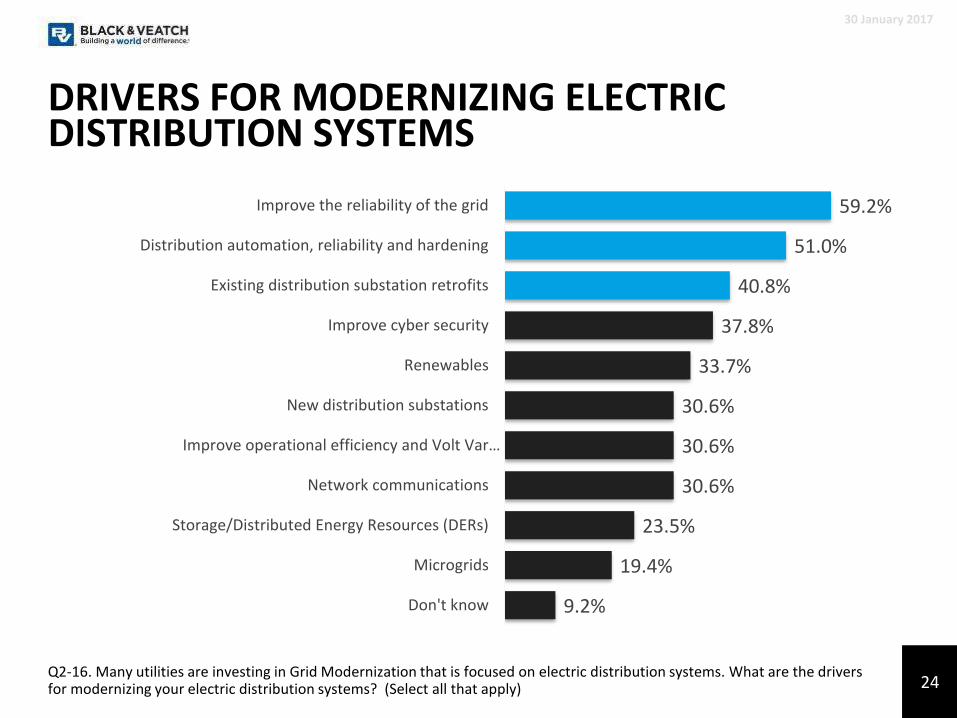
DRIVERS FOR MODERNIZING ELECTRIC DISTRIBUTION SYSTEMS
30 January 2017
24Q2-16. Many utilities are investing in Grid Modernization that is focused on electric distribution systems. What are the driversfor modernizing your electric distribution systems? (Select all that apply)
59.2%
51.0%
40.8%
37.8%
33.7%
30.6%
30.6%
30.6%
23.5%
19.4%
9.2%
Improve the reliability of the grid
Distribution automation, reliability and hardening
Existing distribution substation retrofits
Improve cyber security
Renewables
New distribution substations
Improve operational efficiency and Volt Var…
Network communications
Storage/Distributed Energy Resources (DERs)
Microgrids
Don't know
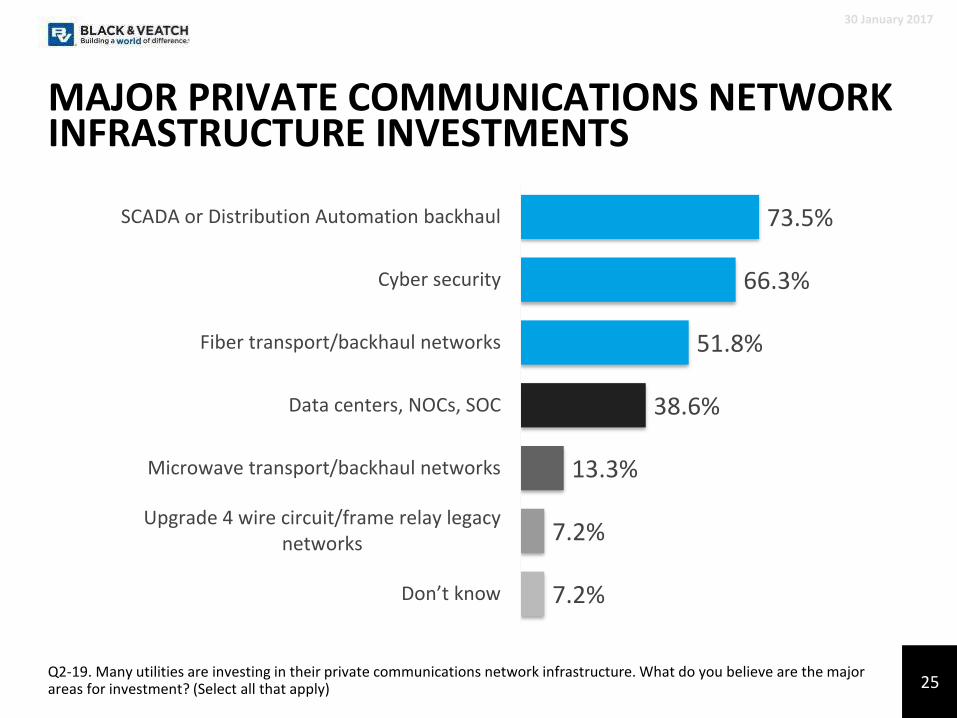
MAJOR PRIVATE COMMUNICATIONS NETWORK INFRASTRUCTURE INVESTMENTS
30 January 2017
25Q2-19. Many utilities are investing in their private communications network infrastructure. What do you believe are the major areas for investment? (Select all that apply)
73.5%
66.3%
51.8%
38.6%
13.3%
7.2%
7.2%
SCADA or Distribution Automation backhaul
Cyber security
Fiber transport/backhaul networks
Data centers, NOCs, SOC
Microwave transport/backhaul networks
Upgrade 4 wire circuit/frame relay legacynetworks
Don’t know
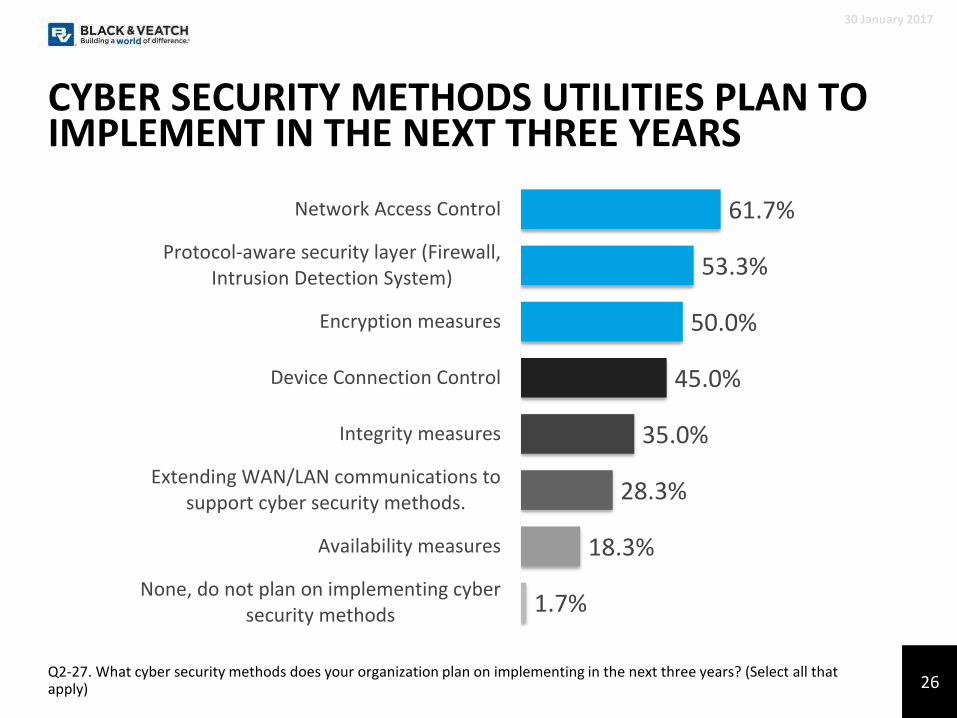
CYBER SECURITY METHODS UTILITIES PLAN TO IMPLEMENT IN THE NEXT THREE YEARS
30 January 2017
26Q2-27. What cyber security methods does your organization plan on implementing in the next three years? (Select all that apply)
61.7%
53.3%
50.0%
45.0%
35.0%
28.3%
18.3%
1.7%
Network Access Control
Protocol-aware security layer (Firewall,Intrusion Detection System)
Encryption measures
Device Connection Control
Integrity measures
Extending WAN/LAN communications tosupport cyber security methods.
Availability measures
None, do not plan on implementing cybersecurity methods
Black & Veatch Insights Group
2017 STRATEGIC DIRECTIONS: SMART CITY/SMART UTILITY REPORT SURVEY RESULTS
30 January 2017Questions: [email protected]
Download the full report at www.bv.com/reports.