Embed Size (px)
Citation preview
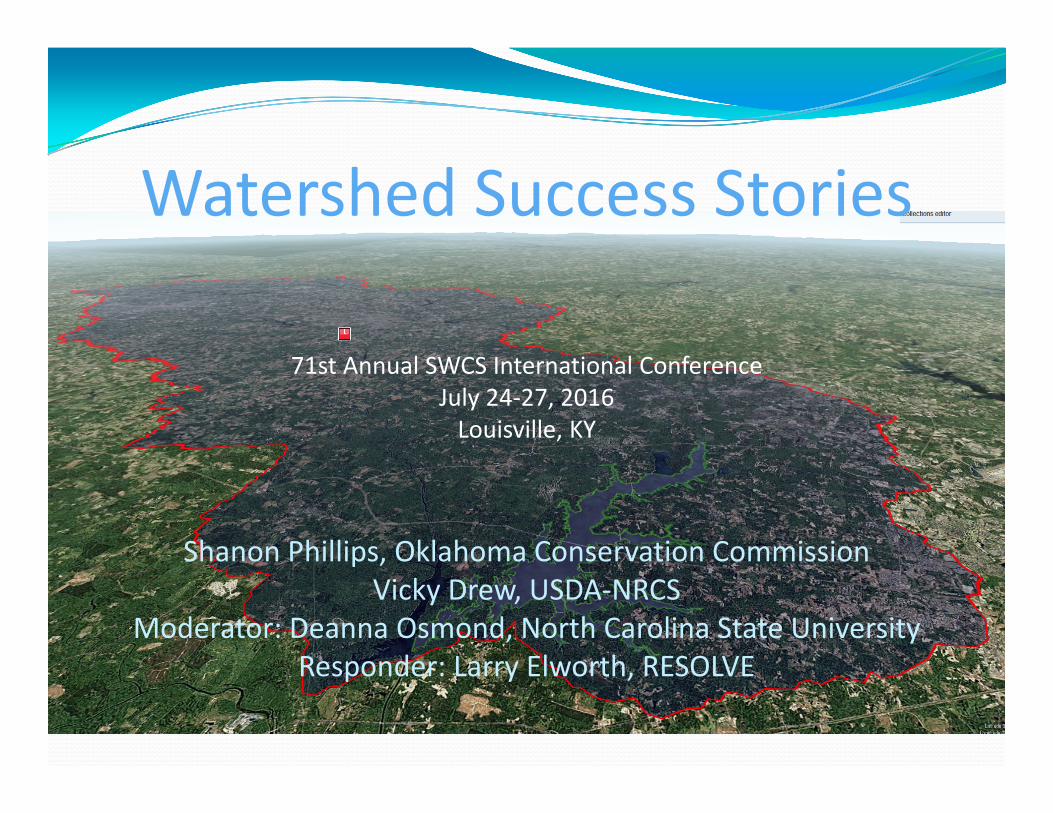
Watershed Success Stories
71st Annual SWCS International ConferenceJuly 24‐27, 2016Louisville, KY
Shanon Phillips, Oklahoma Conservation CommissionVicky Drew, USDA‐NRCS
Moderator: Deanna Osmond, North Carolina State UniversityResponder: Larry Elworth, RESOLVE

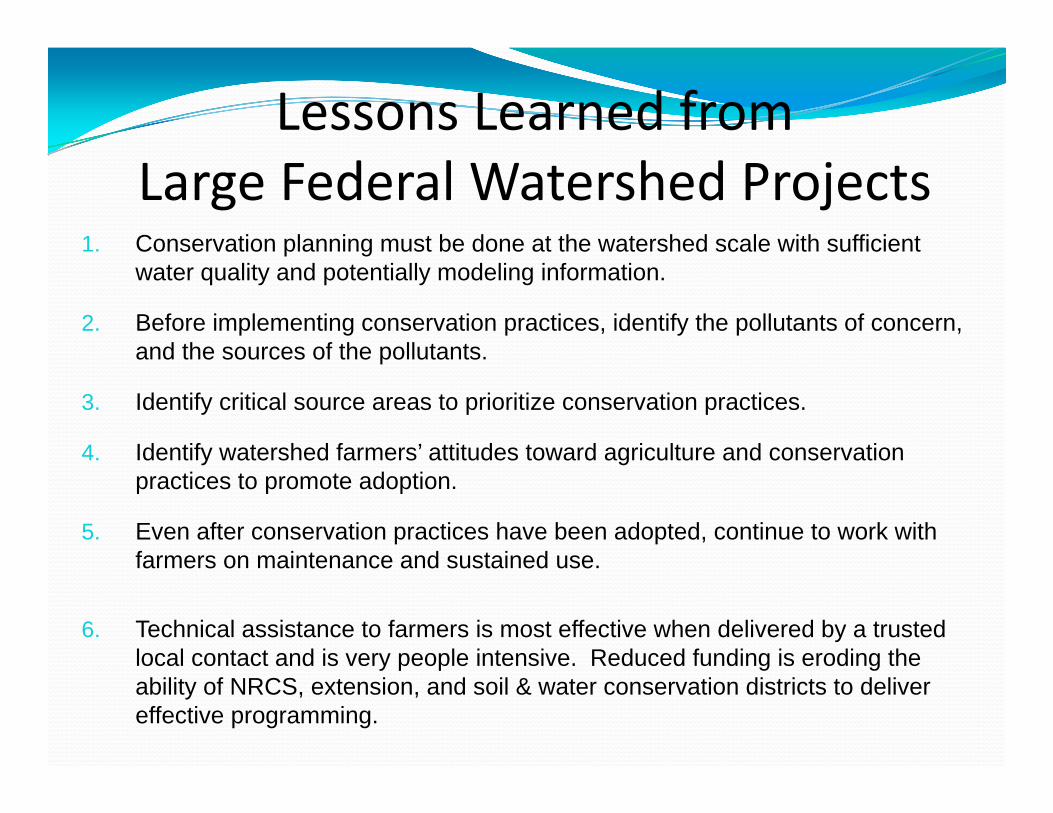
Lessons Learned from Large Federal Watershed Projects
Black Creek 1978-1984Project
Model 1978-1982Implementation Program
The Rural Clean 1980-1995 Water Program
Hydrologic Unit 1991-1994 Area Projects & Demonstration Projects
USEPA Section 319 1991 - presentNational Nonpoint Source Monitoring Program
NIFA CEAP 2004-2011
With dwindling resources and mounting environmental degradation, it is essential that many of the lessons from
NIFA-CEAP be integrated into policy and agency protocol if water resources are to be protected or improved.
Lessons Learned from Large Federal Watershed Projects
1. Conservation planning must be done at the watershed scale with sufficient water quality and potentially modeling information.
2. Before implementing conservation practices, identify the pollutants of concern, and the sources of the pollutants.
3. Identify critical source areas to prioritize conservation practices.
4. Identify watershed farmers’ attitudes toward agriculture and conservation practices to promote adoption.
5. Even after conservation practices have been adopted, continue to work with farmers on maintenance and sustained use.
6. Technical assistance to farmers is most effective when delivered by a trusted local contact and is very people intensive. Reduced funding is eroding the ability of NRCS, extension, and soil & water conservation districts to deliver effective programming.
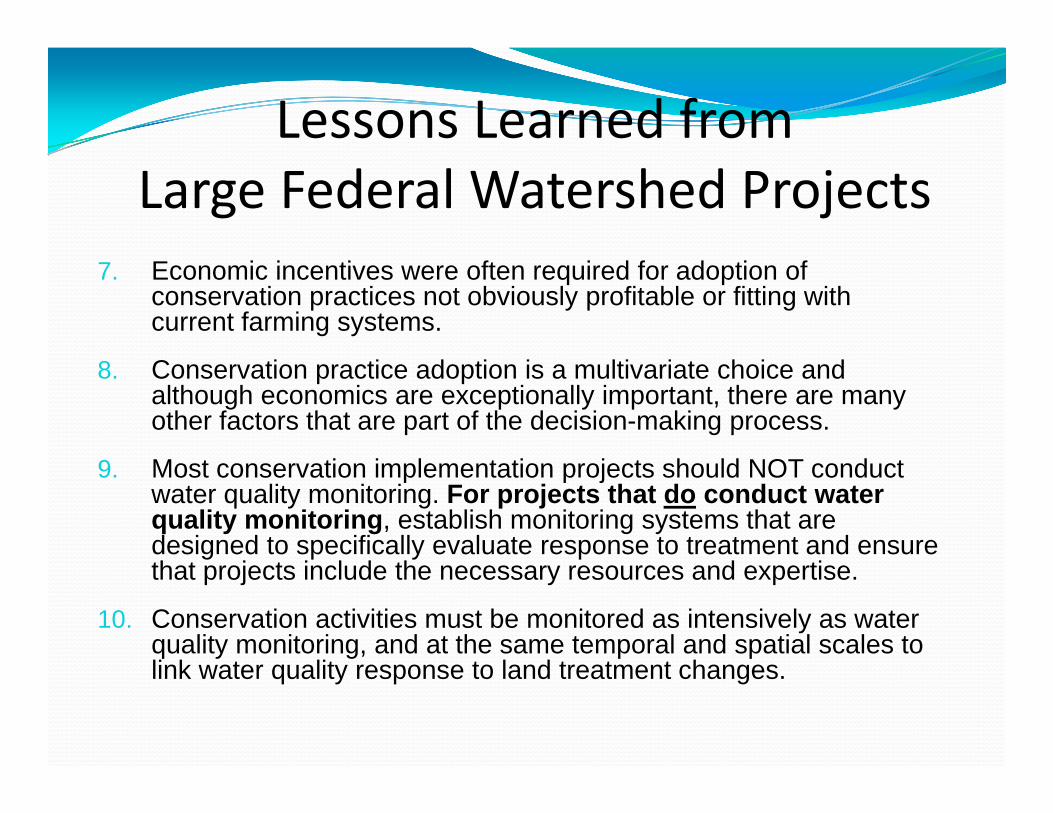
Lessons Learned from Large Federal Watershed Projects
7. Economic incentives were often required for adoption of conservation practices not obviously profitable or fitting with current farming systems.
8. Conservation practice adoption is a multivariate choice and although economics are exceptionally important, there are many other factors that are part of the decision-making process.
9. Most conservation implementation projects should NOT conduct water quality monitoring. For projects that do conduct water quality monitoring, establish monitoring systems that are designed to specifically evaluate response to treatment and ensure that projects include the necessary resources and expertise.
10. Conservation activities must be monitored as intensively as water quality monitoring, and at the same temporal and spatial scales to link water quality response to land treatment changes.

Where the Rubber Meets the Road:Putting Lessons into Action
Shanon Phillips, Oklahoma Conservation Commission
Vicky Drew, USDA‐NRCS ‐ Vermont
North Canadian River Watershed Projects
Shanon PhillipsOklahoma Conservation Commission
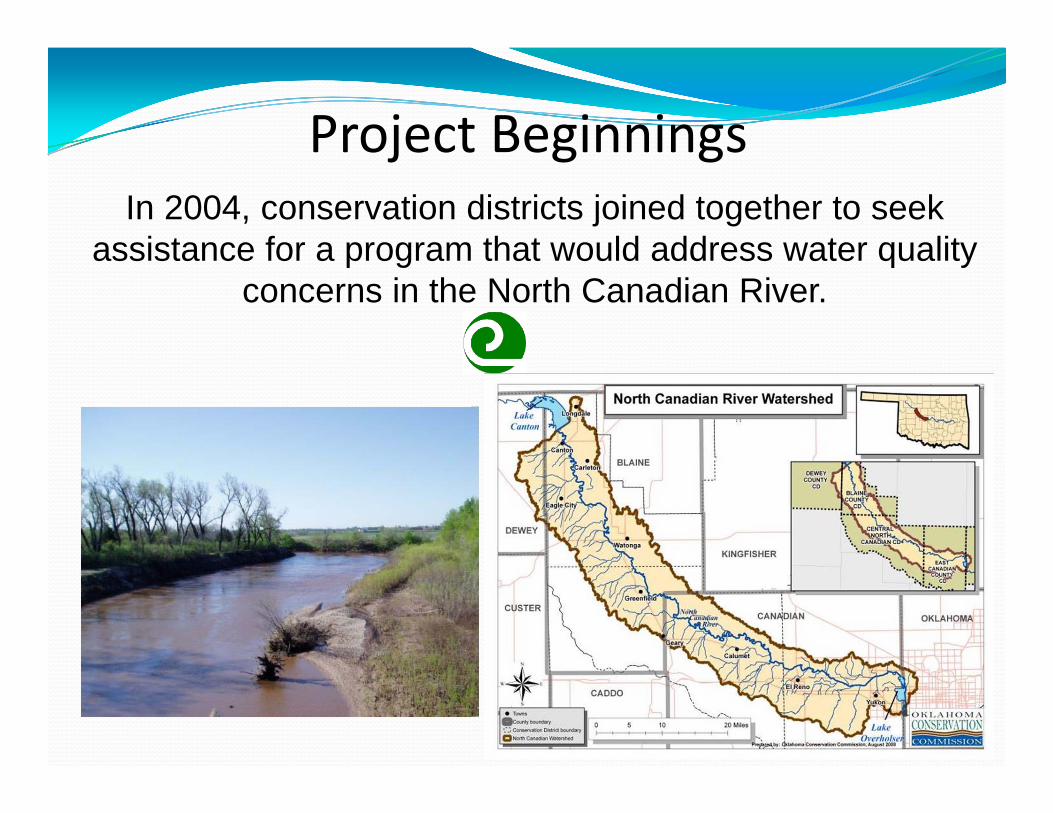
Project BeginningsIn 2004, conservation districts joined together to seek
assistance for a program that would address water quality concerns in the North Canadian River.
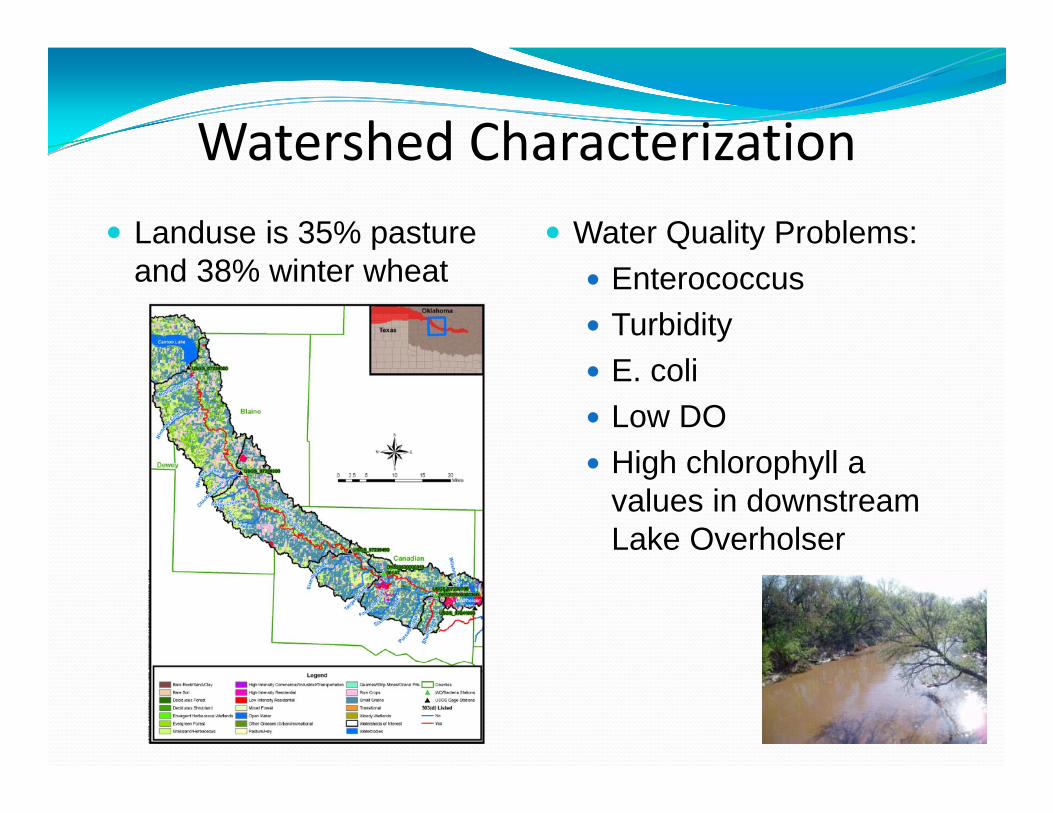
Watershed Characterization Landuse is 35% pasture
and 38% winter wheat Water Quality Problems:
Enterococcus Turbidity E. coli Low DO High chlorophyll a
values in downstream Lake Overholser
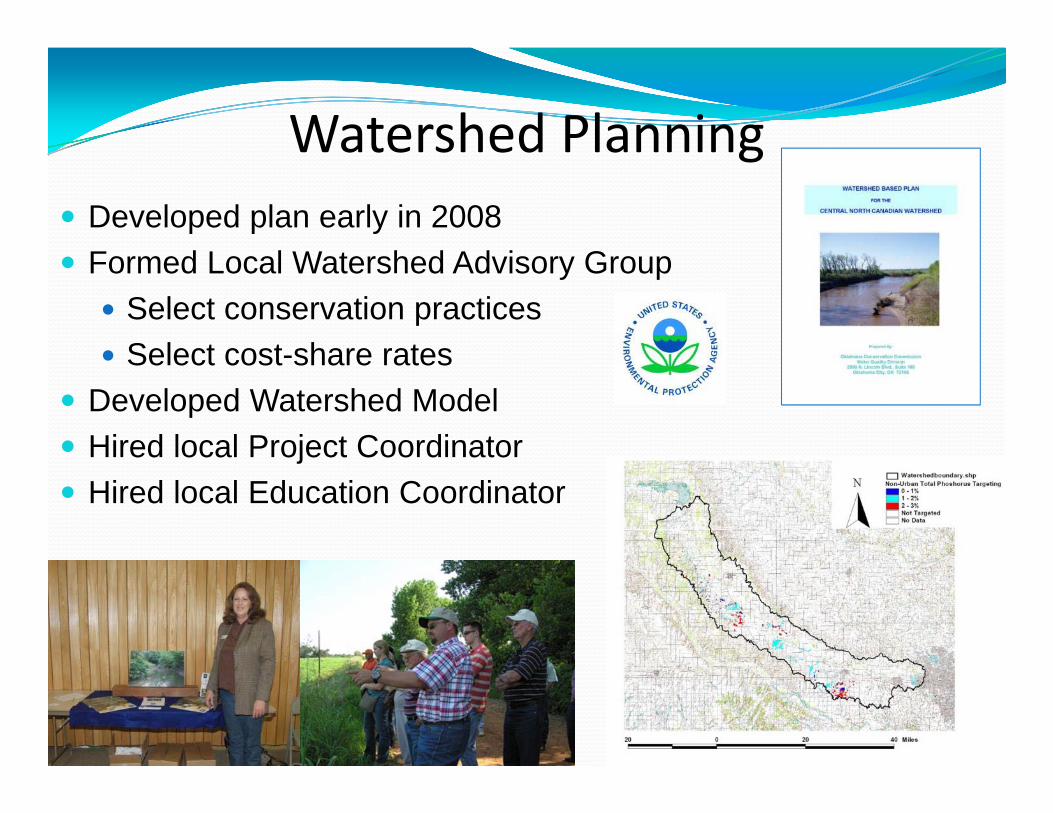
Watershed Planning Developed plan early in 2008 Formed Local Watershed Advisory Group
Select conservation practices Select cost-share rates
Developed Watershed Model Hired local Project Coordinator Hired local Education Coordinator
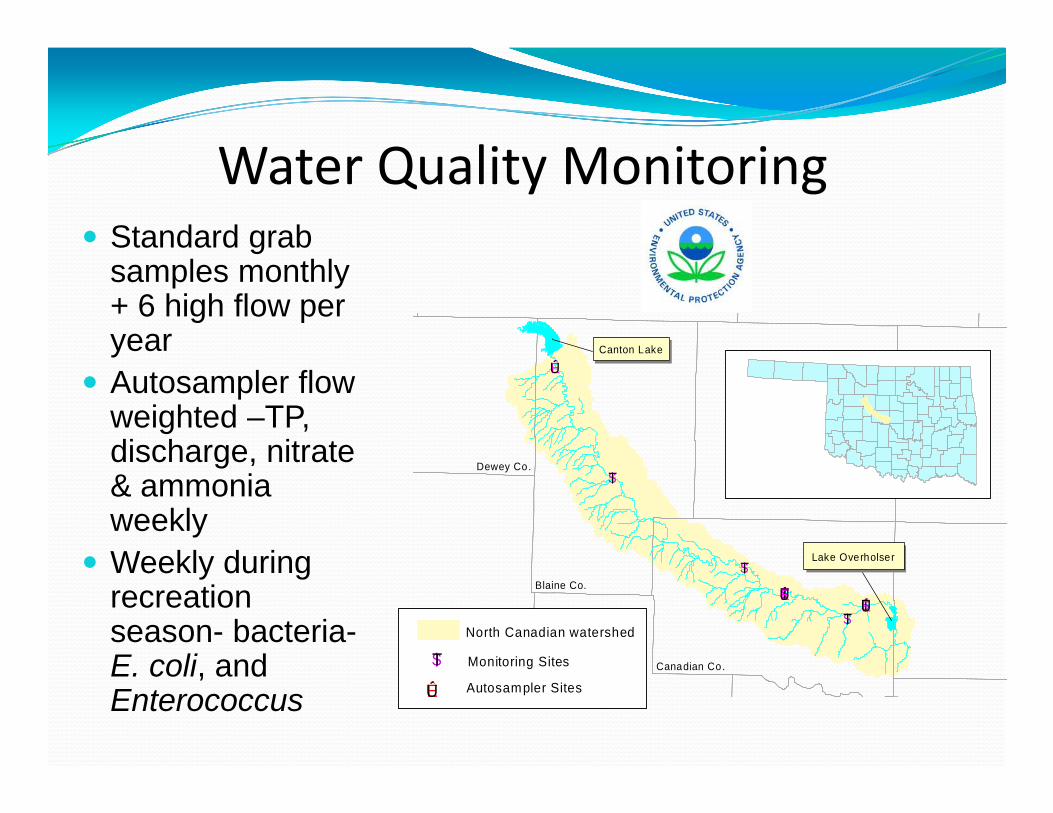
Water Quality Monitoring Standard grab
samples monthly + 6 high flow per year
Autosampler flow weighted –TP, discharge, nitrate & ammonia weekly
Weekly during recreation season- bacteria-E. coli, and Enterococcus
$T
$T$T
$T
$T
$T
ÊÚ
ÊÚÊÚ
#
Canton LakeCanton Lake
Lake Overholser
Blaine Co.
Canadian Co.
Dewey Co.
Monitoring Sites$T North Canadian watershed
ÊÚ Autosampler Sites

Education
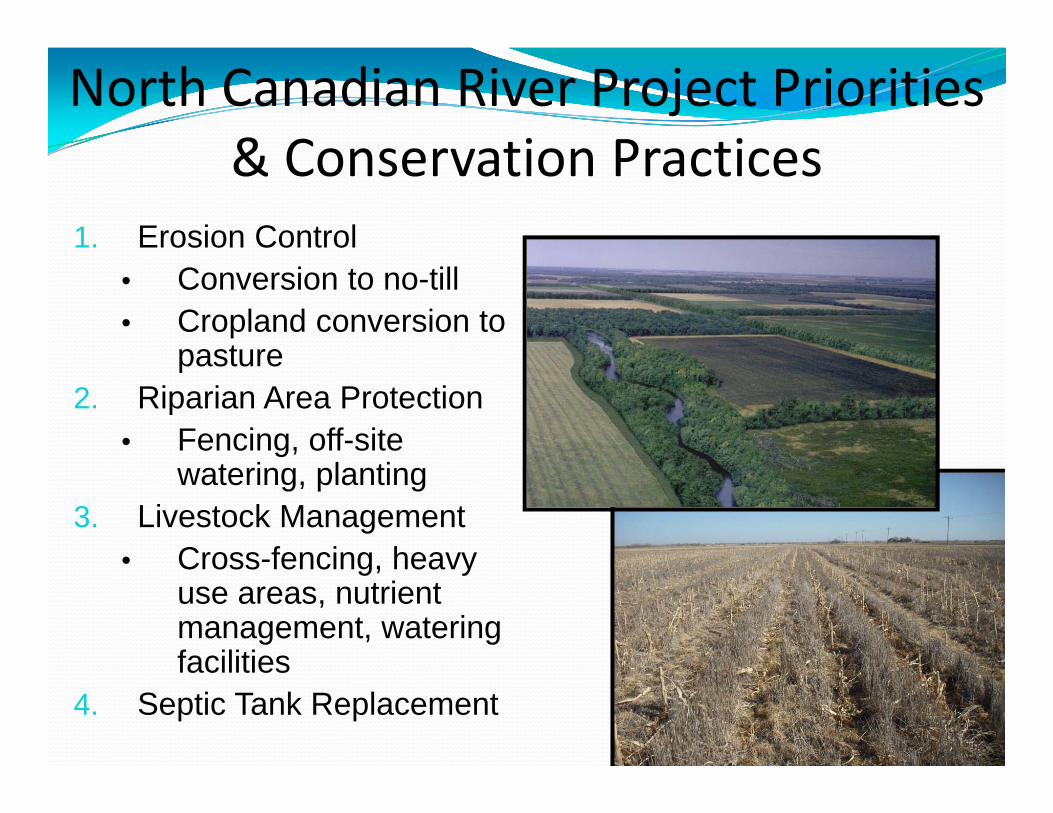
North Canadian River Project Priorities & Conservation Practices
1. Erosion Control• Conversion to no-till• Cropland conversion to
pasture2. Riparian Area Protection
• Fencing, off-site watering, planting
3. Livestock Management• Cross-fencing, heavy
use areas, nutrient management, watering facilities
4. Septic Tank Replacement
13
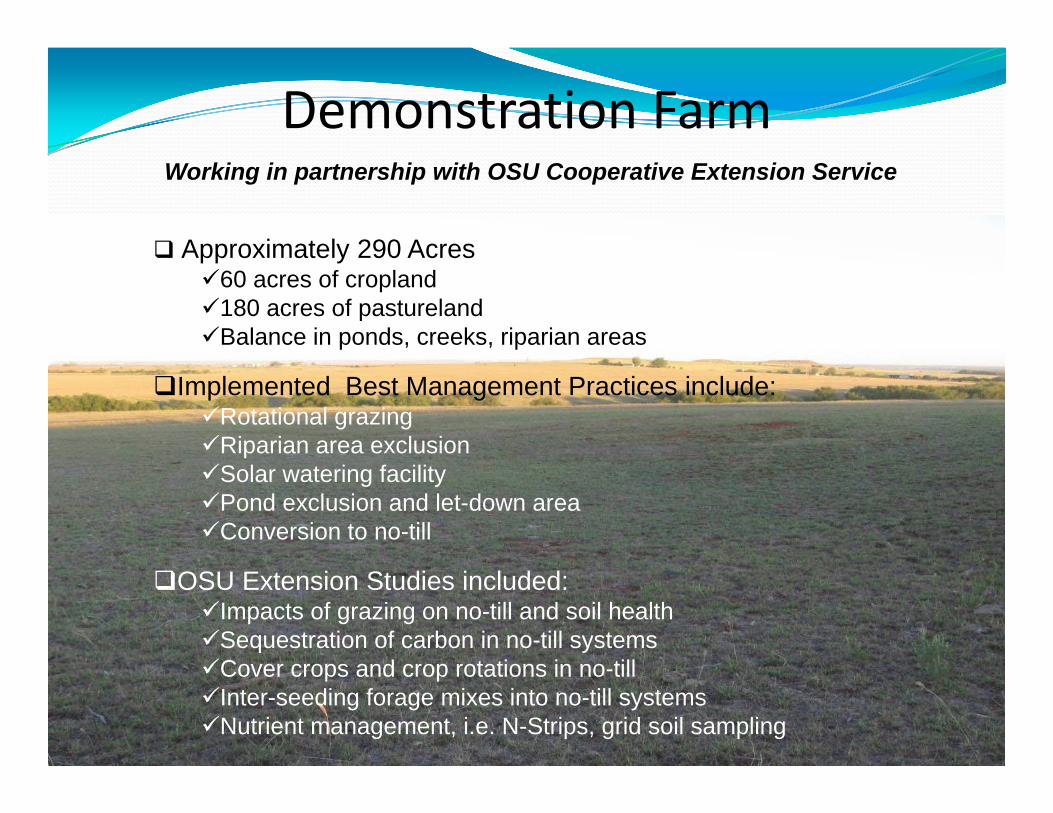
Approximately 290 Acres60 acres of cropland180 acres of pasturelandBalance in ponds, creeks, riparian areas
Implemented Best Management Practices include:Rotational grazingRiparian area exclusionSolar watering facilityPond exclusion and let-down areaConversion to no-till
OSU Extension Studies included:Impacts of grazing on no-till and soil healthSequestration of carbon in no-till systemsCover crops and crop rotations in no-tillInter-seeding forage mixes into no-till systemsNutrient management, i.e. N-Strips, grid soil sampling
Demonstration FarmWorking in partnership with OSU Cooperative Extension Service
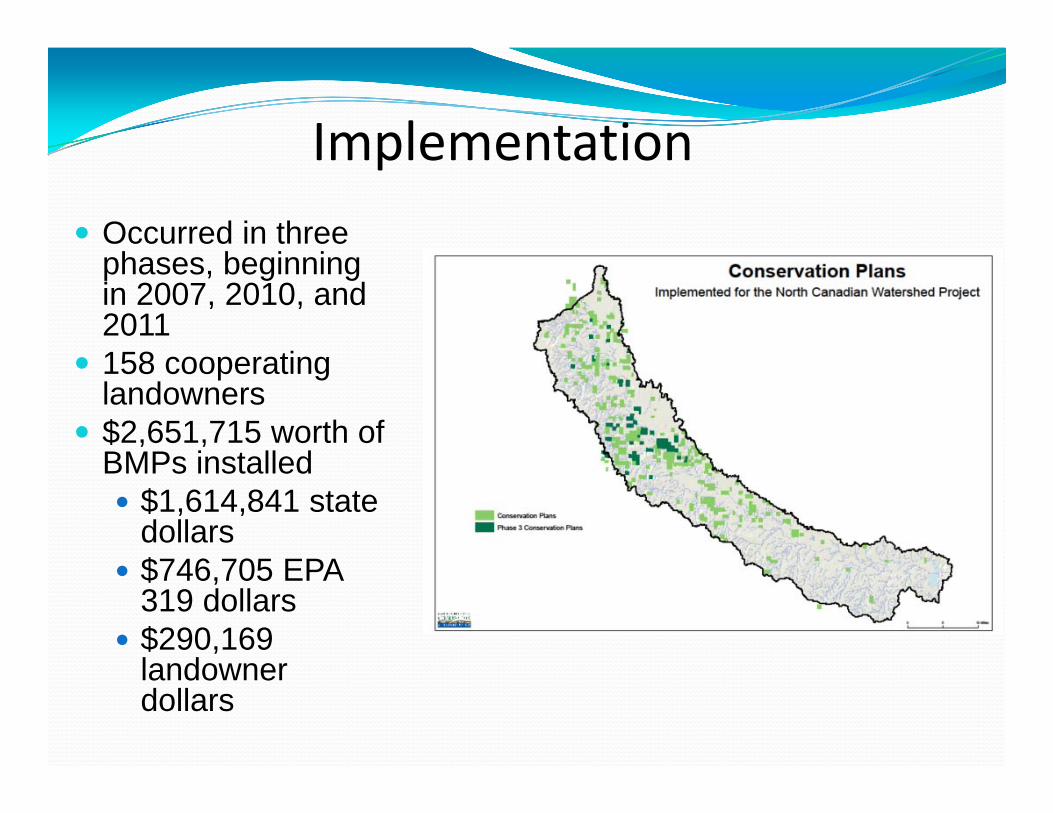
Implementation Occurred in three
phases, beginning in 2007, 2010, and 2011
158 cooperating landowners
$2,651,715 worth of BMPs installed $1,614,841 state
dollars $746,705 EPA
319 dollars $290,169
landowner dollars

15
Conservation Practices Installed
21,196 acres of continuous no‐till
85,077 LF of riparian area fencing installed
1,345 acres of cropland planted to grass
586 acres of riparian area protected
17 substandard septic systems replaced
26,810 LF cross fencing installed to facilitate grazing
11,710 acres enrolled of grid soil sampling and nutrient management
34 wells, 28 solar pumps, 8 watering facilities
16
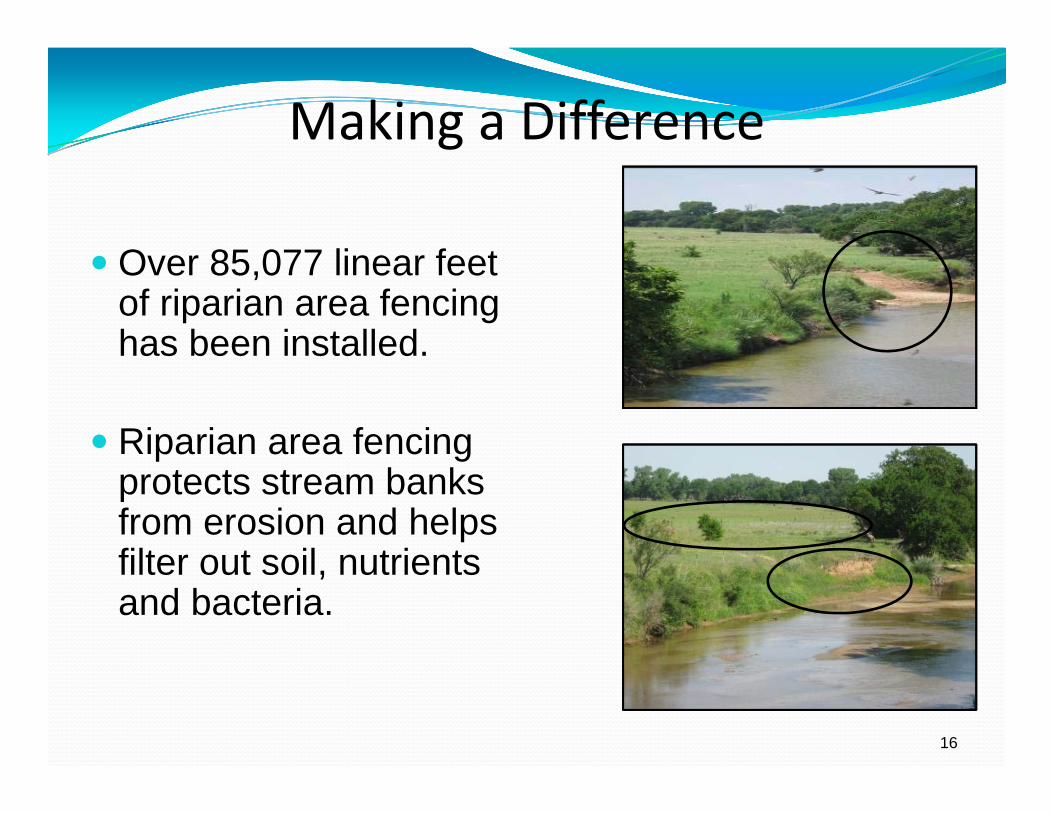
Making a Difference
Over 85,077 linear feet of riparian area fencing has been installed.
Riparian area fencing protects stream banks from erosion and helps filter out soil, nutrients and bacteria.
Parameter DownstrmCalib
DownstrmImplem
DownstrmChange
UpstrmCalib
Upstrm Upstrm ChangeImplem
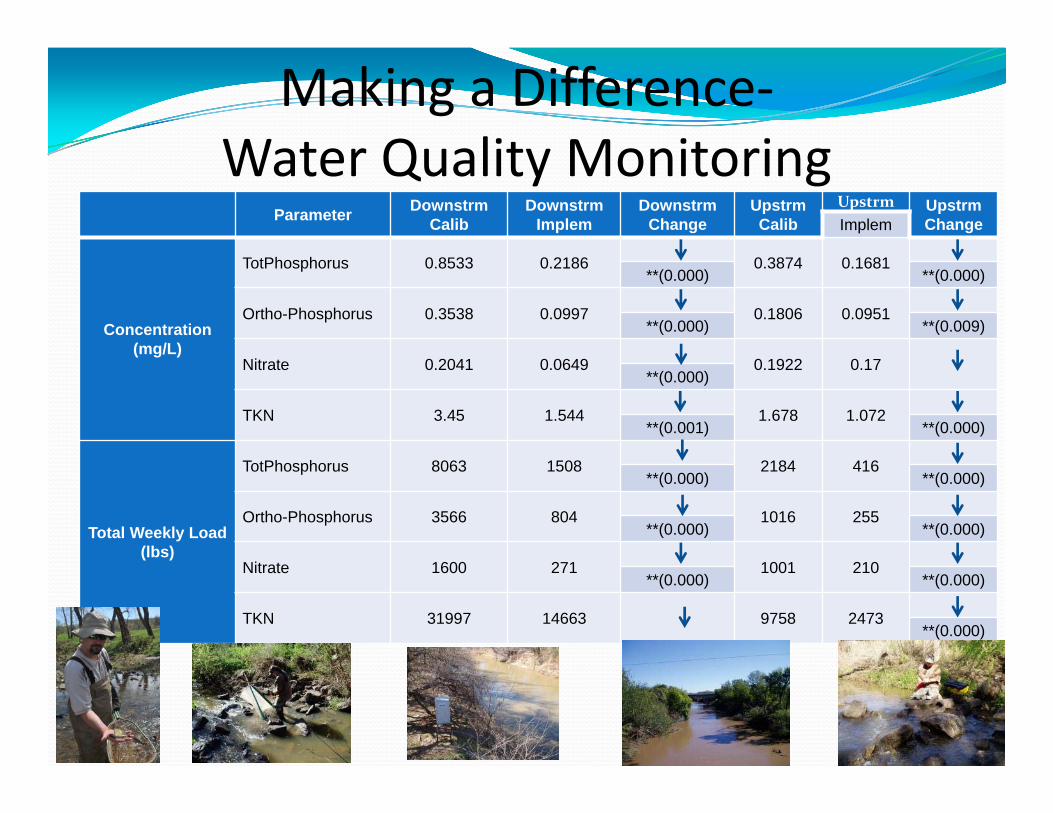
Concentration (mg/L)
TotPhosphorus 0.8533 0.2186 0.3874 0.1681**(0.000) **(0.000)
Ortho-Phosphorus 0.3538 0.0997 0.1806 0.0951**(0.000) **(0.009)
Nitrate 0.2041 0.0649 0.1922 0.17**(0.000)
TKN 3.45 1.544 1.678 1.072**(0.001) **(0.000)
Total Weekly Load (lbs)
TotPhosphorus 8063 1508 2184 416**(0.000) **(0.000)
Ortho-Phosphorus 3566 804 1016 255**(0.000) **(0.000)
Nitrate 1600 271 1001 210**(0.000) **(0.000)
TKN 31997 14663 9758 2473**(0.000)
Making a Difference‐Water Quality Monitoring
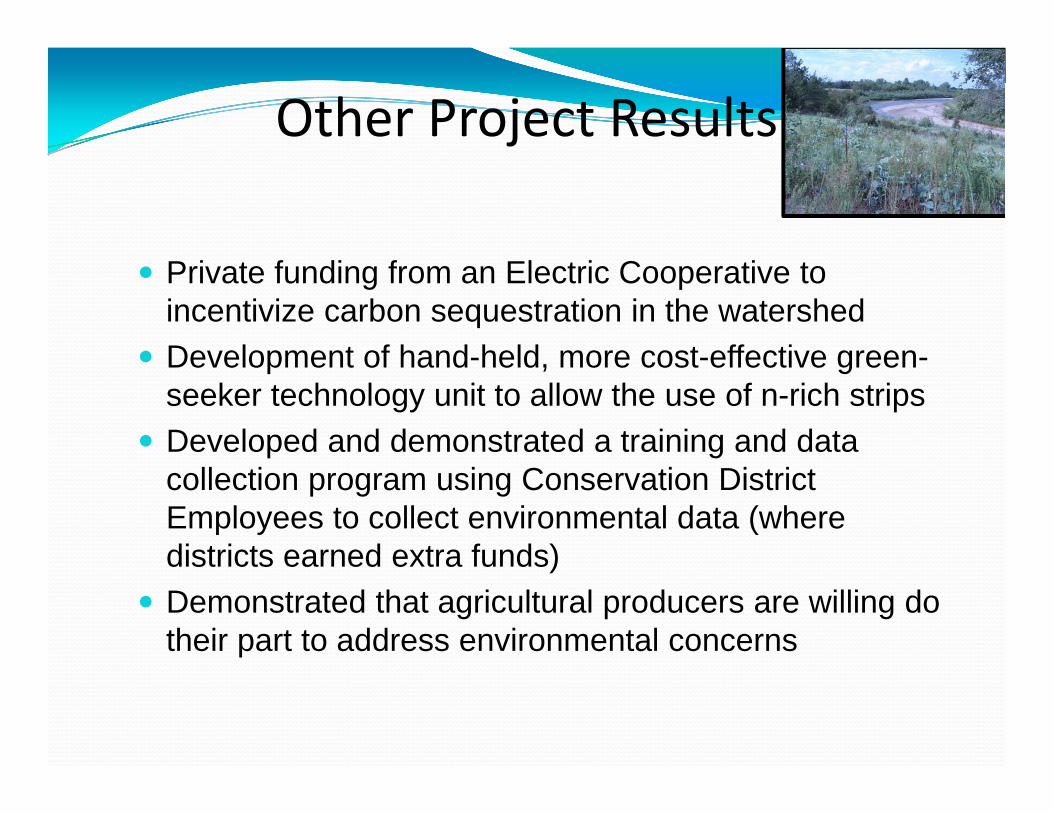
Other Project Results
Private funding from an Electric Cooperative to incentivize carbon sequestration in the watershed
Development of hand-held, more cost-effective green-seeker technology unit to allow the use of n-rich strips
Developed and demonstrated a training and data collection program using Conservation District Employees to collect environmental data (where districts earned extra funds)
Demonstrated that agricultural producers are willing do their part to address environmental concerns

Keys to Success Local Leadership Invested Partners Understanding of the Watershed
Historical water quality data Watershed Model Targeting Watershed plan
Possibility of Success Monitoring for Success-
water quality, landuse change… Long-term program
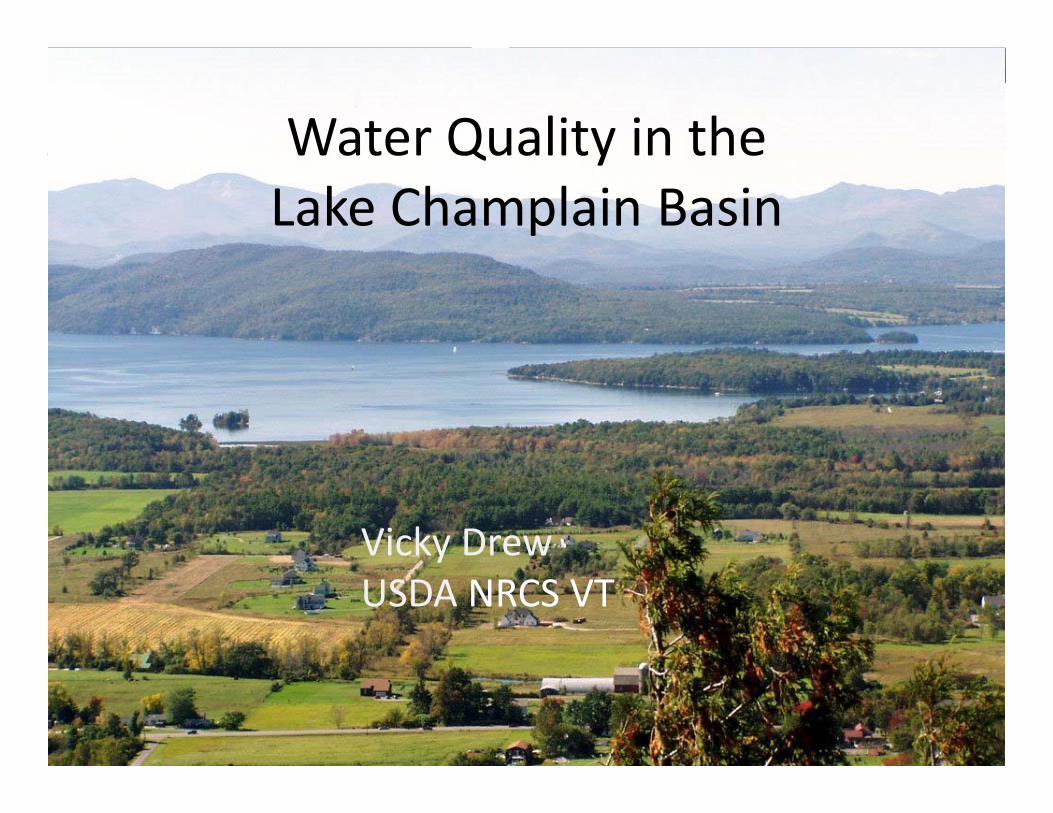
Vicky DrewUSDA NRCS VT
Water Quality in the Lake Champlain Basin

Watershed Area56% in Vermont37% in New York7% in Quebec
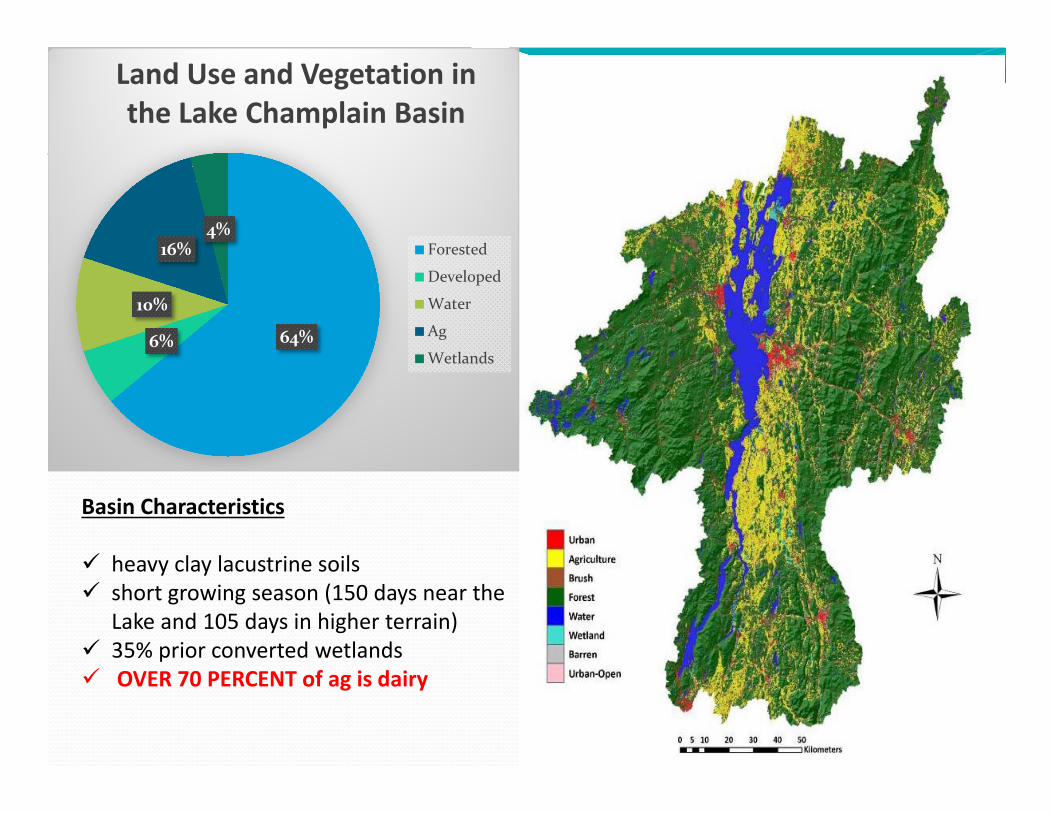
64%6%
10%
16%4%
Land Use and Vegetation in the Lake Champlain Basin
Forested
Developed
Water
Ag
Wetlands
Basin Characteristics
heavy clay lacustrine soils short growing season (150 days near the
Lake and 105 days in higher terrain) 35% prior converted wetlands OVER 70 PERCENT of ag is dairy

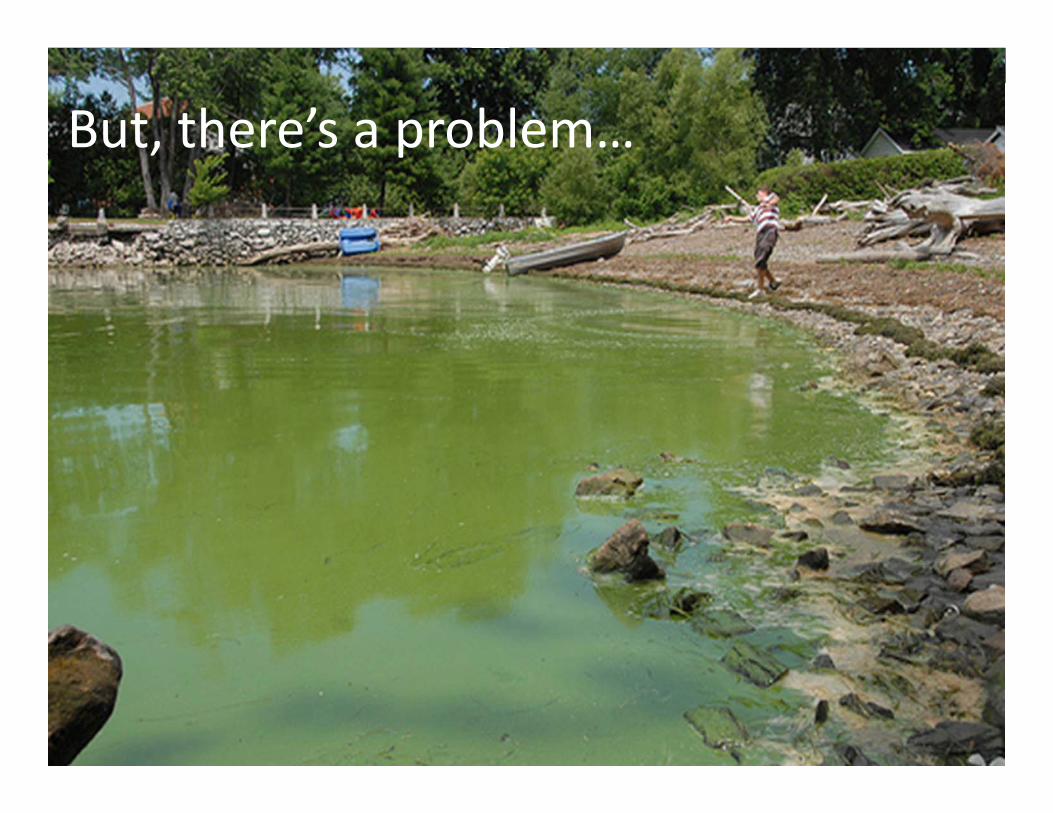
But, there’s a problem…
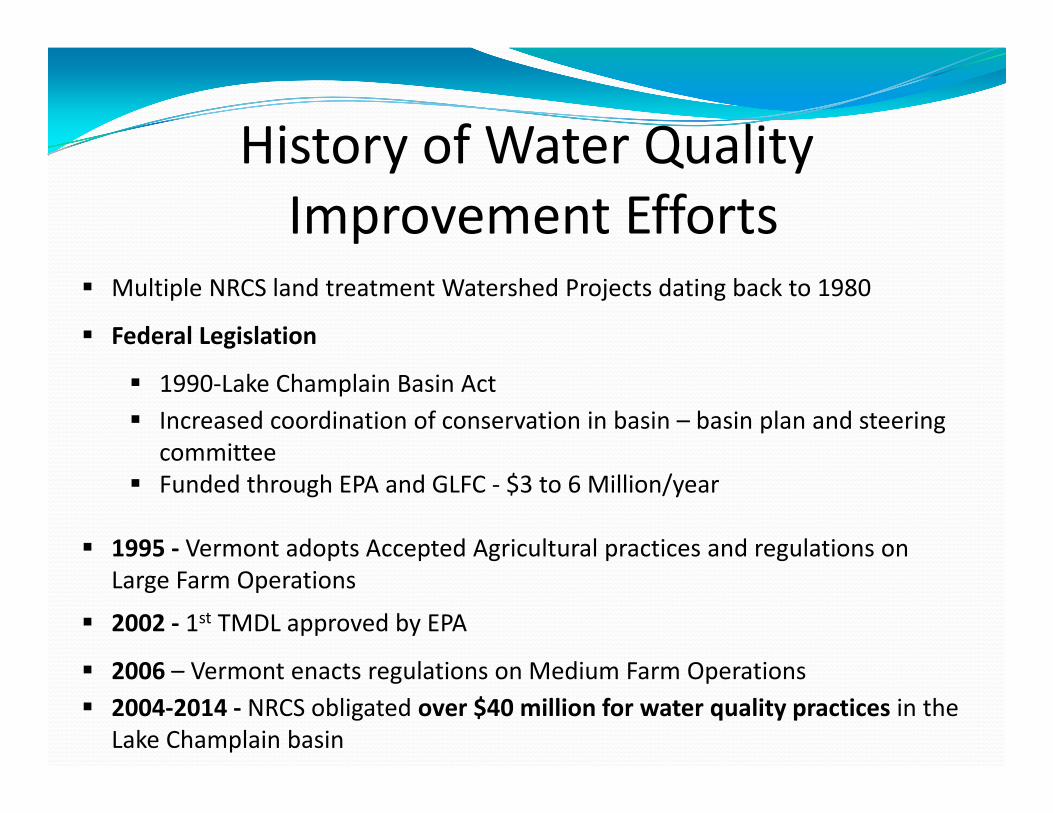
Multiple NRCS land treatment Watershed Projects dating back to 1980
Federal Legislation
1990‐Lake Champlain Basin Act Increased coordination of conservation in basin – basin plan and steering
committee Funded through EPA and GLFC ‐ $3 to 6 Million/year
1995 ‐ Vermont adopts Accepted Agricultural practices and regulations on Large Farm Operations
2002 ‐ 1st TMDL approved by EPA
2006 – Vermont enacts regulations on Medium Farm Operations 2004‐2014 ‐ NRCS obligated over $40 million for water quality practices in the
Lake Champlain basin
History of Water QualityImprovement Efforts

Lake phosphorus levels have continued to
increase despite 30 years of agricultural conservation efforts
Water Quality Trends
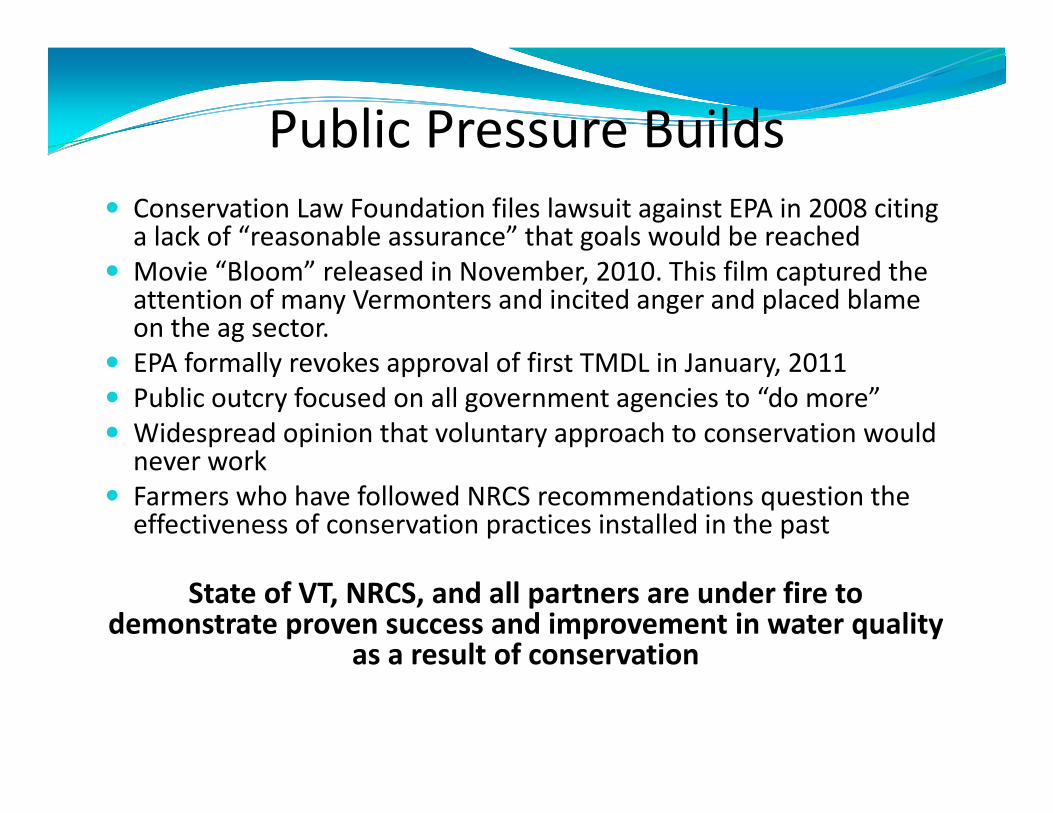
Conservation Law Foundation files lawsuit against EPA in 2008 citing a lack of “reasonable assurance” that goals would be reached
Movie “Bloom” released in November, 2010. This film captured the attention of many Vermonters and incited anger and placed blame on the ag sector.
EPA formally revokes approval of first TMDL in January, 2011 Public outcry focused on all government agencies to “do more” Widespread opinion that voluntary approach to conservation would never work
Farmers who have followed NRCS recommendations question the effectiveness of conservation practices installed in the past
State of VT, NRCS, and all partners are under fire to demonstrate proven success and improvement in water quality
as a result of conservation
Public Pressure Builds

Phosphorus Loading to Lake Champlain by Land Use
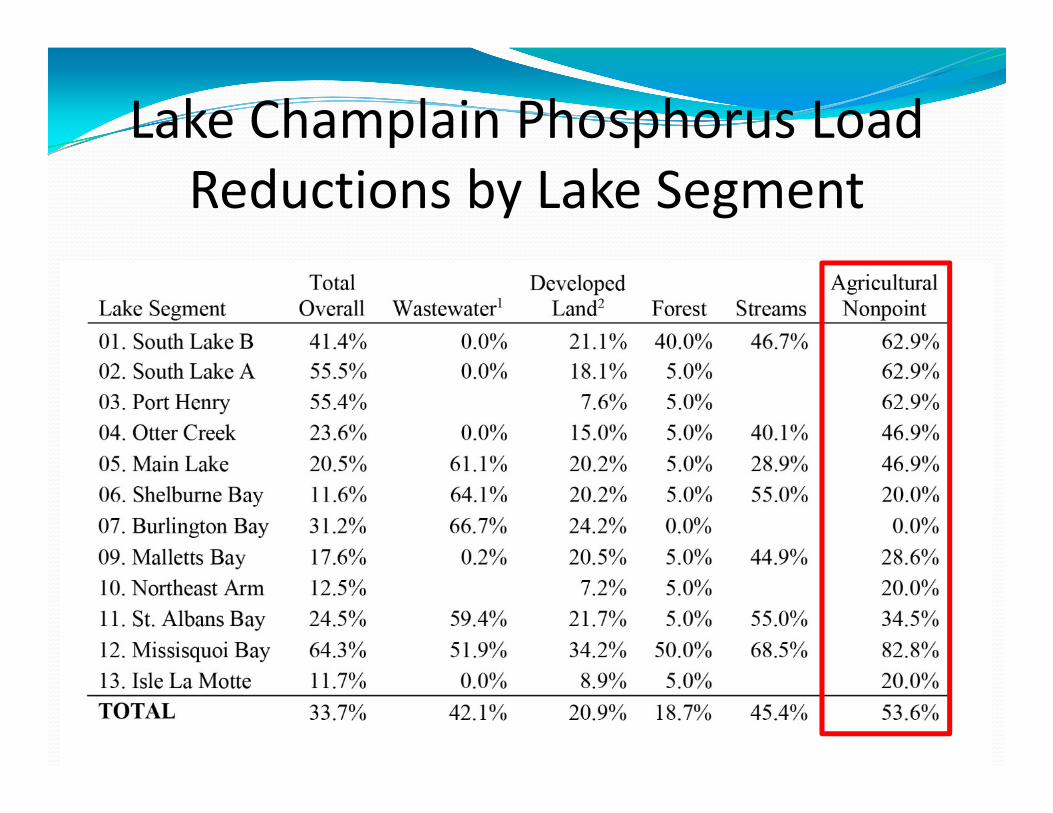
Lake Champlain Phosphorus Load Reductions by Lake Segment

In response to pending TMDL, Act 64 Passed by Vermont Legislature ‐ 2015
Applies to Farms with $2,000 gross income in an average year or 4 or more acres with livestock
Requirements NRCS 590 standard Cover Crops on floodplain fields Perennial Buffers
Surface Water – 25 feet wide Ditches – 10 feet wide
No Manure applied On any field Dec. 15 – April 1 On floodplains Oct 15‐ April 15 On 10% slopes or greater In Buffer Zones
Vermont’s New Required Ag Practices (RAPS)

Strengthen Partner Coordination Signed Water Quality MOU with 8 Partners
Improve Understanding of the Problem Edge of Field Monitoring Identified tile drainage as a significant source of soluble phosphorus Using CIG to fill data gaps
Target Resources Technical and Financial Assistance to Critical Source Areas identified through SWAT modeling Watershed Action Plans for 4 High Priority HUC 12 subbasins
Accelerate Implementation through Increased Funding and New Initiatives RCPP Vilsack Commitment Certainty – VT Environmental Stewardship Program National CIG grant for Nutrient Trading Program
Improve On Farm Planning, Accountability and Tracking Development of a Vermont‐specific, user friendly APEX model Development of a shared NRCS/partner database Tracking progress in meeting P reduction goals in 4 priority watersheds
A Look Back at NRCS Efforts Over the Past Five Years
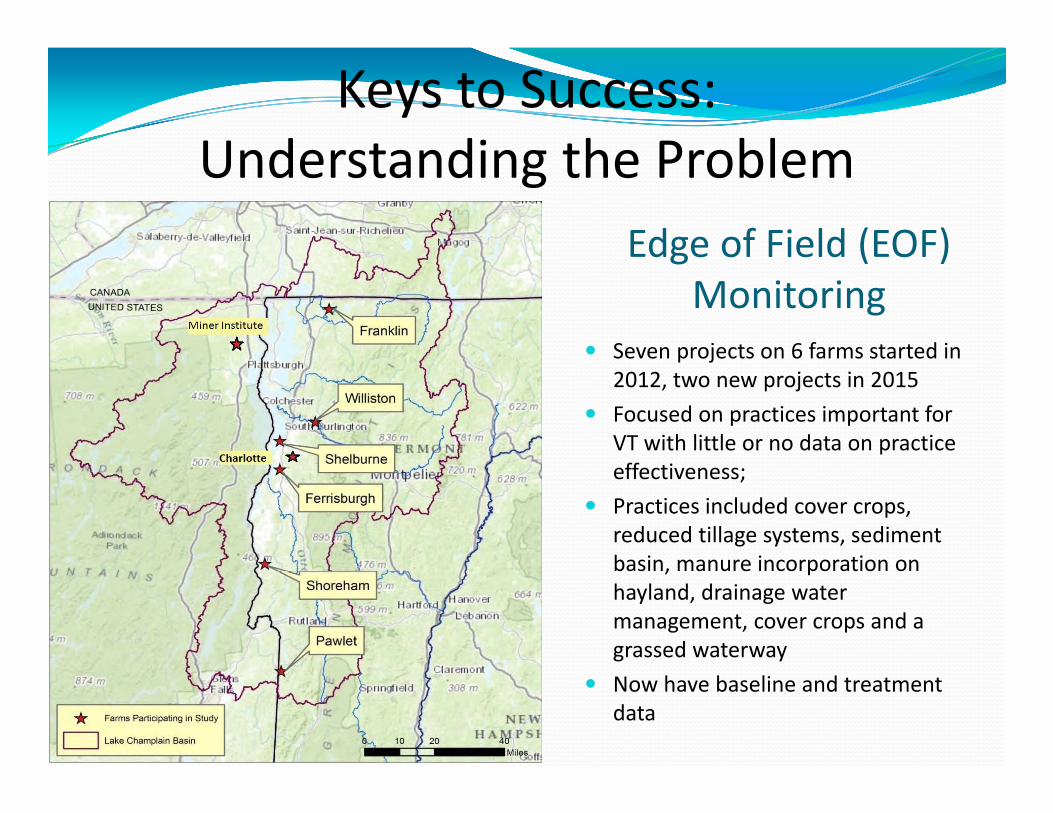
Edge of Field (EOF) Monitoring
Seven projects on 6 farms started in 2012, two new projects in 2015
Focused on practices important for VT with little or no data on practice effectiveness;
Practices included cover crops, reduced tillage systems, sediment basin, manure incorporation on hayland, drainage water management, cover crops and a grassed waterway
Now have baseline and treatment data
Keys to Success: Understanding the Problem
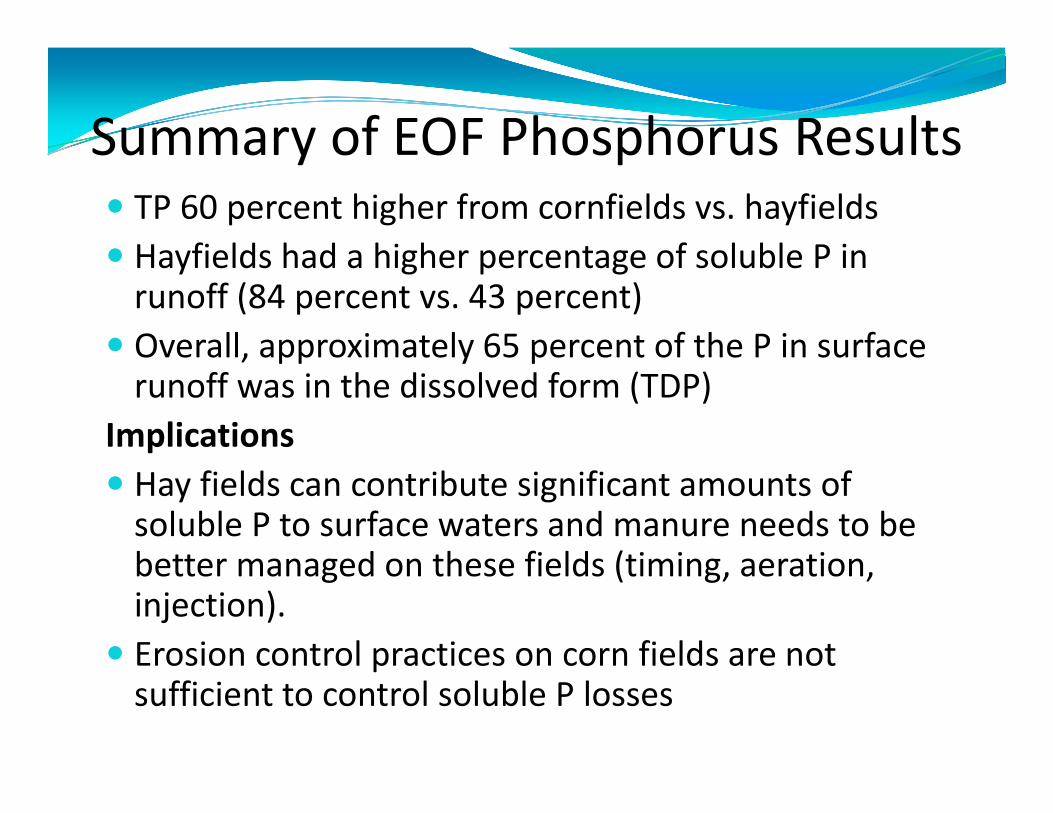
Summary of EOF Phosphorus Results TP 60 percent higher from cornfields vs. hayfields Hayfields had a higher percentage of soluble P in runoff (84 percent vs. 43 percent)
Overall, approximately 65 percent of the P in surface runoff was in the dissolved form (TDP)
Implications Hay fields can contribute significant amounts of soluble P to surface waters and manure needs to be better managed on these fields (timing, aeration, injection).
Erosion control practices on corn fields are not sufficient to control soluble P losses
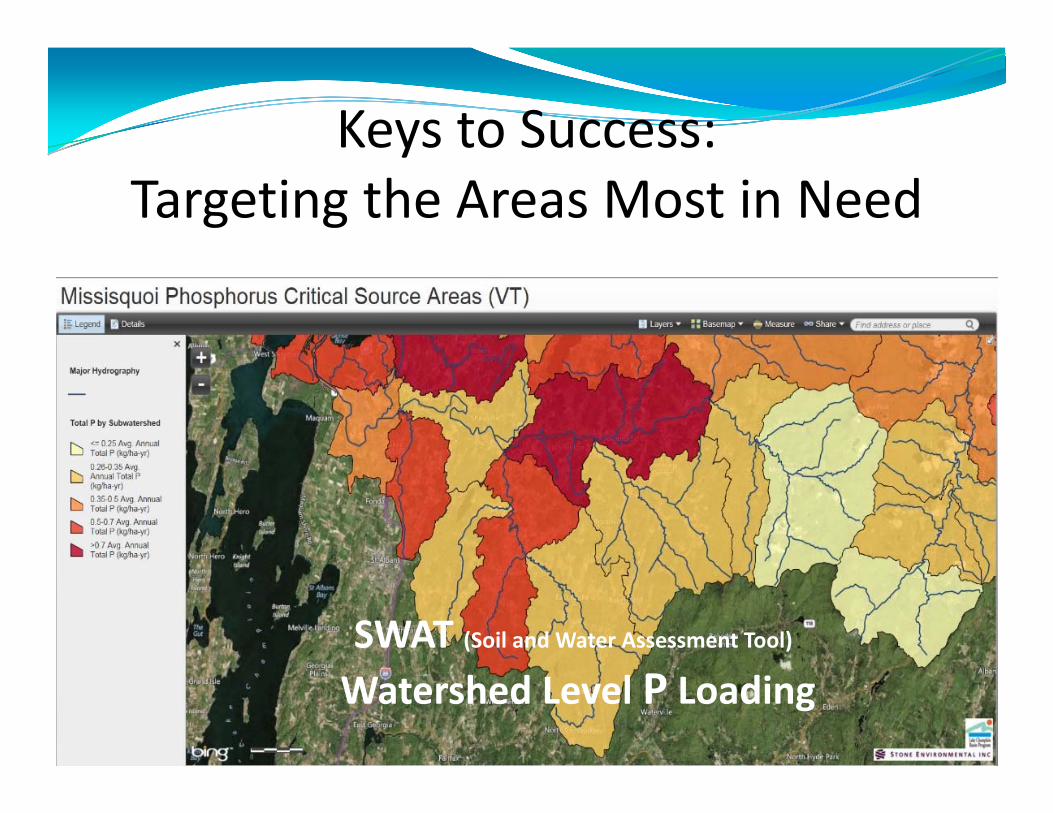
SWAT (Soil and Water Assessment Tool)
Watershed Level P Loading
Keys to Success: Targeting the Areas Most in Need
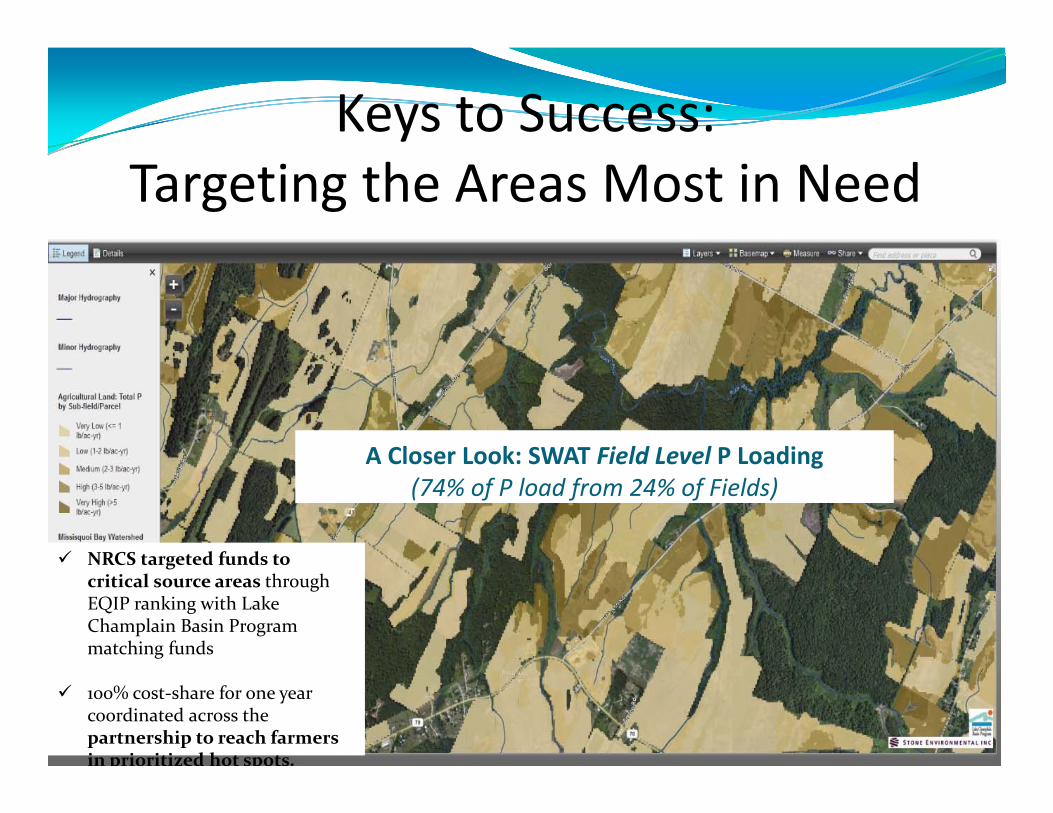
A Closer Look: SWAT Field Level P Loading(74% of P load from 24% of Fields)
NRCS targeted funds to critical source areas through EQIP ranking with Lake Champlain Basin Program matching funds
100% cost‐share for one year coordinated across the partnership to reach farmers in prioritized hot spots.
Keys to Success: Targeting the Areas Most in Need

A Steering Committee selected priority watersheds NRCS developed a watershed
level resource assessment and plan including P loading and reduction estimates
Local Workgroups developed Tactical Action Plans that identified specific implementation needs and goals
Goal: to greatly accelerate practice implementation in selected, small watersheds (HUC‐12) with focusedoutreach, technical assistance and funding.
Keys to Success: A Focused Watershed Planning Process
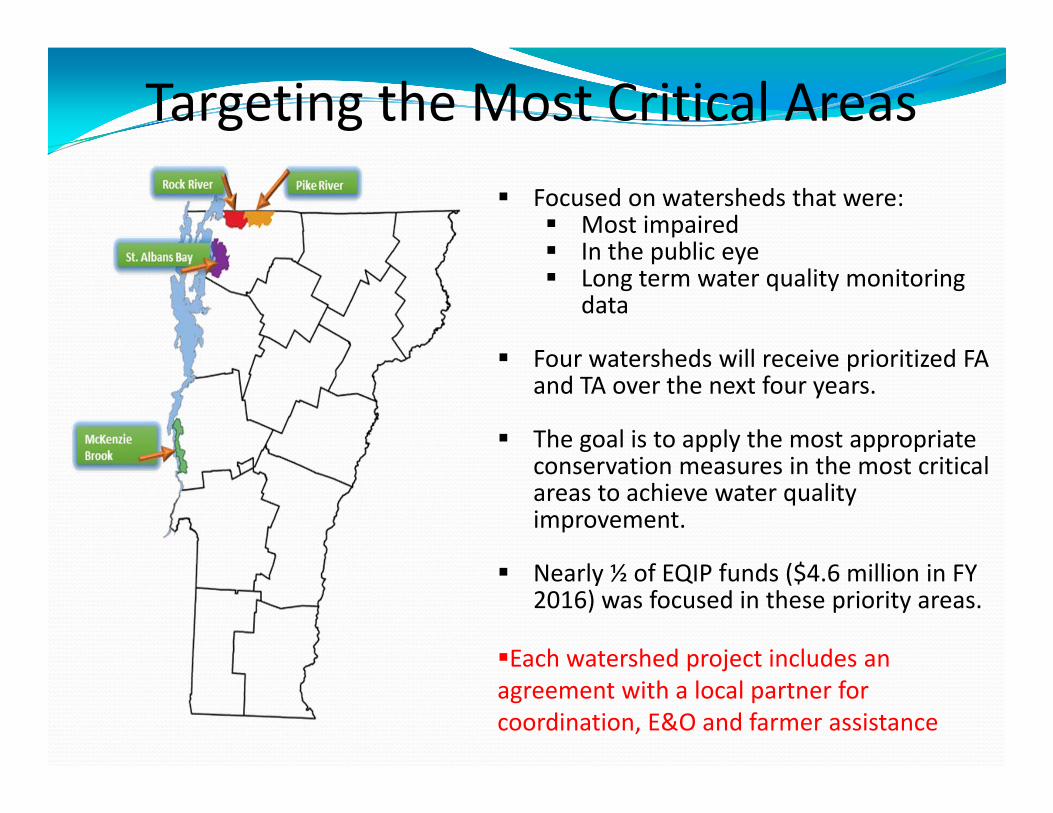
Focused on watersheds that were: Most impaired In the public eye Long term water quality monitoring
data
Four watersheds will receive prioritized FA and TA over the next four years.
The goal is to apply the most appropriate conservation measures in the most critical areas to achieve water quality improvement.
Nearly ½ of EQIP funds ($4.6 million in FY 2016) was focused in these priority areas.
Each watershed project includes an agreement with a local partner for coordination, E&O and farmer assistance
Targeting the Most Critical Areas

Watershed Name
Watershed Area (acres)
Total Estimated
Ag P Loading (lbs
/yr)
TMDL Reduction
Goal
Ag P Reduction Goal (lbs
/yr)
ProjectGoal
(lbs/yr) (% of TMDL goal)
NRCS Estimated Cost of Project
Implemen‐tation
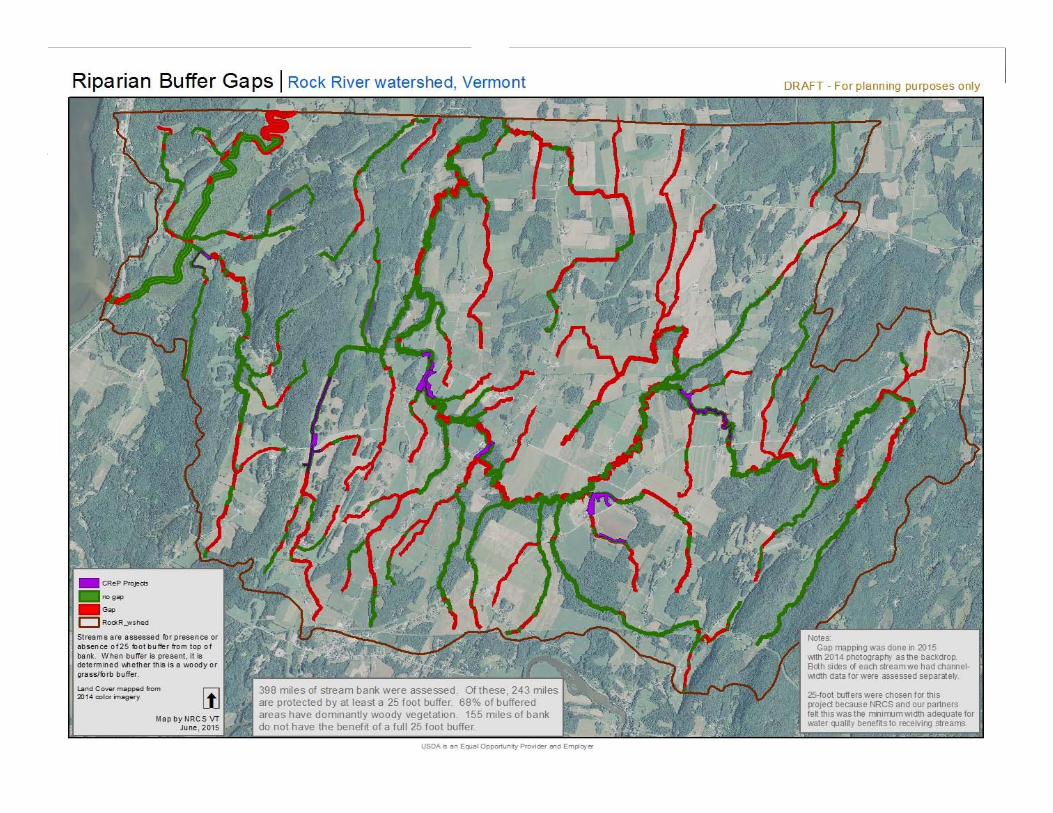
Rock River 22,743 19,248 83% 15,976 7,000(40%)
$8,518,000
Pike River 25,088 9,599 83% 7,967 5,200(65%)
$9,938,000
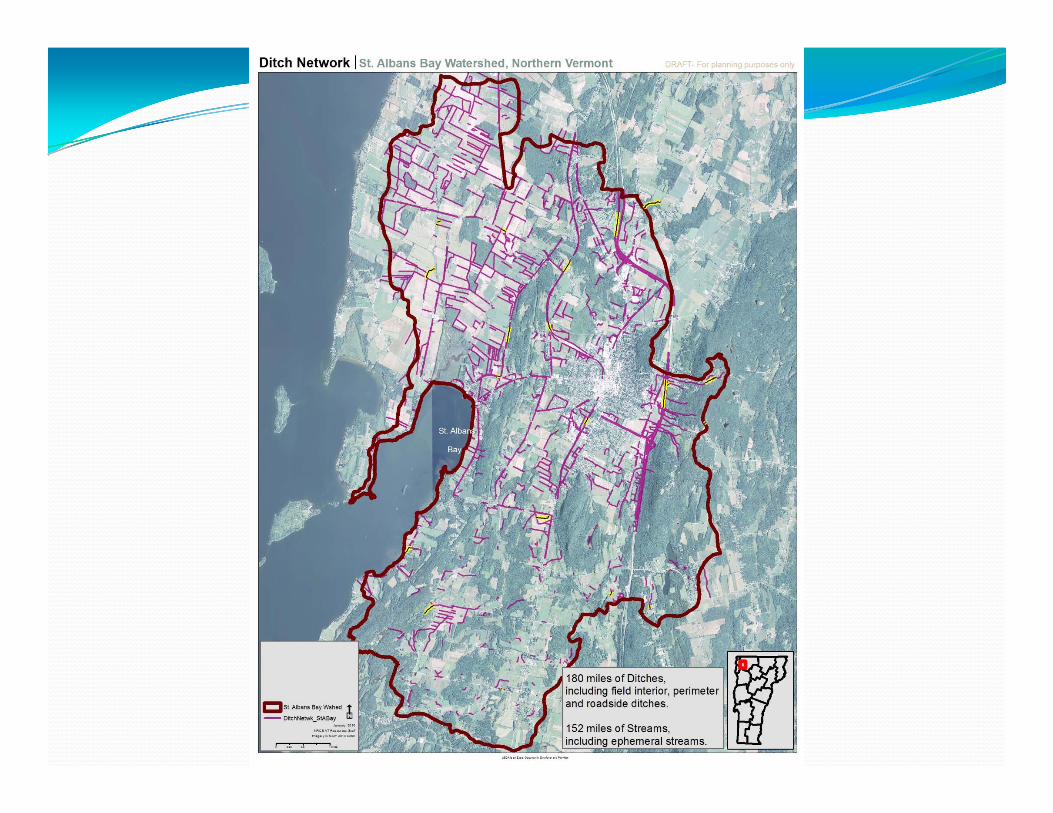
St. Albans Bay
33,515 23,047 35% 8,066 7,000(87%)
$7,764,000
McKenzie Brook
21,222 43,276* 60% 29,966 15,000(50%)
$10,753,000
2016 Priority Watershed Estimated Ag Phosphorus Loadings
and Targeted Reductions

Rock River‐Practice Scenario to Reach TMDL Goal
.Land Cover Selected BMPTotal Practice Acres
AppliedTP Load Reduction
(lbs/yr)
Cont. CornCover Crop‐Conservation Tillage‐Manure Injection 1,279 1074
Cont. corn Cover Crop 1,023 563
Cont. Corn Crop Rotation 1,540 739
Corn/Hay Riparian Buffer 34 109
Cropland Grassed Waterays 27 130
Corn/HayReduced Manure P (Nutrient Management and CAP) 3,056 306
Cont. Corn Ditch Buffer 45 878
HayReduced P inputs and Injection 2,300 230
PastureLivestock Exclusion and Riparian Buffer (CREP) 232 719
FarmsteadWaste Management Improvements 48 480
Total Reduction 10,003
TMDL Target 16,000


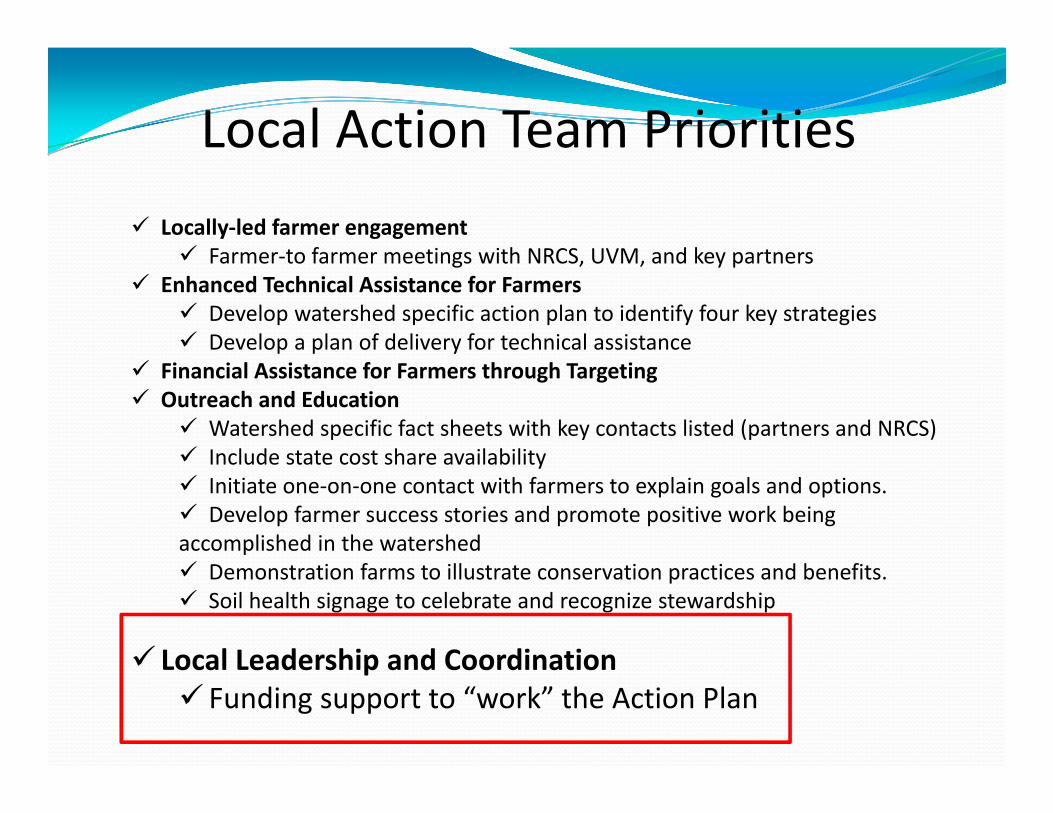
Locally‐led farmer engagement Farmer‐to farmer meetings with NRCS, UVM, and key partners
Enhanced Technical Assistance for Farmers Develop watershed specific action plan to identify four key strategies Develop a plan of delivery for technical assistance
Financial Assistance for Farmers through Targeting Outreach and Education
Watershed specific fact sheets with key contacts listed (partners and NRCS) Include state cost share availability Initiate one‐on‐one contact with farmers to explain goals and options. Develop farmer success stories and promote positive work being accomplished in the watershed Demonstration farms to illustrate conservation practices and benefits. Soil health signage to celebrate and recognize stewardship
Local Leadership and Coordination Funding support to “work” the Action Plan
Local Action Team Priorities

Outcome: A Comprehensive,
Adaptable and Efficient Strategic Plan for Implementation
The Problem
Excessive P in Lake
Champlain from Ag Sources
Enhance Understanding of
the Problem EOF Monitoring, Watershed Action Plans, Tile Drainage
Tracking, Accountability, and Evaluating
Success Partner database, APEX,
Water Quality Monitoring
Efficiently use and target
conservation funding
SWAT and CSA’s, tile drainage, APEX, STEP, Watershed Approach
Partner Coordination
Water quality MOU, cross‐training, RCPP projects for water
quality
Accelerate Conservation Implementation
RCPP, Vilsack’s Commitment, VT Env. Stewardship Program,
National CIG for Nutrient Trading Program, Watershed Action Plans
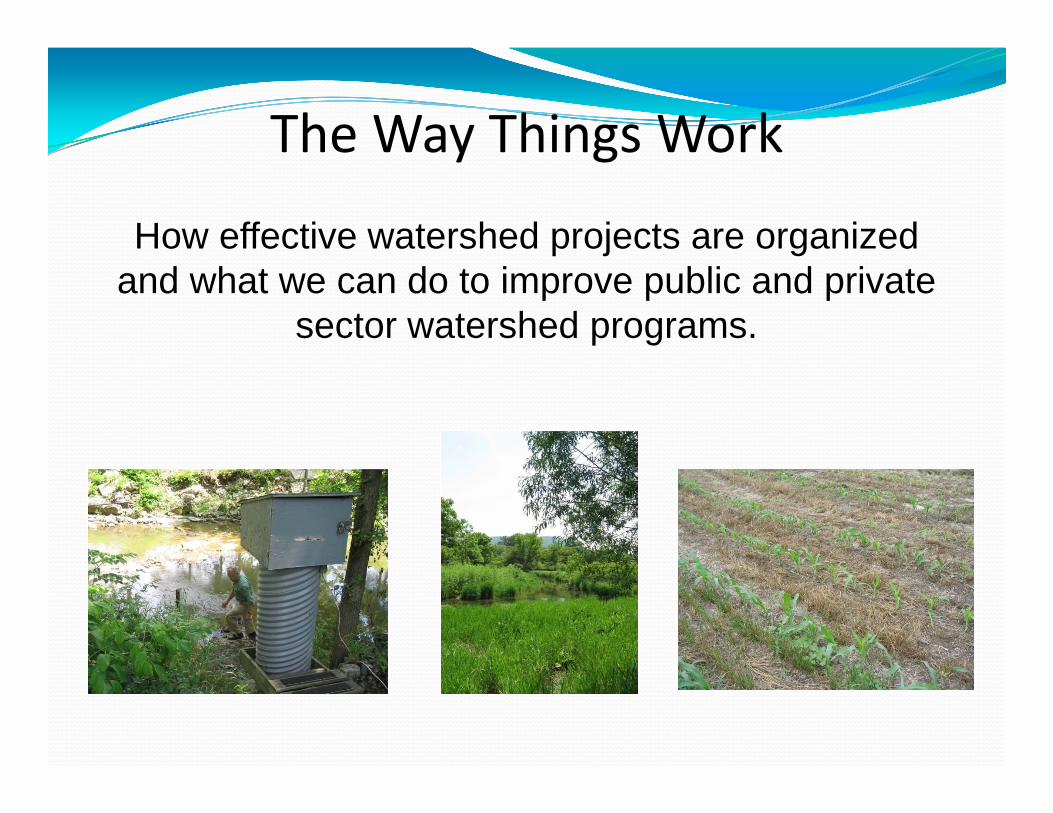
The Way Things Work
How effective watershed projects are organized and what we can do to improve public and private
sector watershed programs.
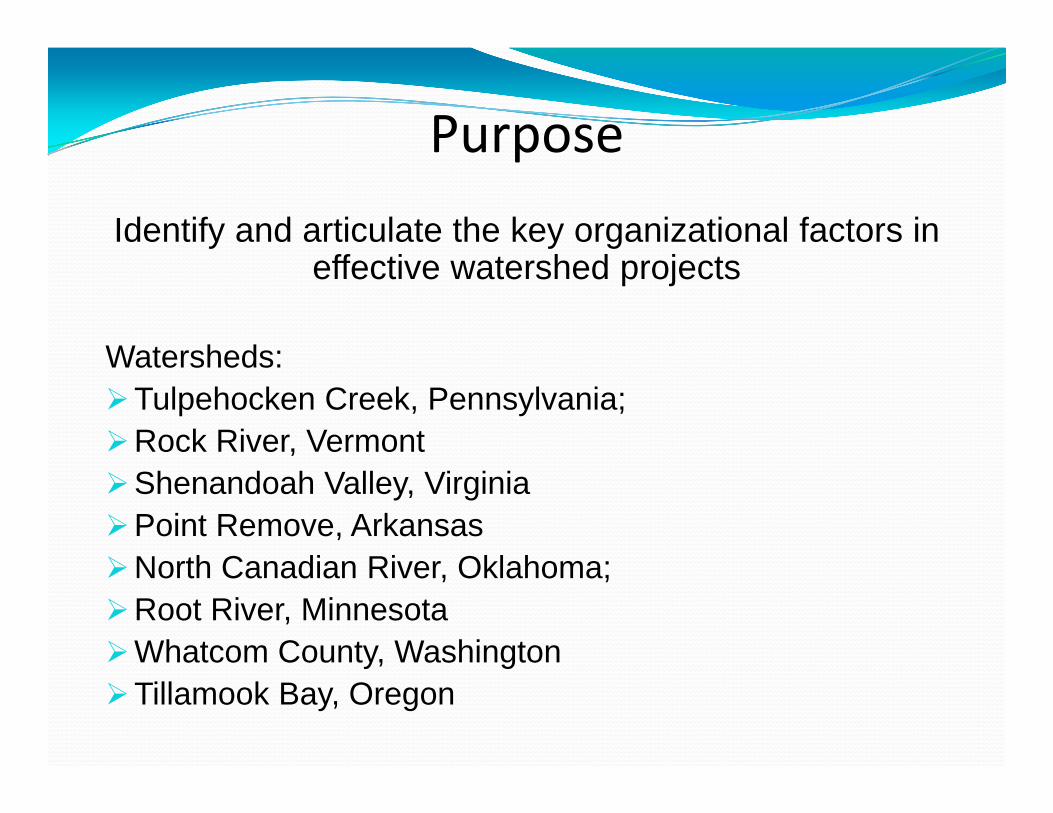
PurposeIdentify and articulate the key organizational factors in
effective watershed projects
Watersheds:Tulpehocken Creek, Pennsylvania; Rock River, VermontShenandoah Valley, VirginiaPoint Remove, Arkansas North Canadian River, Oklahoma; Root River, MinnesotaWhatcom County, WashingtonTillamook Bay, Oregon
Characteristics of Effective Watershed Projects
“Happy families are all alike; every unhappy family is unhappy in its own way.” Leo Tolstoy, Anna Karenina
Watershed assessment – Successful projects are based on sound watershed plans or assessments that characterize the nature of the water quality problems, identify sources, prioritize critical areas, & identify conservation practices.
Collaboratively developed implementation plan – Creating the plan collaboratively helps create and reinforce the partnerships that are integral to success.
Creation of a credible set of data - multiple benefits of baseline information, credibility, creating shared knowledge base and commitment
Characteristics of Effective Watershed Projects
Capacity to coordinate and manage project activities -adequate capacity and skill to organize and manage a project; an anchor organization; project coordinator & staffing.
One on one engagement with farmers and landowners -there is no substitute for the direct interaction with a farmer and the trust formed by strong working relationships.
Flexibility ability to respond to site specific conditions on a farm and engender adoption of practices that might not otherwise have been installed.
Appropriate time frame: Watershed planning, creating a shared strategy for implementation, assembling credible data, and developing the trusted relationships extends over multiple years.
ConclusionsWe know how to organize and manage effective watershed
scale projects:• Studies consistently identify the same key factors• Effectively organized and managed projects consistently
achieve substantive resultsHowever most public and private programs are not using
this knowledge on a wide scale to develop successful watershed projects
If we are serious about:• Addressing water quality • Enabling the farming community to improve water quality• Making the best use of our conservation programs and
resourcesOur task is to learn from the experiences of effective project
organizers and to systematically apply those lessons in watershed programs
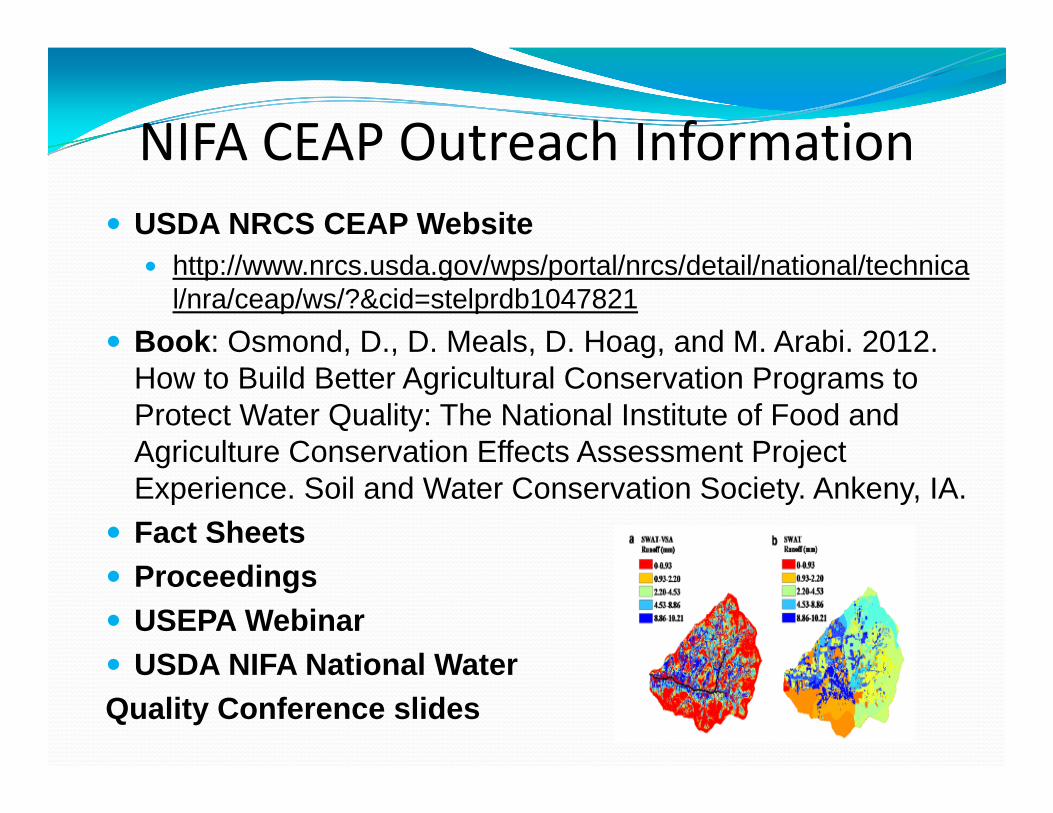
NIFA CEAP Outreach Information USDA NRCS CEAP Website
http://www.nrcs.usda.gov/wps/portal/nrcs/detail/national/technical/nra/ceap/ws/?&cid=stelprdb1047821
Book: Osmond, D., D. Meals, D. Hoag, and M. Arabi. 2012. How to Build Better Agricultural Conservation Programs to Protect Water Quality: The National Institute of Food and Agriculture Conservation Effects Assessment Project Experience. Soil and Water Conservation Society. Ankeny, IA.
Fact Sheets Proceedings USEPA Webinar USDA NIFA National Water Quality Conference slides


![[Bob Phillips] Phillips' Book of Great Thoughts (Book4You)](https://img.dokumen.tips/doc/110x75/563db77e550346aa9a8b927f/bob-phillips-phillips-book-of-great-thoughts-book4you.jpg)