Embed Size (px)
Citation preview
CHAPTER 8 LOCATION DECISIONS 107
C H A P T E R
Location Decisions
DISCUSSION QUESTIONS
1. FedEx’s key location concept is the central hub concept, with Memphis selected for several reasons, including its being in themiddle of the country and having very few hours of bad weatherclosures.
2. The major reason for U.S. firms to locate overseas is often lower labor costs, but as this chapter, Chapter 2, and Supplement 11 suggest, there are a number of considerations.
3. The major reason foreign firms build in the U.S. is to satisfy the demand for foreign goods in the United States while reducingtransportation cost and foreign exchange risk; in addition, U.S.locations allow foreign firms to circumvent quotas and/or tariffs.
4. Clustering is the tendency of firms to locate near competitors.
5. Different weights can be given to different factors. Personal preferences are included.
6. The qualitative approach usually considers many more factors, but its results are less exact.
7. Clustering examples in the service sector include fastfood restaurants, shoe and jewelry stores in a shopping mall, and themeparks.
8. Factors to consider when choosing a country:
Exchange rates Government stability (political risk) Communications systems within the country and to the
home office Wage rates Productivity Transportation costs Language Tariffs Taxes Attitude towards foreign investors/incentives Legal system Ethical standards Cultural issues Supplies availability Market locations
9. Factors to consider in a region/community decision:
Corporate desires Attractiveness of region Labor issue Utilities Environmental regulations Incentives
Proximity to raw materials/customers Land/construction costs
10. Franchise operations may add new units per year; Exxon, McDonald’s, and WalMart add hundreds of units per year, almosta daily location decision. For such organizations, the locationdecision becomes more structured, more routine. Perhaps byrepeating this process they discover what makes their strategiclocations decisions successful.
11. Factors affecting location decisions: nearness to resources, suppliers, and customers; labor productivity; foreign exchange;political risk, unions; employment; zoning; pollution; taxes; andclustering.
12. The centerofgravity method assumes that cost is directly proportional to both distance and volume shipped. For servicefacilities, revenue is assumed to be directly proportional toproximity to markets.
13. Locational breakeven analysis three steps:
Step 1: Determine fixed and variable cost for each location.
Step 2: Plot the costs for each location, with costs on thevertical axis of the graph and annual volume on thehorizontal axis.
Step 3: Select the location that has the lowest total costfor the expected production volume.
14. The issue of weight or volume gain and weight or volume loss during processing is important, and supports themanufacturing side of the saying (weight loss during mining andrefining, for example, suggests shipping after processing). But JITmay be more easily accomplished when suppliers are clusterednear the customer. And some services (such as Internet sales) cantake place at tremendous distances without sacrificing closecontact.
15. Besides low wage rates, productivity should be considered also. Employees with poor training, poor education, or poor workhabits are not a good buy. Moreover, employees who cannot or willnot reach their place of work are not much good to the organization.
16. Service location techniques: regression models to determine importance of various factors, factor rating method, traffic counts,demographic analysis of drawing area, purchasing power analysis ofarea, centerofgravity method, and geographic information system.
17. The distributor is more concerned with transportation and storage costs, and the supermarket more concerned with proximityto markets. The distributor will focus more on roads, overallpopulation density (store density), while the supermarket will focusmore on neighborhood affluence, traffic patterns, etc. The
108 CHAPTER 8 LOCATION DECISIONS
distributor will be concerned with speedy and reliable delivery, thesupermarket with easy access. Both will have concerns overattitudes and zoning. Both will need access to similar labor forces;both will need similar measures of workforce education, etc. Manyother comparisons can be drawn.
18. This is a service location problem, and should focus on revenues, not costs. Customer traffic, customer income, customerdensity, are obvious beginning points. Parking/access, security/lighting, appearance/image, rent, etc. (see Table 8.6) are otherimportant variables.
ETHICAL DILEMMALocation is a major issue in the U.S. today. Almost everycommunity is seeking new jobs, especially from foreign firms likeMercedes. As Mercedes was definitely coming to the U.S. anyway, the bidding wars are nonproductive from a central economyperspective. There are many implications to the local citizenry,especially because they pay the bills if the financial successespredicted are not accurate. Votes are usually not taken as thesedecisions are made by the political leaders of the community.Objective economic analysis on the incentives versus benefitsmight limit the giveaways.
As the United Airlines discussion suggests, there are manydownsides to the spread of incentives being offered by almostevery city, state, and country. Orlando and Louisville are likelycounting their blessings that they lost the bidding war for theUnited repair base. For every happy ending (such as Vance,Alabama, claims with its Mercedes plant), there is a story like theone in this Ethical Dilemma. The Internet should yield a rich cropof similar situations.
Active Model Exercise
ACTIVE MODEL 8.1 Center of Gravity1. What is the total weighted distance from the current old and inadequate warehouse in Pittsburgh?
318,6922. If they relocate their warehouse to the center of gravity, by how much will this reduce the total weighted shipping distance?
By 18,663—from 318,692 to 300,029.3. Observe the graph. If the number of shipments from New York doubles, how does this affect the center of gravity?
The center of gravity moves north and east.4. The center of gravity does not necessarily find the site with the minimum total weighted distance. Use the scrollbars to movethe trial location and see if you can improve (lower) the distance.
64, 97 with a total weighted distance of 299, 234 (usingSolver).5. If you have Solver set up in Excel, from Excel’s main menu, use Tools, Solver, Solve in order to see the best answer to theprevious question.
64, 97 with a total weighted distance of 299, 234.
END-OF-CHAPTER PROBLEMS
8.1 Where: Six laborers each making $3 per day can produce 40 units.Ten laborers each making $2.00 per day can produce 45 units.Two laborers each making $60 per day can make 100 units.
6 $3(a) Cambodia $0.45 unit
4010 $2.00
(b) China $0.44 unit45
2 $60(c) Montana $1.20 unit
100
China is most economical, assuming that transportation costsare not included.
8.2 Cambodia $0.45 $1.50 $1.95China $0.44 $1.00 $1.44Montana $1.20 $0.25 $1.45China is most favorable, but Montana is almost tied.
8.3 Thailand: 2,000 baht/200 10 baht/unit,if $1 10 baht $1/unit
India: 2,000 rupees/200 10 rupees/unit,if $1 8 rupees $1.25/unit
Sacramento (U.S.A.): $200/200 = $1/unit Select either Thai or U.S. company.
8.4 If India had a tariff of 30%, then making the items in India is $0.05 less than importing them from anywhere.
8.5 (a) Baptist Church is best.
SiteMaitland Baptist
ChurchNorthside
MallFactor (weight
score)(weight
score)(weight
score)
Space 18 21 24Costs 10 20 7.5Traffic density 10 16 12Neighborhood income
7.5 10.5
6Zoning laws 8 2 9
Totals53.5 69.5 58.5
(b) The totals are now Maitland, 52.5; Baptist Church, 70.5; andNorthside Mall, 56.5. Baptist Church’s location is even more preferred.8.6 (a) Atlanta 0.4(80) 0.3(20) 0.2(40) 0.1(70) 53
Charlotte 0.4(60) 0.3(50) 0.2(90) 0.1(30) 60 Charlotte is better.
(b) A change to 75 (from 60) in Charlotte’s incentive packagedoes not change the answer to part (a) because Charlotte was already the better site. The new Charlotte score is now 66overall, while Atlanta stays at 53.
8.7
FactorPhiladelphia
(weight score)New York(weight
score)
Customer convenience 17.5 20Bank accessibility 8.0 18Computer support 17.0 15Rental costs 13.5 8.25Labor costs 8.0 5.0
CHAPTER 8 LOCATION DECISIONS 109
Taxes 9.0 5.0 Totals 73.0 71.25
ILA should locate in Philadelphia.8.8 (a)
It appears that Hyde Park represents the best alternative.(b) If Present Location’s public transportation score increases
from 30 to 40, the total score increases by 10 points × 0.20weight = 2.0 points. So the new score is 51 points for PresentLocation, which is still not as good as Hyde Park’s score.
8.9 (a) The weighted averages are:
Akron 81.5Biloxi 80.0Carthage 87.5Denver 76.0
(b) Carthage is preferred (87.5 points) in the initial scenario.
Location
FactorPresent Location
WgtNewbury
WgtHyde Park
Wgt
1 40 0.30 12 60 0.30 18.00 50 0.30 15.02 20 0.15 3 20 0.15 3.00 80 0.15 12.03 30 0.20 6 60 0.20 12.00 50 0.20 10.04 80 0.35 28 50 0.35 17.50 50 0.35 17.5
Total Points 49 Total Points 50.50
Total Points 54.5
Akron Biloxi Carthage Denver
Factor Weight ScoreWeight
Score
ScoreWeight
Score ScoreWeight
Score ScoreWeight
Score
Labor 0.15 90 13.5 80 12.0 90 13.5 80 12.0 AvailabilityTech. School 0.10 95 9.5 75 7.5 65 6.5 85 8.5 QualityOperating Cost 0.30 80 24.0 85 25.5 95 28.5 85 25.5Land & Construction 0.15 60 9.0 80 12.0 90 13.5 70 10.5Ind. Incentives 0.20 90 18.0 75 15.0 85 17.0 60 12.0Labor Cost 0.10 75 7.5 80 8.0 85 8.5 75 7.5
1.00 81.5 80. 87.5 76.
Akron Biloxi Carthage Denver
Factor Weight ScoreWeight
Score
ScoreWeight
Score ScoreWeight
Score ScoreWeight
Score
Labor 0.15 90 13.5 80 12.0 90 13.5 80 12.0 AvailabilityTech. School 0.10 95 9.5 75 7.5 65 6.5 85 8.5 QualityOperating Cost 0.10 80 8.0 85 8.5 95 9.5 85 8.5Land & Construction 0.15 60 9.0 80 12.0 90 13.5 70 10.5Ind. Incentives 0.20 90 18.0 75 15.0 85 17.0 60 12.0Labor Cost 0.30 75 22.5 80 24.0 85 25.5 75 22.5
1.00
80.5
79.0
85.5
74.0
(c) In the second scenario, all four scores fall to smaller values, Carthage more than the others, but it is stillfirmly in first place. All scores are smaller because all sites had operating cost scores better than labor costscores. When labor cost takes on the higher weight, the lower scores have more influence on the total.The new scores are:Akron 80.5Biloxi 79.0Carthage 85.5
110 CHAPTER 8 LOCATION DECISIONS
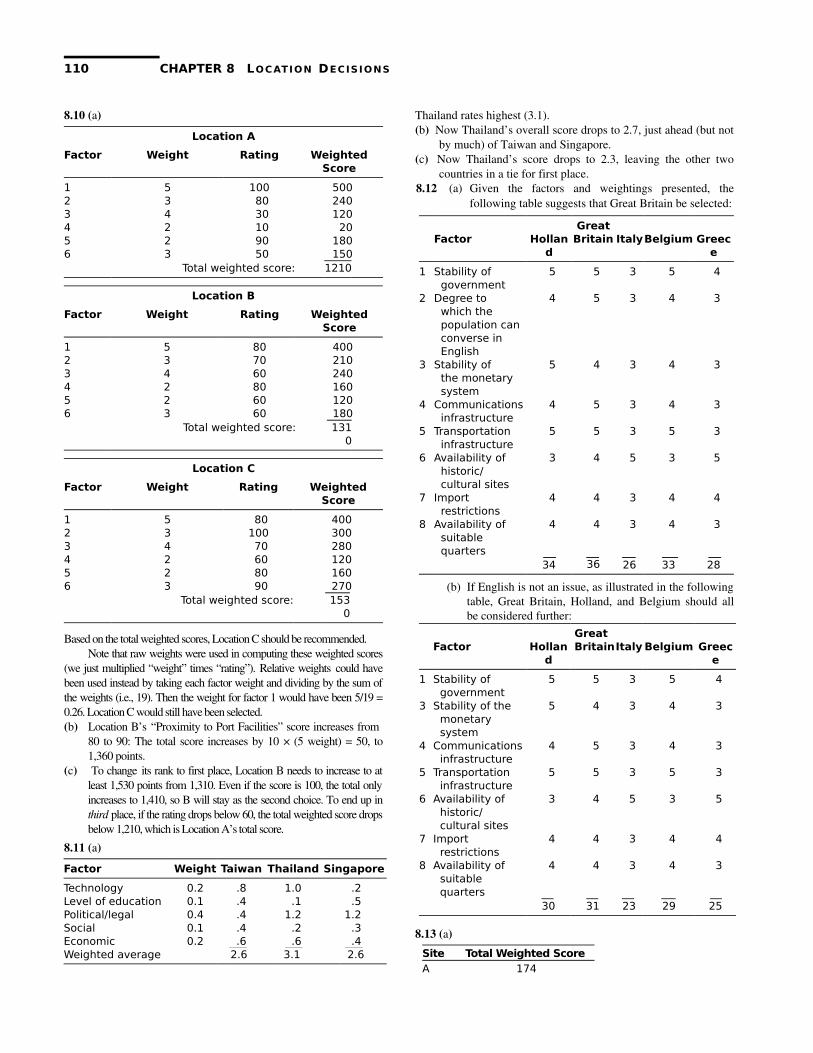
8.10 (a)
Location A
Factor Weight Rating WeightedScore
1 5 100 5002 3 80 2403 4 30 1204 2 10 205 2 90 1806 3 50 150
Total weighted score: 1210
Location B
Factor Weight Rating WeightedScore
1 5 80 4002 3 70 2103 4 60 2404 2 80 1605 2 60 1206 3 60 180
Total weighted score: 1310
Location C
Factor Weight Rating WeightedScore
1 5 80 4002 3 100 3003 4 70 2804 2 60 1205 2 80 1606 3 90 270
Total weighted score: 1530
Based on the total weighted scores, Location C should be recommended.Note that raw weights were used in computing these weighted scores
(we just multiplied “weight” times “rating”). Relative weights could havebeen used instead by taking each factor weight and dividing by the sum ofthe weights (i.e., 19). Then the weight for factor 1 would have been 5/19 =0.26. Location C would still have been selected.(b) Location B’s “Proximity to Port Facilities” score increases from
80 to 90: The total score increases by 10 × (5 weight) = 50, to1,360 points.
(c) To change its rank to first place, Location B needs to increase to atleast 1,530 points from 1,310. Even if the score is 100, the total onlyincreases to 1,410, so B will stay as the second choice. To end up inthird place, if the rating drops below 60, the total weighted score dropsbelow 1,210, which is Location A’s total score.
8.11 (a)
Factor Weight Taiwan Thailand Singapore
Technology 0.2 .8 1.0 .2Level of education 0.1 .4 .1 .5Political/legal 0.4 .4 1.2 1.2Social 0.1 .4 .2 .3Economic 0.2 .6 .6 .4Weighted average 2.6 3.1 2.6
Thailand rates highest (3.1).(b) Now Thailand’s overall score drops to 2.7, just ahead (but not
by much) of Taiwan and Singapore.(c) Now Thailand’s score drops to 2.3, leaving the other two
countries in a tie for first place.8.12 (a) Given the factors and weightings presented, the
following table suggests that Great Britain be selected:
GreatFactor Hollan
dBritain ItalyBelgium Greec
e
1 Stability of 5 5 3 5 4 government
2 Degree to 4 5 3 4 3 which the population can converse in English
3 Stability of 5 4 3 4 3 the monetary system
4 Communications 4 5 3 4 3 infrastructure
5 Transportation 5 5 3 5 3 infrastructure
6 Availability of 3 4 5 3 5 historic/ cultural sites
7 Import 4 4 3 4 4 restrictions
8 Availability of 4 4 3 4 3 suitable quarters
34 36 26 33 28
(b) If English is not an issue, as illustrated in the followingtable, Great Britain, Holland, and Belgium should allbe considered further:
GreatFactor Hollan
dBritainItaly Belgium Greec
e
1 Stability of 5 5 3 5 4 government
3 Stability of the 5 4 3 4 3 monetary system
4 Communications 4 5 3 4 3 infrastructure
5 Transportation 5 5 3 5 3 infrastructure
6 Availability of 3 4 5 3 5 historic/ cultural sites
7 Import 4 4 3 4 4 restrictions
8 Availability of 4 4 3 4 3 suitable quarters
30 31 23 29 25
8.13 (a)Site Total Weighted ScoreA 174
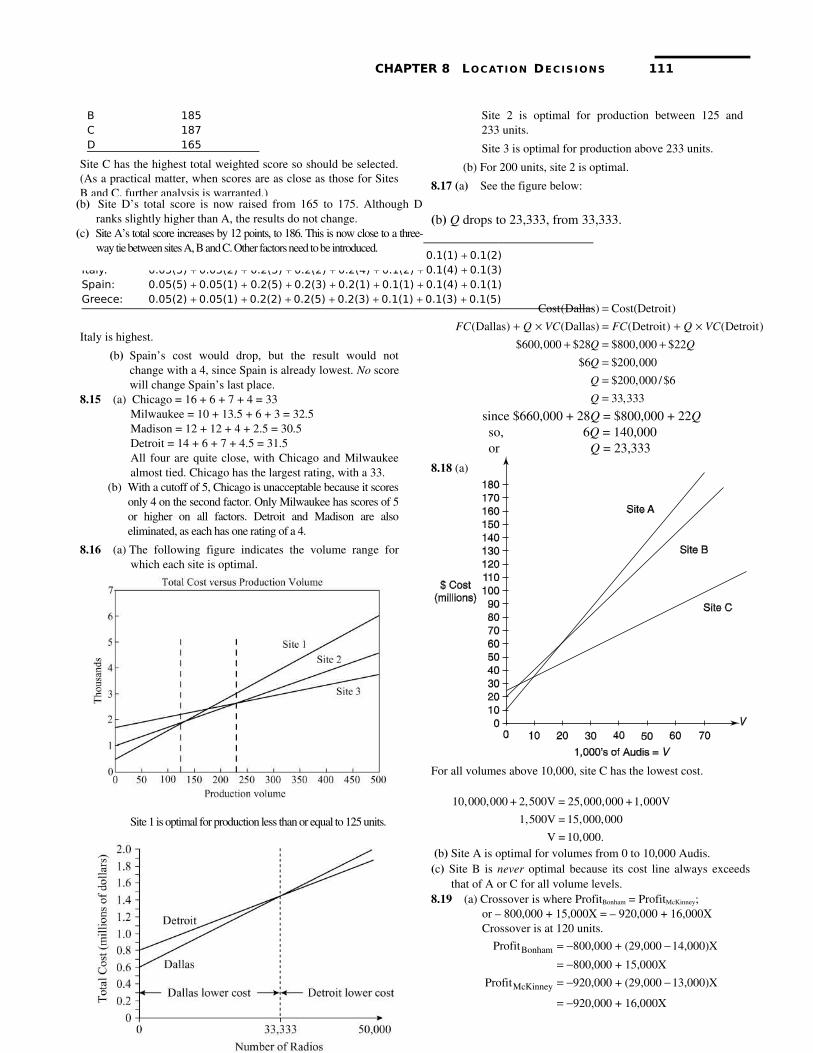
CHAPTER 8 LOCATION DECISIONS 111
B 185C 187D 165
Site C has the highest total weighted score so should be selected.(As a practical matter, when scores are as close as those for SitesB and C, further analysis is warranted.)
8.14 (a)
Italy is highest.
(b) Spain’s cost would drop, but the result would notchange with a 4, since Spain is already lowest. No scorewill change Spain’s last place.
8.15 (a) Chicago = 16 + 6 + 7 + 4 = 33Milwaukee = 10 + 13.5 + 6 + 3 = 32.5Madison = 12 + 12 + 4 + 2.5 = 30.5Detroit = 14 + 6 + 7 + 4.5 = 31.5All four are quite close, with Chicago and Milwaukeealmost tied. Chicago has the largest rating, with a 33.
(b) With a cutoff of 5, Chicago is unacceptable because it scoresonly 4 on the second factor. Only Milwaukee has scores of 5or higher on all factors. Detroit and Madison are alsoeliminated, as each has one rating of a 4.
8.16 (a) The following figure indicates the volume range forwhich each site is optimal.
Site 1 is optimal for production less than or equal to 125 units.
Site 2 is optimal for production between 125 and 233 units.
Site 3 is optimal for production above 233 units.
(b) For 200 units, site 2 is optimal.
8.17 (a) See the figure below:
(b) Q drops to 23,333, from 33,333.
since $660,000 + 28Q = $800,000 + 22Qso, 6Q = 140,000 or Q = 23,333
8.18 (a)
For all volumes above 10,000, site C has the lowest cost.
(b) Site A is optimal for volumes from 0 to 10,000 Audis.(c) Site B is never optimal because its cost line always exceeds
that of A or C for all volume levels.8.19 (a) Crossover is where ProfitBonham = ProfitMcKinney;
or – 800,000 + 15,000X = – 920,000 + 16,000XCrossover is at 120 units.
10,000,000 + 2,500V = 25,000,000 +1,000V1,500V = 15,000,000
V = 10,000.
Cost(Dallas) Cost(Detroit)(Dallas) (Dallas) (Detroit) (Detroit)
$600,000 $28 $800,000 $22$6 $200,000
$200,000 / $633,333
FC Q VC FC Q VC
Q Q
Q
Q
Q
Germany: 0.05(5) 0.05(4) 0.2(5) 0.2(5) 0.2(1) 0.1(4) 0.1(1) 0.1(2) Italy: 0.05(5) 0.05(2) 0.2(5) 0.2(2) 0.2(4) 0.1(2) 0.1(4) 0.1(3) Spain: 0.05(5) 0.05(1) 0.2(5) 0.2(3) 0.2(1) 0.1(1) 0.1(4) 0.1(1) Greece: 0.05(2) 0.05(1) 0.2(2) 0.2(5) 0.2(3) 0.1(1) 0.1(3) 0.1(5)
Bonham
McKinney
Profit 800,000 + (29,000 14,000)X
800,000 + 15,000XProfit 920,000 + (29,000 13,000)X
920,000 + 16,000X
(b) Site D’s total score is now raised from 165 to 175. Although Dranks slightly higher than A, the results do not change.
(c) Site A’s total score increases by 12 points, to 186. This is now close to a threeway tie between sites A, B and C. Other factors need to be introduced.
112 CHAPTER 8 LOCATION DECISIONS
(b, c) McKinney is preferable beyond 120 units, Bonhambelow 120 units.
(d) Bonham has breakeven at about 53 units; McKinneyabout 58, so both are beyond breakeven at thecrossover.
8.20 (a)5 5 6 10 4 15 9 5 7 15 3 10 2 5
5 10 15 5 15 10 5335
5.1565
10 5 8 10 9 15 5 5 9 15 2 10 6 55 10 15 5 15 10 5
4757.31
65
x
y
C
C
The proposed new hub should be near (5.15, 7.31).(b) When the shipment loads from City A triple, from 5 to 15, the
new coordinates are (5.13, 7.67).
8.213 9.2 3 7.3 5 7.8 3 5.0 3 2.8
3 5.5 3 5.0 3 3.826
154.85.95
263 3.5 3 2.5 5 1.4 3 8.4 3 6.5 3 2.4
3 3.6 3 8.526
113.24.35
26
x
y
C
C
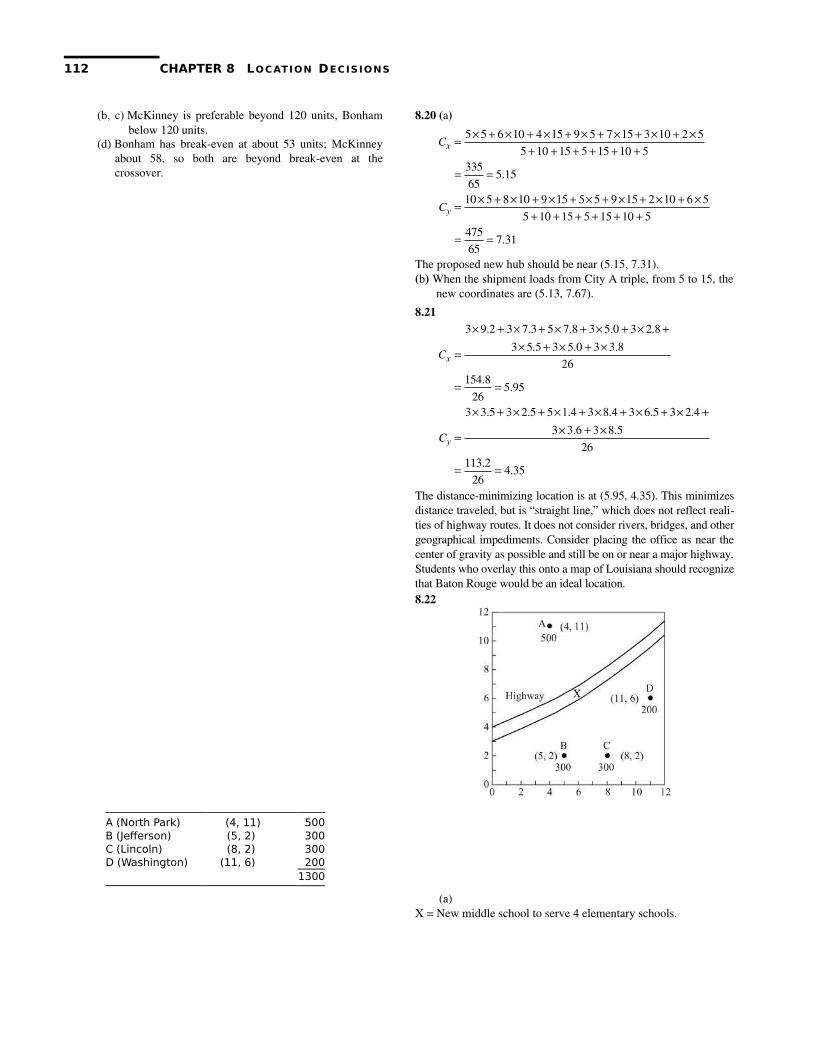
The distanceminimizing location is at (5.95, 4.35). This minimizesdistance traveled, but is “straight line,” which does not reflect realities of highway routes. It does not consider rivers, bridges, and othergeographical impediments. Consider placing the office as near thecenter of gravity as possible and still be on or near a major highway.Students who overlay this onto a map of Louisiana should recognizethat Baton Rouge would be an ideal location.8.22
(a)X = New middle school to serve 4 elementary schools.
A (North Park) (4, 11) 500B (Jefferson) (5, 2) 300C (Lincoln) (8, 2) 300D (Washington) (11, 6) 200
1300
CHAPTER 8 LOCATION DECISIONS 113
(b) Other considerations:
Cannot locate on the highway, obviously Safety—pedestrian bridge Space for school and grounds Traffic Availability of land and its price
8.23 (a)
xC = x coordinate of center of gravity
x
x
y
C
C
C
[25(2,000) 25(5,000) 55(10,000) 50(7,000)80(10,000) 70(20,000) 90(14,000)]
[2,000 5,000 10,000 7,000 10,00020,000 14,000]
4,535,00066.69
68,000[45(2,000) 25(5,000) 45(10,000) 20(7,000)
50(10,
yC
000) 20(20,000) 25(14,000)][2,000 5,000 10,000 7,000 10,000
20,000 14,000]2,055,000
30.2268,000
The center of gravity is (66.69, 30.22).(b) When Census tracks 103 and 105 increase by 20% each, from
10,000 to 12,000 population, the new coordinates become(66.74, 31.18). Coordinate denominators increase (by 2,000 + 2,000) to 72,000. The xcoordinate numerator increases (by55(2,000) + 80(2,000)) to 4,805,000. The ycoordinatenumerator increases (by 45(2,000) + 50(2,000)) to 2,245,000.
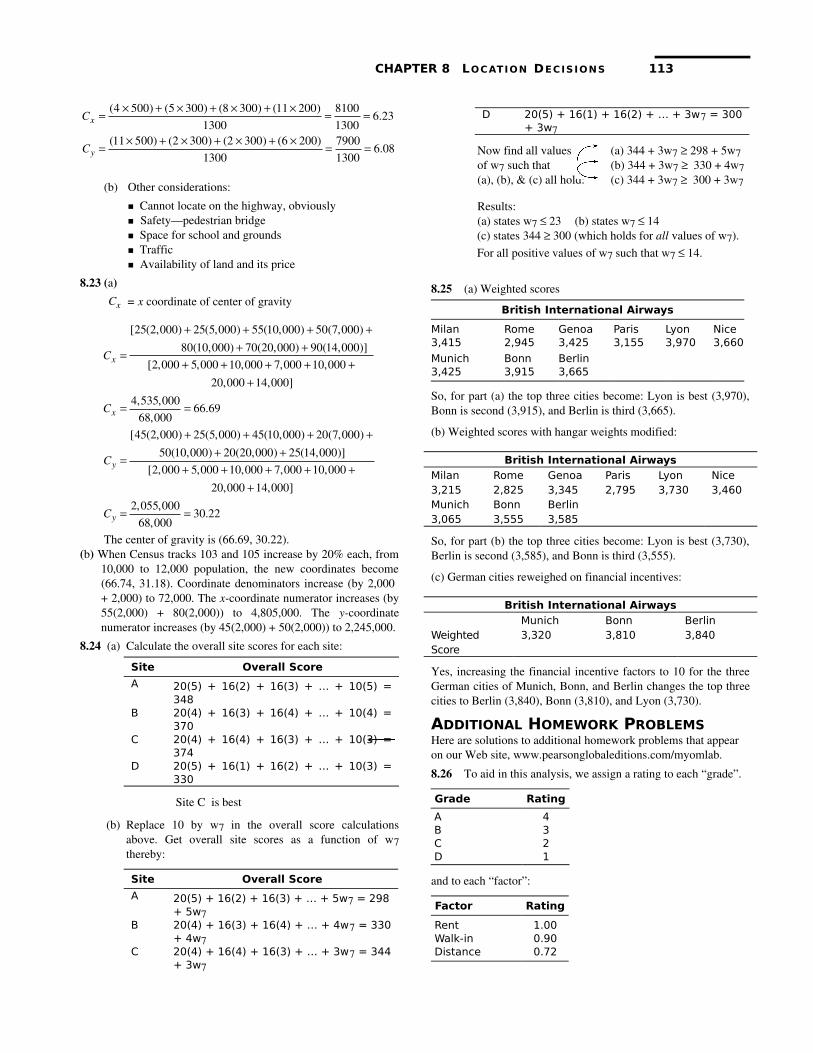
8.24 (a) Calculate the overall site scores for each site:
Site Overall Score
A 20(5) + 16(2) + 16(3) + … + 10(5) =348
B 20(4) + 16(3) + 16(4) + … + 10(4) =370
C 20(4) + 16(4) + 16(3) + … + 10(3) =374
D 20(5) + 16(1) + 16(2) + … + 10(3) =330
Site C is best
(b) Replace 10 by w 7 in the overall score calculationsabove. Get overall site scores as a function of w7thereby:
Site Overall Score
A 20(5) + 16(2) + 16(3) + … + 5w7 = 298+ 5w7
B 20(4) + 16(3) + 16(4) + … + 4w7 = 330+ 4w7
C 20(4) + 16(4) + 16(3) + … + 3w7 = 344+ 3w7
D 20(5) + 16(1) + 16(2) + … + 3w7 = 300+ 3w7
Now find all values (a) 344 + 3w7 298 + 5w7of w7 such that (b) 344 + 3w7 330 + 4w7(a), (b), & (c) all hold: (c) 344 + 3w7 300 + 3w7
Results:(a) states w7 23 (b) states w7 14(c) states 344 300 (which holds for all values of w7).For all positive values of w7 such that w7 14.
8.25 (a) Weighted scores
British International Airways
Milan Rome Genoa Paris Lyon Nice3,415 2,945 3,425 3,155 3,970 3,660
Munich Bonn Berlin3,425 3,915 3,665
So, for part (a) the top three cities become: Lyon is best (3,970),Bonn is second (3,915), and Berlin is third (3,665).
(b) Weighted scores with hangar weights modified:
British International AirwaysMilan Rome Genoa Paris Lyon Nice3,215 2,825 3,345 2,795 3,730 3,460Munich Bonn Berlin3,065 3,555 3,585
So, for part (b) the top three cities become: Lyon is best (3,730),Berlin is second (3,585), and Bonn is third (3,555).
(c) German cities reweighed on financial incentives:
British International AirwaysMunich Bonn Berlin
WeightedScore
3,320 3,810 3,840
Yes, increasing the financial incentive factors to 10 for the threeGerman cities of Munich, Bonn, and Berlin changes the top threecities to Berlin (3,840), Bonn (3,810), and Lyon (3,730).
ADDITIONAL HOMEWORK PROBLEMSHere are solutions to additional homework problems that appear on our Web site, www.pearsonglobaleditions.com/myomlab.
8.26 To aid in this analysis, we assign a rating to each “grade”.
Grade Rating
A 4 B 3 C 2 D 1
and to each “factor”:
Factor Rating
Rent 1.00 Walk-in 0.90 Distance 0.72
(4 500) (5 300) (8 300) (11 200) 81006.23
1300 1300(11 500) (2 300) (2 300) (6 200) 7900
6.081300 1300
x
y
C
C
114 CHAPTER 8 LOCATION DECISIONS
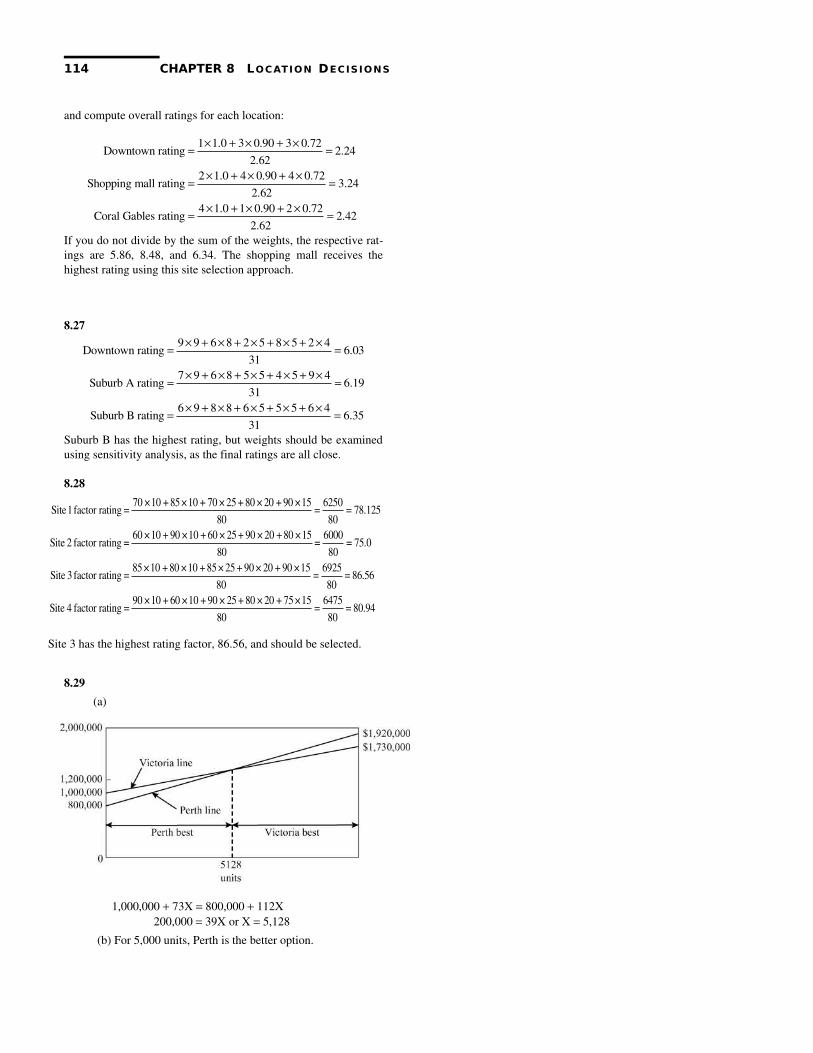
and compute overall ratings for each location:
1 1.0 3 0.90 3 0.72Downtown rating 2.24
2.622 1.0 4 0.90 4 0.72
Shopping mall rating 3.242.62
4 1.0 1 0.90 2 0.72Coral Gables rating 2.42
2.62
If you do not divide by the sum of the weights, the respective ratings are 5.86, 8.48, and 6.34. The shopping mall receives thehighest rating using this site selection approach.
8.279 9 6 8 2 5 8 5 2 4
Downtown rating 6.0331
7 9 6 8 5 5 4 5 9 4Suburb A rating 6.19
316 9 8 8 6 5 5 5 6 4
Suburb B rating 6.3531
Suburb B has the highest rating, but weights should be examinedusing sensitivity analysis, as the final ratings are all close.
8.28
8.29(a)
1,000,000 73X 800,000 112X200,000 39X or X 5,128
(b) For 5,000 units, Perth is the better option.
70 ×10 + 85×10 + 70 × 25 + 80 × 20 + 90 ×15 6250Site 1 factor rating = = = 78.125
80 8060 ×10 + 90 ×10 + 60 × 25 + 90 × 20 + 80 ×15 6000
Site 2 factor rating = = = 75.080 80
85 ×10 + 80 ×10 + 85× 25 + 90 × 20 + 90 ×15 6925Site 3 factor rating = = = 86.56
80 80
Site 90 ×10 + 60 ×10 + 90 × 25 + 80 × 20 + 75 ×15 6475
4 factor rating = = = 80.9480 80
Site 3 has the highest rating factor, 86.56, and should be selected.
CHAPTER 8 LOCATION DECISIONS 115
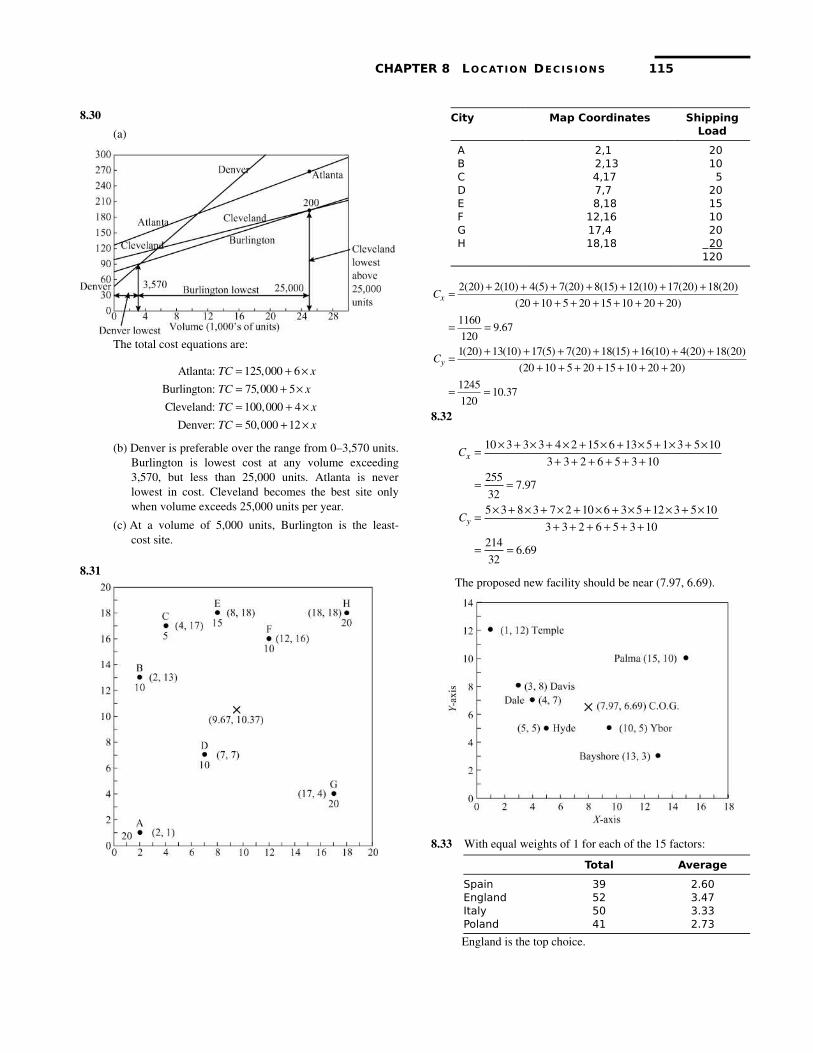
8.30(a)
The total cost equations are:
Atlanta: 125,000 6Burlington: 75,000 5Cleveland: 100,000 4
Denver: 50,000 12
TC x
TC x
TC x
TC x
(b) Denver is preferable over the range from 0–3,570 units.Burlington is lowest cost at any volume exceeding3,570, but less than 25,000 units. Atlanta is neverlowest in cost. Cleveland becomes the best site onlywhen volume exceeds 25,000 units per year.
(c) At a volume of 5,000 units, Burlington is the leastcost site.
8.31
City Map Coordinates ShippingLoad
A 2,1 20 B 2,13 10 C 4,17 5 D 7,7 20 E 8,18 15 F 12,16 10 G 17,4 20 H 18,18 20
120
2(20) 2(10) 4(5) 7(20) 8(15) 12(10) 17(20) 18(20)(20 10 5 20 15 10 20 20)
11609.67
1201(20) 13(10) 17(5) 7(20) 18(15) 16(10) 4(20) 18(20)
(20 10 5 20 15 10 20 20)1245
10.37120
x
y
C
C
8.32
10 3 3 3 4 2 15 6 13 5 1 3 5 103 3 2 6 5 3 10
2557.97
325 3 8 3 7 2 10 6 3 5 12 3 5 10
3 3 2 6 5 3 10214
6.6932
x
y
C
C
The proposed new facility should be near (7.97, 6.69).
8.33 With equal weights of 1 for each of the 15 factors:
Total Average
Spain 39 2.60England 52 3.47Italy 50 3.33Poland 41 2.73
England is the top choice.
1
2
116 CHAPTER 8 LOCATION DECISIONS
8.34 With weights given, the result became:Spain 2.55England 3.55Italy 3.30Poland 2.80
England remains the top selection.
CASE STUDY
FINDING A LOCATION FOR ELECTRONICS COMPONENT MANUFACTURING IN ASIA1. What advantages and disadvantages does each potential
location offer?SingaporeAdvantages: labor relatively cheap, good transportinfrastructure and incentives offered to stay.Disadvantages: increasing labor costs and increasing utilitycosts.Hong KongAdvantages: labor consistently cheap and good transportinfrastructure.Disadvantages: no specific disadvantage has been identifiedin the case but students should attempt to discuss this further.MalaysiaAdvantages: access to raw materials and natural resourcesinexpensive labor.Disadvantages: Concern with frequency of ship visits.
2. What other relevant factors that are not mentioned in the casestudy might play a role in this decision?The education of the workforce (both current workforce andfuture generations) as well as political stability will impactthe decision.
3. Why is transportation infrastructure so important in this decision?Since ACM is reliant on logistics for raw materials andtransporting final products to customers, transportation costs(both current and expected development of the costs) willdoubtlessly have a large impact on the decision.
4. This is a longterm strategic decision; what factors might change in the next ten to twenty years? How will this influence the decision?
Since the plant will “pay for itself” over a long time horizon,decision relevant costs must be examined not only at theircurrent level but also how this is expected to develop overthe horizon. Examples of costs which are likely to changeand whose change would make or break the decision wouldinclude labor costs, utility costs, raw material costs, transportcosts. Also other difficult to forecast developments such asexchange rates and political stability will impact theprofitability.
5. Which alternative would you recommend, under which circumstances?
Answers will vary but students should discuss how to approachthe problem of selecting the appropriate location. For example,
if possible, students should explore the use of factorratingmethod for this problem.
VIDEO CASE STUDIES
LOCATING THE NEXT RED LOBSTER RESTAURANT
1. MapInfo has 72 clusters that provide socioeconomic profiling.These profiles (PSYTE) provide interesting reading and data forclass discussion. MapInfo would tell you that the applications arevirtually limitless. For instance, the BusinessMAP databaseincludes the following datasets to aid financial institution locationdecisions:
ESRI’s currentyear and 5yearout estimates for population, age, race, and income
Branch location, asset, and deposit information from RPM Consulting’s Branchinfo
MarketBank data, with information about deposit and loan potential
National Credit Union Association data on member assets, loans, etc.
Segmented lifestyle/life change information D & B listings Street level maps
Data such as the above helps the location decision by providing current and potential deposit and loan information as well as information about the competition.
Sources: www.esri.com/bmapfinancial, www.esri.com/archnews,and www.esri.com/partners.
2. Many differences can be identified in an assignment or classdiscussion, but restaurants want disposable income, while retail—depending on the type of retail—wants high traffic, andmanufacturing wants a focus on costs, infrastructure, and lowtaxes.
3. Darden has shied away from urban locations; high locationcosts do not fit its current model, but Darden has found fertileground in first and secondtier suburban and exurban/small (over90% of the Red Lobsters are in these three density classes).Incidentally, in 2010, Darden announced it will begin to openfacilities outside the U.S. and Canada.
WHERE TO PLACE THE HARD ROCK CAFE
1. The attached report details the information that Mundaycollects and analyzes about each site. As such, it provides theanswer to the first question.2. The ratings of the four cities are:A = 80.5, B = 64.5, C = 71.5, and D = 79.5. So City A is a closefirst choice over City D. In reality, they are so close that otherconsiderations may be included, or sensitivity analysis on scoresor weights performed.
3. Expansion is the lifeblood of any global organization. Gooddecisions mean a 10 to 20year cash flow. Bad ones mean a 10plus year commitment to a moneylosing location.
CHAPTER 8 LOCATION DECISIONS 117
4. Hard Rock considers political risk, crime, currency, and otherfactors in location decisions abroad. In Russia and Colombia,corruption is so endemic that having a local partner who canunderstand and handle these issues is a necessity.
HARD ROCK REPORT (CONT’D)
4. Attendance5. Future Bookings6. Expansion Plans7. Major Conventions
Attractions Entertainment (Including location, seats, attendance)
1. Theaters (Including live performance space)2. Cinemas (Including IMAX)3. Theme Parks4. Zoo/Aquarium5. Historic Sites
Sports (Capacity, annual attendance, location, age of facility, etc.)1. Soccer2. Rugby3. Baseball4. Minor Leagues
Retail (Size, tenants, visitors, seasonality)1. Regional Shopping Centers2. Discount Shopping Centers3. Shopping Districts
Transportation Airport
1. Age2. Passengers Annually3. Airlines (Indicate hub city)4. Direct Flights
Rail Road Sea/River
Restaurants (A selection of restaurants in key areas of the target market)
1. Name2. Location3. Type4. Seats5. Age6. Estimated Gross Sales7. Average check8. Size of Bar9. Outside Dining Facilities
Nightclubs (A selection of clubs/casinos etc. in keyareas of the target market)
1. Name2. Location3. Type4. Seats/capacity5. Age6. Estimated Gross Sales7. Average check8. Size of Bar9. Music type (e.g., live/disco/combination)
HARD ROCK CAFE
STANDARD MARKET REPORT (OFFSHORE)
Executive Summary
Introduction Purpose Product Type (e.g., franchise or company owned, cafe,
hotel, casino) Overview of City/Market (e.g., set context) including
history, macroeconomic summary
Demographics (Local, City, Region SMSA, orequivalent)
Population (Trend analysis, if possible)1. Number2. Age3. Households4. Average Household Income
Economic Indicators (Trend analysis, if possible)1. Cost of Living Index (compared to national average)2. Unemployment3. Size of Workforce4. Employment by sector5. Major employers
Visitor Market Tourism/Business Visitor (Trend analysis, if possible)
1. Number2. Origins3. Length of Stay4. Average Spend5. Size of Party6. Reasons for Visit7. Frequency of Repeat Visits8. Seasonality9. Method of Transportation
Hotels (Trend analysis, if possible)1. Hotel Room Inventory2. Occupancy Rates (Annual and monthly for
seasonality)3. Room Rates4. Function Room Demand5. Recent Development6. Future Development
Convention Center (Trend analysis, if possible)1. Size2. National Ranking3. Days Booked per annum
118 CHAPTER 8 LOCATION DECISIONS
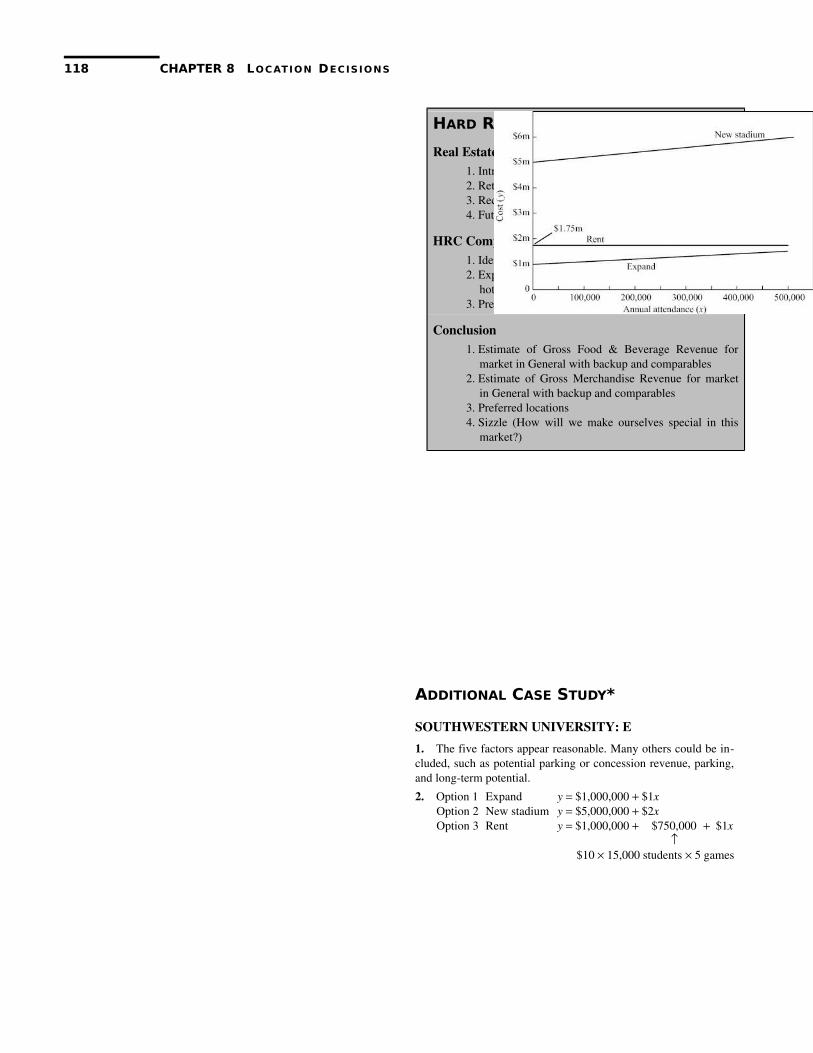
ADDITIONAL CASE STUDY*
SOUTHWESTERN UNIVERSITY: E1. The five factors appear reasonable. Many others could be included, such as potential parking or concession revenue, parking,and longterm potential.
2. Option 1 Expand y $1,000,000 $1xOption 2 New stadium y $5,000,000 $2xOption 3 Rent y $1,000,000 $750,000 $1x
$10 15,000 students 5 games
HARD ROCK REPORT (CONT’D)
Real Estate Market Overview1. Introduction2. Retail Rents3. Recent Developments4. Future Developments
HRC Comparable Market Analysis1. Identify comparable existing HRC markets2. Explain similarities (e.g. regional population, visitors,
hotel rooms, seasonality, etc.)3. Prepare city P&L spreadsheet analysis
Conclusion1. Estimate of Gross Food & Beverage Revenue for
market in General with backup and comparables2. Estimate of Gross Merchandise Revenue for market
in General with backup and comparables3. Preferred locations4. Sizzle (How will we make ourselves special in this
market?)

CHAPTER 8 LOCATION DECISIONS 119
3. Based on the survey data, rating “comfort” and “nationalimage” as 1s, “convenience” as a 2, and “cost” and “guaranteedavailability” as 4s, the results (using A = 4, B 3, C = 2, D = 1, F = 0 for grades):
Sum of Rating’s (Weighted Averages in Parentheses)Existing SiteNew Site Dallas Cowboy
Site
Students 36 (3) 21 (1.75) 35 (2.92)Boosters 34 (2.83) 23 (1.92) 47 (3.92)Faculty/staff 43 (3.58) 23 (1.92) 35 (2.92)
Students are almost neutral between the existing site and theDallas site. Boosters strongly prefer Dallas. Faculty/staff stronglyprefer the existing site. No group ranks the new site near campusas their first or second choice.
4. The expansion of the existing stadium appears preferable even at annual attendance of 500,000 fans.
5. Gardner used the factor rating method to rate the constituencyresponses. This was appropriate for evaluating the qualitativevalues. He should consider weighting the criteria as theadministration did ultimately.
WeightedCenter
Ada 1.0624Ardmore 0.4641Denton 1.824Durant 0.7372Greenville 2.3239McAlester 2.1746Norman 2.1597Paris 2.2572Sherman 1.1183Wichita Falls 2.6212Total 16.742
6Weighted Total 7,767.13
Location, Small DC in Texas
*Solution to the case that appears on our Companion Web site,www.pearsonglobaleditions.com/heizer.