Embed Size (px)
Citation preview

Quantitative Techniques inManagement
MODULE 2.2 PROBABILITY DISTRIBUTIONS
Reference Text Books1. Quantitative Methods (MBA) – LR Potti2. Business Statistics – Naval Bajpai3. Statistics for Management – Levin & Rubin
NJ Jaissy
NJ Jaissy

Module – 2.2Topics covered: Probability Distribution
Objective:Understand concept of random variable,expected variableIntroduction to probability distributions –binomial, Poisson, normal distributionsBusiness applications of probabilitydistributions
NJ Jaissy
Discrete Random VariableRandom variable is a variable that contains theoutcome of a probability experiment
Eg: in an experiment which counts the numberof customers entering a shop, the outcomecan vary from 0 to n customers.I.e. 0, 1, 2, 3, 4….. n = outcomes of theexperiment. can be represented by xThis random variable x, which is countable &finite is a DISCRETE random variable.
NJ Jaissy

Continuous Random VariableRandom variable is a variable that containsthe outcome of a probability experiment
Eg: in an experiment which counts the timetaken to buy a good in minutesI.e. 0, 1.5, 2.75, 3.2, ….. n = outcomes of theexperiment. can be represented by xThis random variable x, which can assumeany value in an interval ( 0 – n minutes) is acontinous random variable.
NJ Jaissy

Pictorial representation:0 1 2 3 4 5 6 7 8
0 1 2 3 4 5 6 7 8
X = no of people who enter a shop
X = time taken in minutes to buy a good
Discrete RandomVariable• Finite no of values• Countable ( could be
infinitely countable)• Whole numbers
Continuous RandomVariable• Can be any value in
the interval• Need not be only
whole numbers, canbe fractions
• Eg: time, temperature,distance,weight,
NJ Jaissy

Question Set 1Are the following discrete or continuous random
variables?1. X = exact amount of rain that fell yesterday
2. Y = no of baby girls born each day last year
3. W = exact weight of people in this class
4. Z = no. of heads that turn up when 2 coins aretossed
Continuous (2, 2.11, 2.01 inches ..)
Discrete ( 1, 2, 3)
Continuous (56.0321, 62.1345..)
Discrete ( 0, 1, 2)
NJ Jaissy

Probability DistributionProbability distribution defines how probabilitiesoccur for different values of the random value
Defined by a probability function f(x) or P(x)
The probability function f(x) provides theprobability for each value of the random variable
If the random variable, x is discrete, f(x) is adiscrete probability function and if x iscontinuous, f(x) is a continuous probabilityfunction
NJ Jaissy

Key point about probabilitydistributions:
Probability is always between 0 and 1therefore P(X) will be between 0 and 10<= P(x) ,= 1 for all x
Sum of all possible probabilities of arandom experiment = 1. ie Sum of allthe possible probabilities for a randomvariable = 1. Therefore sum of P(x) forall possible values of x =1
NJ Jaissy

FunctionsF(X) = 2x + 5This is a function of X, for different ‘input’
values of X, F(X) will take on different‘outputs’
X F(X)0 51 72 9
This can be drawn on a graph.Similarly we can do the same for probabilities
i.e. express Probabilities as a function
NJ Jaissy

Example of a discrete probabilitydistribution:Let x = no of heads when 2 coins are tossed:Possible options: HH, HT, TH, TT each of which
has a probability of 1/4
P(0) = P(TT) = ¼P(1) = P(TH)+P(HT) = ¼+ ¼ = ½P(2) = P(HH) = ¼
Here for each value of x, P(X) is <1Sum of all the possible values of p(x) = 1
NJ Jaissy

Example of a continous probabilitydistribution:
Assume we put a jar of water outside each month tocapture rainwater and record the exact amount ofwater that rained:Day 1: Measured approx 0.0001 cmDay 2: Measured approx 0.2567 cmDay 3: Measured approx 0.3276 cm……Day 30: Measured approx 0.567
It will be easier to say on Day 2 the amount of watercaptured was between 0.2 and 0.3
A continuous random variable can take on any value inan interval
NJ Jaissy

Pictorial representation
X
F(X)
X
F(X)
Discrete probabilitydistribution; X has distinct,countable finite values
Continuous probabilitydistribution; X can take aninfinite number of valuesthat cant’ be counted
0 1 2
0 1 2NJ Jaissy

Types of probability distributions
Discrete probability Distributions
Binomial DistributionPoisson Distribution
Continuous probability distributionsNormal Distribution
NJ Jaissy

Binomial DistributionBinomial Probability distribution used whenthere are 2 clear outcomes ( mutuallyexclusive and exhaustive) e.g.: Success &FailureThe trial results are independent of eachother.. i.e. trial 2 results do NOT depend ontrial 1 resultsThe probability of a particular outcome staysthe same through the experiment ie ifP(Success) = 0.2, then this is constant for allthe trials
NJ Jaissy

Example of Binomial Distribution
Assume a shooter shoots at a target 3times. Assume probability of hitting thetarget = 60%
a) What is the probability of getting 1 hit?b) What is the probability of getting 2 hits?Options:_ _ _
_ _ _
NJ Jaissy

Binomial distribution: Formulae:
P(X) = n C p q
For x = 0,1,2,3……n
Where p = probability of successq = probability of failure = (1-p)x = variable that takes on values 0 - nn = number of independent trials
x n-xx
NJ Jaissy

Quick question:
1. Write down the form of the binomialdistribution with parameters n = 4, p =1/3
2. Write the following in the binomialdistribution format:
Out of 10 trials of a experiment, what isthe likelihood of 2 success’ if theprobability of success = 0.7?
NJ Jaissy

Question Set 1
1. 4 ‘fair’ coins are tossed simultaneously.What is the probability of getting 2heads?
2. Probability that a shooter hits a target =1/3. Find the probability that out of 5matches, he hits the target:
a) exactly twiceb) never
3/8
80/243
32/243
NJ Jaissy

Question Set 1
3. A basket contains 20 bad oranges and80 good oranges. Three are drawn atrandom from this basket. Find theprobability that out of the three thereare
a) Exactly 2 good orangesb) Exactly 3 good orangesc) Utmost 2 good oranges
0.384
0.4880.512
NJ Jaissy

Question set 14. The incidence of occupational disease in an
industry is such that the workmen have a15 % chance of suffering from it. What isthe probability that out of six workmen, 4or more will contract the disease?
Answer:6C4 (0.15)(0.85)+ 6C5 (0.15)(0.85) +
6C6 (0.15)(0.85)
4 2 5 1
6 0
NJ Jaissy

Question Set 1
5. A box containing 100 transistors, 20 ofwhich are defective. 10 are selected forinspection. Indicate what is theprobability thata) All are defectiveb) 10 are goodc) At least one is defectived) At the most 3 are defective
NJ Jaissy

Question Set 1
6. In a binomial distribution consisting of 5independent trials, probability of 1 and 2success’ are 0.4096 and 0.2048respectively, find p
7. In a binomial distribution consisting of 5independent trials, the first and secondterms are 0.4096 and 0.2048respectively, find p
P = 1/5
P = 1/11
NJ Jaissy

Question Set 18. Harley Davidson, director of quality control for
the Kyoto Motor company is conducting hismonthly spot check of automatic transmissions.In this procedure, 10 transmissions are removedfrom the pool of components and are checkedfor manufacturing defects. Historically only 2percent of the transmission have such flaws.
i. What is the probability that Harley’s samplecontains more than 2 transmissions withmanufacturing flaws?
ii. What is the probability that none of theselected transmissions has any manufacturingflaw?
Ans: P(x>2)= 1– P(x<=2 = 0.000864
Ans: P(x=0)=0.817
NJ Jaissy

Question Set 19. Spectrum light bulb company went for mass
production of color bulbs before Diwali festival. Fivebulbs, one of each color, were packed in each of theboxes, which were to be sold as a unit item to thecustomers. Due to shortage of time, quality wascompromised and it was estimated that 20% of thebulbs were defective. If a customer purchases such abox of bulbs, what is the probability that the boxwill have:
a) No defective bulbs,b) 2 defective bulbs,c) At least one defective bulbd) At most one defective bulbe) All the bulbs are defective
Ans: P(x=0)=0.328
Ans: P(x=2)=0.205
Ans: P(x=>1)=1- P(x=0)=0.672
Ans: P(x<=1)= P(x=0,1))=0..737
Ans: P(x=5=0.00032
NJ Jaissy

Application of BinomialDistributions
Applicable in business scenarios:Manufacturing set up where there are ‘defects’ duringthe process & a random sampling is doneTrials in a medical lab – where probability of success /failure of an experimental drug is computedMarket research wherein testing is done to seewhether a sample meets a criteria: yes/no
In all these situations we try to compute theprobability from a sample wherein there are 2mutually exclusive outcomes ( ‘success / failure’)and where a relatively small sample is taken
NJ Jaissy

Depiction of a binomial distribution
1. Write the terms of the binomialdistribution for the following experiment:
There are 10 trials of a experiment, and theprobability of success = 0.7
Here x = when the experiment is a success
(Note: here we find P(x) for different values of x)( Refer Excel sheet) binomial Distribution -Sample.xlsx
NJ Jaissy

Expectation of a random variableExpectation of x = E(x) = This is the theoretical mean of a
variable ‘x’Computed by multiplying each value of ‘x’ by its probabilityConsider a random variable ‘x’ & its probability distribution:
Here expected value of the variable ‘x’ = 1.2 = MEANVariance is the square of the delta of each ‘x’ from the mean
X P(X) X * P(X)
0 0.16 0
1 0.48 0.48
2 0.36 0.72
TOTAL 1 1.2
NJ Jaissy

Mean and Variance of a BinomialDistribution
Mean (m) = np
Variance = Standard deviation = (npq)
Standard Deviation = npq
Mean = average of ‘x’Standard Deviation = the extent to which ‘x’
varies from the mean
2
NJ Jaissy

Question Set 2
1. Find the binomial distribution with mean= 3 and variance = 2
Write down the terms of the distribution
Here we are to find n, p, and write thebinomial distribution in the format:
nC p qx n-xx
NJ Jaissy

Poisson DistributionThe binomial distribution becomes a Poissondistribution when ‘n’ ( no of independent events)tends to infinity and ‘p’ ( Probability) is very small
If an event is rare, then we can count number oftimes when it does occur but not the number oftimes it does not occur. So the number of trials of theexperiment ‘n’ is not known. ( e.g: accidents on theroad).
However, if we know the ‘mean’ number ofoccurrences ( average number of accidents), we canapproximate this event using a Poisson distribution.
NJ Jaissy

Conditions for a PoissonDistribution
Events occur independently and randomly
Probability of an event ‘p’ occurring does not changethrough time.
For a Poisson distribution – we need to know only the‘mean’ of ‘x’ or the average of ‘x’
Here ‘x’ can be the number of events in a given unit oftime, distance, area or volume
(Note: Remember for a binomial distribution – weneed ‘p’ and ‘n’ to write the Formula)
NJ Jaissy

Poisson Distribution
The formula for a Poisson distribution is:
P(x) = e m where x = 0, 1, 2, …….x!
And m = mean of number of occurrences (or average number of occurrences)
-m x
NJ Jaissy

Examples of PoissonCount the no of telephone calls arriving at a telephone switch perminute ( i.e. per unit of time)
Number of customers arriving at the supermarket per hour ( i.e.per unit of time)
Count the number of defects per unit of a manufactured product
Number of bacteria per 10ml volume( i.e.. Per unit of volume)
Number of people dying due to a rare disease last year( i.e. perunit of time)
Note: all these examples – events are assumed to be independent andthe incidents are random.
NJ Jaissy

Question Set 31. If 3% of electric bulbs manufactured by a
company are defective, find the probabilitythat in a sample of 100 bulbs, exactly 5bulbs are defective
p = 3% = 0.03
Here n = 100 is very large, so we can use thePoisson distribution
M = mean = np = 100x0.03 = 3Ans: 0.1008
NJ Jaissy

Question Set 32. In a town 10 accidents took place in a
span of 100 days. Assuming that thenumber of accidents follows a Poissondistribution, find the probability thatthere will be 3 or more accidents in aday.
Hint:Average m (Per day) =10/100= 0 .1Also p (x >= 3) = 1 –P(x<3)= 1- (P(x=0,1,2)
Ans: 0.0001546NJ Jaissy

Question Set 33. A manufacturer of blades knows that 5% of this
product is defective. If he sells blades in boxes of100 and guarantees that no more than 10 bladeswill be defective, what is the probability that a boxwill fail to meet the guaranteed quality?
Hint: probability is small and n is large – use Poisson. m= np = 100* 0.05 = 5
If x>10, box will fail to meet guaranteed quality so weneed to find P(X>10)
Use P(x >10) = 1 – P(X<=10)= 1- P(X = 0,1,2,3,4,5,6,7,8,9,10)
Ans:0.013695NJ Jaissy

Question Set 34. Out of 500 items selected for inspection,
0.2% are found to be defective. Find howmany lots will contain exactly no defectiveif there are 1000 lots.
Hint: n is large – so use the PoissonP = 0.2% m = np = 500*0.2% = 1P(x = 0) = ?? This is the probability per lot.Multiply by total N ( = 1000) to get total no.
of defectives.Ans: 367
NJ Jaissy

Theoretical FrequencyTheoretical Frequency = N * probabilityWhere N = total population considered
(This is called ‘theoretical because we are estimating itbased on probability – it is not based on actual data)
I.e. If x is the number of defectsIf x = 5 and P(x=5) = 0.01 then in a 1000 lot size, the
number of times we will get 5 defects = N*P= 1000 * 0.01 = 10
Hint: Use this formula when you have to find number orfrequency of a defect
NJ Jaissy

Question Set 45. One fifth per cent of the blades produced by a blade
manufacturing factory turn out to be defective. The blades aresupplied in packets of 10. Use Poisson distribution to calculatethe approximate number of packets in a consignment of 100,000containing:
a. No defective,
b. One defective
c. Two defectives
Given: -0.02 = 0.9802 .
Hint: m = np = 10*1/500 = 0.02. a) Find P(0) and multiply by 100,000.
Do the same for b) P(1) and c) P(2)
Using the Poisson distribution, find P(0), P(1), P(2). Multiply by N=100, 000 to get number of defectives.
e
Ans: 98020
Ans: 1960Ans: 20
NJ Jaissy
Fitting a ‘ probability distribution’If data of ‘x’ is already available from actual
events, then we can use this to ‘project’ thelikely probabilities in future for differentvalues of ‘x’.I.e: We can therefore ‘fit’ a probabilitydistribution to this dataEssentially – we need to find the ‘key’elements of the probability distribution ( eg:‘n’ and ‘p’ for Binomial and ‘m’ for PoissonWe then write out the probabilitydistribution for different values of x
NJ Jaissy

Fitting a binomial distribution
Key elements needed for a binomialdistribution: n and p where
n = no of independent trials ( or max valueof trials possible)P = probability of x occurring
Question: you are given a table of dataof actual occurrences ( frequency) &asked to fit a binomial distribution
NJ Jaissy

Fitting a binomial distributionFind the mean of the frequency distribution.This will be the mean of the Binomialdistribution.If we know how many instances we can getan outcome, or no. of independent trials, –we know ‘n’ or the max no. of trials.Compute n and P.Write down the terms of the binomialdistribution.Multiply this by the number of times theexperiment is to be repeated.
NJ Jaissy

Fitting a binomial distribution:ExampleThe following data show the number of defective parts in 80sets of a product. Fit a binomial distribution of this data andfind the expected frequencies. X = no. of defectivesX: 0 1 2 3 4 5F: 6 20 28 12 8 6
a) Step 1 – Find ‘n’ and ‘p’. Here ‘n’ = 5 ( no of trials / samplesize). We can find the mean = np
b) Fitting a binomial distribution = writing innCx p q format
c) Expected frequencies = N * P(x). This is the projectedtimes you would get a defect if you were to look at asample of size N
x n-x
NJ Jaissy
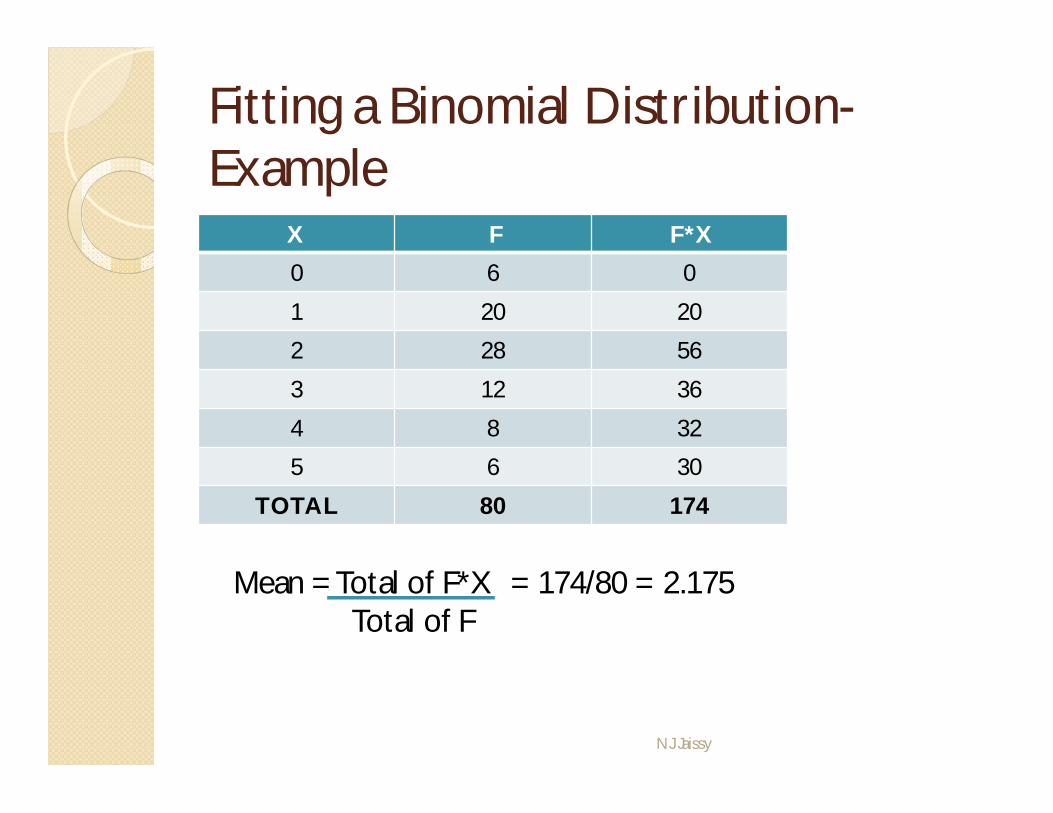
Fitting a Binomial Distribution-Example
X F F*X
0 6 0
1 20 20
2 28 56
3 12 36
4 8 32
5 6 30
TOTAL 80 174
Mean = Total of F*X = 174/80 = 2.175Total of F
NJ Jaissy

Fitting a Binomial Distribution:Example
But np = mean . Therefore 5 * p = 2.175So p = 0.435 and q = 1-p = 0.565
So the binomial distribution = n C p q= 5Cx ( 0.435) (0.565)
Write out the terms and multiply by the‘population’, N = 80 to get expectedfrequency for this sample set
x n-x
x 5-x
NJ Jaissy

Expected frequency: Binomialdistribution
X F F*X P(X) N* P(X)0 6 0 5C0 (0.435)^0 ( 0.565)^ 5 5
1 20 20 5C1 (0.435)^1 ( 0.565)^ 4 18
2 28 56 5C2 (0.435)^2 ( 0.565)^ 3 27
3 12 36 5C3 (0.435)^3 ( 0.565)^ 2 21
4 8 32 5C4 (0.435)^4 ( 0.565)^ 1 6
5 6 30 5C5 (0.435)^5 ( 0.565)^ 0 7
80 174
P(X) = 5Cx ( 0.435) (0.565)x 5-x
N = 80 (total size)x = no of defectivesn = no of trials
NJ Jaissy

Fitting a Poisson distribution
Key element needed for a Poissondistribution = m
m = mean
Question: you are given a table of dataof actual occurrences ( frequency) &asked to fit a Poisson distribution
NJ Jaissy

Fitting a Poisson distributionFind the mean of the frequency distribution.This will be the mean of the Poissondistribution.
Write down the Poisson distributionformula
This is the ‘fit’ of the probability distribution.
If you are asked for ‘expected frequencies’ –write down the terms of the distribution
NJ Jaissy

Fitting a Poisson distribution:Examplea) Fit a Poisson distribution to this data and
find the expected frequencies.X: 0 1 2 3 4F: 123 59 14 3 1
a) Step 1 – Find ‘m’.b) Write out the Poisson distribution – this is
the ‘fitting’c) Find the expected frequencies by
multiplying P(X) * N ( = total sample)
NJ Jaissy

Fitting a Poisson Distribution-Example
X F F*X
0 123 0
1 59 59
2 14 28
3 3 9
4 1 4
TOTAL 200 100
Mean = Total of F*X = 100/200 = 0.5Total of F
NJ Jaissy

Fitting a Poisson Distribution:Example
m = 0.5Fill out the Poisson distribution =
= P(x) = e m where x = 0, 1, 2, …….x!
P(X) = e (0.5) = Fitting of the Poissonx! distribution
-m x
-0.5 x
NJ Jaissy

Fitting a Poisson distribution –example : Expected Frequencies
X F F * X P(X) N* P(X)0 123 0 121
1 59 59 61
2 14 28 15
3 3 9 3
4 1 4 0
200 100
P(x) = e 0.5x!
-.5 x
Theoretical or Expected Frequency = P(x) * N
N= 200
Note: If I buy a lot of 1000 pieces from this factory – how many pieces willhave 2 defectives? This is the same as calculating theoretical frequency atN = 1000 * P(x = 2) NJ Jaissy

Normal DistributionBinomial & Poisson Distributions are usefulfor estimating probabilities of discreterandom valuesThis is the most commonly used probabilitydistribution in statistics & applicable to manyhuman phenomenon: IQ, grades, weight etcFor ‘continuous’ random variables – we usethe normal distributionThe continuous random value ‘x’ willtypically take a range eg: 1<x<2
NJ Jaissy

Key terms in a Normal Distribution
Mean x
P(x) orF(x)
0.50.5
Standard Deviation =Mean =
22
Z = ( x – Mean)/Standard Deviation= (X – )
NJ Jaissy

Normal Distribution:Question Set 51. The variable X follows a Normal
Distribution with mean = 45 andStandard Deviation = 10. Find theprobability that
i) X > 60ii) 40 < x < 56
Hint: Find z and then use the table (Remember area for ‘Z’ starts from themiddle!)
Ans 0.0668
Ans 0.5558
NJ Jaissy

Normal Distribution:Question Set 52. The scores of students in a test follow
Normal Distribution with mean = 80and SD = 15. A sample of 1000 studentshas been drawn from the population.Find:
a) Approximate number of studentsscoring between 65 and 95
b) Probability that a randomly chosenstudent has scores greater than 100
Ans 683
Ans 0.0918NJ Jaissy

Question Set 62. The number of column inches of classified
advertisements appearing on Mondays in acertain daily newspaper is normally distributedwith population mean 320 and populationstandard deviation 20 inches
a) For a randomly chosen Monday, what is theprobability there will be less than 340 columninches of classified advertisement?
a) For a randomly chosen Monday, what is theprobability there will be between 280 and 360column inches of classified advertisement?
P = 0.8413
P = 0.9545NJ Jaissy

Question Set 62. If area under the normal curve from the
mean = 0.4750, what is the value of z?
3. If area under the normal curve from themean = 0.4793, what is the value of z?
4. If P(X) < Z = 0.8315, what is the value of Zon the normal distribution?
5. If P(X) > Z = 0.281, what is the value of Zon the normal distribution?
Z = 1.96
Z = 0.96
Z = 0.58
Z = 2.4
NJ Jaissy

Question Set 6
5. If P(X) > Z = 0.02 in a normaldistribution with mean = 62 and SD =12, what is the value of X?
X = 86.6
NJ Jaissy

Question Set 6
4. The wage distribution of the worker in afactory is normal with mean Rs 400 andSD = 50. If the wage of 40 workers beless than Rs 350, what is the totalnumber of workers in the factory?
252
NJ Jaissy

Question Set 6
5) Assume the mean height of soldiers tobe 68.22 inches with a variance of 10.8inches. How many soldiers in a regimentof 1000 would you expect to be over sixfeet tall? ( Note: 1 foot = 12 inches)
363
NJ Jaissy

Question Set 6: NormalDistribution1. A training program is designed to upgrade the skills of
supervisors. A study of past participants shows thatthe mean length of time spent on the program is 500hours and that this normally distributed randomvariable has a standard deviation of 100 hours.
a) What is the probability that a person selected at random willrequire more than 500 hours to complete the program
b) What is the probability that a candidate selected at random willtake between 500 and 600 hours to complete the trainingprogram
c) What is the probability that a candidate selected at random willtake more than 750 hours to complete the program
d) What is the probability that a candidate selected at random willrequire fewer than 590 hours to complete the program.
P = 0.5
P = 0.3413
P = 0.00621
P = 0.8159NJ Jaissy

Question Set 6
3. The weekly wages of 1000 workmen arenormally distributed around a mean ofRs 700 and with a standard deviation ofRs 50. Estimate the number of workerswhose weekly wages will be
a) Between Rs 700 and Rs 720b) Between Rs 690 and Rs 720c) More than Rs 750d) Less than Rs 630
155
235
159
80
NJ Jaissy

Question Set 6
Find the mean and SD of marks in anexamination where 44% of the candidatesobtained marks below 55 and 6% getabove 80 marks Mean = 57.19
SD = 14.62
NJ Jaissy