Embed Size (px)
DESCRIPTION
On-the-job OJT narrative report of an intern in BS Chemistry profession. Includes the analysis conducted, and the theories behind such, and some personal comments from the author.
Citation preview
Central Mindanao UniversityCollege of Arts and Sciences
Department of ChemistryUniversity Town, Musuan, Maramag, Bukidnon
A Narrative Report onSUPERVISED FIELD EXPERIENCE (Chem 98)
atMindanao State University-Iligan Institute of Technology
Chemistry Department
Presented to:
MR. LEONAR JUN R.GABIANA
OJT Coordinator
In Partial Fulfillment of the Requirements forThe Degree of Bachelor of Science in Chemistry
Presented by:Renz Aldaine Soliven Engada
June 9, 2014
Introduction
Effort and hardwork, the raw ingredients of success are what propels us mid-river, crossing ashore, and reaching the satiating glory of what might be called the ‘fruit’ of success. I may have used too much allusion in the prior statement, but truly, same can be said for us, students who strived a month-long endeavor to traverse the theoretical academe to the rigors of application and practical industries.
Supervised Field Experience/On-the-job training (OJT) is a form of training taking place in a normal working situation. On the job training are part of a college curriculum that aims to train and orient students about the work and their future career. OJT is very important not only to teach students their chosen career but to show students the reality about working.
OJT also helps us students to familiarize ourselves with the job-related equipments and gain direct experience to an approved standard. As we are supervised, our confidence level is boosted and we learn to perform jobs right. We understand the responsibilities involved in a job, how to interact with Senior Employers, how to work as a group.
Training increases the skill and ability of the employees to perform specific task. Training develop and improve certain phases of an individual's attitudes, discipline, behavior or knowledge to make him either more effective on his job or better qualified for his future job which the training endeavors develop. It is also a way to improve employees' attitude towards his job, his fellow workers, his supervisor and the firm as a whole. OJT broadens and sharpens the students' professional skills. It is a way of applying all the theories that we learned in lower management which is use advantageously in the actual business world. As a requirement in our school, I had applied for an OJT and finished the 240 hours of training. I have learned a lot from it. I guess it somehow boost my morale as well. I know in my heart that I can use this experience for a much higher job in the future.
DESCRIPTION OF THE PLACE OF PRACTICUM
MSU-Iligan Institute of Technology is a university in Andres Bonifacio Ave.,Tibanga, Iligan City, Lanao del Norte, Philippines. Philippines ranking #7 in the Philippines top universities. It’s motto is ”Quality Education for a Better Mindanao”. It was established in July 12, 1968. It is a Public, State University.
The Mindanao State University-Iligan Institute of Technology (MSU-IIT) is an external unit and one of the ten campuses of the Mindanao State University System. Established on July 12, 1968 as provided for by Republic Act (RA) 5363, the institute has continually provided quality education to thousands of students from almost everywhere in the Philippines.
The MSU-IIT as a world-class institution of higher learning renowned for its excellence in science and technology and for its commitment to the holistic development of the individual and society, offer students a wide array of more than 115 academic programs, which include 43 graduate programs in a variety of fields including education, business, arts and humanities, engineering, information technology, thenatural sciences, and mathematics. The students are given opportunities to collaborate with more
than 400 distinguished full-time faculty members passionate about teaching,research, extension, and community development. For these, MSU-IIT has received numerous institutional awards.
Based on the standards of the Commission on Higher Education (CHED), MSU-IIT is a Center of Excellence in Mathematics and Chemistry, Center of Development in Physics and Biology, Center of Development for Excellence in Information and Communication Technology, Center of Development in Ceramics Engineering, Civil Engineering, Electrical Engineering, Electronics and Communications Engineering, Mechanical Engineering, and Material Science Engineering. They are also the Zonal Research Center for Regions XII, IX, & ARMM.
MSU-IIT is also known as the Information and Communication Technology Learning Hub for Northern Mindanao and the Virtual Center for Technology Innovation - Microelectronics based on the standards of the Department of Science and Technology (excerpt from http://www.msuiit.edu.ph/ , the school’s official website).The MSU-IIT College of Science and Mathematics (CSM), where the Department of Chemistry constitutes, is one of the eight colleges of the university. CSM is presently under the management of Dr. Ferdinand Hamil. As one of the primary college of the institution, CSM has the distinction of being designated by the Commission of Higher Education (CHED) as a Center of Excellence in all four departments of the College: Biology, Chemistry, Mathematics and Physics.
The Department of Chemistry of the CSM, is located at the top floor of the building. The laboratory room 311 is our working area for wet analysis whilst spectrophotometric and other analysis using instruments are carried out in the instrument room. The practicum started on April 21 and ended last May 30, 2014, duties during weekdays only from 8:00 am until 5:00 pm.
Department of Chemistry
Vision
A globally competitive institution committed to excellence in science and technology for sustainable development of Southern Philippines
Missions
To produce highly competent, humanistic and nationalistic graduates, through the offering of quality and relevant programs which are geared towards industrial and socio-economic development. To engage in basic and applied research and provide effective transfer of technology that will spur economic activity and development. To instill the values of efficiency, loyalty, productivity, commitment and dedication to service, moral integrity, love of country, and self-reliance among all constituents.
Students come to MSU-IIT to fulfill their dreams. They choose to stay in MSU-IIT because they know that it is the ticket to their dreams. Not just that, MSU-IIT is so inviting. The students are delighted with the warmth of welcome they receive, the ease with which they become part of the academic
community, and the friendships they build there. At the end of the day, it makes us proud even more to know that we are just ojt students here because we feel at home. Indeed, it’s a home away from home.
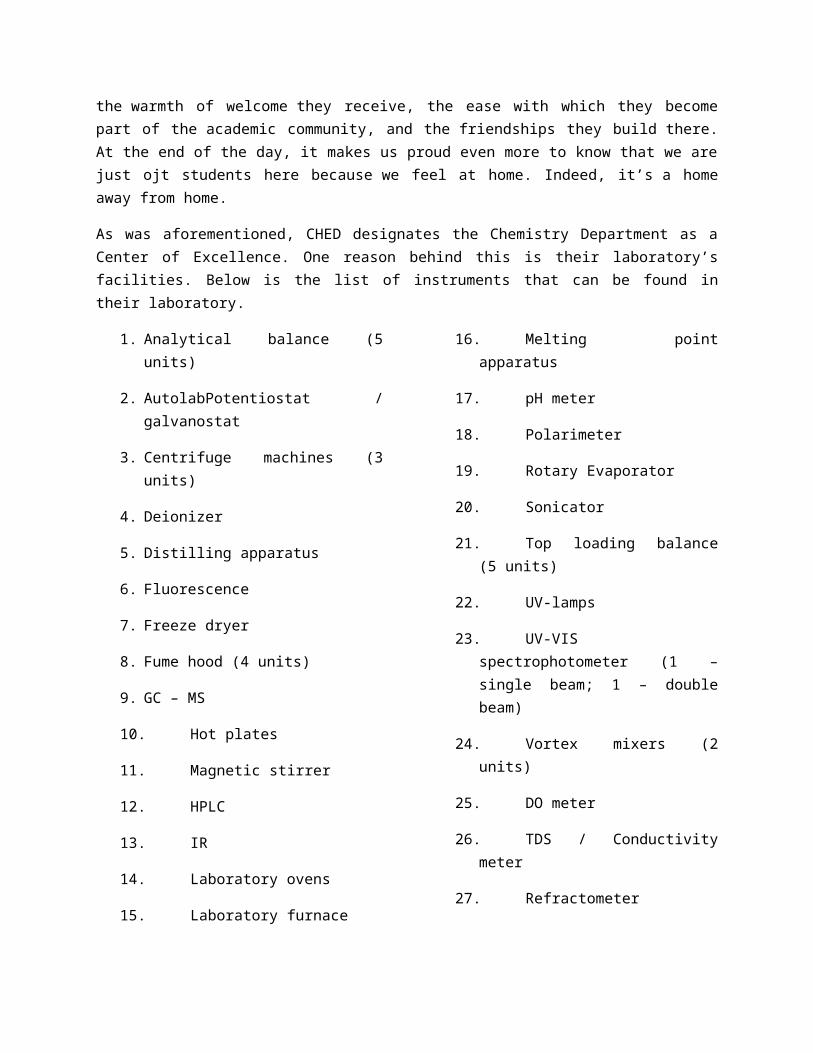
As was aforementioned, CHED designates the Chemistry Department as a Center of Excellence. One reason behind this is their laboratory’s facilities. Below is the list of instruments that can be found in their laboratory.
1. Analytical balance (5 units)
2. AutolabPotentiostat / galvanostat
3. Centrifuge machines (3 units)
4. Deionizer
5. Distilling apparatus
6. Fluorescence
7. Freeze dryer
8. Fume hood (4 units)
9. GC – MS
10. Hot plates
11. Magnetic stirrer
12. HPLC
13. IR
14. Laboratory ovens
15. Laboratory furnace
16. Melting point apparatus
17. pH meter
18. Polarimeter
19. Rotary Evaporator
20. Sonicator
21. Top loading balance (5 units)
22. UV-lamps
23. UV-VIS spectrophotometer (1 – single beam; 1 – double beam)
24. Vortex mixers (2 units)
25. DO meter
26. TDS / Conductivity meter
27. Refractometer
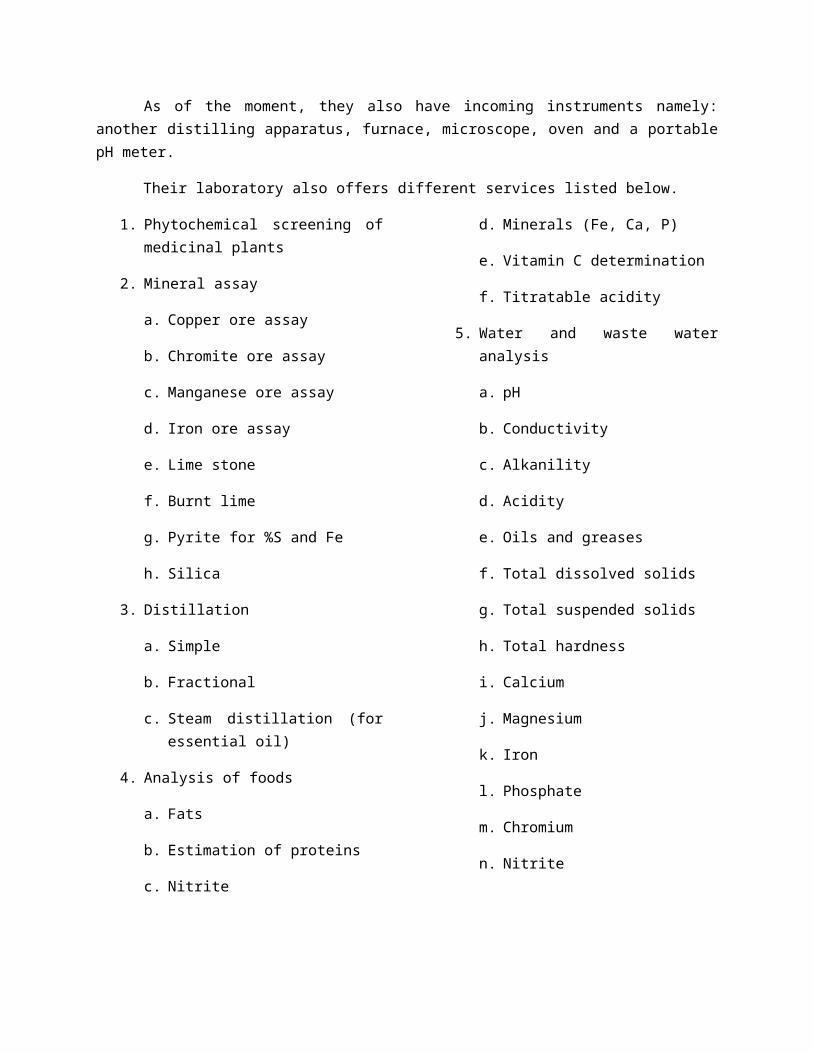
As of the moment, they also have incoming instruments namely: another distilling apparatus, furnace, microscope, oven and a portable pH meter.
Their laboratory also offers different services listed below.
1. Phytochemical screening of medicinal plants
2. Mineral assay
a. Copper ore assay
b. Chromite ore assay
c. Manganese ore assay
d. Iron ore assay
e. Lime stone
f. Burnt lime
g. Pyrite for %S and Fe
h. Silica
3. Distillation
a. Simple
b. Fractional
c. Steam distillation (for essential oil)
4. Analysis of foods
a. Fats
b. Estimation of proteins
c. Nitrite
d. Minerals (Fe, Ca, P)
e. Vitamin C determination
f. Titratable acidity
5. Water and waste water analysis
a. pH
b. Conductivity
c. Alkanility
d. Acidity
e. Oils and greases
f. Total dissolved solids
g. Total suspended solids
h. Total hardness
i. Calcium
j. Magnesium
k. Iron
l. Phosphate
m. Chromium
n. Nitrite
Other services depend on the availability of chemicals and instruments. These offered services serve as the department’s income generating program.
ANALYSES CONDUCTED
A. DETERMINATION OF AVAILABLE LIME (AS CaO) BY SUGAR METHOD
Theoretical Background:
Lime is an important industrial chemical used widely in the steel manufacturing and water treatment industries. One of the major procedures employed to control the quality of lime during its production process is the so-called available lime (Av CaO) method. This method measures the theoretical amount of lime available for neutralisation purposes, and also gives an indication of the degree of conversion from limestone to lime. It entails the dissolution of the material in a sugar solution, followed by subsequent titration of the resultant solution with a standardised acid. Available lime is an arbitrary measure, describing the content of such calcium oxide that enters into reaction under the conditions specified. The result is expressed as a percentage of the mass of the sample as taken.
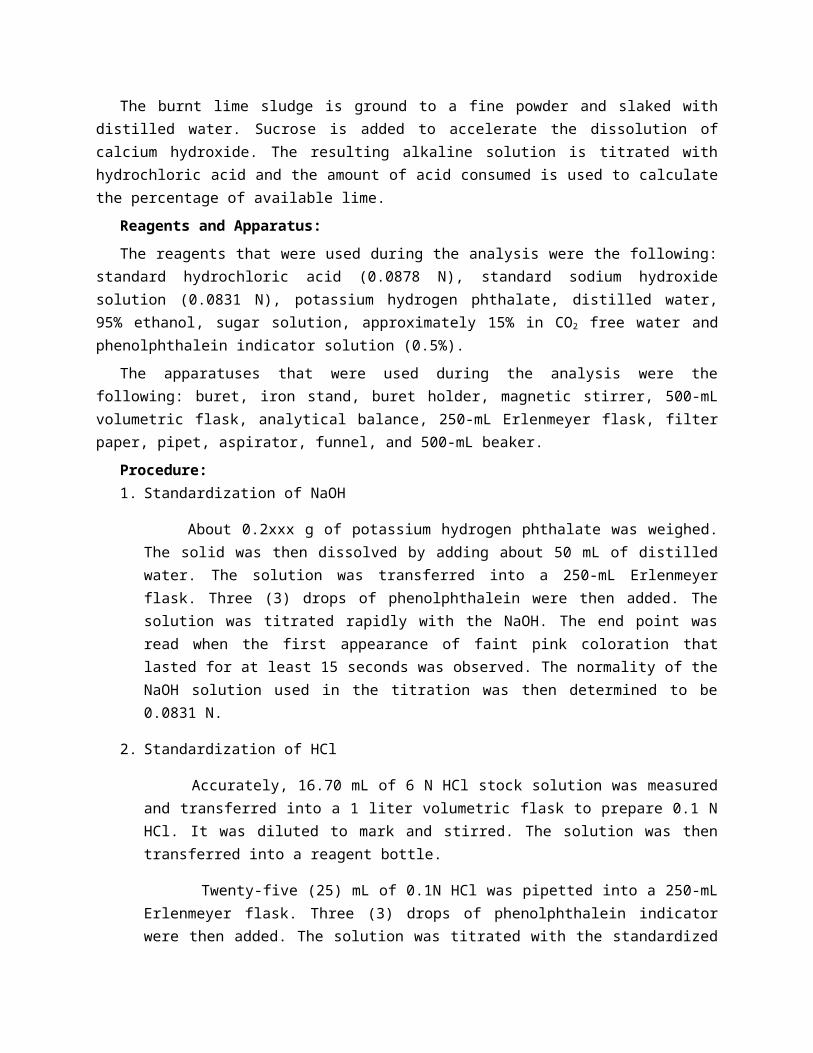
The burnt lime sludge is ground to a fine powder and slaked with distilled water. Sucrose is added to accelerate the dissolution of calcium hydroxide. The resulting alkaline solution is titrated with hydrochloric acid and the amount of acid consumed is used to calculate the percentage of available lime.
Reagents and Apparatus:
The reagents that were used during the analysis were the following: standard hydrochloric acid (0.0878 N), standard sodium hydroxide solution (0.0831 N), potassium hydrogen phthalate, distilled water, 95% ethanol, sugar solution, approximately 15% in CO2 free water and phenolphthalein indicator solution (0.5%).
The apparatuses that were used during the analysis were the following: buret, iron stand, buret holder, magnetic stirrer, 500-mL volumetric flask, analytical balance, 250-mL Erlenmeyer flask, filter paper, pipet, aspirator, funnel, and 500-mL beaker.
Procedure:1. Standardization of NaOH
About 0.2xxx g of potassium hydrogen phthalate was weighed. The solid was then dissolved by adding about 50 mL of distilled water. The solution was transferred into a 250-mL Erlenmeyer flask. Three (3) drops of phenolphthalein were then added. The solution was titrated rapidly with the NaOH. The end point was read when the first appearance of faint pink coloration that lasted for at least 15 seconds was observed. The normality of the NaOH solution used in the titration was then determined to be 0.0831 N.
2. Standardization of HCl
Accurately, 16.70 mL of 6 N HCl stock solution was measured and transferred into a 1 liter volumetric flask to prepare 0.1 N HCl. It was diluted to mark and stirred. The solution was then transferred into a reagent bottle.
Twenty-five (25) mL of 0.1N HCl was pipetted into a 250-mL Erlenmeyer flask. Three (3) drops of phenolphthalein indicator were then added. The solution was titrated with the standardized NaOH solution with the same end point as in part 1. The normality of the HCl solution was then calculated to be 0.0878 N.
3. Preparation of 15% sugar solution
One hundred fifty (150) grams of sucrose was weighed and dissolved in 800 mL distilled water. The solution was then diluted to 1 L. Another 1 L of sugar solution was prepared using equal amount of sucrose.
4. Preparation of Phenolphthalein indicator (0.5%)
In a 100 mL of ethyl alcohol, 0.5 g of phenolphthalein was dissolved.
5. Determination of Available Lime
About 1 g of the finely powdered sample was weighed accurately to the nearest 1 mg. It was moistened with distilled water just enough to make the sample wet. The solution was transferred into a 500 mL volumetric flask. Four hundred (400) mL of sugar solution was then added and it was stirred for 3 hours using a magnetic stirrer. It was diluted to the mark.
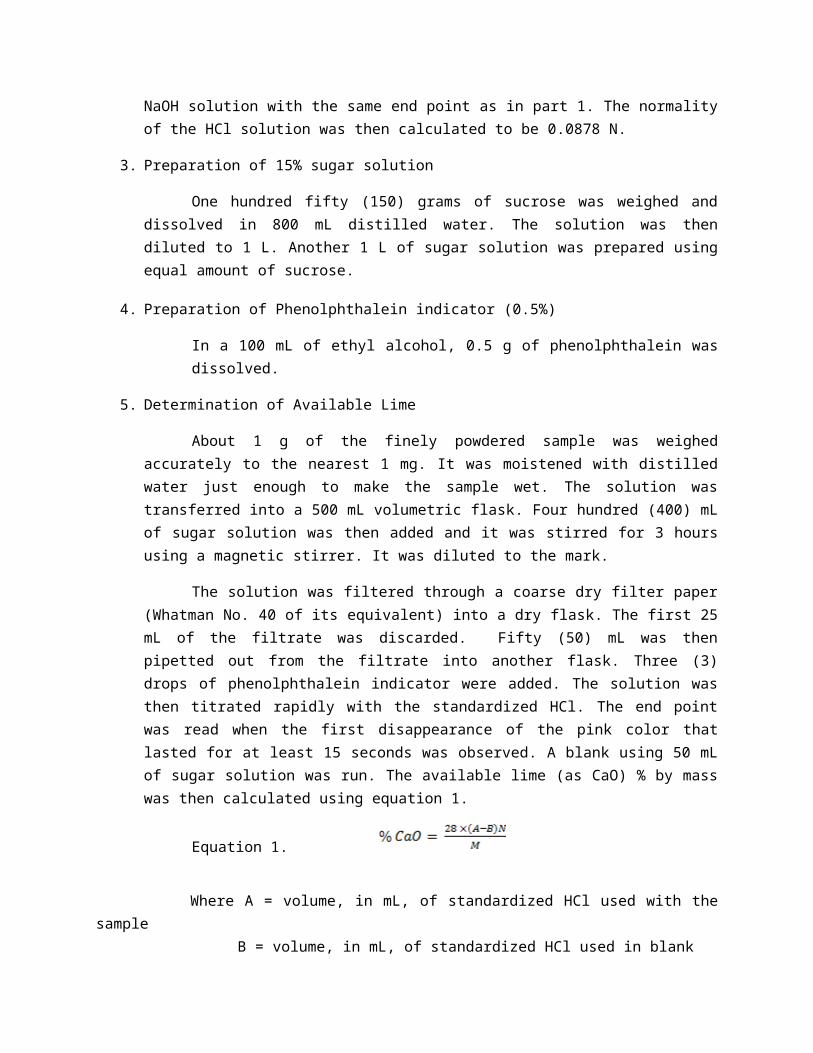
The solution was filtered through a coarse dry filter paper (Whatman No. 40 of its equivalent) into a dry flask. The first 25 mL of the filtrate was discarded. Fifty (50) mL was then pipetted out from the filtrate into another flask. Three (3) drops of phenolphthalein indicator were added. The solution was then titrated rapidly with the standardized HCl. The end point was read when the first disappearance of the pink color that lasted for at least 15 seconds was observed. A blank using 50 mL of sugar solution was run. The available lime (as CaO) % by mass was then calculated using equation 1.
Equation 1.
Where A = volume, in mL, of standardized HCl used with the sampleB = volume, in mL, of standardized HCl used in blankN = normality of standardized HClM = mass, in g, of the material taken for the test
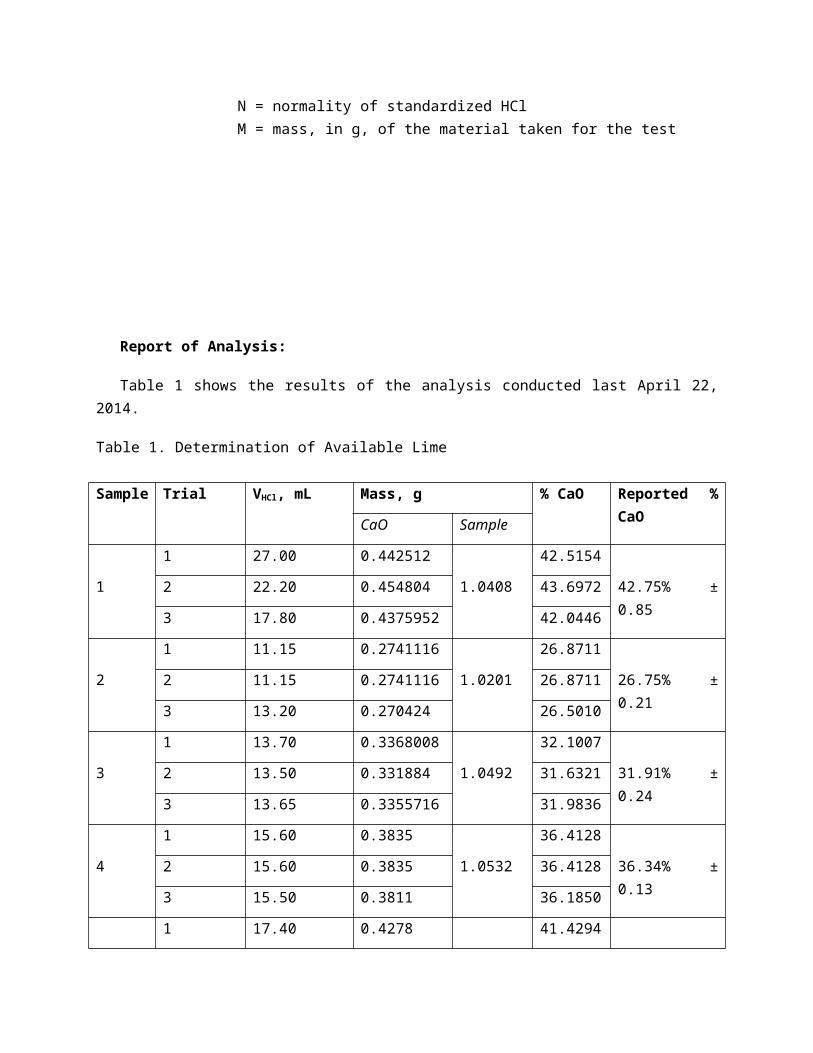
Report of Analysis:
Table 1 shows the results of the analysis conducted last April 22, 2014.
Table 1. Determination of Available Lime
Sample Trial VHCl, mL Mass, g % CaO Reported % CaO
CaO Sample
1
1 27.00 0.442512
1.0408
42.5154
42.75% ± 0.852 22.20 0.454804 43.6972
3 17.80 0.4375952 42.0446
2
1 11.15 0.2741116
1.0201
26.8711
26.75% ± 0.212 11.15 0.2741116 26.8711
3 13.20 0.270424 26.5010
3
1 13.70 0.3368008
1.0492
32.1007
31.91% ± 0.242 13.50 0.331884 31.6321
3 13.65 0.3355716 31.9836
4
1 15.60 0.3835
1.0532
36.4128
36.34% ± 0.132 15.60 0.3835 36.4128
3 15.50 0.3811 36.1850
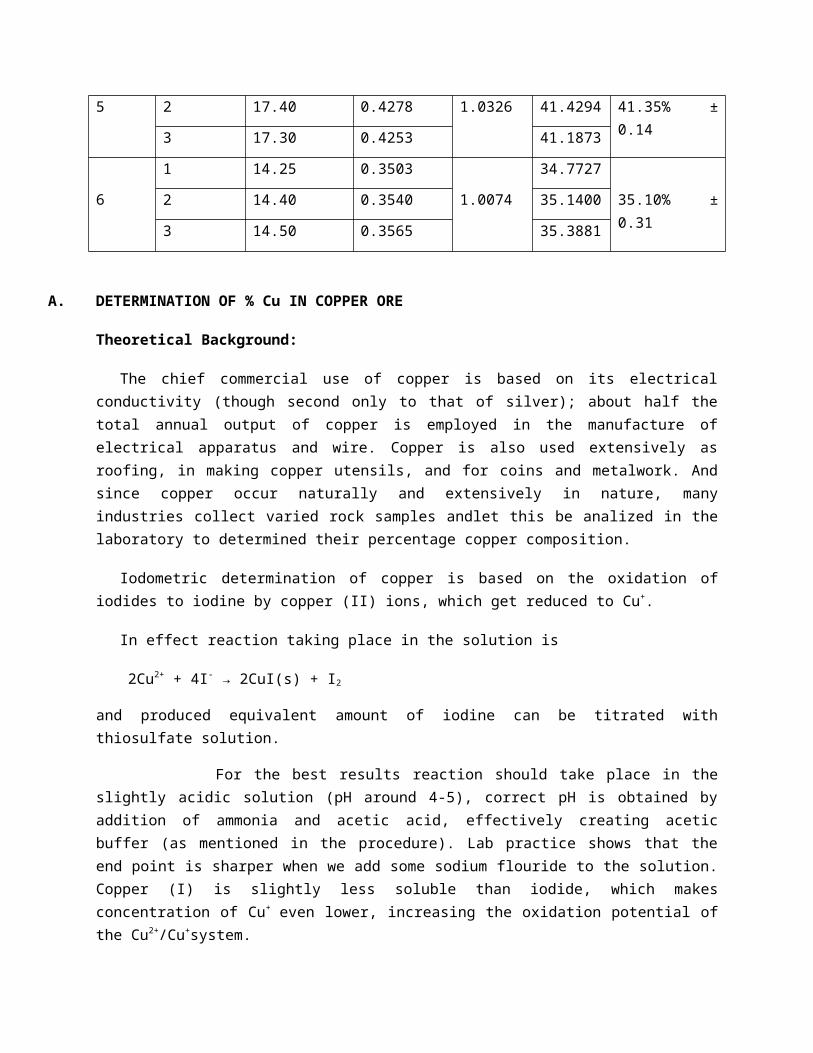
5
1 17.40 0.4278
1.0326
41.4294
41.35% ± 0.142 17.40 0.4278 41.4294
3 17.30 0.4253 41.1873
6
1 14.25 0.3503
1.0074
34.7727
35.10% ± 0.312 14.40 0.3540 35.1400
3 14.50 0.3565 35.3881
A. DETERMINATION OF % Cu IN COPPER ORE
Theoretical Background:
The chief commercial use of copper is based on its electrical conductivity (though second only to that of silver); about half the total annual output of copper is employed in the manufacture of electrical apparatus and wire. Copper is also used extensively as roofing, in making copper utensils, and for coins and metalwork. And since copper occur naturally and extensively in nature, many industries collect varied rock samples andlet this be analized in the laboratory to determined their percentage copper composition.
Iodometric determination of copper is based on the oxidation of iodides to iodine by copper (II) ions, which get reduced to Cu+.
In effect reaction taking place in the solution is
2Cu2+ + 4I- → 2CuI(s) + I2
and produced equivalent amount of iodine can be titrated with thiosulfate solution.
For the best results reaction should take place in the slightly acidic solution (pH around 4-5), correct pH is obtained by addition of ammonia and acetic acid, effectively creating acetic buffer (as mentioned in the procedure). Lab practice shows that the end point is sharper when we add some sodium flouride to the solution. Copper (I) is slightly less soluble than iodide, which makes concentration of Cu+ even lower, increasing the oxidation potential of the Cu2+/Cu+system.
Solution should be free of other substances that can oxidize iodides to iodine (for example Fe 3+ or nitrates).
The Reaction
As it was already explained, first reaction taking place is:
2Cu2+ + 4I- → 2CuI(s) + I2
This is followed during titration by the reaction of the iodine with the thiosulfate:
2S2O32- + I2 → S4O6
2- + 2I-
To detect titration end point we had used a standard indicator for iodine titrations - starch. We started with a solution containing relatively high concentration of iodine, so indicator has to be added close to the end point.
Reagents and Apparatus:
The reagents that were used during the analysis were the following: conc. Nitric acid, 6N ammonium hydroxide, bromine in water (5% in water), standard sodium thiosulfate (0.1007 N), 6N acetic acid, 30% (m/v) KI solution, 0.5% starch indicator, distilled water and solid sodium fluoride.
Furthermore, the apparatuses that were used during the analysis were the following: analytical balance, pipet, aspirator, 400 mL beaker, graduated cylinder, buret, iron stand, buret holder, dropper, 250 mL Erlenmeyer flask and hot plate.
Procedure:
1. Standardization of Sodium Thiosulfate against Potassium Iodate
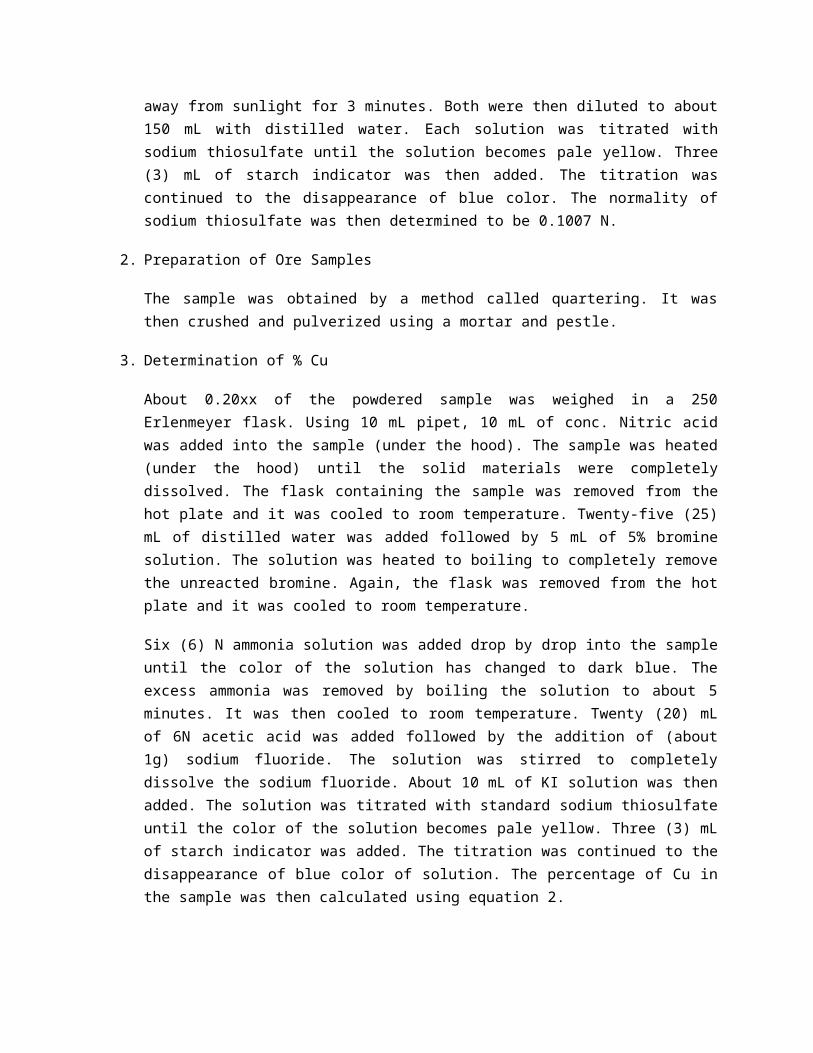
To the nearest 0.1 mg, duplicate portions 0.10xx g of pure, dry KIO3 were weighed from weighing bottle into 400 mL beakers. The weighed materials were dissolved in 50 mL of distilled water. Ten (10) mL of KI solution was added to each solution. Twenty (20) mL of 6N H2SO4 was then added. The mixtures were allowed to stand away from sunlight for 3 minutes. Both were then diluted to about 150 mL with distilled water. Each solution was titrated with sodium thiosulfate until the solution becomes pale yellow. Three (3) mL of starch indicator was then added. The titration was continued to the disappearance of blue color. The normality of sodium thiosulfate was then determined to be 0.1007 N.
2. Preparation of Ore Samples
The sample was obtained by a method called quartering. It was then crushed and pulverized using a mortar and pestle.
3. Determination of % Cu
About 0.20xx of the powdered sample was weighed in a 250 Erlenmeyer flask. Using 10 mL pipet, 10 mL of conc. Nitric acid was added into the sample (under the hood). The sample was heated (under the hood) until the solid materials were completely dissolved. The flask containing the sample was removed from the hot plate and it was cooled to room temperature. Twenty-five (25) mL of distilled water was added followed by 5 mL of 5% bromine solution. The solution was heated to boiling to completely remove the unreacted bromine. Again, the flask was removed from the hot plate and it was cooled to room temperature.
Six (6) N ammonia solution was added drop by drop into the sample until the color of the solution has changed to dark blue. The excess ammonia was removed by boiling the solution to about 5 minutes. It was then cooled to room temperature. Twenty (20) mL of 6N acetic acid was added followed by the addition of (about 1g) sodium fluoride. The solution was stirred to completely dissolve the sodium fluoride. About 10 mL of KI solution was then added. The solution was titrated with standard sodium thiosulfate until the color of the solution becomes pale yellow. Three (3) mL of starch indicator was added. The titration was continued to the disappearance of blue color of solution. The percentage of Cu in the sample was then calculated using equation 2.
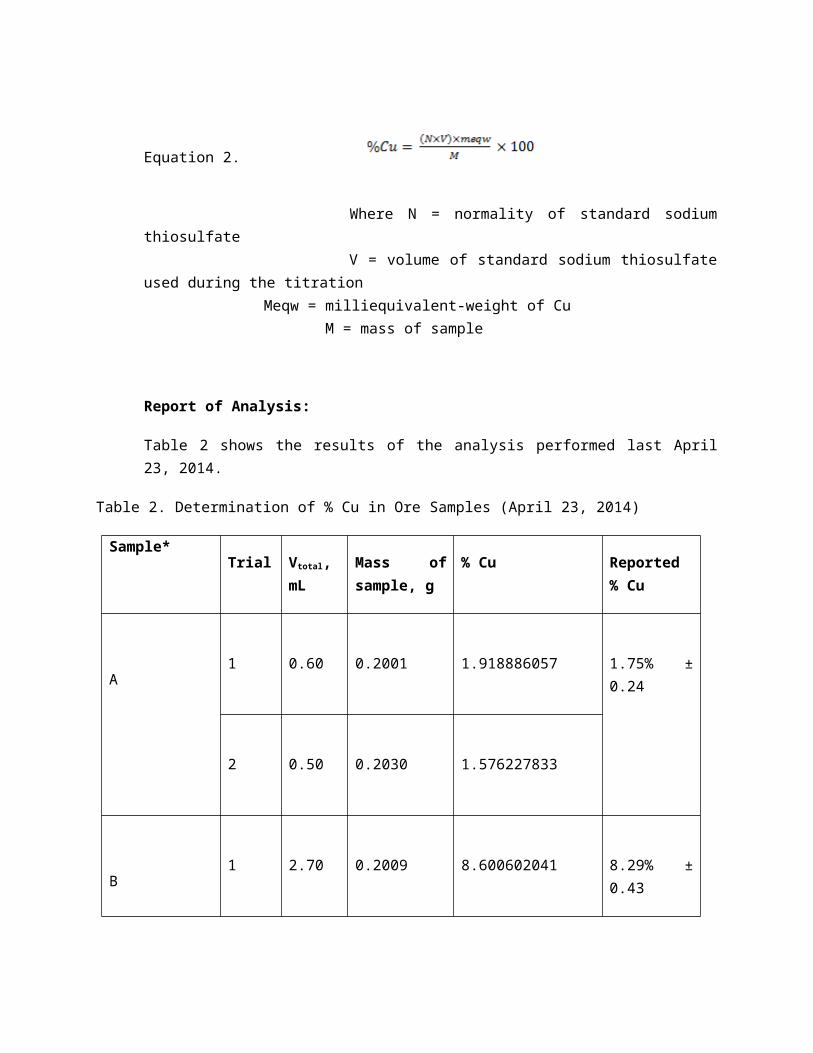
Equation 2.
Where N = normality of standard sodium thiosulfate V = volume of standard sodium thiosulfate used during the titration Meqw = milliequivalent-weight of Cu M = mass of sample
Report of Analysis:
Table 2 shows the results of the analysis performed last April 23, 2014.
Table 2. Determination of % Cu in Ore Samples (April 23, 2014)
Sample*Trial Vtotal, mL Mass of sam-
ple, g% Cu Reported %
Cu
A1 0.60 0.2001 1.918886057 1.75% ± 0.24
2 0.50 0.2030 1.576227833
B1 2.70 0.2009 8.600602041 8.29% ± 0.43
2 2.50 0.2003 7.987375187
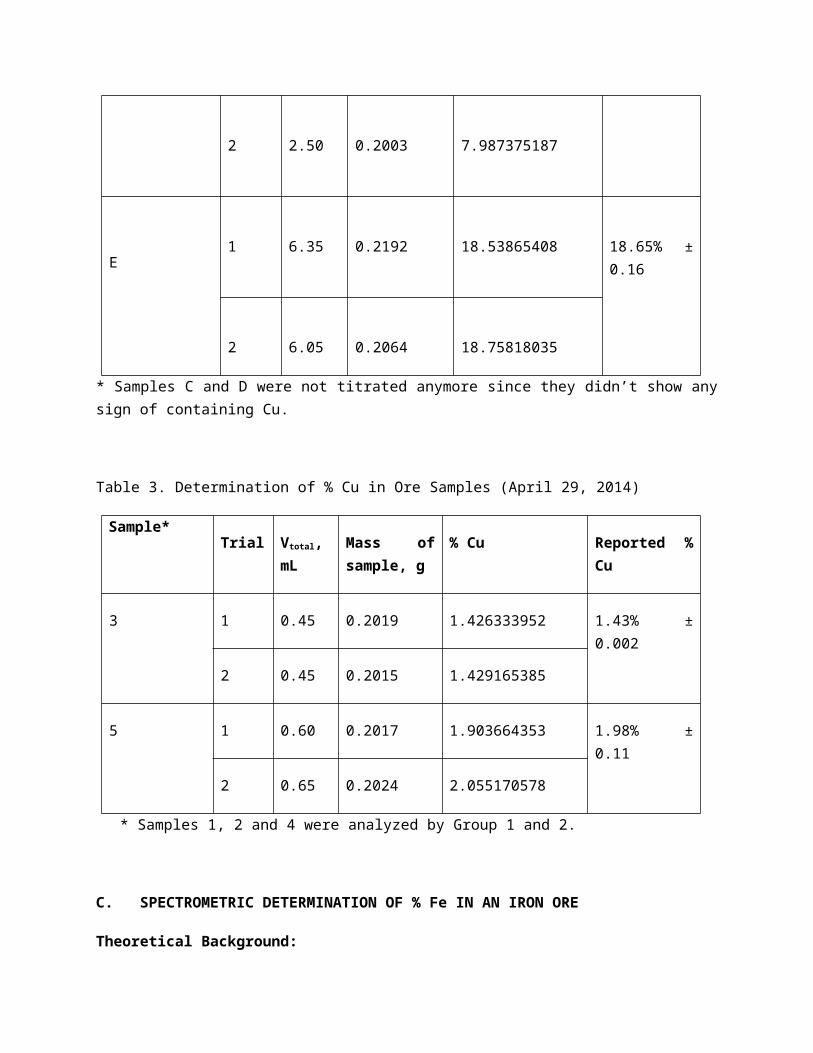
E1 6.35 0.2192 18.53865408 18.65% ± 0.16
2 6.05 0.2064 18.75818035
* Samples C and D were not titrated anymore since they didn’t show any sign of containing Cu.
Table 3. Determination of % Cu in Ore Samples (April 29, 2014)
Sample*Trial Vtotal, mL Mass of sam-
ple, g% Cu Reported % Cu
3 1 0.45 0.2019 1.426333952 1.43% ± 0.002
2 0.45 0.2015 1.429165385
5 1 0.60 0.2017 1.903664353 1.98% ± 0.11
2 0.65 0.2024 2.055170578
* Samples 1, 2 and 4 were analyzed by Group 1 and 2.
C. SPECTROMETRIC DETERMINATION OF % Fe IN AN IRON ORE
Theoretical Background:
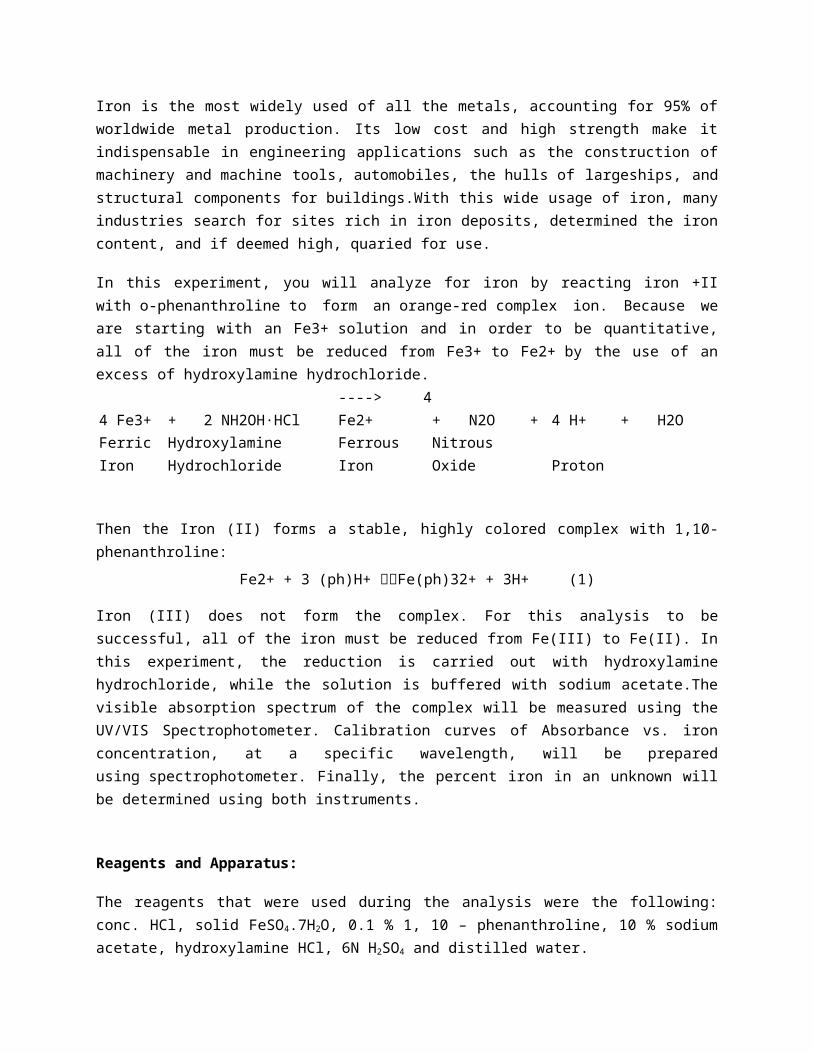
Iron is the most widely used of all the metals, accounting for 95% of worldwide metal production. Its low cost and high strength make it indispensable in engineering applications such as the construction of machinery and machine tools, automobiles, the hulls of largeships, and structural components for buildings.With this wide usage of iron, many industries search for sites rich in iron deposits, determined the iron content, and if deemed high, quaried for use.
In this experiment, you will analyze for iron by reacting iron +II with o-phenanthroline to form an orange-red complex ion. Because we are starting with an Fe3+ solution and in order to be quantitative, all of the iron must be reduced from Fe3+ to Fe2+ by the use of an excess of hydroxylamine hydrochloride.
4 Fe3+ + 2 NH2OH·HCl ----> 4 Fe2+ + N2O + 4 H+ + H2O
Ferric IronHydroxylamine Hydrochloride Ferrous Iron Nitrous Oxide Proton
Then the Iron (II) forms a stable, highly colored complex with 1,10-phenanthroline:
Fe2+ + 3 (ph)H+ Fe(ph)32+ + 3H+ (1)
Iron (III) does not form the complex. For this analysis to be successful, all of the iron must be reduced from Fe(III) to Fe(II). In this experiment, the reduction is carried out with hydroxylamine hydrochloride, while the solution is buffered with sodium acetate.The visible absorption spectrum of the complex will be measured using the UV/VIS Spectrophotometer. Calibration curves of Absorbance vs. iron concentration, at a specific wavelength, will be prepared using spectrophotometer. Finally, the percent iron in an unknown will be determined using both instruments.
Reagents and Apparatus:
The reagents that were used during the analysis were the following: conc. HCl, solid FeSO4.7H2O, 0.1 % 1, 10 – phenanthroline, 10 % sodium acetate, hydroxylamine HCl, 6N H2SO4 and distilled water.
Furthermore, the apparatuses that were used during the analysis were the following: analytical balance, pipet, aspirator, volumetric flask, magnetic stirrer, graduated cylinder, funnel, filter paper, hot plate and UV-VIS spectrophotometer.
Procedure:
1. Preparation of Standard Fe Solution (10 ppm)
Accurately, 0.0249 g of FeSO4.7H2O was weighed. The solid material was then dissolved with enough water. It was transferred to a 500-mL volumetric flask followed by the addition 10 mL of 6N H2SO4. The solution was diluted to mark, stirred and transferred in a reagent bottle.
2. Preparation of Standard Solutions
Into a set of five 50-mL volumetric flasks, 2.5, 5.0, 7.5, 10.0 and 12.5 mL of standard iron solution were pipetted. To each of the five flasks, 1 mL of hydroxylamine HCl, 4 mL of sodium acetate and 5 mL of 0.1 % 1, 10-phenanthroline were added. The contents were mixed after each reagent was added. All solutions were then diluted to mark and stirred.
A blank was prepared in exactly the same manner as above except no standard iron solution was added.
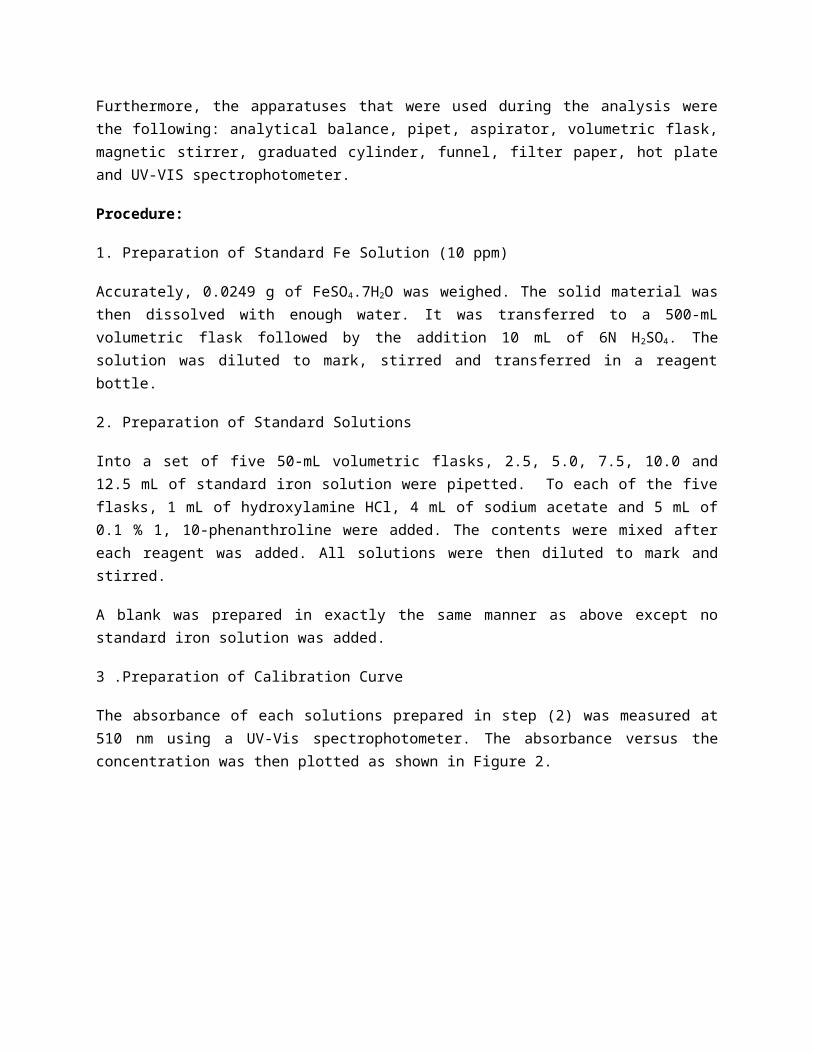
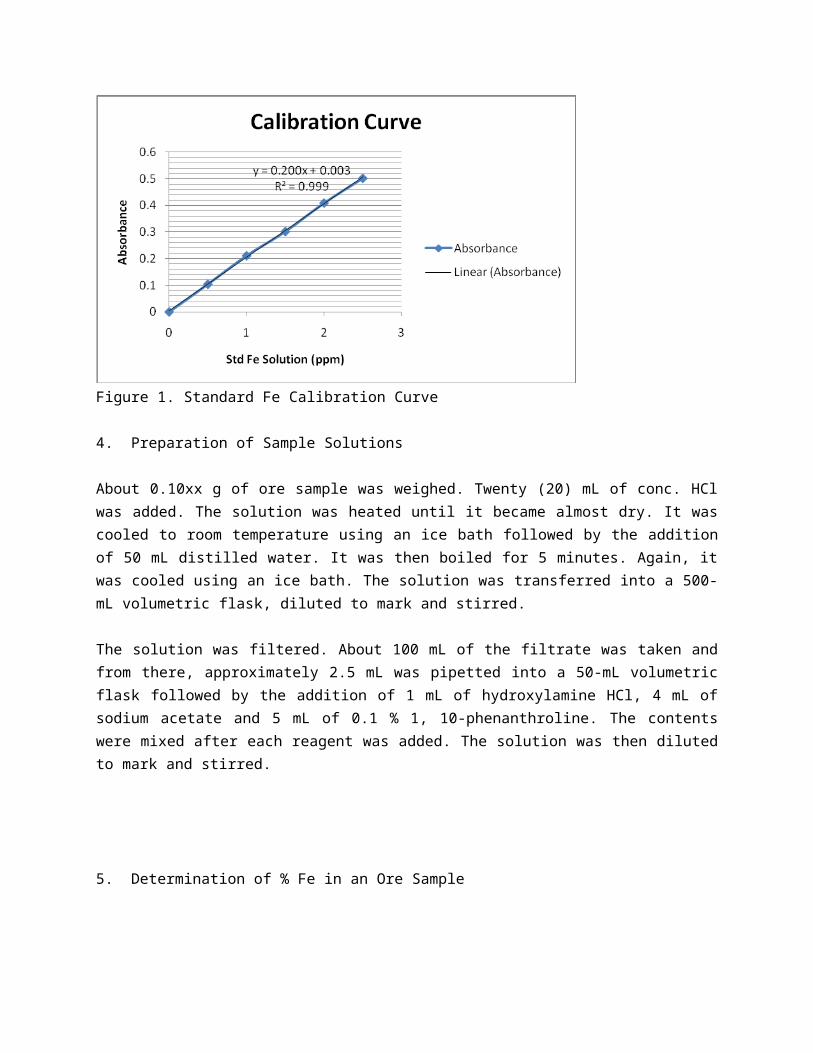
3 .Preparation of Calibration Curve
The absorbance of each solutions prepared in step (2) was measured at 510 nm using a UV-Vis spectrophotometer. The absorbance versus the concentration was then plotted as shown in Figure 2.
Figure 1. Standard Fe Calibration Curve
4. Preparation of Sample Solutions
About 0.10xx g of ore sample was weighed. Twenty (20) mL of conc. HCl was added. The solution was heated until it became almost dry. It was cooled to room temperature using an ice bath followed by the addition of 50 mL distilled water. It was then boiled for 5 minutes. Again, it was cooled using an ice bath. The solution was transferred into a 500-mL volumetric flask, diluted to mark and stirred.
The solution was filtered. About 100 mL of the filtrate was taken and from there, approximately 2.5 mL was pipetted into a 50-mL volumetric flask followed by the addition of 1 mL of hydroxylamine HCl, 4 mL of sodium acetate and 5 mL of 0.1 % 1, 10-phenanthroline. The contents were mixed after each reagent was added. The solution was then diluted to mark and stirred.
5. Determination of % Fe in an Ore Sample
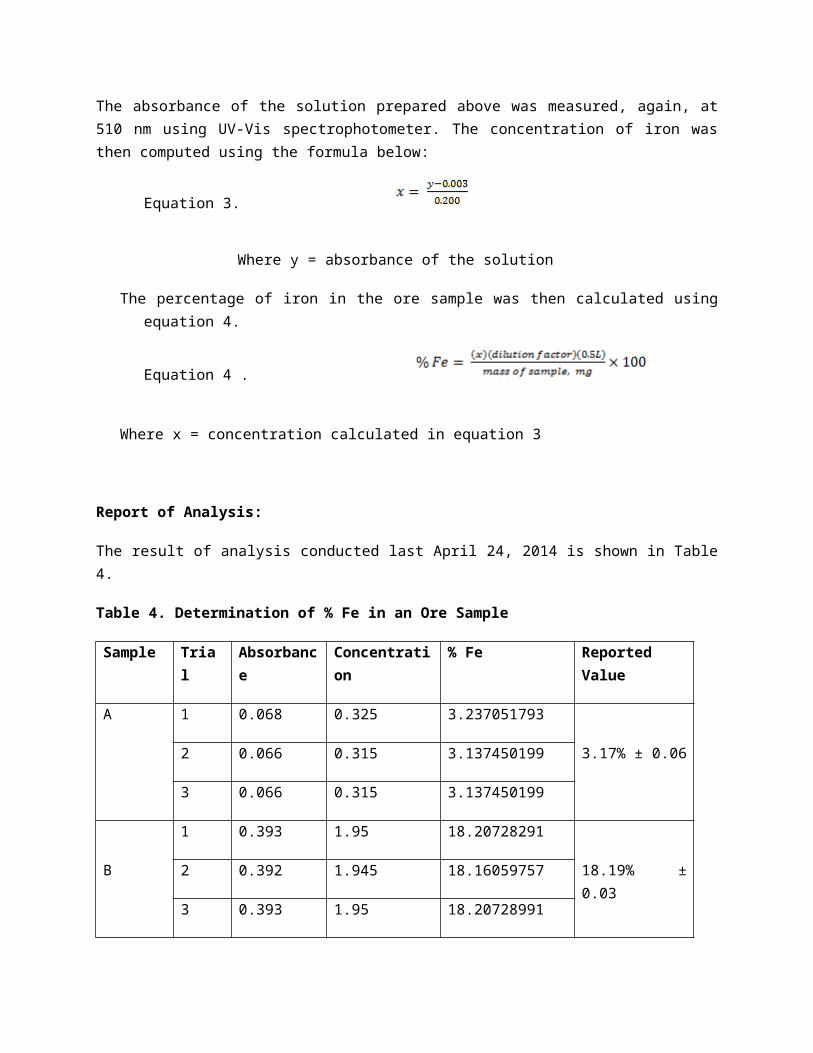
The absorbance of the solution prepared above was measured, again, at 510 nm using UV-Vis spectrophotometer. The concentration of iron was then computed using the formula below:
Equation 3.
Where y = absorbance of the solution
The percentage of iron in the ore sample was then calculated using equation 4.
Equation 4 .
Where x = concentration calculated in equation 3
Report of Analysis:
The result of analysis conducted last April 24, 2014 is shown in Table 4.
Table 4. Determination of % Fe in an Ore Sample
Sample Trial Absorbance Concentration % Fe Reported Value
A 1 0.068 0.325 3.237051793
3.17% ± 0.062 0.066 0.315 3.137450199
3 0.066 0.315 3.137450199
B
1 0.393 1.95 18.20728291
18.19% ± 0.032 0.392 1.945 18.16059757
3 0.393 1.95 18.20728991
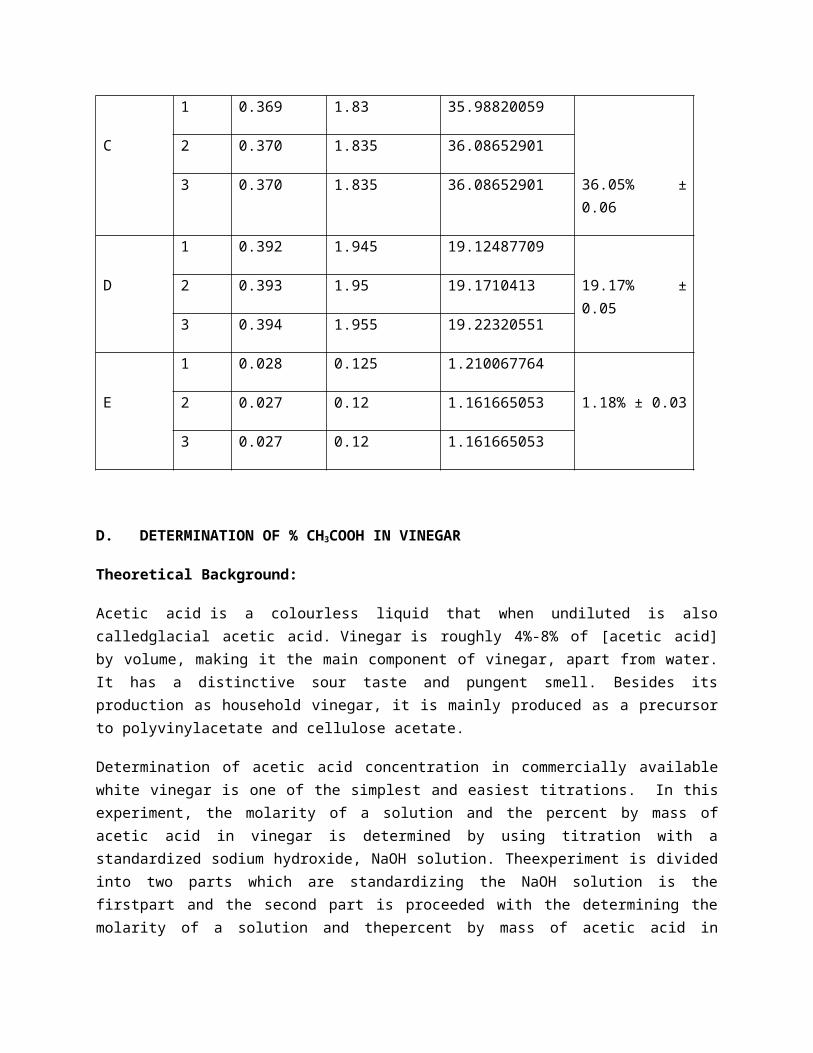
C
1 0.369 1.83 35.98820059
36.05% ± 0.06
2 0.370 1.835 36.08652901
3 0.370 1.835 36.08652901
1 0.392 1.945 19.12487709
D 19.17% ± 0.052 0.393 1.95 19.1710413
3 0.394 1.955 19.22320551
E
1 0.028 0.125 1.210067764
1.18% ± 0.032 0.027 0.12 1.161665053
3 0.027 0.12 1.161665053
D. DETERMINATION OF % CH3COOH IN VINEGAR
Theoretical Background:
Acetic acid is a colourless liquid that when undiluted is also calledglacial acetic acid. Vinegar is roughly 4%-8% of [acetic acid] by volume, making it the main component of vinegar, apart from water. It has a distinctive sour taste and pungent smell. Besides its production as household vinegar, it is mainly produced as a precursor to polyvinylacetate and cellulose acetate.
Determination of acetic acid concentration in commercially available white vinegar is one of the simplest and easiest titrations. In this experiment, the molarity of a solution and the percent by mass of acetic acid in vinegar is determined by using titration with a standardized sodium hydroxide, NaOH solution. Theexperiment is divided into two parts which are standardizing the NaOH solution is the firstpart and the second part is proceeded with the determining the molarity of a solution and thepercent by mass of acetic acid in vinegar. Based on results, it can be conclude that the greater the mass of solute inthe acid solution, the more concentrated the solution becomes thus, the higher the molarityand more volume of NaOH needed to neutralize the acid. The experiment is completed andsuccessfully conducted.
The Reaction
This is a simple neutralization reaction:
CH3COOH + NaOH → CH3COONa + H2O
Reagents and Apparatus:
The reagents that were used during the analysis were the following: standard NaOH (0.0831 N), phenolphthalein indicator and distilled water.
Furthermore, the apparatuses that were used during the analysis were the following: analytical balance, pipet, aspirator, Erlenmeyer flask, buret, buret holder, ring stand, dropper and graduated cylinder.
Procedure:
Accurately 5 mL of vinegar was pipetted into an Erlenmeyer flask and weighed. Fifty (50) mL of distilled water was then added followed by the addition of 3 drops of phenolphthalein indicator. The solution was then titrated rapidly with standard NaOH previously prepared. The end point was read when the first appearance of the faint pink color that lasted for at least 15 seconds was observed. The percentage of acetic acid in the vinegar sample was then determined using the formula below:
Equation 5.
Where N = normality of the standard NaOH solutionV = volume, in mL, of standard NaOH solution used
Meqw = milliequivalent-weight of acetic acid
Report of Analysis:
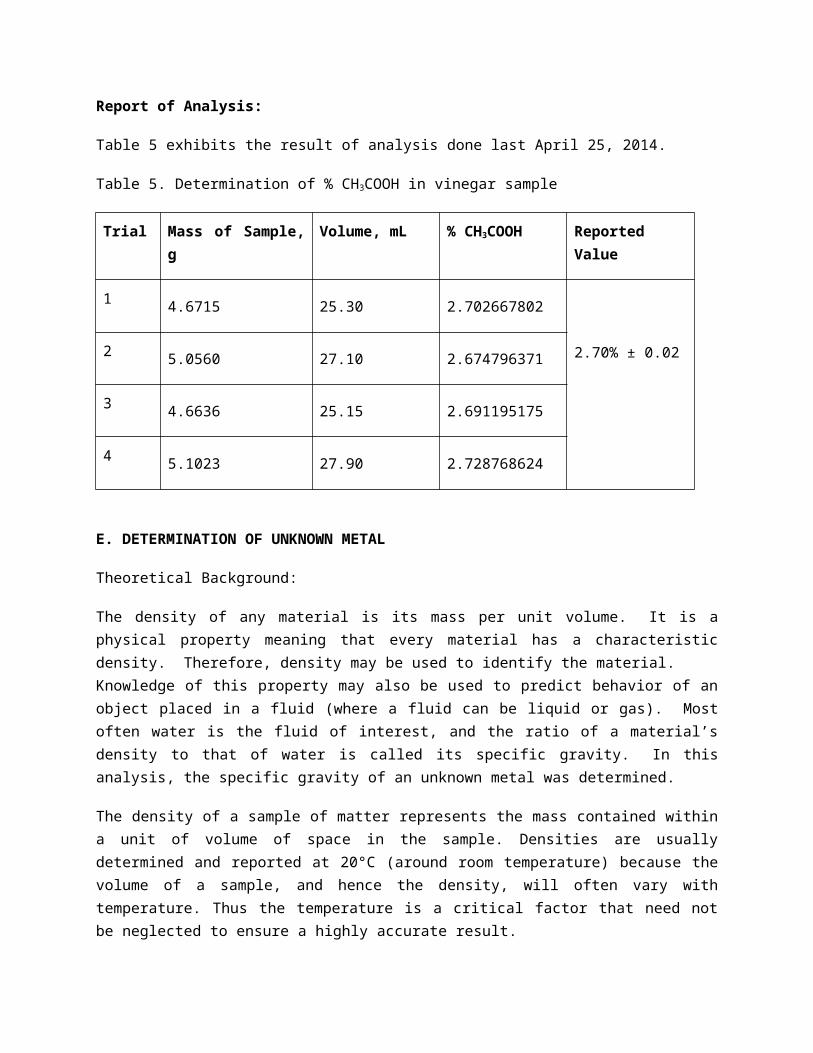
Table 5 exhibits the result of analysis done last April 25, 2014.
Table 5. Determination of % CH3COOH in vinegar sample
Trial Mass of Sample, g Volume, mL % CH3COOH Reported Value
1 4.6715 25.30 2.702667802
2.70% ± 0.022 5.0560 27.10 2.674796371
3 4.6636 25.15 2.691195175
4 5.1023 27.90 2.728768624
E. DETERMINATION OF UNKNOWN METAL
Theoretical Background:
The density of any material is its mass per unit volume. It is a physical property meaning that every material has a characteristic density. Therefore, density may be used to identify the material. Knowledge of this property may also be used to predict behavior of an object placed in a fluid (where a fluid can be liquid or gas). Most often water is the fluid of interest, and the ratio of a material’s density
to that of water is called its specific gravity. In this analysis, the specific gravity of an unknown metal was determined.
The density of a sample of matter represents the mass contained within a unit of volume of space in the sample. Densities are usually determined and reported at 20°C (around room temperature) because the volume of a sample, and hence the density, will often vary with temperature. Thus the temperature is a critical factor that need not be neglected to ensure a highly accurate result.
Here, we had used the pyknometer, also called specific gravity bottle, the most accurate and convenient instrument for density and specific gravity determination in analytical work. It consists of a flat-bottomed flask, commonly of a capacity 25 or 50ml. The glass stopper has this capillry tube with small reservoir cap to cath any overflow.
In specific heat determination, when two substances at different temperatures are in contact, heat is transferred from the warmer substance to the cooler substance. The heat lost, ΔQ lost, by the warm substance is equal to the heat gained, ΔQgain, by the cooler substance, but ideally the total heat of the system remains constant. The amount of thermal energy that a single gram of a specific material must absorb in order to change its temperature by one degree is the material's specific heat capacity, or specific heat.
When thermal energy flows into or out of an object, its temperature changes. The amount of change depends on the mass of the object, the material from which the object is made, and the temperature of the environment. The specific heat of the material can be found using a known quantity of water and a calorimeter. The calorimeter is relatively well insulated so very little thermal energy will come from or go into the surrounding air. Assume that thermal energy is conserved inside the calorimeter. This means that whatever thermal energy is gained or lost by an object put into the calorimeter is equal to the thermal energy gained or lost by the water in the calorimeter. The equation describes that the change in thermal energy, ∆Q, depends on the mass, m, the specific heat, c, and the change in temperature, ∆T.
Q =mcΔT
When an unknown metal object is put into water in a calorimeter, the change in thermal energy of the object equals the change of thermal energy of the water.
munknowncunknownΔTunknown = mwatercwater ΔTwater
The initial temperatures of the object and water will be different, but the final temperature–called the equilibrium temperature–will be the same.
Apparatuses
The apparatuses used in the experiment were the following: pyknometer, calorimeter cups, 100°C thermometer, analytical balance, beakers, hot plate, water bath for controlled temperature (at 20°C), and ice packs.
Procedure
This experiment was performed at a critical room temperature of 20°C, thus vigilance with temperature was necessary.
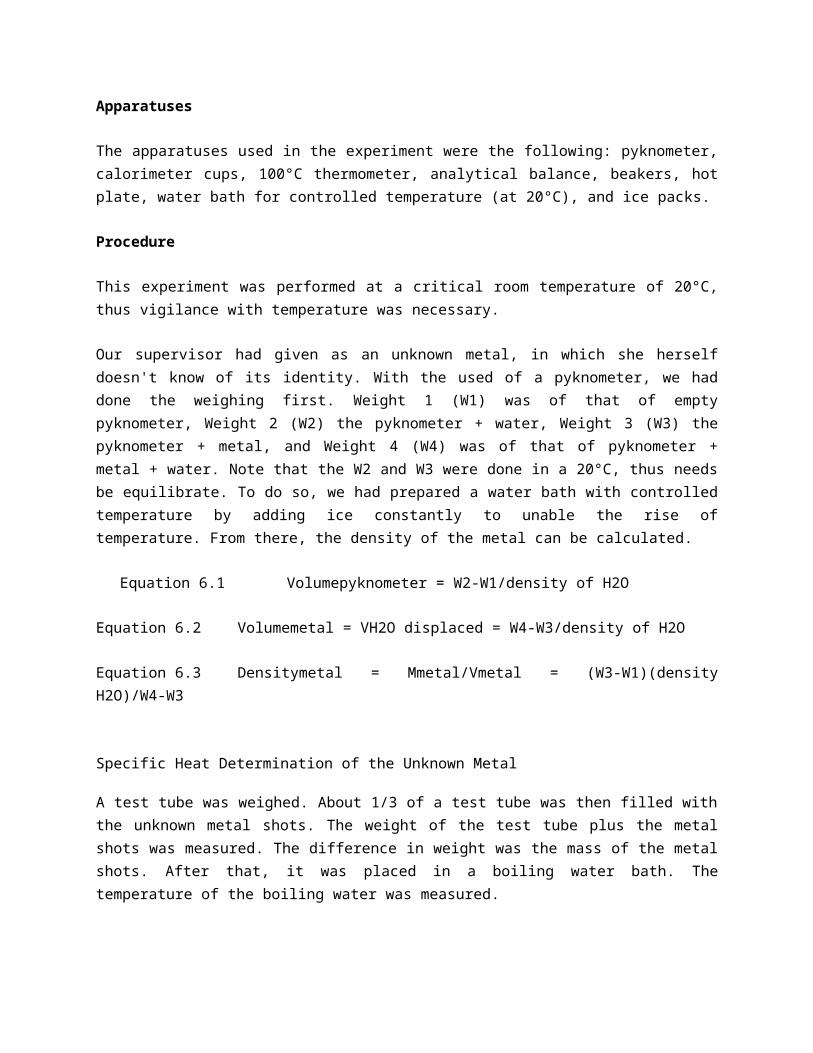
Our supervisor had given as an unknown metal, in which she herself doesn't know of its identity. With the used of a pyknometer, we had done the weighing first. Weight 1 (W1) was of that of empty pyknometer, Weight 2 (W2) the pyknometer + water, Weight 3 (W3) the pyknometer + metal, and Weight 4 (W4) was of that of pyknometer + metal + water. Note that the W2 and W3 were done in a 20°C, thus needs be equilibrate. To do so, we had prepared a water bath with controlled temperature by adding ice constantly to unable the rise of temperature. From there, the density of the metal can be calculated.
Equation 6.1 Volumepyknometer = W2-W1/density of H2O
Equation 6.2 Volumemetal = VH2O displaced = W4-W3/density of H2O
Equation 6.3 Densitymetal = Mmetal/Vmetal = (W3-W1)(density H2O)/W4-W3
Specific Heat Determination of the Unknown Metal
A test tube was weighed. About 1/3 of a test tube was then filled with the unknown metal shots. The weight of the test tube plus the metal shots was measured. The difference in weight was the mass of the metal shots. After that, it was placed in a boiling water bath. The temperature of the boiling water was measured.
Simultaneously, a clean, empty and dried calorimeter cup was weighed. About 25 mL of distilled water was placed into it. The mass of the cup plus the water was taken and the difference in weight was the mass of the water added. The temperature of the water inside the cup was then measured.
After 20 minutes, the metal shots in the test tube was poured in the calorimeter as quickly as possible. The cup was covered and the highest increased in temperature was determined. The specific heat of the unknown metal was then determined using the formula stated in the theoretical background.
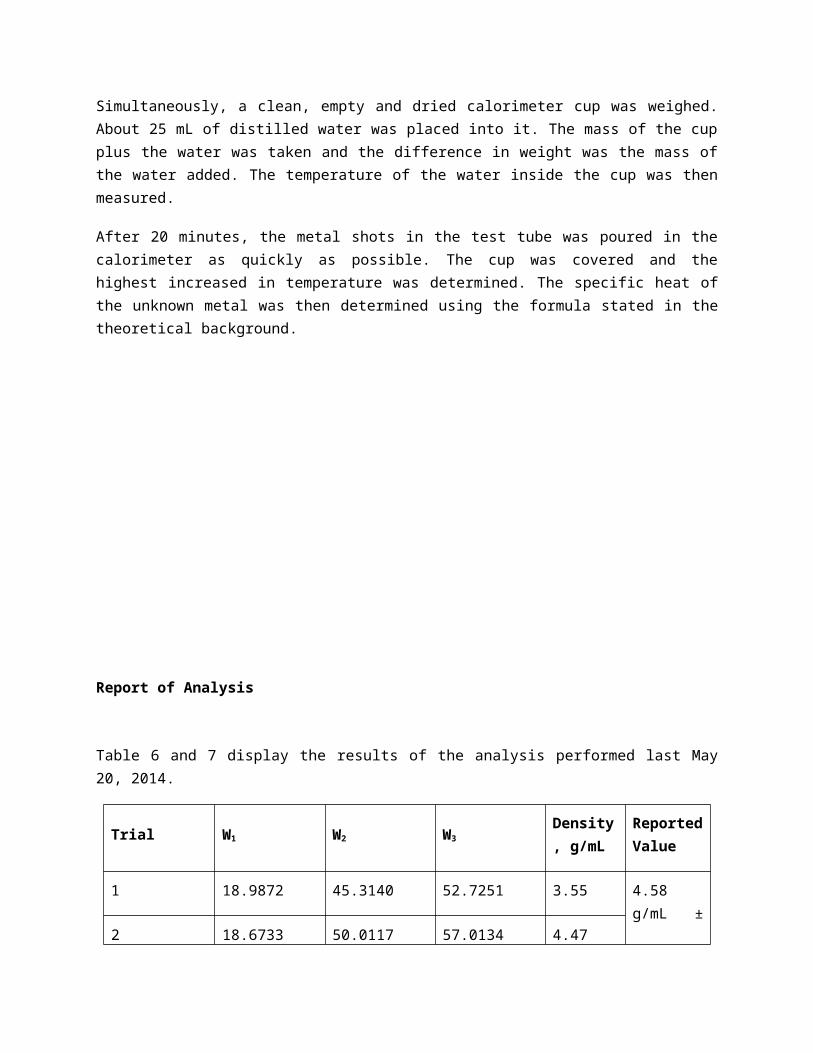
Report of Analysis
Table 6 and 7 display the results of the analysis performed last May 20, 2014.
Trial W1 W2 W3Density, g/mL
Reported Value
1 18.9872 45.3140 52.7251 3.55
4.58 g/mL ± 1.08
2 18.6733 50.0117 57.0134 4.47
3 18.1040 55.1559 61.6277 5.71
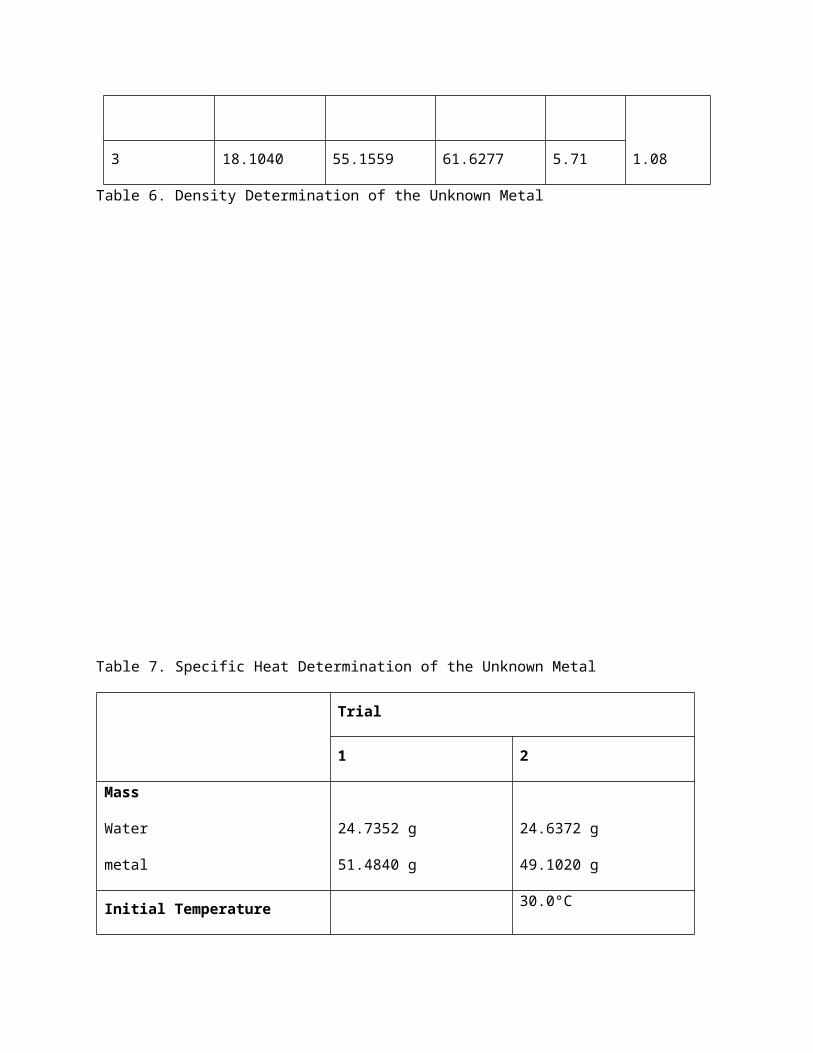
Table 6. Density Determination of the Unknown Metal
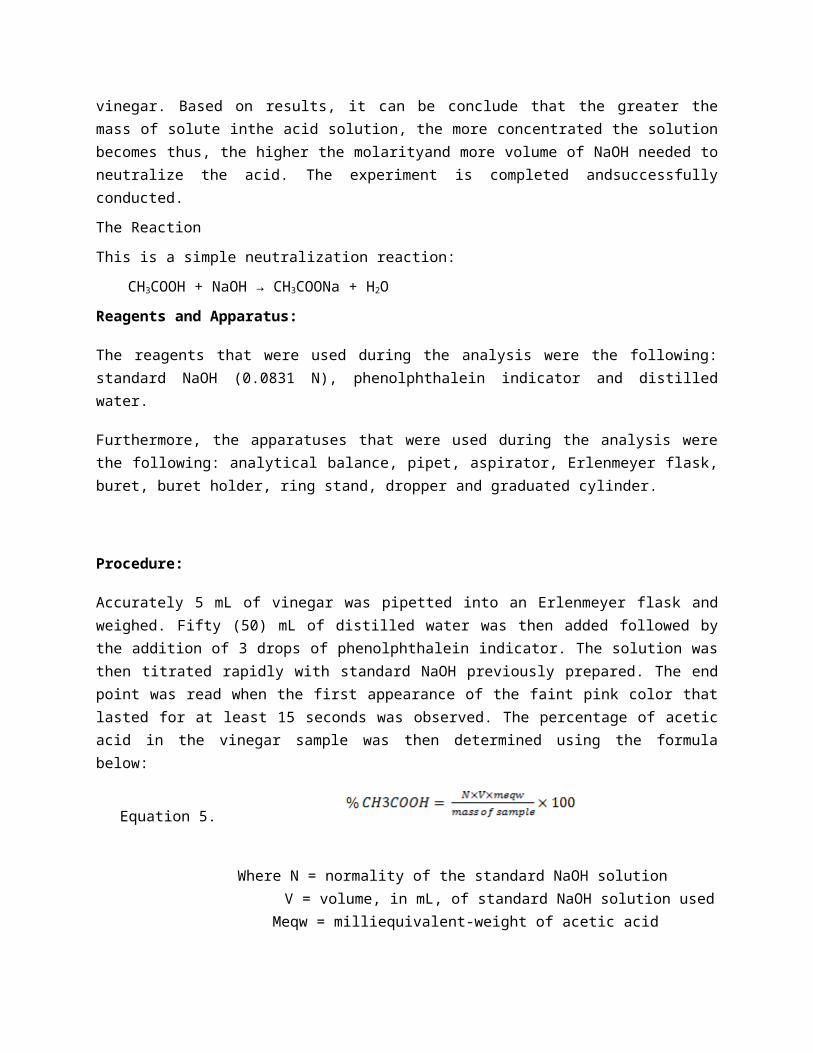
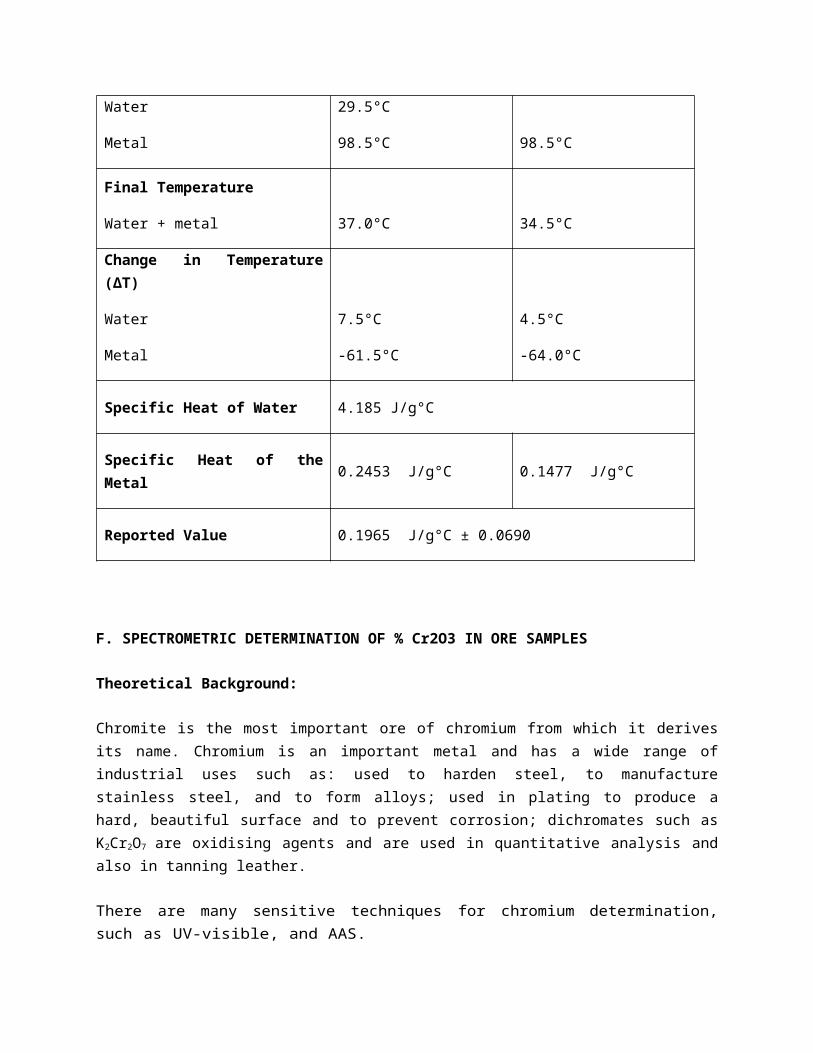
Table 7. Specific Heat Determination of the Unknown Metal
Trial
1 2
Mass
Water
metal
24.7352 g
51.4840 g
24.6372 g
49.1020 g
Initial Temperature
Water
Metal
29.5°C
98.5°C
30.0°C
98.5°C
Final Temperature
Water + metal 37.0°C 34.5°C
Change in Temperature (∆T)
Water
Metal
7.5°C
-61.5°C
4.5°C
-64.0°C
Specific Heat of Water 4.185 J/g°C
Specific Heat of the Metal 0.2453 J/g°C 0.1477 J/g°C
Reported Value 0.1965 J/g°C ± 0.0690
F. SPECTROMETRIC DETERMINATION OF % Cr2O3 IN ORE SAMPLES
Theoretical Background:
Chromite is the most important ore of chromium from which it derives its name. Chromium is an important metal and has a wide range of industrial uses such as: used to harden steel, to manufacture
stainless steel, and to form alloys; used in plating to produce a hard, beautiful surface and to prevent corrosion; dichromates such as K2Cr2O7 are oxidising agents and are used in quantitative analysis and also in tanning leather.
There are many sensitive techniques for chromium determination, such as UV-visible, and AAS.
Dissolved hexavalent chromium, in the absence of interfering amounts of substances such as molybdenum, vanadium, and mercury, may be determined colorimetrically by reaction with diphenylcarbazide. Diphenylcarbazide, also referred to as DPC, is a color developing agent conventionally used in spectrophotometric analysis of chromium and osmium. In acid solution, DPC and hexavalent chromium form a soluble red- violet product that absorbs light at 540 nm. The pH of the reaction is not particularly critical since solutions differing in pH from 0.7 to 1.3 give identical colors. The color of the chromium-diphenylcarbazide product changes slightly with time, but for practical purposes it can be considered stable.
Reagents and Apparatuses
The reagents used in this analysis were the following: Cr2O3 stock solution, 1,5-diphenylcarbazide, and distilled water.
The materials and apparatuses used in this analysis were the following: UV-Vis spectrophotometer, pipettes, 50ml volumetric flasks, beakers, magnetic stirrer, and wash bottle.
Procedure
From a Cr2O3 stock solution, 5 ml was pipeted to a 50ml volumetric flask, then diluted to mark. From this, 5 ml of the solution will be aliquoted in another volumetric flask, added with 2.5 ml of DPC (1,5-diphenylcarbazide) and dilted to mark and stirred using the magnetic stirrer. The prepaed solution was then used for spectrometric analysis using UV-Vis at absorbance max of 542 nm. Note: three trials were prepared, each of which done at three absorbance readings.
Report of Analysis
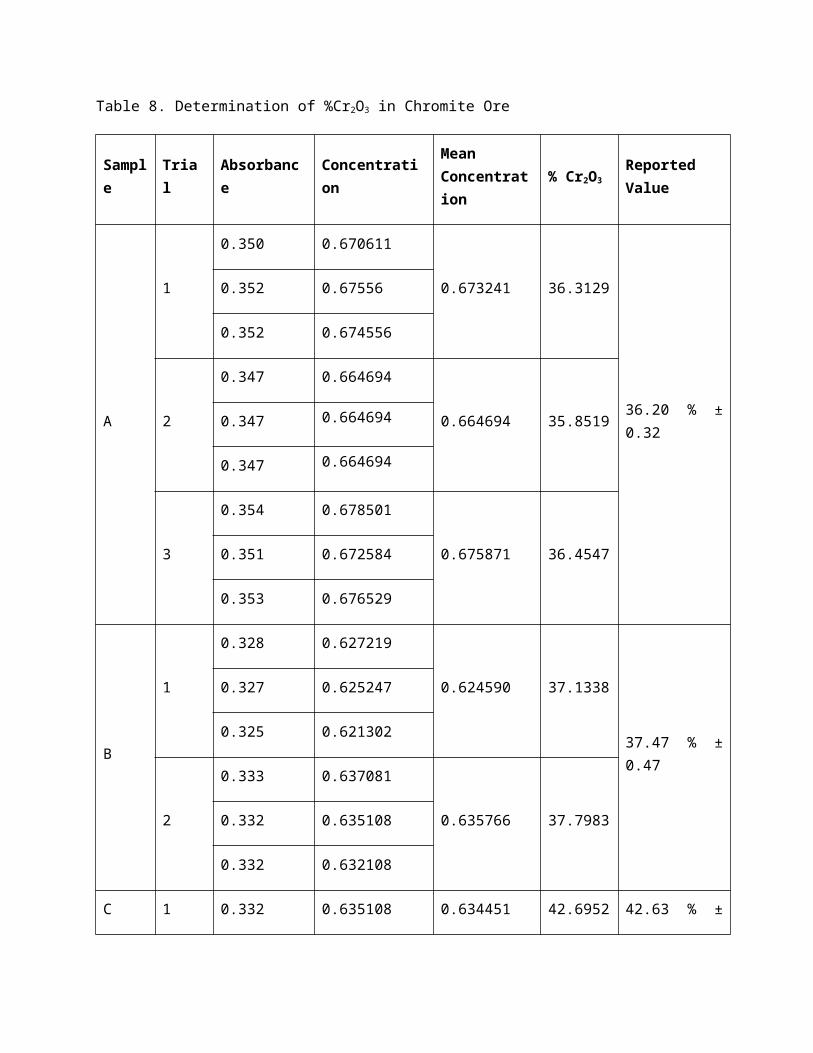
Table 8. Determination of %Cr2O3 in Chromite Ore
Sample Trial Absorbance ConcentrationMean Concentration
% Cr2O3 Reported Value
A
1
0.350 0.670611
0.673241 36.3129
36.20 % ± 0.32
0.352 0.67556
0.352 0.674556
2
0.347 0.664694
0.664694 35.85190.347 0.664694
0.347 0.664694
3
0.354 0.678501
0.675871 36.45470.351 0.672584
0.353 0.676529
B
1
0.328 0.627219
0.624590 37.1338
37.47 % ± 0.47
0.327 0.625247
0.325 0.621302
2
0.333 0.637081
0.635766 37.79830.332 0.635108
0.332 0.632108
C 1 0.332 0.635108 0.634451 42.6952 42.63 % ± 0.09
0.331 0.633136
0.332 0.635108
2
0.332 0.635108
0.632479 42.56250.330 0.631164
0.330 0.631164
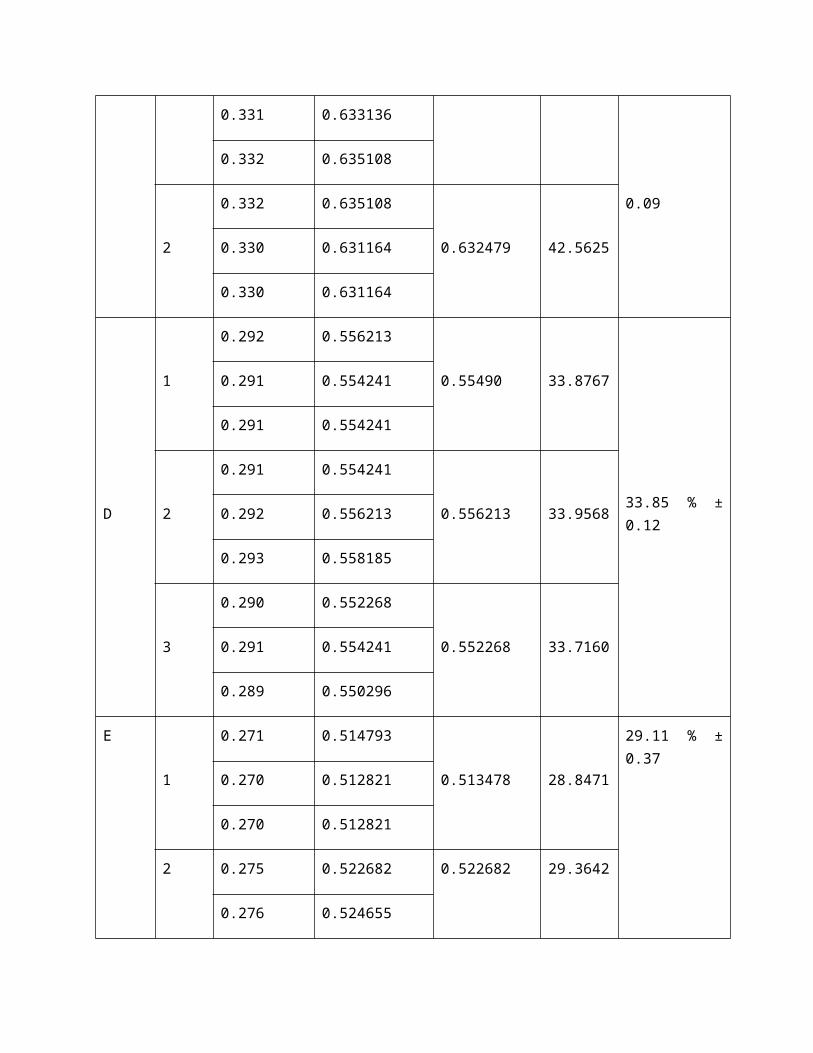
D
1
0.292 0.556213
0.55490 33.8767
33.85 % ± 0.12
0.291 0.554241
0.291 0.554241
2
0.291 0.554241
0.556213 33.95680.292 0.556213
0.293 0.558185
3
0.290 0.552268
0.552268 33.71600.291 0.554241
0.289 0.550296
E
1
0.271 0.514793
0.513478 28.8471
29.11 % ± 0.37
0.270 0.512821
0.270 0.512821
2
0.275 0.522682
0.522682 29.36420.276 0.524655
0.274 0.520710
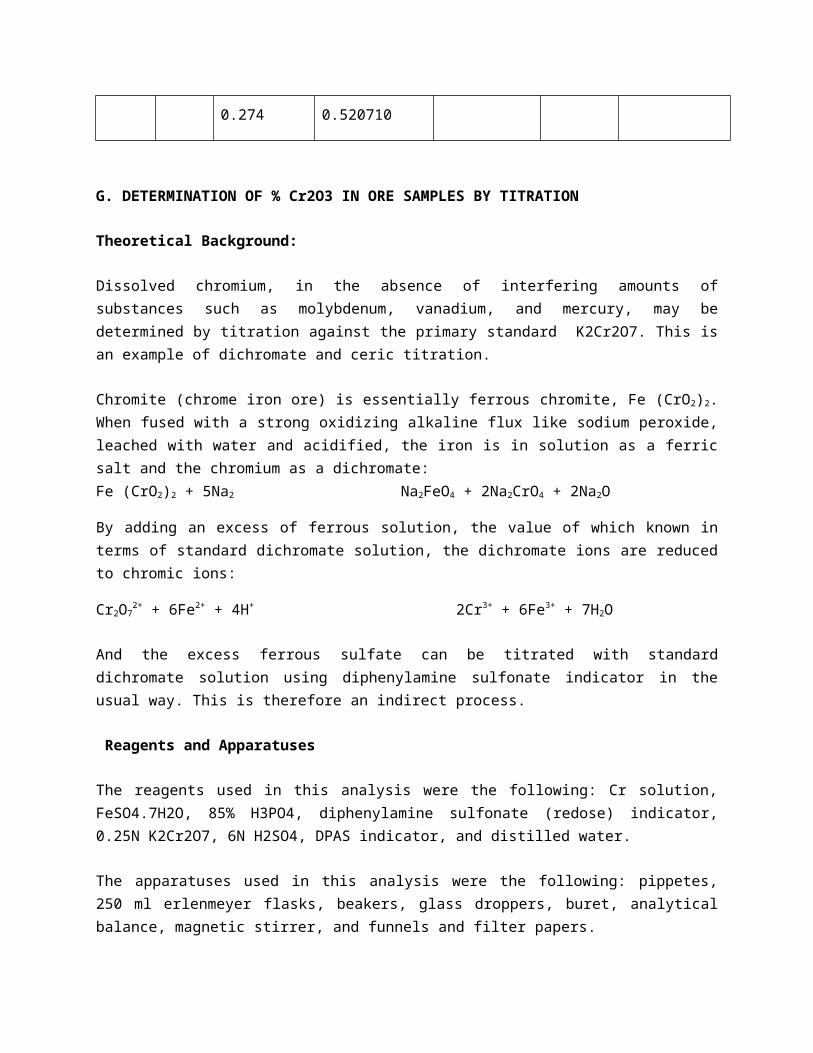
G. DETERMINATION OF % Cr2O3 IN ORE SAMPLES BY TITRATION
Theoretical Background:
Dissolved chromium, in the absence of interfering amounts of substances such as molybdenum, vanadium, and mercury, may be determined by titration against the primary standard K2Cr2O7. This is an example of dichromate and ceric titration.
Chromite (chrome iron ore) is essentially ferrous chromite, Fe (CrO2)2. When fused with a strong oxidizing alkaline flux like sodium peroxide, leached with water and acidified, the iron is in solution as a ferric salt and the chromium as a dichromate:Fe (CrO2)2 + 5Na2 Na2FeO4 + 2Na2CrO4 + 2Na2O
By adding an excess of ferrous solution, the value of which known in terms of standard dichromate solution, the dichromate ions are reduced to chromic ions:
Cr2O72+ + 6Fe2+ + 4H+ 2Cr3+ + 6Fe3+ + 7H2O
And the excess ferrous sulfate can be titrated with standard dichromate solution using diphenylamine sulfonate indicator in the usual way. This is therefore an indirect process.
Reagents and Apparatuses
The reagents used in this analysis were the following: Cr solution, FeSO4.7H2O, 85% H3PO4, diphenylamine sulfonate (redose) indicator, 0.25N K2Cr2O7, 6N H2SO4, DPAS indicator, and distilled water.
The apparatuses used in this analysis were the following: pippetes, 250 ml erlenmeyer flasks, beakers, glass droppers, buret, analytical balance, magnetic stirrer, and funnels and filter papers.
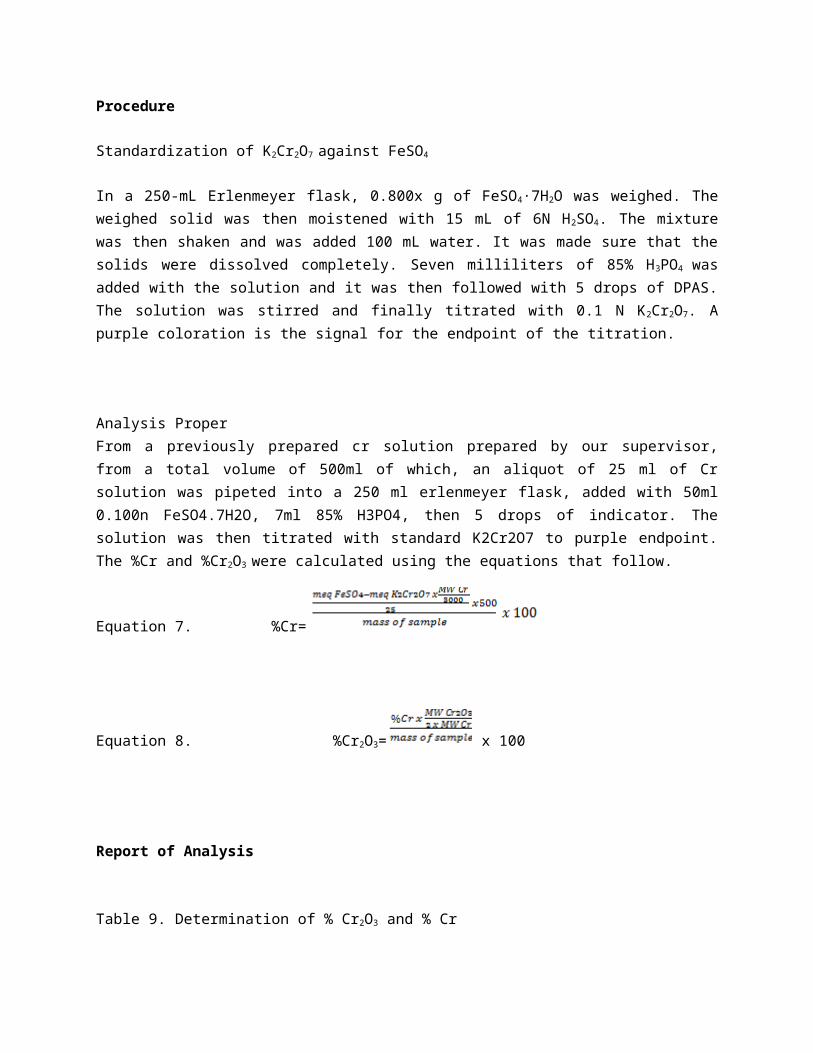
Procedure
Standardization of K2Cr2O7 against FeSO4
In a 250-mL Erlenmeyer flask, 0.800x g of FeSO4·7H2O was weighed. The weighed solid was then moistened with 15 mL of 6N H2SO4. The mixture was then shaken and was added 100 mL water. It was made sure that the solids were dissolved completely. Seven milliliters of 85% H3PO4 was added with the solution and it was then followed with 5 drops of DPAS. The solution was stirred and finally titrated with 0.1 N K2Cr2O7. A purple coloration is the signal for the endpoint of the titration.
Analysis Proper
From a previously prepared cr solution prepared by our supervisor, from a total volume of 500ml of which, an aliquot of 25 ml of Cr solution was pipeted into a 250 ml erlenmeyer flask, added with 50ml 0.100n FeSO4.7H2O, 7ml 85% H3PO4, then 5 drops of indicator. The solution was then titrated with standard K2Cr2O7 to purple endpoint. The %Cr and %Cr2O3 were calculated using the equations that follow.
Equation 7. %Cr=
Equation 8. %Cr2O3= x 100
Report of Analysis
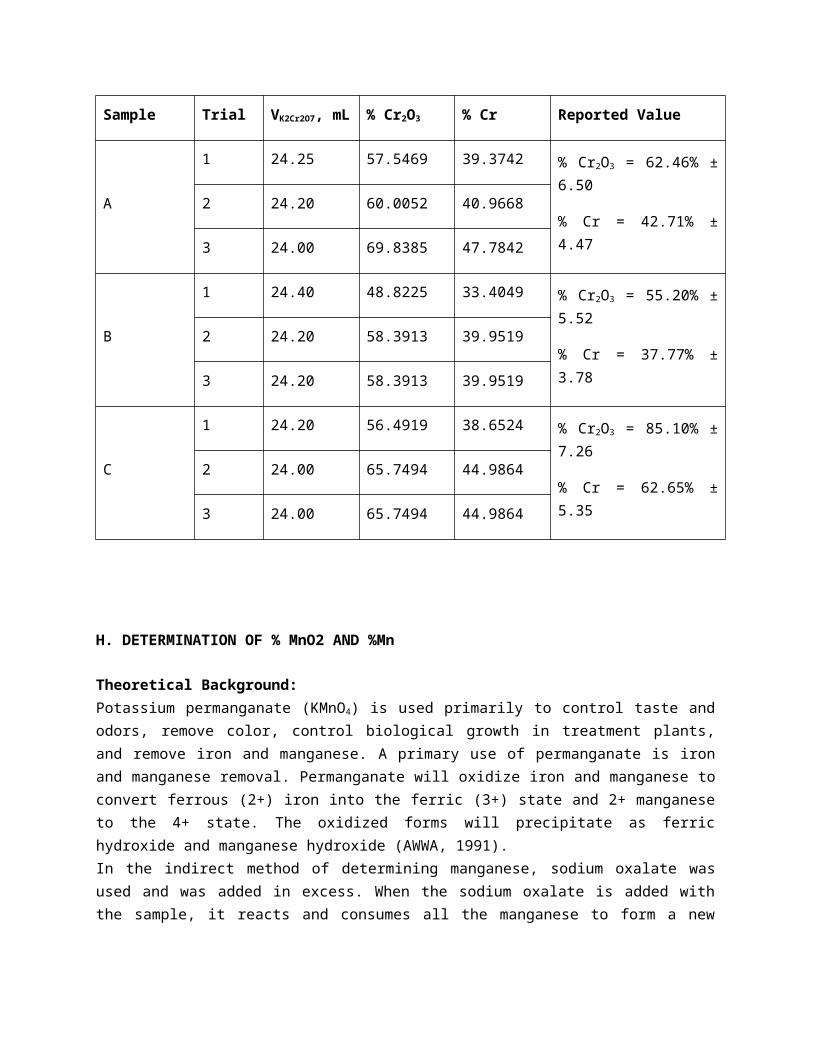
Table 9. Determination of % Cr2O3 and % Cr
Sample Trial VK2Cr2O7, mL % Cr2O3 % Cr Reported Value
A
1 24.25 57.5469 39.3742
% Cr2O3 = 62.46% ± 6.50
% Cr = 42.71% ± 4.472 24.20 60.0052 40.9668
3 24.00 69.8385 47.7842
B
1 24.40 48.8225 33.4049
% Cr2O3 = 55.20% ± 5.52
% Cr = 37.77% ± 3.782 24.20 58.3913 39.9519
3 24.20 58.3913 39.9519
C 1 24.20 56.4919 38.6524 % Cr2O3 = 85.10% ± 7.26
% Cr = 62.65% ± 5.352 24.00 65.7494 44.9864
3 24.00 65.7494 44.9864
H. DETERMINATION OF % MnO2 AND %Mn
Theoretical Background:Potassium permanganate (KMnO4) is used primarily to control taste and odors, remove color, control biological growth in treatment plants, and remove iron and manganese. A primary use of permanganate is iron and manganese removal. Permanganate will oxidize iron and manganese to convert ferrous (2+) iron into the ferric (3+) state and 2+ manganese to the 4+ state. The oxidized forms will precipitate as ferric hydroxide and manganese hydroxide (AWWA, 1991).In the indirect method of determining manganese, sodium oxalate was used and was added in excess. When the sodium oxalate is added with the sample, it reacts and consumes all the manganese to form a new substance. The amount of oxalate unreacted is then titrated with permanganate. 2 MnO4- + 16 H+ + 5 C2O42- -----10e-----> 2 Mn+2 + 8 H2O + 10 CO2 (g)
To determine the amount of manganese in the sample, the amount in equivalent weight of oxalate is subtracted by the amount in equivalent weight of permanganate.
Reagents and Apparatuses
The reagents used in this analysis were the following: Na2C2O4, 6N H2SO4, Standard KmnO4 and distilled water.
The apparatuses used in this analysis were the following: beakers, pipettes, hot plates, magnetic stirrer, erlenmeyer flask.
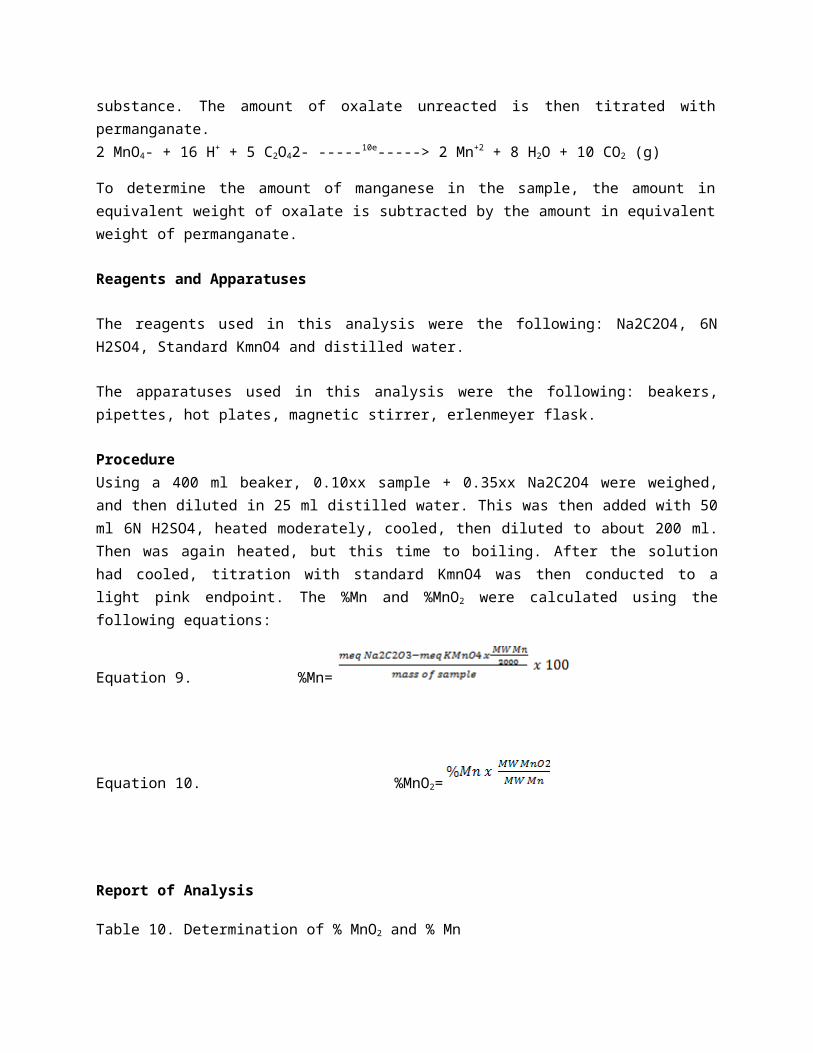
ProcedureUsing a 400 ml beaker, 0.10xx sample + 0.35xx Na2C2O4 were weighed, and then diluted in 25 ml distilled water. This was then added with 50 ml 6N H2SO4, heated moderately, cooled, then diluted to about 200 ml. Then was again heated, but this time to boiling. After the solution had cooled, titration with standard KmnO4 was then conducted to a light pink endpoint. The %Mn and %MnO2 were calculated using the following equations:
Equation 9. %Mn=
Equation 10. %MnO2=
Report of Analysis
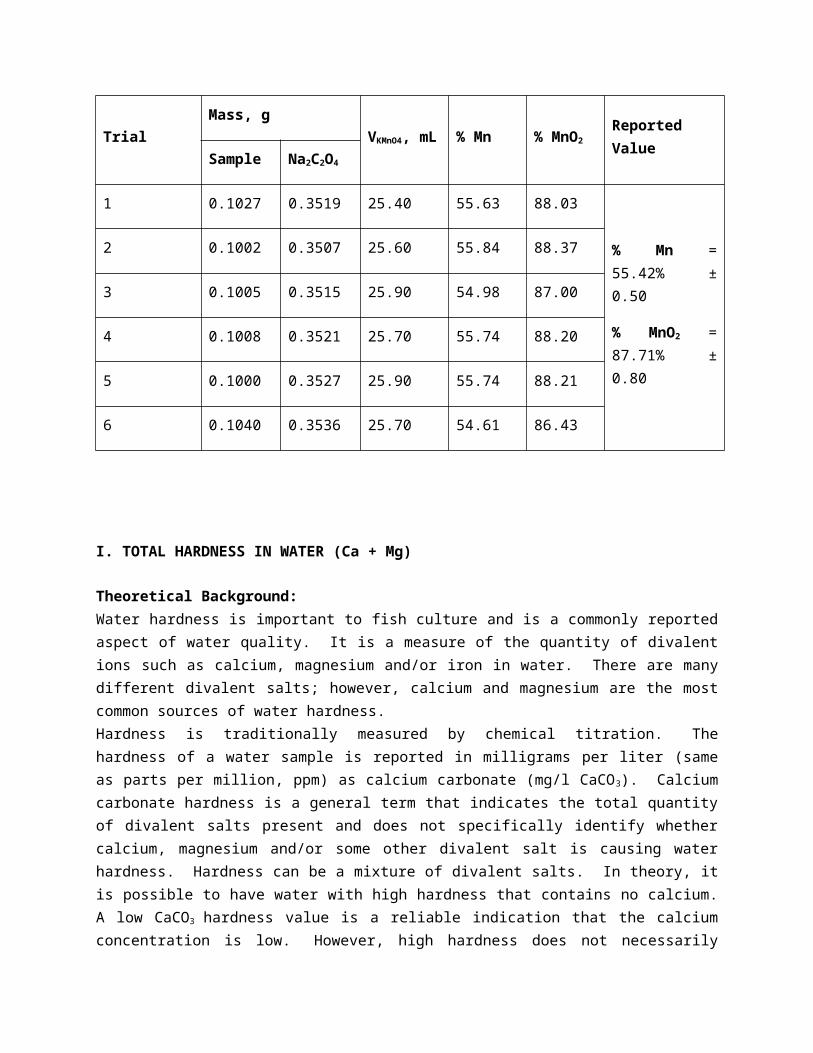
Table 10. Determination of % MnO2 and % Mn
TrialMass, g
VKMnO4, mL % Mn % MnO2 Reported ValueSample Na2C2O4
1 0.1027 0.3519 25.40 55.63 88.03
% Mn = 55.42% ± 0.50
% MnO2 = 87.71% ± 0.80
2 0.1002 0.3507 25.60 55.84 88.37
3 0.1005 0.3515 25.90 54.98 87.00
4 0.1008 0.3521 25.70 55.74 88.20
5 0.1000 0.3527 25.90 55.74 88.21
6 0.1040 0.3536 25.70 54.61 86.43
I. TOTAL HARDNESS IN WATER (Ca + Mg)
Theoretical Background:Water hardness is important to fish culture and is a commonly reported aspect of water quality. It is a measure of the quantity of divalent ions such as calcium, magnesium and/or iron in water. There are many different divalent salts; however, calcium and magnesium are the most common sources of water hardness.Hardness is traditionally measured by chemical titration. The hardness of a water sample is reported in milligrams per liter (same as parts per million, ppm) as calcium carbonate (mg/l CaCO3). Calcium carbonate hardness is a general term that indicates the total quantity of divalent salts present and does not specifically identify whether calcium, magnesium and/or some other divalent salt is causing water hardness. Hardness can be a mixture of divalent salts. In theory, it is possible to have water with high
hardness that contains no calcium. A low CaCO3 hardness value is a reliable indication that the calcium concentration is low. However, high hardness does not necessarily reflect a high calcium concentration. A high hardness reading could result from high magnesium concentrations with little or no calcium present.Permanent hardness is usually determined by titrating it with a standard solution of ethylenediamminetetraacetic acid, EDTA. The EDTA is a complexing, or chelating agent used to capture the metal ions. This causes the water to become softened, but the metal ions are not removed from the water. EDTA simply binds the metal ions to it very tightly.Erio - T indicator or Eriochrome Black-T indicator is used in this EDTA titration. When it is chealted or acidifies, it produces a pink red solution. When it is not chelated and under basic conditions it is blue.To do this, EDTA titration was first performed to find the total concentration of metals in the water. The total concentration is the concentrations of Ca2+ and Mg2+. Then another titration is performed to determine the individual amounts of Ca2+ and Mg2+ in the sample of tap water.
Reagents and Apparatuses
The reagents used in this analysis were MgO solid, distilled water, 6N HCl, buffer solution, EBT indicator, 1 M NaOH, Hydroxynaphthol blue indicator, and standard EDTA (1.00mg CaCO3/mL EDTA). The apparatuses used in performing the task were the following: analytical balance, pH meter, Erlenmeyer flasks, pipet, aspirator, dropper, buret, stirring rod, iron stand and beakers.Procedure
Standardization of EDTA against MgOSince the EDTA solution was already standardized against CaCO3 and obtained a titer 1 mg CaCO3/mL EDTA, it is also necessary to standardize EDTA against MgO to determine how much MgCO3 is present per milliliter EDTA. In an analytical balance, 0.15xx g of dry MgO was weighed. It was dissolved in distilled water and then added with 6N HCl drop by drop until it dissolved completely. The solution was then diluted to 250 mL. From this solution, 3 portions of 25 mL aliquots were transferred in to the E. Flasks. Each was then added with 5 mL buffer solution and 5 drops of EBT indicator. The solutions were then titrated with EDTA solution until an appearance of blue color is obtained. The titer was calculated using the solution:
Equation 11. mg MgCO3/mL EDTA = mg MgOV total x MW MgCO3MW MgO
Analysis Proper
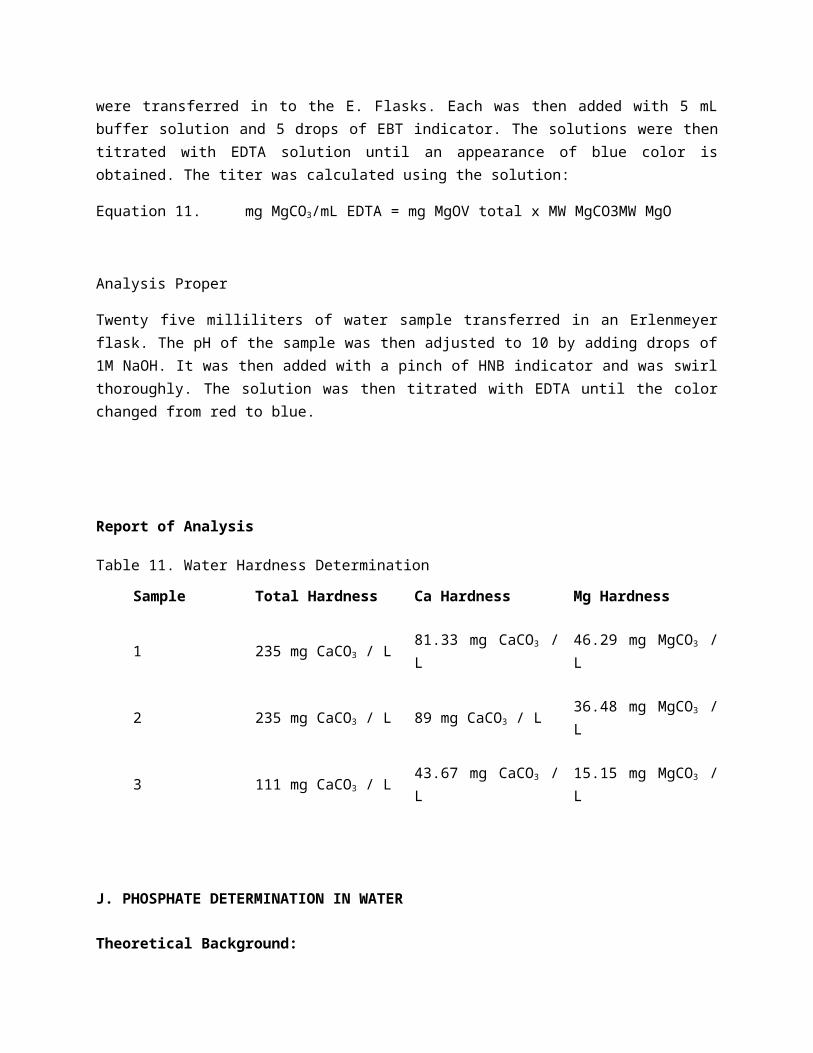
Twenty five milliliters of water sample transferred in an Erlenmeyer flask. The pH of the sample was then adjusted to 10 by adding drops of 1M NaOH. It was then added with a pinch of HNB indicator and was swirl thoroughly. The solution was then titrated with EDTA until the color changed from red to blue.
Report of Analysis
Table 11. Water Hardness Determination
Sample Total Hardness Ca Hardness Mg Hardness
1 235 mg CaCO3 / L 81.33 mg CaCO3 / L 46.29 mg MgCO3 / L
2 235 mg CaCO3 / L 89 mg CaCO3 / L 36.48 mg MgCO3 / L
3 111 mg CaCO3 / L 43.67 mg CaCO3 / L 15.15 mg MgCO3 / L
J. PHOSPHATE DETERMINATION IN WATER
Theoretical Background:
Phosphate is considered to be one the most important nutrients in natural water. Although several other nutrients (eg. carbon, nitrogen, sulfur, potassium, calcium and magnesium) are required to facilitate growth of plant material, particularly algae, the phosphorus content is critical in determining the level of algal growth that the water will support. The growth of algae in natural water will rarely occur at phosphate concentrations below 0.05 mg/dm3. Drinking water may have a maximum allowable phosphate content of 0.3 mg/dm3, while on average, raw sewage contains about 30 mg/dm3.
Phosphate will readily react with ammonium molybdate in the presence of suitable reducing agents to form a blue coloured complex, the intensity of which is directly proportional to the concentration of phosphate in the solution. The blue color is due to the formation of molybdenum blue and the depth of the blue color indicates the amount of phosphate in the water. The absorbance of the blue solution can be measured with a spectrophotometer and the concentration of phosphate in the original solution can be calculated. The phosphate content of an unknown water sample can be obtained by first plotting the absorbances of a series of standard solutions against the corresponding concentrations, thus giving a calibration curve. The concentration of phosphate in the unknown sample can then be determined from the graph.
Reagents and Apparatuses
Standard Phosphate solutions with different concentrations, ammonium molybdate and amino naphthol sulfonic acid were the chemicals used in working out the analysis conducted last May 4, 2014. The materials used include 50-mL volumetric flasks, pipets, aspirator, beakers and magnetic stirrer.
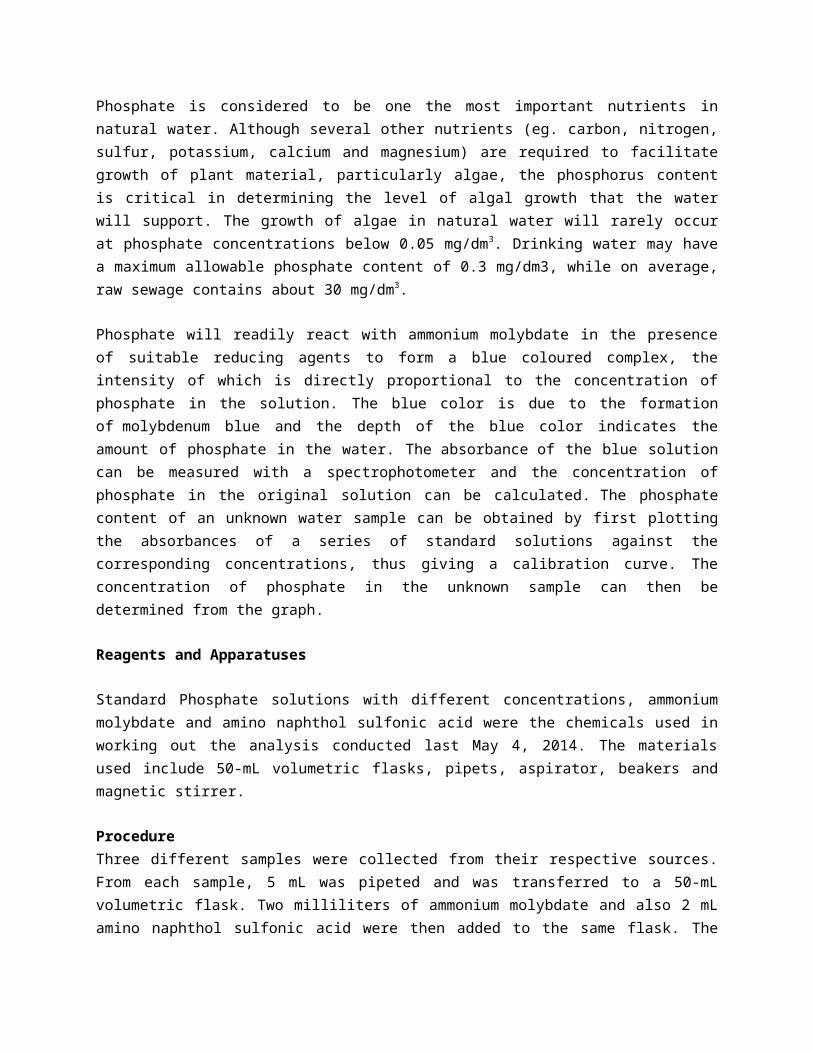
ProcedureThree different samples were collected from their respective sources. From each sample, 5 mL was pipeted and was transferred to a 50-mL volumetric flask. Two milliliters of ammonium molybdate and also 2 mL amino naphthol sulfonic acid were then added to the same flask. The mixture was diluted to mark, stirred and was allowed to stand for 5 minutes. The solution was then read in the UV-Vis spectrophotometer at 734 nm wavelength. Below is the standard calibration curve of the phosphate solution.
Figure 2. Calibration Curve for Phosphate Analysis
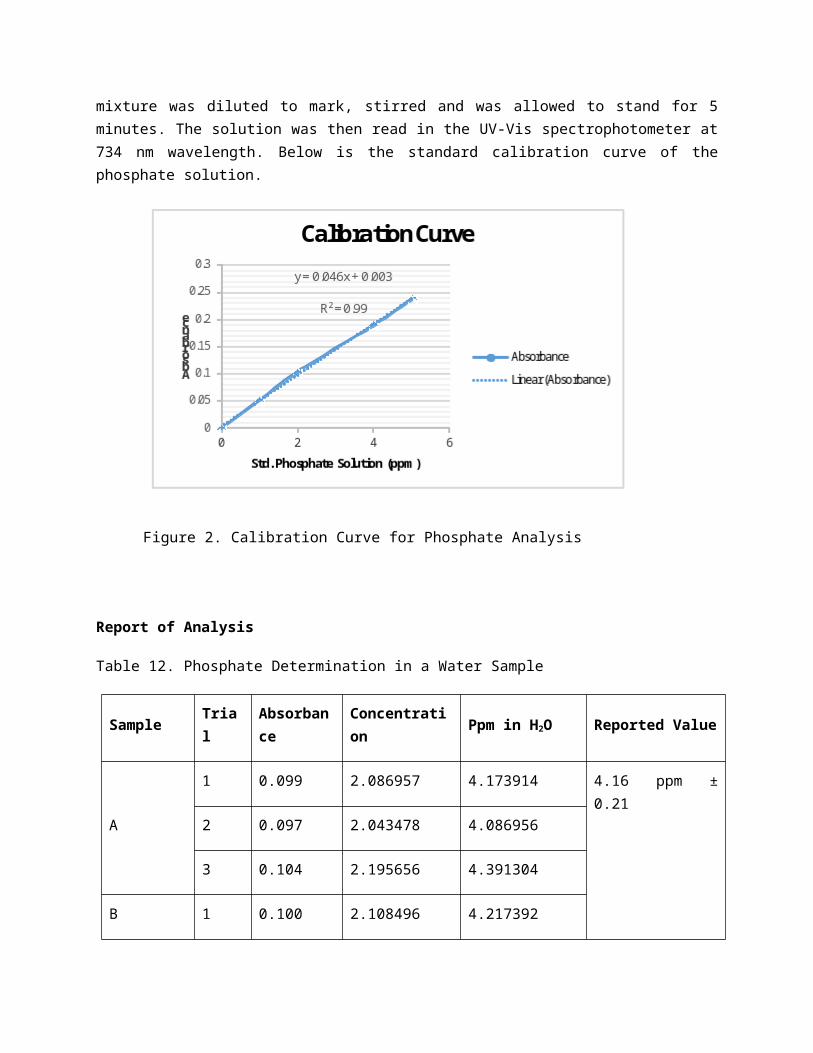
Report of Analysis
Table 12. Phosphate Determination in a Water Sample
Sample Trial Absorbance Concentration Ppm in H2O Reported Value
A 1 0.099 2.086957 4.173914 4.16 ppm ± 0.21
2 0.097 2.043478 4.086956
3 0.104 2.195656 4.391304
B
1 0.100 2.108496 4.217392
2 0.102 2.152174 4.304348
3 0.104 2.195652 4.391304
C
1 0.090 1.891304 3.782608
2 0.093 1.956522 3.913044
3 0.100 2.108696 4.217392
K. SOXHLET METHOD OF OIL EXTRACTION
Theoretical Background:
Soxhlet extractor is a piece of laboratory apparatus invented in 1879 by Franzvon Soxhlet. It was originally designed for the extraction of a lipid from a solid material. However, a Soxhlet extractor is not limited to the extraction of lipids. Typically, a Soxhlet extraction is only required where the desired compound has a limited solubility in a solvent, and the impurity is insoluble in that solvent. If the desired compound has a significant solubilityin a solvent then a simple filtration can be used to separate the compound from them insoluble substance. This experiment so uses a soxhlet method to determine the lipid contents of peanut oil-seeds. In principle, fat is extracted, semi continuously, with an organic solvent, hexane (though petrleum ether would also yield apt result, however not used). Solvent is heated and volatized then is condensed above the sample. Solvent drips onto thesample and soaks it to extract the fat. At 15-20 min interval, the solvent is siphoned to theheating flask, to start the process again. This whole process will take 8 hours in minimum. Fat content is measured by weight loss of sample orweight of fat removed.
Reagents and Apparatuses
The extraction of oil from peanut seeds is done using n-hexane as the extracting solvent. Mortar and pestle, spatula, filter paper, hot plate and the complete soxhlet distillation set up were the materials used in the activity.
Procedure
Peanut seeds were crushed into fine powder. The receiving flasks (with bumping chips) used were weighed and was half-fill added with n-hexane. The powder was then weighed and was wrap sealed in a filter paper. The wrapped solid was then placed in the Soxhlet extractor and was installed in the distilling set-up. The hot plate was turned on and the extraction was allowed to proceed for 8 hours. After the extraction was completed, the flask where the oil is contained was placed into the oven for 1 hour to remove the remaining solvent. The percentage oil was then calculated using the equation below.
Equation 12.
Report of AnalysisTable 13. Sohxlet Oil Extraction
Trial
Mass, g
% oilReported Value
M1 M2Mass of sample
1 105.2631 109.6588 10.9509 40%41%
2 104.8027 111.1260 15.0554 42%
L. PROTEIN DETERMINATION IN FOODS
Theoretical Background:
Cereals and seeds are significant components of the human diet and the principal part of feeding stock for domestic animals. One of the most important nutrients of cereals and seeds is protein. The monitoring of protein amount, through the estimation of nitrogen, must be accurate in order to determine the nutritional quality of cereals and seeds. If the amount of nitrogen is multiplied by a factor depending on the kinds of protein expected to be present in the food, then the total protein content can be determined.
The Kjeldahl method is the standard method of nitrogen determination dating back to its development in the late 1800's. The method consists of three basic steps: 1) digestion of the sample in sulfuric acid with a catalyst, which results in conversion of nitrogen to ammonia; 2) distillation of the ammonia into a trapping solution; and 3) quantification of the ammonia by titration with a standard solution.
The Kjeldahl method is a multi-stepped process, including sample digestion in boiling sulphuric acid, neutralisation with sodium hydroxide solution, distillation of the resulting ammonia gas into a trapping solution, titration with an acid solution and determination of the amount of nitrogen and protein by calculation. The entire process may require over four hours to be completed while all steps, excluding digestion, require continuous technician contribution.
In addition, handling boiling sulphuric acid, especially with the addition of concentrated caustic solution, is a particularly hazardous task. Kjeldahl analyses also generate toxic waste since they involve the use of mercury or selenium catalysts during the digestion step.Principles
Digestion
The food sample to be analyzed is weighed into a digestion flask and then digested by heating it in the presence of sulfuric acid (an oxidizing agent which digests the food), anhydrous sodium sulfate (to speed up the reaction by raising the boiling point) and a catalyst, such as copper, selenium, titanium, or mercury (to speed up the reaction). Digestion converts any nitrogen in the food (other than that which is in the form of nitrates or nitrites) into ammonia, and other organic matter to C02 and H20. Ammonia gas is not liberated in an acid solution because the ammonia is in the form of the ammonium ion (NH 4
+) which binds to the sulfate ion (SO4
2-) and thus remains in solution:
N(food) ---> (NH4)2SO4 (1)
Neutralization
After the digestion has been completed the digestion flask is connected to a recieving flask by a tube. The solution in the digestion flask is then made alkaline by addition of sodium hydroxide, which converts the ammonium sulfate into ammonia gas:
(NH4)2SO4 + 2 NaOH ---> 2NH3 + 2H2O + Na2SO4 (2)
The ammonia gas that is formed is liberated from the solution and moves out of the digestion flask and into the receiving flask - which contains an excess of boric acid. The low pH of the solution in the receiving flask converts the ammonia gas into the ammonium ion, and simultaneously converts the boric acid to the borate ion:
NH3 + H3BO3 (boric acid) ---> NH4+ + H2BO3
- (borate ion) (3)
Titration
The nitrogen content is then estimated by titration of the ammonium borate formed with standard sulfuric or hydrochloric acid, using a suitable indicator to determine the end-point of the reaction.
H2BO3- + H+ ---> H3BO3 (4)
The concentration of hydrogen ions (in moles) required to reach the end-point is equivalent to the concentration of nitrogen that was in the original food (Equation 3). The following equation can be used to determine the nitrogen concentration of a sample that weighs m grams using a xM HCl acid solution for the titration:
Where vs and vb are the titration volumes of the sample and blank, and 14g is the molecular weight of nitrogen N. A blank sample is usually ran at the same time as the material being analyzed to take into account any residual nitrogen which may be in the reagents used to carry out the analysis. Once the nitrogen content has been determined it is converted to a protein content using the appropriate conversion factor: %Protein = FX %N.
Advantages and Disadvantages
Advantages. The Kjeldahl method is widely used internationally and is still the standard method for comparison against all other methods. Its universality, high precision and good reproducibility have made it the major method for the estimation of protein in foods.
Disadvantages. It does not give a measure of the true protein, since all nitrogen in foods is not in the form of protein. Different proteins need different correction factors because they have different amino acid sequences. The use of concentrated sulfuric acid at high temperatures poses a considerable hazard, as does the use of some of the possible catalysts The technique is time consuming to carry-out.
Reagents and Apparatuses
The following were the chemicals used in determination of protein in commercial food: Concentrated H2SO4, K2SO4, HgO, cold boric acid solution, methyl red indicator, concentrated NaOH solution and standard HCl solution.
The things used in carrying out this analysis were the following: Kjeldahl flask, pipet, aspirator, analytical balance, spatula, distillation apparatus, hot plate, funnel, Erlenmeyer flask, steam generator, buret and iron stand.
Procedure
One gram of food sample (Cerelac) was weighed and transferred to a kjeldahl flak. The sample was then added with 12.5 mL conc. sulfuric acid, 3.5 g potassium sulfate and 0.35xx g of HgO. A short-stemmed funnel was placed in the neck of flask and the flask was heated in a fume hood at 30° angle vertical position. The heating was continued until the mixture turned into a clear solution. It was then cooled and the neck of the funnel was rinsed down with 100 mL cold distilled water. The flask was connected in the distillation apparatus and the water in the steam generator was heated but the solution was not yet passed through. In the absorbing flask, 50 mL of cold boric acid was placed and was then added with b3 drops of methyl red indicator. The absorbing flask was also installed in the set up. The concentrated NaOH was slowly added to the flask thru a separatory funnel and followed by 25 mL thiosulfate solution to precipitate HgS. The stop cock was closed and all the connecting tubes and stoppers are sealed tight; also, a rapid stream of water must pass thru the condenser. The steam generator was then connected and allowed to pass thru the solution. The hotplates were then turned on and distillation was started. The process was continued until the volume of solution in the absorbing flask reached 200 mL. The distillate was then titrated with standard HCl and percent protein and nitrogen were then calculated. The formulae used are shown below.
Equation 13. %N =
Equation 14. %Protein =
*6.25
Report of Analysis
Table 14. Protein Determination in a Commercial Product
Mass of sample, g VHCl, L % N % Protein
1.5028 0.0025 2.25 14.08
Aside from those major experiments stated above, we had also conducted the following minor experiments by passing:
1. Preparation of 30 liters of 6N H2SO4 from 36N H2SO4
2. Spectrophotometric Comparison of the Reducing Powers of the Vitamin C and Plant Extract
3. Purification and Recrystallization of NaCl
4. Wet Ashing and Dry Ashing
5. Correcting concentrations of solutions to desired one
Not only our laboratory skills had been harnessed in this OJT, but also our supervision skills and how to facilitate other students to make them learn. The MSU-IIT Chemistry Department also accepts OJT from Philippine Science High School students, and from the start of their training, we had also facilitated them in the laboratory. Talks about their future endeavor now includes being a chemist, as I am good at persuasion. One time, we had been grouped with the few of them, and my group had been assigned to make 6N H2SO4 from 36N H2SO4. As beginners in the laboratory, they don't know how to practiced proper mannerism in the lab yet, they talked a lot, and most often handled chemicals without the utmost care. And since the Kuya I am, I taught them the basics. And during their week ending, they had this practical exam, and we were the one who prepared and oversee the set-ups, and even the one to actually grade them. Nevertheless, I enjoyed their company and will perhaps always remember the constant bickering they do with each other.
One thing I appreciate about our supervisor is her passion to embed in us permanently the experiments we had conducted by having this follow-up exam about our past analysis. With the analysis actually done by my own hands, and the calculations still fresh in my mind, I find the exam easy. Though I couldn't have stroked it perfectly, perhaps my score would be enough to land me 2nd place in the board exam. Hehe.
Near the end of our training, we had toured the different laboratories in the department. We had started with the BioInorganic Chemistry Research Laboratory, where we had met a CMU teacher undergoing her PhD study there, Ma'am Inot. She herself had explained to us the importance of the laboratory and the rigors of their studies. Two of them there are studying the protein profile of plants, and thirteen plants as such. In here, they used the Electrophoresis technique to separate proteins in plants, and bind them with lead metal. Seems easy at the sound of it, but no, the intricacy of their study had abled them to make more attempts and failed gels because the tincture that they'd used easily hardens. This study is further continued by Ma'am Inot, where she's task to travel to Australia for amino acid profiling of this lead-binding proteins. Lead-binding proteins is an example of a phytoremediation, where living things accumulate inorganic substances to extend their mechanisms of survival in the nest their in.
Next up is the Tuklas Lunas Laboratory, where we'd been toured in their 7 million High Performance Liquid Chromatography (HPLC) machine. The HPLC is such an intricate facility that always left me in awe. This HPLC, however, is installed in reverse phase process, that is the solvent induction starts from polar to non-polar. The small cheap alone for the injector's bottom cost a dangling 30 thousand, and the other parts are as costly as such, and I wouldn't mention the staggering prices in here. In this laboratory, they employed three solvents (though in some instances, when samples doesn't suit the solvent, they also perform solvent testing, off course via Thin Layer Chromatography (TLC) first), methane, water, and 40% methanol. They had also conducted a run-down reading for us with the machine, and they'd explain that the separation of components in sample can be categorized by separation by time, or separation by peaks, in which the latter had been shown. Aside from the HPLC, they had also this Freeze Drier to evaporate water molecules without putting into destruction other components of samples to be dried. This apparatus must have a minimum temperature of -20°C and pressure of 25 Pa, and is a more efficient one as against the rotary evaporator. The outside seems at peace, at normal temperature, but I couldn't help thinking that the inside traverses the coldness of the arctic. And oh, they had also explained to us the Gravity Column Chromatography (GCC), which they said is a tedious one because the separation would take you days to accomplished, and the result wouldn't been as satisfying. Here though, in normal phase, the silica column be washed first with hexane and/or chloroform and/or methanol.
Opening another door, now we arrived at the Computational Chemistry laboratory. There's nothing so special about this laboratory if you just based it on the lab furnishings. The true wonders lie within the technology itself, the instant wonders that the computers can do. So, there had been a thorough lecture about the said subject, and the best part: putting those principles in to action, though inside the computer and the output displayed in the monitor. Computational chemistry is simply the application of chemical, mathematical and computing skills to the solution of interesting chemical problems. It uses computers to generate information such as properties of molecules or simulated experimental results. Some common computer software used for computational chemistry includes:
GaussiansGAMESSMOPACSpartanSybyl
Computational chemistry has become a useful way to investigate materials that are too difficult to find or too expensive to purchase. It also helps chemists make predictions before running the actual experiments so that they can be better prepared for making observations. Indeed, in here we can view the whole reaction involving the reactants, and we'll be able to see the intermediates before the products are formed. This is extremely important in experiments with increments that include super high temperature, because instead of performing the actual rigorous experimentation, you still get to gather the same result with the use of the softwares mentioned above in much lesser cost, and so time efficient.
PERSONAL INSIGHTS ON THE PRACTICUM
IMPRESSIONS
Offshoot from there, even before we had traveled in Iligan, I had always known that the MSU-IIT Chemistry Department is a leading frontier in their field. I'd say that because we had visited their laboratory during our field trip when we're still in 2nd year college, and honestly, I had left there with my jaw hanging in awe. So to be accepted to have my OJT in this prestigious institution, I felt blessed and was already at yearned to start then. Though, the Chem 98 is designed to let the students came into reality of our chosen course in the industries, and that MSU-IIT is hardly an industry, my expectations beforehand weren't put in vain, because the thoroughfare of knowledge there is so vast I seemed not to accumulate all. The workplace is fully furnished with apparatuses, and every experiment do yield high variability of result and less error.
Our supervisor, too, is an equipped chemistry deity. She's so brilliant and could easily retrieved a formula/idea/principle from her narrowest corner of memory. She could even mentioned the molecular weights of compounds at a flash, including the decimal digits off course. And most of all, she has this motherly instincts of teaching us in a way of embedding to us the knowledge permanently, and even given us an examination. She's patient and doesn't set-forth to get your flaws right, but rather she want you to get your flaws right on your own, but off course, with her proper instruction.
And the experiments we had conducted, wow, I'd say we'll be the best titrators in town for we had touched titrations from iodometric to complxiometric. Oh, think I should stop typing 'coz all I'd be saying would just be all in positive light.
PROBLEMS ENCOUNTERED
As nice as the workplace was, off course certain problems always prevail, deemed inevitable. Like for one, the impending hot temperature of the place that always left me in pools of sweat. But beyond that, in the laboratory, problems encountered were mostly basics and can have a direct remedy, like the usual instances of having the distilled water easily consummated, and the solution to that problem is right at the front door, a bottle of water lay unopened.
RECOMMENDATIONS
I judged our ojt in the MSU-IIT was a good one. I can say this because the experience left me with knowledge that is hard to believe in just a month-long endeavor, but please believe, the living proof is typing. And so first, I would recommend that our department would continually send OJT's there. And that the OJT adviser should at least visit the workplace once for an observation imbued with sufficient budget from the department. Secondly, the Chem 98 manual should be revised, or better yet renewed to come up with a more appropriate Performance Evaluation Criteria and have the list of innumeracy companies be refreshed. Moreover, proper dissemination of information must be taken into account.