Embed Size (px)
Citation preview

2015-16DEPARTMENT OF MBA
G.M.(AUTO.)COLLEGE,SAMBALPUR
Research methodology
Topic - Employee satisfaction of LIC.
Submitted by- K Renuka
Patnaik 2nd Sem.
Date:- 10/04/15
Page 1

INTRODUCTION
Insurance is a social device where uncertain risks of individuals may be
combined in a group and thus made more certain, small periodic contributions by the
individuals provide a found out of which those who suffer losses may be reimburse.
Life Insurance in its modern form came to India from England in the year
1818. Oriental Life Insurance Company started by Europeans in Calcutta was the first
life insurance company on Indian Soil. All the insurance companies established during
that period were brought up with the purpose of looking after the needs of European
community and Indian natives were not being insured by these companies. However,
later with the efforts of eminent people like Babu Muttylal Seal, the foreign life
insurance companies started insuring Indian lives. The Parliament of India passed the
Life Insurance Corporation Act on the 19th of June 1956, and the Life Insurance
Corporation of India was created on 1st September, 1956. Its headquarter is in
Mumbai. Today LIC functions with 2048 fully computerized branch offices, 109
divisional offices, 8 zonal offices, 992 satellite offices and the corporate office.
LIC's slogan yogakshemam vahamyaham is in Sanskrit language which
translates in English as "Your welfare is our responsibility". This is derived from
ancient Hindu text, the Bhagavad Gita's 9th chapter, 22nd verse. The slogan can be
seen in the logo, written in Devanagari script. LIC offers a variety of insurance
products to its customers such as insurance plans, pension plans, special plans and
group schemes. Its mission is to explore and enhance the quality of life of people
through financial security by providing products and services of aspired attributes with
competitive returns, and by rendering resources for economic development.
Page 2

REVIEW OF LITERATURE
EMMANUEL SAVIO , Roll No. 8246 student of St. Andrews College, Bandra,
in the Third year Bachelor of commerce in Banking and Insurance (Semester VI) , has
completed the research report on the topic of “INSURANCE (LIC): Market Research”
in the academic year 2011-2012.
Its research objectives were :-
1. To give the brief background of the sector and proceeds to highlight the short
comings of the existing setup and players.
2. The benefits of liberalized sector are enumerated.
3. The report also tries to identify the market potential for insurance products and the
strategy that can be employed to exploit the same.
4. The stress is also given on knowing the awareness level of general public.
During this research, Descriptive and Exploratory approach was taken into
consideration because of the availability of relevant information to describe the
relationships between the marketing problem and the available information.
Arul Minash Rajkumar, Research Scholar, Sathyabama University,
Chennai 600 119, has completed the research report on the topic of
“INSURANCE (LIC): Customer Satisfaction” in the academic year 2011-2012.
This project was undertaken with the purpose to take a survey in the market,
various insurance policy holder with the special reference to MaxNewYork Life
Insurance with an aim to analysis what the customer has in mind for taking a
particular insurance policy for a reason from a particular company, influencing factors
to take insurance policies, awareness of various promotional packages, policies
offered by the insurance companies, evaluation of various services of offered by the
company as well as the agent.
Objectives Of his Study :-
Page 3

To find the level of customer satisfaction of various life insurance policies
offered
by Max New York Life insurance.
To find out the socio economic profile of the Insurance Investors.
To identify the customer preference towards life insurance policies of
MaxNewYork Life Insurance.
To analyze the strength and weakness of the life insurance policies of
MaxNewYork Life Insurance.
To study the various factors that influences the customer to choose life
insurance policy.
For this research study the following statistical tools are used to find out the results of
the study:-
1. Simple percentage analysis
2. Chi-Square Test Analysis
3. Spearman’s Rank correlation
4. Yule’s coefficient of association
Page 4

RESEARCH DESIGN
RESEARCH OBJECTIVE
Here the research objective is to measure the satisfaction level of the
employees of LIC.
RESEARCH METHODOLOGY
To conduct the market research first of all it is necessary to create a research
design. A research design is basically a blue print of how a research is to be
conducted. It is the conceptual structure within which research is conducted.
Basically there are 3 types of approaches used during any research:
1. Exploratory
2. Descriptive
3. Hypothesis testing.
During this research Hypothesis testing approach is taken into consideration.
TYPES OF DATA USED:
Both primary and secondary data is used in the research.
SECONDARY DATA:
Secondary data is one which already exists and is collected from the published sources. The source from which secondary data was collected Internet.
PRIMARY DATA:
The primary sources of data refer to the first hand Information. Primary data is collected during the survey with the help of Questionnaires
SCALING TECHNIQUES:
It uses both Nominal and Interval scales.
- Question number one of the Questionnaire uses nominal scale .
Page 5

[ Q-IDO1-Please tell us your age:
Less than 15 years 01(TERMINATE) 26-35Years 03
15-25 Years 02 more than 35 years 04 ]
- Whereas the rest of the questions from 3-10 uses interval scale.
STATISTICAL METHODS:
Parametric Inferential Statistical procedure such as t-tests has been used in
this research. It can be used to determine if two sets of data are significantly different
from each other. Basically, calculation of the t-test concerns differences between the
groups compared to within-group differences. The calculation of the t-test focuses on
determining whether the groups in the sample score more like each other compared
to the comparison group or that there is no difference in dependent measure scores
within or between groups. Levels of significance refer to the probability of accepting or
rejecting a null hypothesis. A null hypothesis means there is no difference between
compared groups. Basically, the level of significance is the chance of an error
occurring in the rejection of the null hypothesis.
Page 6

ANALYSIS & FINDINGS
QUESTIONNAIRE ANALYSIS (Graphical Form):
Total Respondents =60
Page 7

T-test
H 0: Average Satisfaction basis infrastructure = Average Satisfaction basis pay scale.
H 1: Average Satisfaction basis infrastructure ≠ Average Satisfaction basis pay scale.
H 0: Average Satisfaction basis pay scale = Average Satisfaction basis work schedule.
H 1: Average Satisfaction basis pay scale ≠ Average Satisfaction basis work schedule.
Page 8
t-Test: Paired Two Sample for Means
ID04 ID05Mean 3.95 4.3Variance 0.794068 0.823728814Observations 60 60Pearson Correlation 0.458956Hypothesized Mean Difference 0df 59t Stat -2.89757P(T<=t) one-tail 0.002635t Critical one-tail 1.671093P(T<=t) two-tail 0.00527t Critical two-tail 2.000995
t-Test: Paired Two Sample for Means
ID03 ID04Mean 4.45 3.95Variance 0.760169 0.794067797Observations 60 60Pearson Correlation 0.618468Hypothesized Mean Difference 0df 59t Stat 5.02849P(T<=t) one-tail 2.46E-06t Critical one-tail 1.671093P(T<=t) two-tail 4.91E-06t Critical two-tail 2.000995

Since the two tailed P value is more than 0.05 the null hypothesis is accepted.Since the two tailed P value is less than 0.05 the null hypothesis is rejected.
H 0: Average Satisfaction basis work schedule = Average Satisfaction basis safety & security.
H 1: Average Satisfaction basis work schedule ≠ Average Satisfaction basis safety & security.
H 0: Average Satisfaction basis safety & security = Average Satisfaction basis canteen facilities.
H 1: Average Satisfaction basis safety & security ≠ Average Satisfaction basis canteen facilities.
Page 9
t-Test: Paired Two Sample for Means
ID06 ID07Mean 4.083333 2.7Variance 0.95904 1.53559322Observations 60 60Pearson Correlation 0.384082Hypothesized Mean Difference 0df 59t Stat 8.572397P(T<=t) one-tail 2.97E-12t Critical one-tail 1.671093P(T<=t) two-tail 5.93E-12t Critical two-tail 2.000995

Since the two tailed P value is more than 0.05 the null hypothesis is accepted.
Since the two tailed P value is more than 0.05 the null hypothesis is accepted.
H 0: Average Satisfaction basis canteen facilities = Average Satisfaction basis cleanliness maintained.
H 1: Average Satisfaction basis canteen facilities ≠ Average Satisfaction basis cleanliness maintained.
H 0: Average Satisfaction basis cleanliness maintained = Average Satisfaction basis increments and bonus provided.
H 1: Average Satisfaction basis cleanliness maintained ≠ Average Satisfaction basis increments and bonus provided.
Since the two tailed P value is more than 0.05 the null hypothesis is accepted.
Since the two tailed P value is less than 0.05 the null hypothesis is rejected.
Page 10
t-Test: Paired Two Sample for Means
ID05 ID06Mean 4.3 4.083333333Variance 0.823729 0.959039548Observations 60 60Pearson Correlation 0.467201Hypothesized Mean Difference 0df 59t Stat 1.719848P(T<=t) one-tail 0.045351t Critical one-tail 1.671093P(T<=t) two-tail 0.090702t Critical two-tail 2.000995
t-Test: Paired Two Sample for Means
ID07 ID08Mean 2.7 3.883333333Variance 1.535593 0.952259887Observations 60 60Pearson Correlation 0.40507Hypothesized Mean Difference 0df 59t Stat -7.4637P(T<=t) one-tail 2.22E-10t Critical one-tail 1.671093P(T<=t) two-tail 4.43E-10t Critical two-tail 2.000995
t-Test: Paired Two Sample for Means
ID08 ID09Mean 3.883333333 3.25Variance 0.952259887 1.75Observations 60 60Pearson Correlation 0.390605351Hypothesized Mean Difference 0df 59t Stat 3.769456973P(T<=t) one-tail 0.000190267t Critical one-tail 1.671093033P(T<=t) two-tail 0.000380535t Critical two-tail 2.000995361

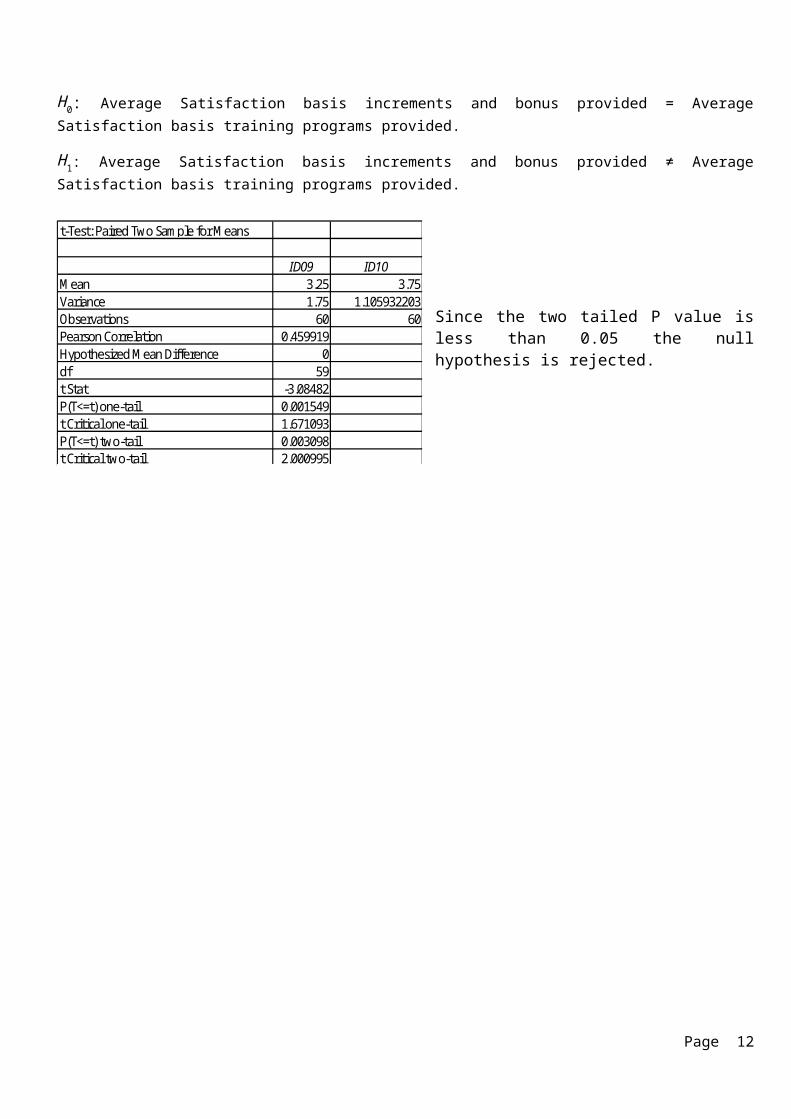
H 0: Average Satisfaction basis increments and bonus provided = Average Satisfaction basis training programs provided.
H 1: Average Satisfaction basis increments and bonus provided ≠ Average Satisfaction basis training programs provided.
Since the two tailed P value is less than 0.05 the null hypothesis is rejected.
Page 11
t-Test: Paired Two Sample for Means
ID09 ID10Mean 3.25 3.75Variance 1.75 1.105932203Observations 60 60Pearson Correlation 0.459919Hypothesized Mean Difference 0df 59t Stat -3.08482P(T<=t) one-tail 0.001549t Critical one-tail 1.671093P(T<=t) two-tail 0.003098t Critical two-tail 2.000995
CONCLUSION
After studying the overall situation in the LIC we come to the conclusion that:
i) Above 80% of employees are more than 35 years old and are married.
ii) Majority of employees are extremely satisfied with the infrastructure and
working hours of LIC and almost all are extremely dissatisfied with the
canteen facilities provided.
iii) Majority of employees are somewhat satisfied with the pay scale, safety and
security, cleanliness, increments and trainings provided.
iv) Average satisfaction level of employees on the basis of infrastructure is equal
to average satisfaction level of employees on the basis of pay scale.
v) Average satisfaction level of employees on the basis of pay scale is not equal
to average satisfaction level of employees on the basis of work schedule.
vi) Average satisfaction level of employees on the basis of work schedule is
equal to average satisfaction level of employees on the basis of safety &
security provided.
vii) Average satisfaction level of employees on the basis of safety & security is
equal to average satisfaction level of employees on the basis of canteen
facilities.
viii) Average satisfaction level of employees on the basis of canteen facilities is
equal to average satisfaction level of employees on the basis of cleanliness
maintained.
ix) Average satisfaction level of employees on the basis of cleanliness
maintained is not equal to average satisfaction level of employees on the
basis of increments and bonus provided.
x) Average satisfaction level of employees on the basis of increments and bonus
provided is not equal to average satisfaction level of employees on the basis
of training programs provided.
Page 12

REFERENCES
http://www.licindia.in
http://www.slideshare.net/pawarina/lic-presentation-001
http://www.slideshare.net/and_rey19/lic-projct
http://www.slideshare.net/anshutiwari456/marketing-strategy-of-lic
http://www.slideshare.net/musicoholic/lic-india-a
http://www.slideshare.net/kinshookc/presentation-on-lic-of-india
Page 13