Embed Size (px)
Citation preview
Introduction • 1November 1995
NATIONAL POLLUTION PREVENTION CENTER FOR HIGHER EDUCATION
Pollution Preventionand Industrial Ecology
Industrial Ecology:An IntroductionBy Andy Garner, NPPC Research Assistant; andGregory A. Keoleian, Ph.D., Assistant Research Scientist, University of Michigan School of Natural Resources and Environment, and NPPC Research Manager
National Pollution Prevention Center for Higher Education • University of Michigan May be reproducedDana Building, 430 East University, Ann Arbor MI 48109-1115 freely for non-commercial734.764.1412 • fax 734.647.5841 • [email protected] • www.umich.edu/~nppcpub educational purposes.
Background ................................................................. 2
Industrial Ecology: Toward a Definition ................... 3Historical Development......................................... 3Defining Industrial Ecology ................................... 4Teaching Industrial Ecology .................................. 4Industrial Ecology as a Field of Ecology .............. 5
Goals of Industrial Ecology ........................................ 5Sustainable Use of Resources ............................. 6Ecological and Human Health .............................. 6Environmental Equity............................................ 6
Key Concepts of Industrial Ecology ......................... 6Systems Analysis .................................................. 6Material & Energy Flows & Transformations ........ 6Multidisciplinary Approach .................................. 10Analogies to Natural Systems ............................ 10Open- vs. Closed-Loop Systems........................ 11
Strategies for Environmental Impact Reduction:Industrial Ecology as a Potential Umbrellafor Sustainable Development Strategies ................. 12
System Tools to Support Industrial Ecology.......... 12Life Cycle Assessment ....................................... 12
Components ........................................................ 13Methodology ........................................................ 13Applications ......................................................... 20Difficulties ............................................................ 20
Life Cycle Design & Design for Environment ....... 21Needs Analysis ....................................................21Design Requirements ......................................... 21Design Strategies ............................................... 24Design Evaluation ............................................... 25
Future Needs ............................................................. 26
Further Information .................................................. 26
Endnotes .................................................................... 27
Appendix A: Industrial Symbiosis at Kalundborg .. 28
Appendix B: Selected Definitions ........................... 31
List of TablesTable 1: Organizational Hierarchies ................................. 2Table 2: Worldwide Atmospheric Emissions of
Trace Metals (Thousand Tons/Year) ................... 9Table 3: Global Flows of Selected Materials .................... 9Table 4: Resources Used in Automaking........................ 10Table 5: General Difficulties and Limitations of
the LCA Methodology ....................................... 20Table 7: Issues to Consider When Developing
Environmental Requirements ........................... 23Table 8: Strategies for Meeting Environmental
Requirements ................................................... 24Table 9: Definitions of Accounting and Capital
Budgeting Terms Relevant to LCD ................... 25
List of FiguresFigure 1: The Kalundborg Park ....................................... 3Figure 2: World Extraction, Use, and Disposal
of Lead, 1990 (thousand tons) ......................... 7Figure 3: Flow of Platinum Through Various Product
Systems ........................................................... 8Figure 4: Arsenic Pathways in U.S., 1975. ...................... 8Figure 5: System Types ................................................ 11Figure 6: Technical Framework for LCA ........................ 13Figure 7: The Product Life Cycle System...................... 14Figure 9: Flow Diagram Template ................................. 15Figure 8: Process Flow Diagram ................................... 15Figure 10: Checklist of Criteria With Worksheet ............. 16Figure 11: Detailed System Flow Diagram for Bar Soap .. 18Figure 12: Impact Assessment Conceptual Framework .. 19Figure 13: Life Cycle Design ........................................... 22Figure 14: Requirements Matrices .................................. 23
2 • IntroductionNovember 1995
Environmental problems are systemic and thus requirea systems approach so that the connections between in-dustrial practices/human activities and environmental/ecological processes can be more readily recognized.A systems approach provides a holistic view of envi-ronmental problems, making them easier to identifyand solve; it can highlight the need for and advantagesof achieving sustainability. Table 1 depicts hierarchiesof political, social, industrial, and ecological systems.Industrial ecology studies the interaction between dif-ferent industrial systems as well as between industrialsystems and ecological systems. The focus of studycan be at different system levels.
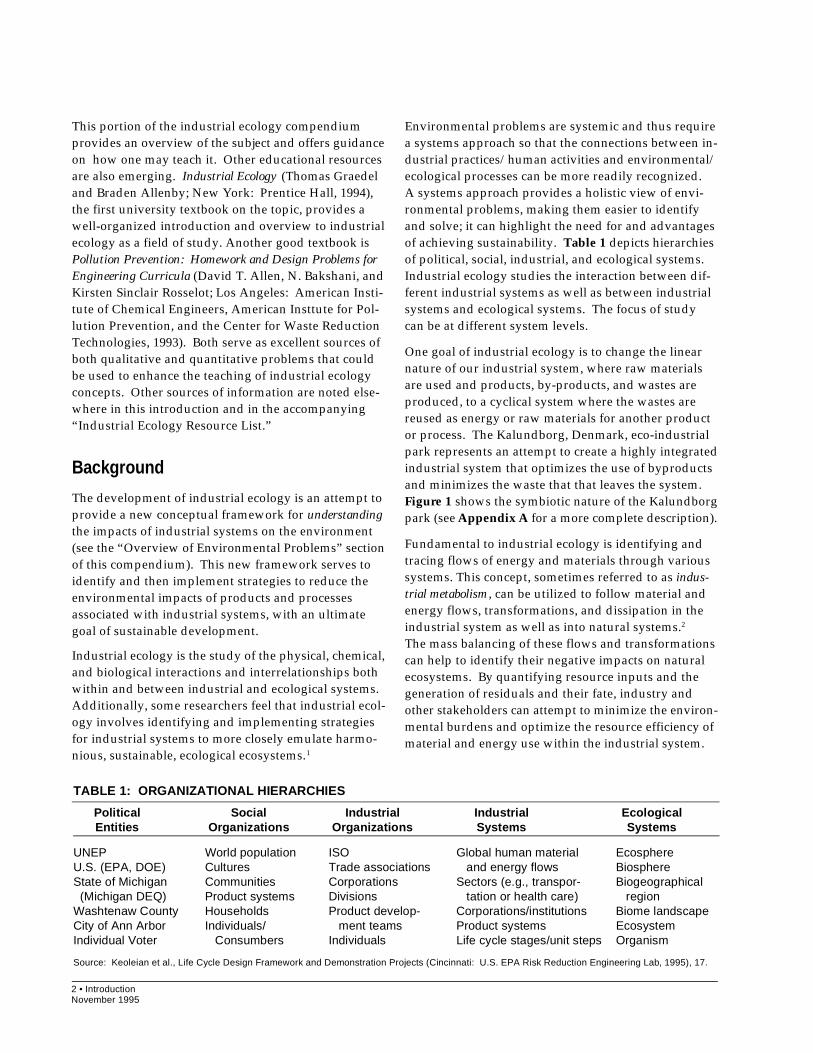
One goal of industrial ecology is to change the linearnature of our industrial system, where raw materialsare used and products, by-products, and wastes areproduced, to a cyclical system where the wastes arereused as energy or raw materials for another productor process. The Kalundborg, Denmark, eco-industrialpark represents an attempt to create a highly integratedindustrial system that optimizes the use of byproductsand minimizes the waste that that leaves the system.Figure 1 shows the symbiotic nature of the Kalundborgpark (see Appendix A for a more complete description).
Fundamental to industrial ecology is identifying andtracing flows of energy and materials through varioussystems. This concept, sometimes referred to as indus-trial metabolism , can be utilized to follow material andenergy flows, transformations, and dissipation in theindustrial system as well as into natural systems.2
The mass balancing of these flows and transformationscan help to identify their negative impacts on naturalecosystems. By quantifying resource inputs and thegeneration of residuals and their fate, industry andother stakeholders can attempt to minimize the environ-mental burdens and optimize the resource efficiency ofmaterial and energy use within the industrial system.
This portion of the industrial ecology compendiumprovides an overview of the subject and offers guidanceon how one may teach it. Other educational resourcesare also emerging. Industrial Ecology (Thomas Graedeland Braden Allenby; New York: Prentice Hall, 1994),the first university textbook on the topic, provides awell-organized introduction and overview to industrialecology as a field of study. Another good textbook isPollution Prevention: Homework and Design Problems forEngineering Curricula (David T. Allen, N. Bakshani, andKirsten Sinclair Rosselot; Los Angeles: American Insti-tute of Chemical Engineers, American Insttute for Pol-lution Prevention, and the Center for Waste ReductionTechnologies, 1993). Both serve as excellent sources ofboth qualitative and quantitative problems that couldbe used to enhance the teaching of industrial ecologyconcepts. Other sources of information are noted else-where in this introduction and in the accompanying“Industrial Ecology Resource List.”
Background
The development of industrial ecology is an attempt toprovide a new conceptual framework for understandingthe impacts of industrial systems on the environment(see the “Overview of Environmental Problems” sectionof this compendium). This new framework serves toidentify and then implement strategies to reduce theenvironmental impacts of products and processesassociated with industrial systems, with an ultimategoal of sustainable development.
Industrial ecology is the study of the physical, chemical,and biological interactions and interrelationships bothwithin and between industrial and ecological systems.Additionally, some researchers feel that industrial ecol-ogy involves identifying and implementing strategiesfor industrial systems to more closely emulate harmo-nious, sustainable, ecological ecosystems.1
TABLE 1: ORGANIZATIONAL HIERARCHIES
Political Social Industrial Industrial EcologicalEntities Organizations Organizations Systems Systems
UNEP World population ISO Global human material EcosphereU.S. (EPA, DOE) Cultures Trade associations and energy flows BiosphereState of Michigan Communities Corporations Sectors (e.g., transpor- Biogeographical (Michigan DEQ) Product systems Divisions tation or health care) regionWashtenaw County Households Product develop- Corporations/institutions Biome landscapeCity of Ann Arbor Individuals/ ment teams Product systems EcosystemIndividual Voter Consumbers Individuals Life cycle stages/unit steps Organism
Source: Keoleian et al., Life Cycle Design Framework and Demonstration Projects (Cincinnati: U.S. EPA Risk Reduction Engineering Lab, 1995), 17.
Introduction • 3November 1995
Industrial ecology is an emerging field. There is muchdiscussion and debate over its definition as well as itspracticality. Questions remain concerning how it over-laps with and differs from other more established fieldsof study. It is still uncertain whether industrial ecologywarrants being considered its own field or should beincorporated into other disciplines. This mirrors thechallenge in teaching it. Industrial ecology can be taughtas a separate, semester-long course or incorporated intoexisting courses. It is foreseeable that more collegesand universities will begin to initiate educational andresearch programs in industrial ecology.
Industrial Ecology: Toward a Definition
Historical DevelopmentIndustrial ecology is rooted in systems analysis andis a higher level systems approach to framing the inter-action between industrial systems and natural systems.This systems approach methodology can be traced tothe work of Jay Forrester at MIT in the early 1960s and70s; he was one of the first to look at the world as aseries of interwoven systems (Principles of Systems,1968, and World Dynamics, 1971; Cambridge, Wright-Allen Press). Donella and Dennis Meadows and others
furthered this work in their seminal book Limits toGrowth (New York: Signet, 1972). Using systemsanalysis, they simulated the trends of environmentaldegradation in the world, highlighting the unsustainablecourse of the then-current industrial system.
In 1989, Robert Ayres developed the concept ofindustrial metabolism: the use of materials and energyby industry and the way these materials flow throughindustrial systems and are transformed and thendissipated as wastes.3 By tracing material and energyflows and performing mass balances, one could identifyinefficient products and processes that result in indus-trial waste and pollution, as well as determine steps toreduce them. Robert Frosch and Nicholas Gallopoulos,in their important article “Strategies for Manufacturing”(Scientific American 261; September 1989, 144–152),developed the concept of industrial ecosystems, whichled to the term industrial ecology. Their ideal industrialecosystem would function as “an analogue” of its bio-logical counterparts. This metaphor between industrialand natural ecosystems is fundamental to industrialecology. In an industrial ecosystem, the waste producedby one company would be used as resources by another.No waste would leave the industrial system or nega-tively impact natural systems.
FIGURE 1: THE KALUNDBORG PARK
4 • IntroductionNovember 1995
There is substantial activity directed at the productlevel using such tools as life cycle assessment and lifecycle design and utilizing strategies such as pollutionprevention. Activities at other levels include tracingthe flow of heavy metals through the ecosphere.
A cross-section of definitions of industrial ecology isprovided in Appendix B. Further work needs to bedone in developing a unified definition. Issues toaddress include the following.
• Is an industrial system a natural system?Some argue that everything is ultimately natural.
• Is industrial ecology focusing on integrating indus-trial systems into natural systems, or is it primarilyattempting to emulate ecological systems? Or both?
• Current definitions rely heavily on technical, engi-neered solutions to environmental problems. Someauthors believe that changing industrial systems willalso require changes in human behavior and socialpatterns. What balance between behavioral changesand technological changes is appropriate?
• Is systems analysis and material and energyaccounting the core of industrial ecology?
Teaching Industrial Ecology
Industrial ecology can be taught as a separate courseor incorporated into existing courses in schools of engi-neering, business, public health and natural resources.Due to the multidisciplinary nature of environmentalproblems, the course can also be a multidisciplinary of-fering; the sample syllabi offered in this compendiumillustrate this idea. Degrees in industrial ecologymight be awarded by universities in the future.4
Chauncey Starr has written of the need for schools ofengineering to lead the way in integrating an interdis-ciplinary approach to environmental problems in thefuture. This would entail educating engineers so thatthey could incorporate social, political, environmentaland economic factors into their decisions about the usesof technology.5 Current research in environmentaleducation attempts to integrate pollution prevention,sustainable development, and other concepts and strategies into the curriculum. Examples includeenvironmental accounting, strategic environmentalmanagement, and environmental law.
In 1991, the National Academy of Science’s Colloqiumon Industrial Ecology constituted a watershed in thedevelopment of industrial ecology as a field of study.Since the Colloqium, members of industry, academiaand government have sought to further characterizeand apply it. In early 1994, The National Academy ofEngineering published The Greening of Industrial Eco-systems (Braden Allenby and Deanna Richards, eds.).The book brings together many earlier initiatives andefforts to use systems analysis to solve environmentalproblems. It identifies tools of industrial ecology, suchas design for the environment, life cycle design, andenvironmental accounting. It also discusses the inter-actions between industrial ecology and other disciplinessuch as law, economics, and public policy.
Industrial ecology is being researched in the U.S. EPA’sFutures Division and has been embraced by the AT&TCorporation. The National Pollution Prevention Centerfor Higher Education (NPPC) promotes the systemsapproach in developing pollution prevention (P2) edu-cational materials. The NPPC’s research on industrialecology is a natural outgrowth of our work in P2.
Defining Industrial Ecology
There is still no single definition of industrial ecologythat is generally accepted. However, most definitionscomprise similar attributes with different emphases.These attributes include the following:
• a systems view of the interactions betweenindustrial and ecological systems
• the study of material and energy flows andtransformations
• a multidisciplinary approach
• an orientation toward the future
• a change from linear (open) processes tocyclical (closed) processes, so the waste fromone industry is used as an input for another
• an effort to reduce the industrial systems’environmental impacts on ecological systems
• an emphasis on harmoniously integratingindustrial activity into ecological systems
• the idea of making industrial systems emulatemore efficient and sustainable natural systems
• the identification and comparison of industrial andnatural systems hierarchies, which indicate areas ofpotential study and action (see Table 1).
Introduction • 5November 1995
Industrial Ecology as a Field of Ecology
The term “Industrial Ecology” implies a relationship tothe field(s) of ecology. A basic understanding of ecologyis useful in understanding and promoting industrialecology, which draws on many ecological concepts.
Ecology has been defined by the Ecological Society ofAmerica (1993) as:
The scientific discipline that is concernedwith the relationships between organisms andtheir past, present, and future environments.These relationships include physiological re-sponses of individuals, structure and dynamicsof populations, interactions among species,organization of biological communities, andprocessing of energy and matter in ecosystems.
Further, Eugene Odum has written that:
... the word ecology is derived from theGreek oikos, meaning “household,” combinedwith the root logy, meaning “the study of.”Thus, ecology is, literally the study of house-holds including the plants, animals, microbes,and people that live together as interdependentbeings on Spaceship Earth. As already, theenvironmental house within which we placeour human-made structures and operate ourmachines provides most of our vital biologicalnecessities; hence we can think of ecology asthe study of the earth’s life-support systems.6
In industrial ecology, one focus (or object) of study isthe interrelationships among firms, as well as amongtheir products and processes, at the local, regional,national, and global system levels (see Table 1). Theselayers of overlapping connections resemble the foodweb that characterizes the interrelatedness of organismsin natural ecological systems.
Industrial ecology perhaps has the closest relationshipwith applied ecology and social ecology. According tothe Journal of Applied Ecology, applied ecology is:
. . . application of ecological ideas, theoriesand methods to the use of biological resourcesin the widest sense. It is concerned with theecological principles underlying the manage-ment, control, and development of biologicalresources for agriculture, forestry, aquaculture,nature conservation, wildlife and game manage-ment, leisure activities, and the ecological effectsof biotechnology.
The Institute of Social Ecology’s definition of socialecology states that:
Social ecology integrates the study of humanand natural ecosystems through understandingthe interrelationships of culture and nature. Itadvances a critical, holistic world view and sug-gests that creative human enterprise can constructan alternative future, reharmonizing people’s re-lationship to the natural world by reharmonizingtheir relationship with each other.7
Ecology can be broadly defined as the study of the in-teractions between the abiotic and the biotic compo-nents of a system. Industrial ecology is the study of theinteractions between industrial and ecological systems;consequently, it addresses the environmental effects onboth the abiotic and biotic components of the ecosphere.Additional work needs to be done to designate indus-trial ecology’s place in the field of ecology. This willoccur concurrently with efforts to better define thediscipline and its terminology.
There are many textbooks that introduce ecologicalconcepts and principles. Examples include RobertRicklefs’ Fundamentals of Ecology (3rd edition; New York:W. H. Freeman and Company, 1990), Eugene Odum’sEcology and Our Endangered Life-Support Systems, andEcology: Individuals, Populations and Communities byMichael Begens, John Harper, and Colin Townsend(London: Blackwell Press, 1991).
Goals of Industrial Ecology
The primary goal of industrial ecology is to promotesustainable development at the global, regional, andlocal levels.8 Sustainable development has beendefined by the United Nations World Commission onEnvironment and Development as “meeting the needsof the present generation without sacrificing the needsof future generations.”9 Key principles inherent tosustainable development include: the sustainable useof resources, preserving ecological and human health(e.g. the maintenance of the structure and functionof ecosystems), and the promotion of environmentalequity (both intergenerational and intersocietal).10
6 • IntroductionNovember 1995
Sustainable Use of Resources
Industrial ecology should promote the sustainableuse of renewable resources and minimal use of non-renewable ones. Industrial activity is dependent on asteady supply of resources and thus should operate asefficiently as possible. Although in the past mankindhas found alternatives to diminished raw materials,it can not be assumed that substitutes will continue tobe found as supplies of certain raw materials decreaseor are degraded. 11 Besides solar energy, the supply ofresources is finite. Thus, depletion of nonrenewablesand degradation of renewables must be minimized inorder for industrial activity to be sustainable in thelong term.
Ecological and Human Health
Human beings are only one component in a complexweb of ecological interactions: their activities cannotbe separated from the functioning of the entire system.Because human health is dependent on the health ofthe other components of the ecosystem, ecosystemstructure and function should be a focus of industrialecology. It is important that industrial activities do notcause catastrophic disruptions to ecosystems or slowlydegrade their structure and function, jeopardizing theplanet’s life support system.
Environmental Equity
A primary challenge of sustainable development isachieving intergenerational as well as intersocietalequity. Depleting natural resources and degradingecological health in order to meet short-term objectivescan endanger the ability of future generations to meettheir needs. Intersocietal inequities also exist, as evi-denced by the large imbalance of resource use betweendeveloping and developed countries. Developedcountries currently use a disproportionate amount ofresources in comparison with developing countries.Inequities also exist between social and economicgroups within the U.S.A. Several studies have shownthat low income and ethnic communities in the U.S.,for instance, are often subject to much higher levelsof human health risk associated with certain toxicpollutants.12
Key Concepts of Industrial Ecology
Systems Analysis
Critical to industrial ecology is the systems view ofthe relationship between human activities and environ-mental problems. As stated earlier, industrial ecologyis a higher order systems approach to framing theinteraction between industrial and ecological systems.There are various system levels that may be chosen asthe focus of study (see Table 1). For example, whenfocusing at the product system level, it is important toexamine relationships to higher-level corporate or insti-tutional systems as well as at lower levels, such as theindividual product life cycle stages. One could alsolook at how the product system affects various ecologicalsystems ranging from entire ecosystems to individualorganisms. A systems view enables manufacturers todevelop products in a sustainable fashion. Central tothe systems approach is an inherent recognition of theinterrelationships between industrial and natural systems.
In using systems analysis, one must be careful to avoidthe pitfall that Kenneth Boulding has described:
seeking to establish a single, self-contained‘general theory of practically everything’ whichwill replace all the special theories of particulardisciplines. Such a theory would be almostwithout content, for we always pay for general-ity by sacrificing content, and all we can sayabout practically everything is almost nothing.13
The same is true for industrial ecology. If the scope ofa study is too broad the results become less meaningful;when too narrow they may be less useful. Refer toBoulding’s World as a Complete System (London: Sage,1985) for more about systems theory; see Meadows etal.’s Limits to Growth (New York: Signet, 1972) andBeyond the Limits (Post Mills, VT: Chelsea Green, 1992)for good examples of how systems theory can be usedto analyze environmental problems on a global scale.
Material and Energy Flowsand Transformations
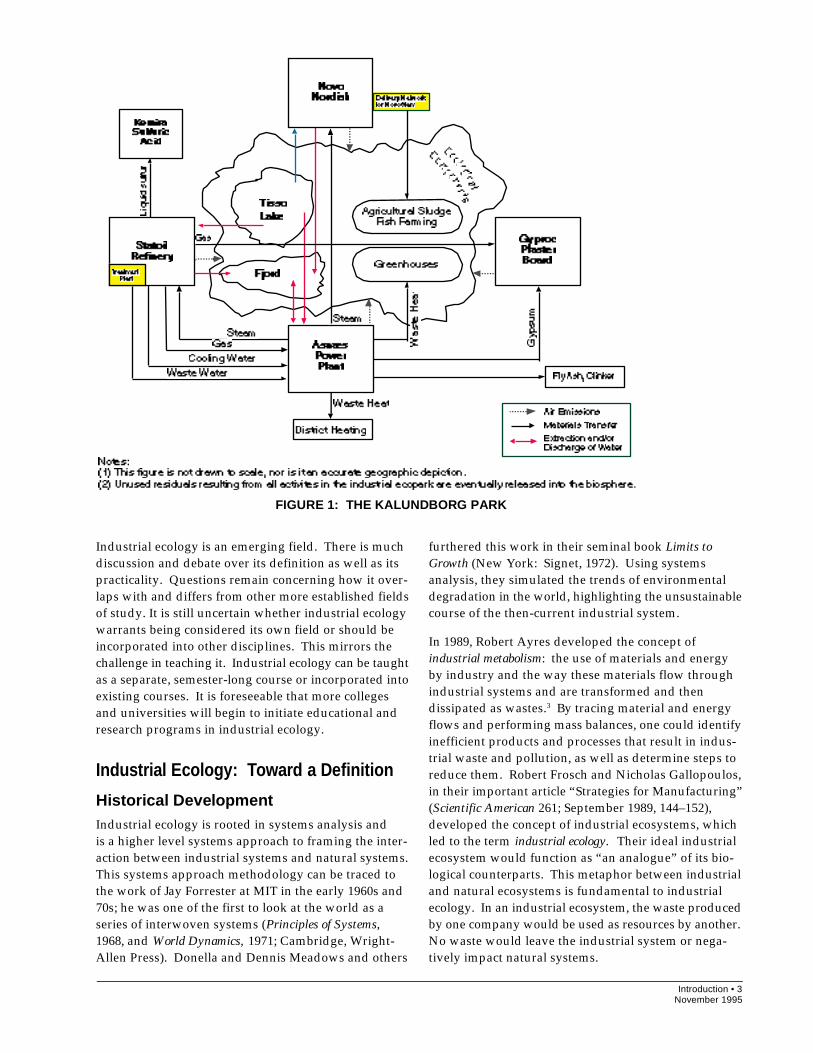
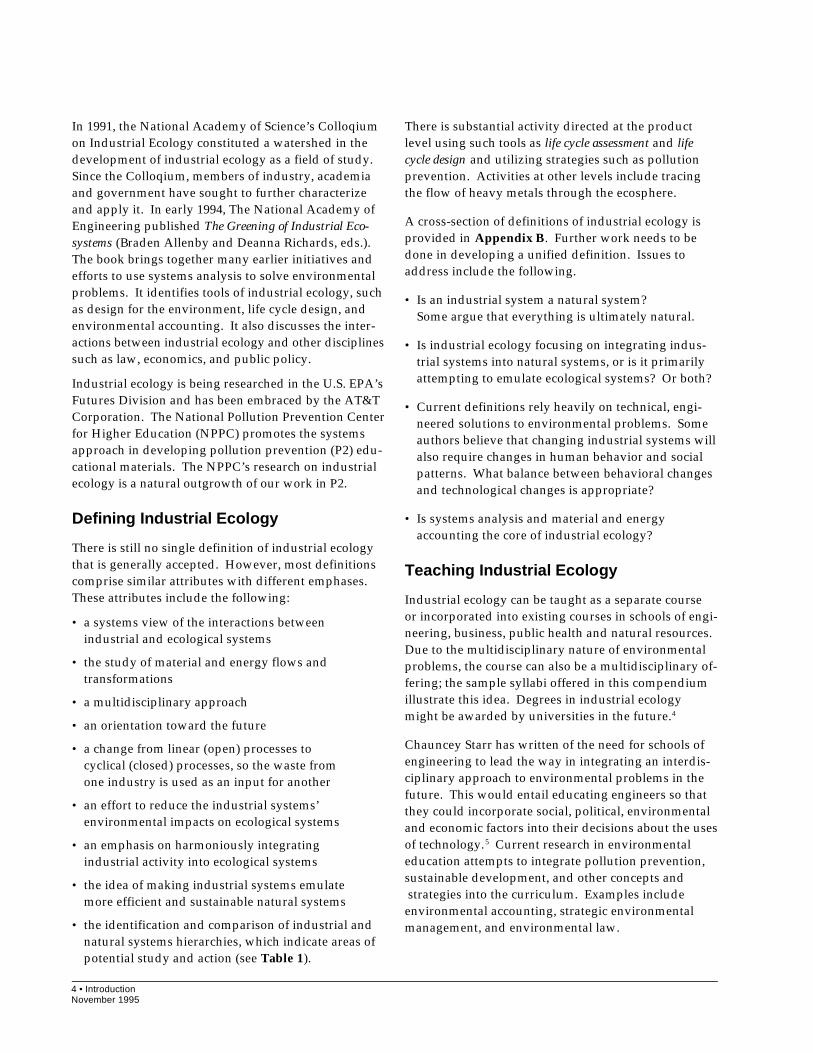
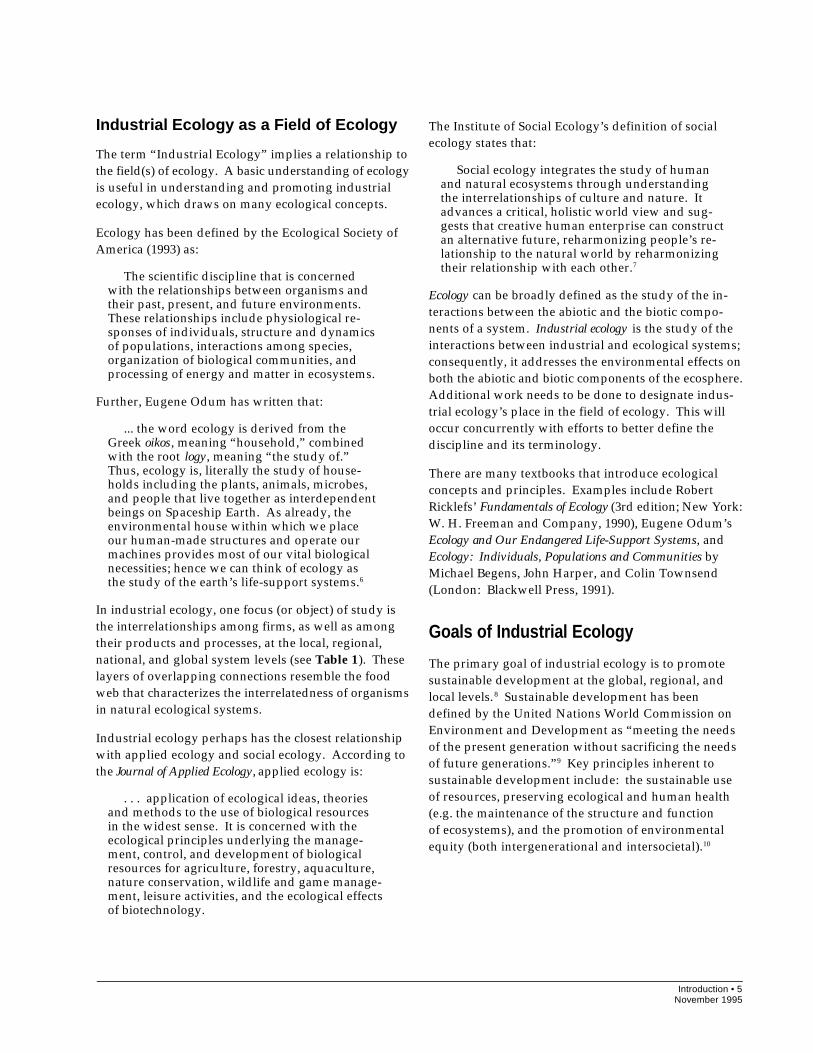
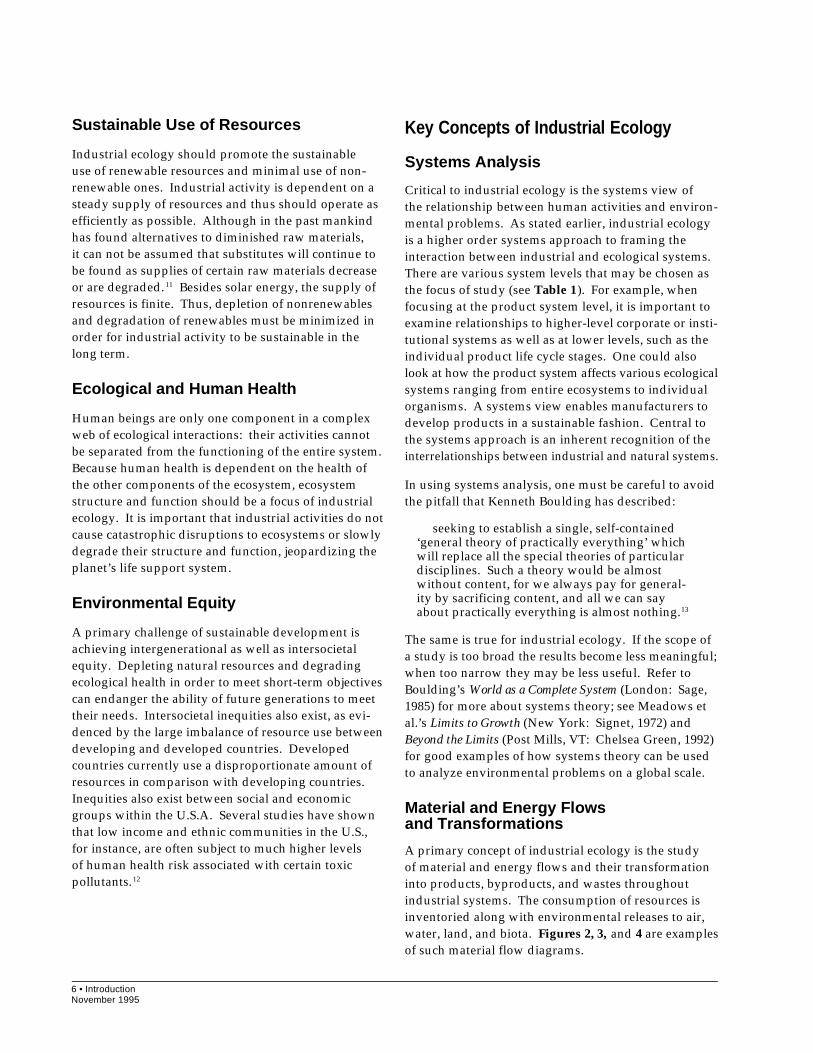
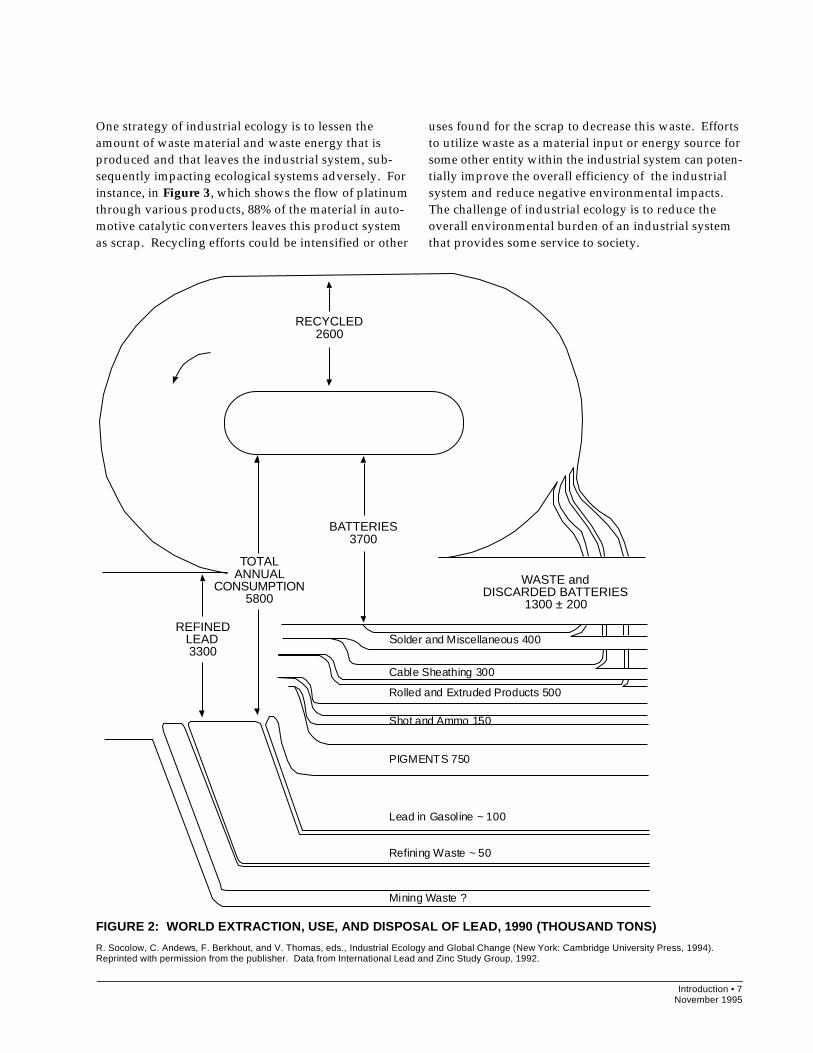
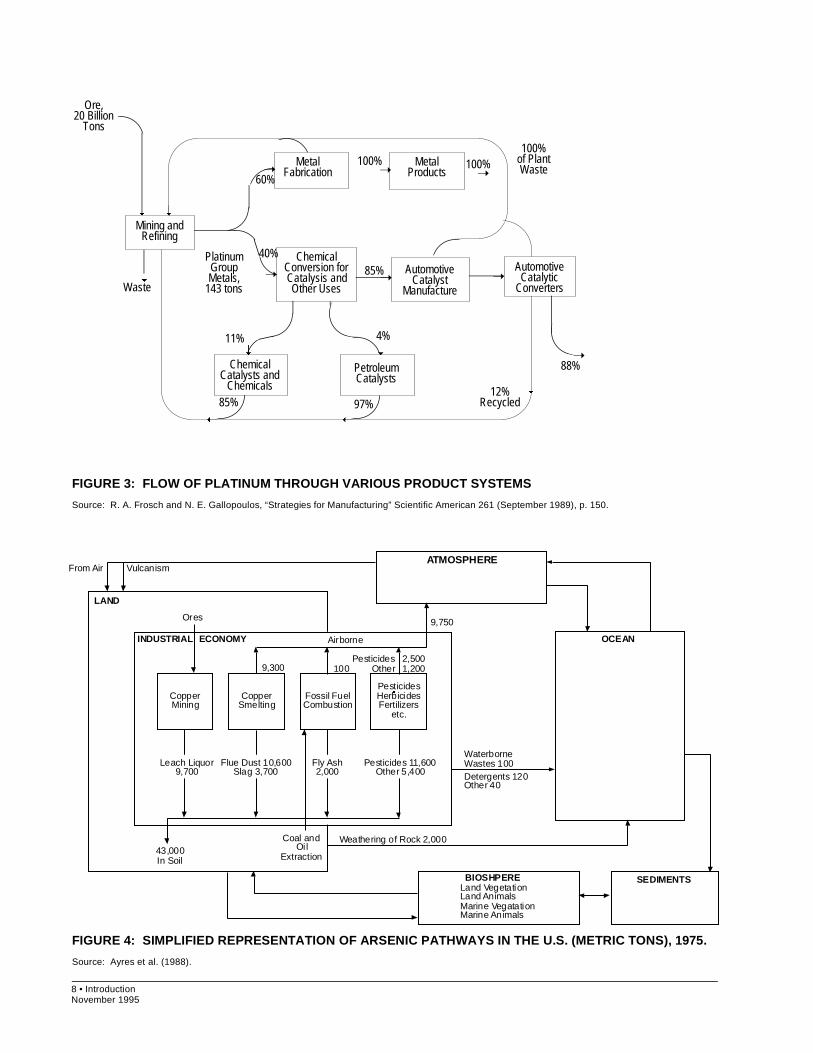
A primary concept of industrial ecology is the studyof material and energy flows and their transformationinto products, byproducts, and wastes throughoutindustrial systems. The consumption of resources isinventoried along with environmental releases to air,water, land, and biota. Figures 2, 3, and 4 are examplesof such material flow diagrams.
Introduction • 7November 1995
One strategy of industrial ecology is to lessen theamount of waste material and waste energy that isproduced and that leaves the industrial system, sub-sequently impacting ecological systems adversely. Forinstance, in Figure 3, which shows the flow of platinumthrough various products, 88% of the material in auto-motive catalytic converters leaves this product systemas scrap. Recycling efforts could be intensified or other
uses found for the scrap to decrease this waste. Effortsto utilize waste as a material input or energy source forsome other entity within the industrial system can poten-tially improve the overall efficiency of the industrialsystem and reduce negative environmental impacts.The challenge of industrial ecology is to reduce theoverall environmental burden of an industrial systemthat provides some service to society.
FIGURE 2: WORLD EXTRACTION, USE, AND DISPOSAL OF LEAD, 1990 (THOUSAND TONS)
R. Socolow, C. Andews, F. Berkhout, and V. Thomas, eds., Industrial Ecology and Global Change (New York: Cambridge University Press, 1994).Reprinted with permission from the publisher. Data from International Lead and Zinc Study Group, 1992.
RECYCLED2600
BATTERIES3700
TOTALANNUAL
CONSUMPTION5800
REFINEDLEAD3300
WASTE andDISCARDED BATTERIES
1300 ± 200
Solder and Miscellaneous 400
Cable Sheathing 300
Rolled and Extruded Products 500
Shot and Ammo 150
PIGMENTS 750
Lead in Gasoline ~ 100
Refining Waste ~ 50
Mining Waste ?
8 • IntroductionNovember 1995
FIGURE 3: FLOW OF PLATINUM THROUGH VARIOUS PRODUCT SYSTEMS
Source: R. A. Frosch and N. E. Gallopoulos, “Strategies for Manufacturing” Scientific American 261 (September 1989), p. 150.
FIGURE 4: SIMPLIFIED REPRESENTATION OF ARSENIC PATHWAYS IN THE U.S. (METRIC TONS), 1975.
Source: Ayres et al. (1988).
ATMOSPHERE
CopperMining
CopperSmelting
Fossil FuelCombustion
PesticidesHerbicidesFertilizers
etc.
Leach Liquor9,700
Flue Dust 10,600Slag 3,700
Fly Ash2,000
Pesticides 11,600Other 5,400
9,300 100Pesticides
Other2,5001,200
AirborneINDUSTRIAL ECONOMY
Ores
LAND
43,000In Soil
Coal andOil
Extraction
Weathering of Rock 2,000
BIOSHPERELand VegetationLand AnimalsMarine VegatationMarine Animals
SEDIMENTS
From Air Vulcanism
9,750
OCEAN
WaterborneWastes 100Detergents 120Other 40
MetalProducts
Mining andRefining
AutomotiveCatalytic
Converters
Ore,20 Billion
Tons
PlatinumGroupMetals,
143 tons
AutomotiveCatalyst
Manufacture
MetalFabrication
PetroleumCatalysts
ChemicalCatalysts and
Chemicals
ChemicalConversion forCatalysis andOther Uses
➝ ➝➝
➝ ➝ ➝
➝
Waste
60%
100% 100%
40%
85%
88%
11% 4%
85% 97%12%
Recycled
100%of PlantWaste
Introduction • 9November 1995
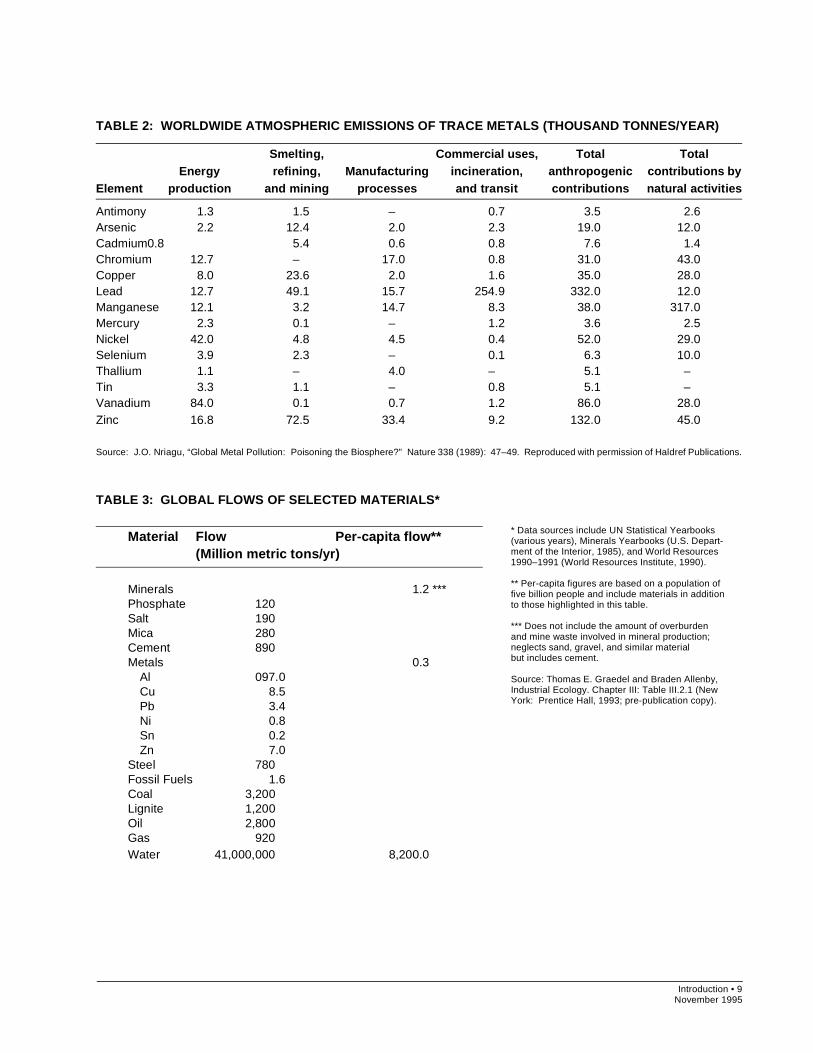
TABLE 2: WORLDWIDE ATMOSPHERIC EMISSIONS OF TRACE METALS (THOUSAND TONNES/YEAR)
Smelting, Commercial uses, Total TotalEnergy refining, Manufacturing incineration, anthropogenic contributions by
Element production and mining processes and transit contributions natural activities
Antimony 1.3 1.5 – 0.7 3.5 2.6Arsenic 2.2 12.4 2.0 2.3 19.0 12.0Cadmium 0.8 5.4 0.6 0.8 7.6 1.4Chromium 12.7 – 17.0 0.8 31.0 43.0Copper 8.0 23.6 2.0 1.6 35.0 28.0Lead 12.7 49.1 15.7 254.9 332.0 12.0Manganese 12.1 3.2 14.7 8.3 38.0 317.0Mercury 2.3 0.1 – 1.2 3.6 2.5Nickel 42.0 4.8 4.5 0.4 52.0 29.0Selenium 3.9 2.3 – 0.1 6.3 10.0Thallium 1.1 – 4.0 – 5.1 –Tin 3.3 1.1 – 0.8 5.1 –Vanadium 84.0 0.1 0.7 1.2 86.0 28.0Zinc 16.8 72.5 33.4 9.2 132.0 45.0
Source: J.O. Nriagu, “Global Metal Pollution: Poisoning the Biosphere?” Nature 338 (1989): 47–49. Reproduced with permission of Haldref Publications.
TABLE 3: GLOBAL FLOWS OF SELECTED MATERIALS*
Material Flow Per-capita flow**(Million metric tons/yr)
Minerals 1.2 ***Phosphate 120Salt 190Mica 280Cement 890Metals 0.3
Al 097.0Cu 8.5Pb 3.4Ni 0.8Sn 0.2Zn 7.0
Steel 780Fossil Fuels 1.6Coal 3,200Lignite 1,200Oil 2,800Gas 920Water 41,000,000 8,200.0
* Data sources include UN Statistical Yearbooks(various years), Minerals Yearbooks (U.S. Depart-ment of the Interior, 1985), and World Resources1990–1991 (World Resources Institute, 1990).
** Per-capita figures are based on a population offive billion people and include materials in additionto those highlighted in this table.
*** Does not include the amount of overburdenand mine waste involved in mineral production;neglects sand, gravel, and similar materialbut includes cement.
Source: Thomas E. Graedel and Braden Allenby,Industrial Ecology. Chapter III: Table III.2.1 (NewYork: Prentice Hall, 1993; pre-publication copy).
10 • IntroductionNovember 1995
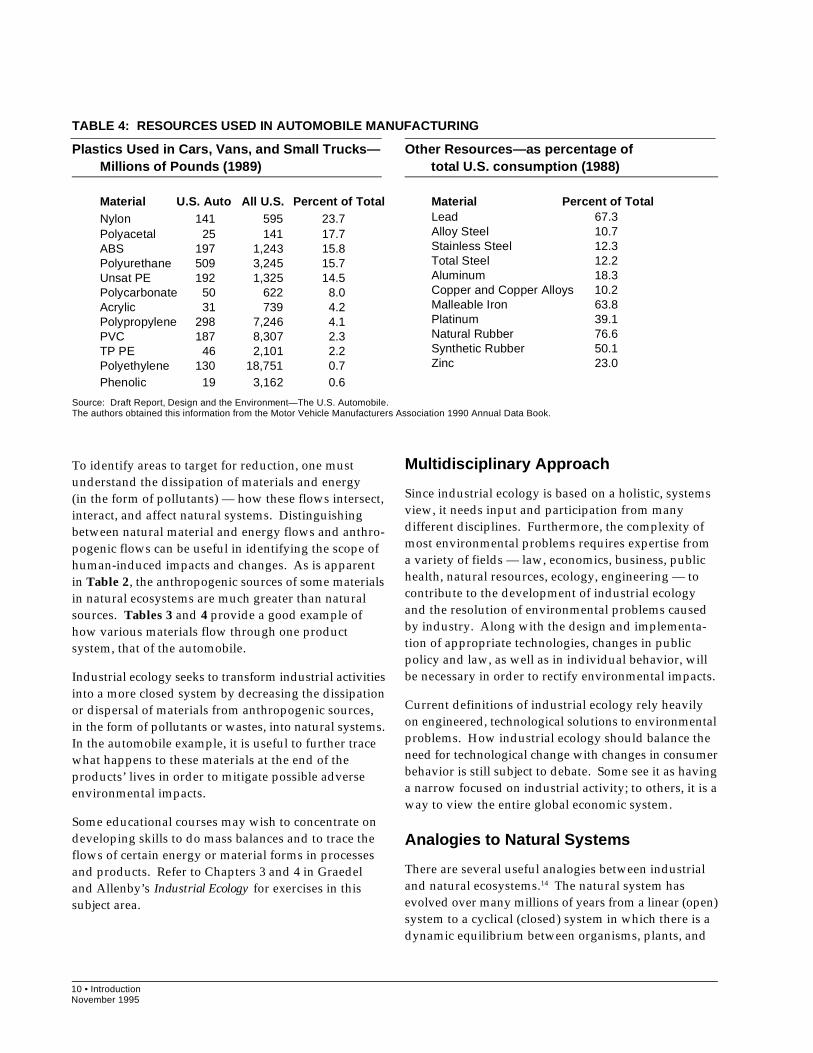
TABLE 4: RESOURCES USED IN AUTOMOBILE MANUFACTURING
Plastics Used in Cars, Vans, and Small Trucks—Millions of Pounds (1989)
Material U.S. Auto All U.S. Percent of TotalNylon 141 595 23.7Polyacetal 25 141 17.7ABS 197 1,243 15.8Polyurethane 509 3,245 15.7Unsat PE 192 1,325 14.5Polycarbonate 50 622 8.0Acrylic 31 739 4.2Polypropylene 298 7,246 4.1PVC 187 8,307 2.3TP PE 46 2,101 2.2Polyethylene 130 18,751 0.7Phenolic 19 3,162 0.6
Other Resources—as percentage of total U.S. consumption (1988)
Material Percent of TotalLead 67.3Alloy Steel 10.7Stainless Steel 12.3Total Steel 12.2Aluminum 18.3Copper and Copper Alloys 10.2Malleable Iron 63.8Platinum 39.1Natural Rubber 76.6Synthetic Rubber 50.1Zinc 23.0
To identify areas to target for reduction, one mustunderstand the dissipation of materials and energy(in the form of pollutants) — how these flows intersect,interact, and affect natural systems. Distinguishingbetween natural material and energy flows and anthro-pogenic flows can be useful in identifying the scope ofhuman-induced impacts and changes. As is apparentin Table 2, the anthropogenic sources of some materialsin natural ecosystems are much greater than naturalsources. Tables 3 and 4 provide a good example ofhow various materials flow through one productsystem, that of the automobile.
Industrial ecology seeks to transform industrial activitiesinto a more closed system by decreasing the dissipationor dispersal of materials from anthropogenic sources,in the form of pollutants or wastes, into natural systems.In the automobile example, it is useful to further tracewhat happens to these materials at the end of theproducts’ lives in order to mitigate possible adverseenvironmental impacts.
Some educational courses may wish to concentrate ondeveloping skills to do mass balances and to trace theflows of certain energy or material forms in processesand products. Refer to Chapters 3 and 4 in Graedeland Allenby’s Industrial Ecology for exercises in thissubject area.
Multidisciplinary Approach
Since industrial ecology is based on a holistic, systemsview, it needs input and participation from manydifferent disciplines. Furthermore, the complexity ofmost environmental problems requires expertise froma variety of fields — law, economics, business, publichealth, natural resources, ecology, engineering — tocontribute to the development of industrial ecologyand the resolution of environmental problems causedby industry. Along with the design and implementa-tion of appropriate technologies, changes in publicpolicy and law, as well as in individual behavior, willbe necessary in order to rectify environmental impacts.
Current definitions of industrial ecology rely heavilyon engineered, technological solutions to environmentalproblems. How industrial ecology should balance theneed for technological change with changes in consumerbehavior is still subject to debate. Some see it as havinga narrow focused on industrial activity; to others, it is away to view the entire global economic system.
Analogies to Natural Systems
There are several useful analogies between industrialand natural ecosystems.14 The natural system hasevolved over many millions of years from a linear (open)system to a cyclical (closed) system in which there is adynamic equilibrium between organisms, plants, and
Source: Draft Report, Design and the Environment—The U.S. Automobile.The authors obtained this information from the Motor Vehicle Manufacturers Association 1990 Annual Data Book.
Introduction • 11November 1995
the various biological, physical, and chemical processesin nature. Virtually nothing leaves the system, becausewastes are used as substrates for other organisms. Thisnatural system is characterized by high degrees of inte-gration and interconnectedness. There is a food webby which all organisms feed and pass on waste or areeaten as a food source by other members of the web.In nature, there is a complex system of feedback mech-anisms that induce reactions should certain limits bereached. (See Odum or Ricklefs for a more completedescription of ecological principles.)
Industrial ecology draws the analogy between indus-trial and natural systems and suggests that a goal is tostimulate the evolution of the industrial system so thatit shares the same characteristics as described aboveconcerning natural systems. A goal of industrial ecology
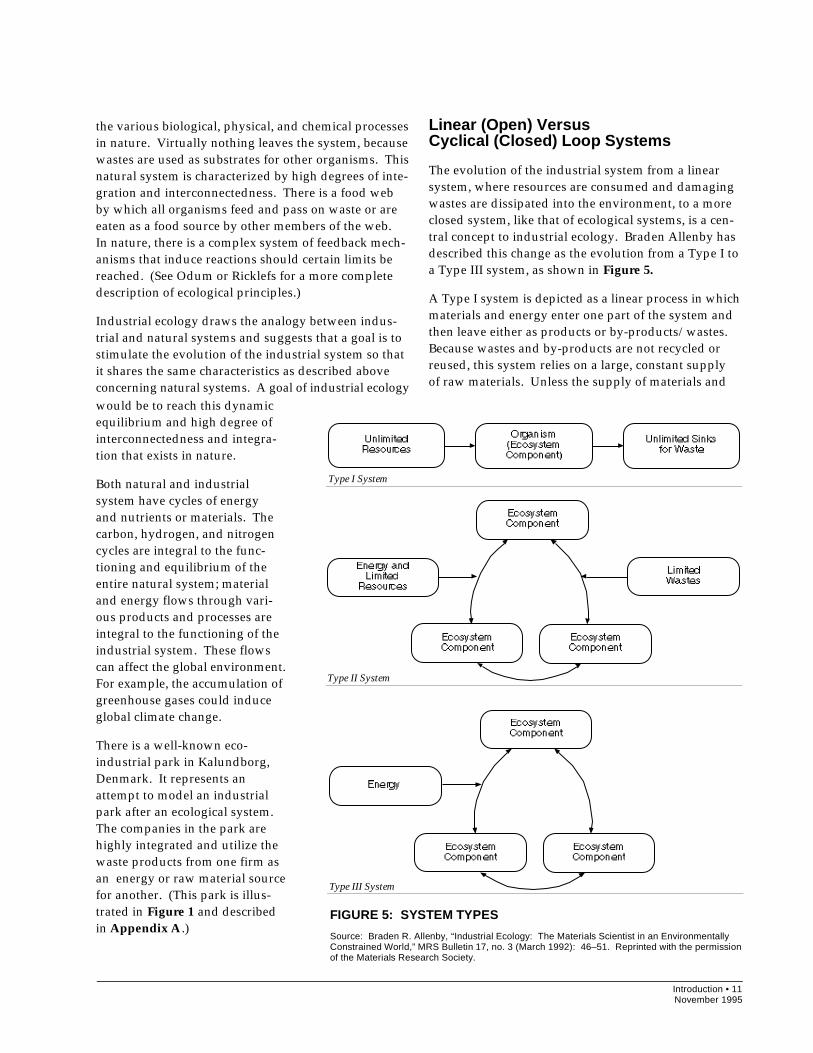
FIGURE 5: SYSTEM TYPES
Source: Braden R. Allenby, “Industrial Ecology: The Materials Scientist in an EnvironmentallyConstrained World,” MRS Bulletin 17, no. 3 (March 1992): 46–51. Reprinted with the permissionof the Materials Research Society.
would be to reach this dynamicequilibrium and high degree ofinterconnectedness and integra-tion that exists in nature.
Both natural and industrialsystem have cycles of energyand nutrients or materials. Thecarbon, hydrogen, and nitrogencycles are integral to the func-tioning and equilibrium of theentire natural system; materialand energy flows through vari-ous products and processes areintegral to the functioning of theindustrial system. These flowscan affect the global environment.For example, the accumulation ofgreenhouse gases could induceglobal climate change.
There is a well-known eco-industrial park in Kalundborg,Denmark. It represents anattempt to model an industrialpark after an ecological system.The companies in the park arehighly integrated and utilize thewaste products from one firm asan energy or raw material sourcefor another. (This park is illus-trated in Figure 1 and describedin Appendix A.)
Linear (Open) VersusCyclical (Closed) Loop Systems
The evolution of the industrial system from a linearsystem, where resources are consumed and damagingwastes are dissipated into the environment, to a moreclosed system, like that of ecological systems, is a cen-tral concept to industrial ecology. Braden Allenby hasdescribed this change as the evolution from a Type I toa Type III system, as shown in Figure 5.
A Type I system is depicted as a linear process in whichmaterials and energy enter one part of the system andthen leave either as products or by-products/wastes.Because wastes and by-products are not recycled orreused, this system relies on a large, constant supplyof raw materials. Unless the supply of materials and
Type I System
Type II System
Type III System
12 • IntroductionNovember 1995
energy is infinite, this system is unsustainable; further,the ability for natural systems to assimilate wastes(known as “sinks”) is also finite. In a Type II system,which characterizes much of our present-day industrialsystem, some wastes are recycled or reused within thesystem while others still leave it.
A Type III system represents the dynamic equilibriumof ecological systems, where energy and wastes areconstantly recycled and reused by other organisms andprocesses within the system. This is a highly integrated,closed system. In a totally closed industrial system,only solar energy would come from outside, while allbyproducts would be constantly reused and recycledwithin. A Type III system represents a sustainablestate and is an ideal goal of industrial ecology.
Strategies for Environmental ImpactReduction: Industrial Ecology asa Potential Umbrella for SustainableDevelopment Strategies
Various strategies are used by individuals, firms, andgovernments to reduce the environmental impacts ofindustry. Each activity takes place at a specific systemslevel. Some feel that industrial ecology could serve asan umbrella for such strategies, while others are waryof placing well-established strategies under the rubrisof a new idea like industrial ecology. Strategies relatedto industrial ecology are briefly noted below.
Pollution prevention is defined by the U.S. EPA as“the use of materials, processes, or practices that re-duce or eliminate the creation of pollutants at thesource.” Pollution prevention refers to specific actionsby individual firms, rather than the collective activitiesof the industrial system (or the collective reduction ofenvironmental impacts) as a whole.15 The documentin this compendium entitled “Pollution PreventionConcepts and Principles” provides a detailed examina-tion of this topic with definitions and examples.
Waste minimization is defined by the U.S. EPA as “thereduction, to the extent feasible, of hazardous wastethat is generated or subsequently treated, sorted, ordisposed of.”16 Source reduction is any practice thatreduces the amount of any hazardous substance,pollutant or contaminant entering any waste streamor otherwise released into the environmental prior torecycling, treatment or disposal.17
Total quality environmental management (TQEM) is usedto monitor, control, and improve a firm’s environmentalperformance within individual firms. Based on well-established principles from Total Quality Management,TQEM integrates environmental considerations intoall aspects of a firm’s decision-making, processes, op-erations, and products. All employees are responsiblefor implementing TQEM principles. It is a holisticapproach, albeit at level of the individual firm.
Many additional terms address strategies for sustain-able development. Cleaner production, a term coined byUNEP in 1989, is widely used in Europe. Its meaningis similar to pollution prevention. In Clean ProductionStrategies, Tim Jackson writes that clean production is
. . . an operational approach to the developmentof the system of production and consumption,which incorporates a preventive approach toenvironmental protection. It is characterized bythree principles: precaution, prevention, andintegration.18
These strategies represent approaches that individualfirms can take to reduce the environmental impactsof their activities. Along with environmental impactreduction, motivations can include cost savings, regu-latory or consumer pressure, and health and safetyconcerns. What industrial ecology potentially offers isan organizing umbrella that can relate these individualactivities to the industrial system as a whole. Whereasstrategies such as pollution prevention, TQEM, andcleaner production concentrate on firms’ individualactions to reduce individual environmental impacts,industrial ecology is concerned about the activities ofall entities within the industrial system.
The goal of industrial ecology is to reduce the overall,collective environmental impacts caused by the totalityof elements within the industrial system.
System Tools to Support Industrial Ecology
Life Cycle Assessment (LCA)
Life cycle assessment (LCA), along with “ecobalances”and resource environmental profile analysis, is amethod of evaluating the environmental consequencesof a product or process “from cradle to grave.”19 20 21
The Society for Environmental Toxicology & Chemistry(SETAC) defines LCA as “a process used to evaluate
Introduction • 13November 1995
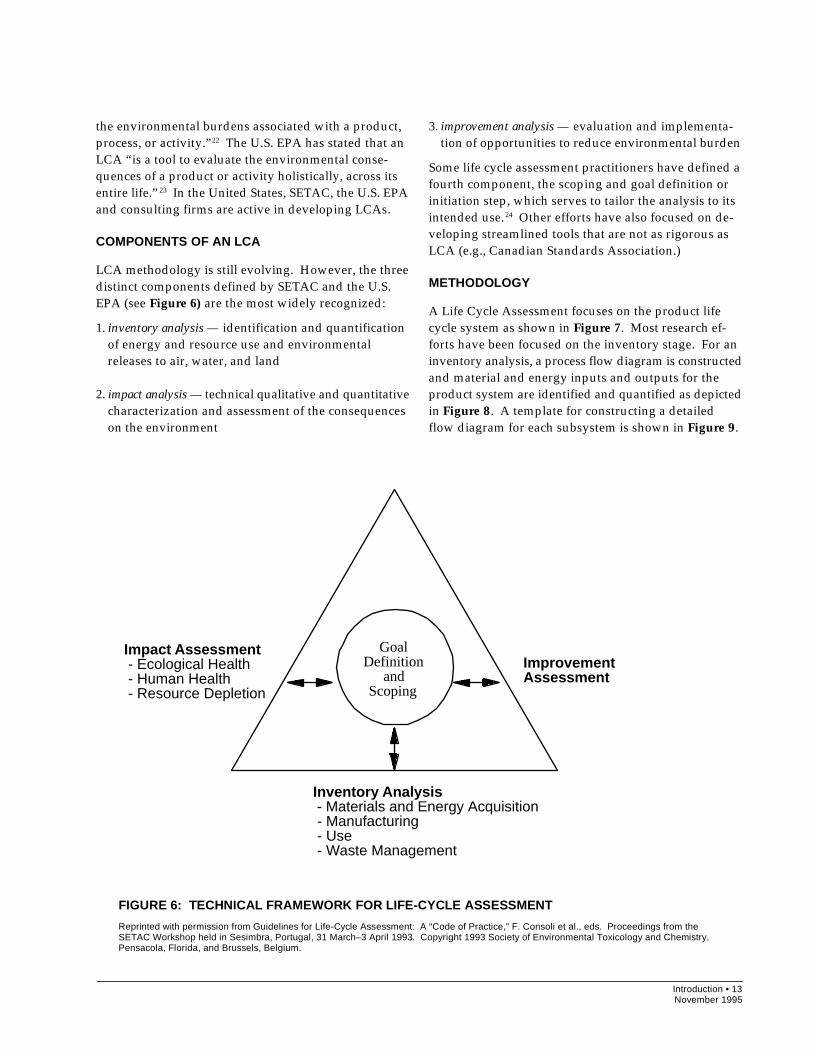
3. improvement analysis — evaluation and implementa-tion of opportunities to reduce environmental burden
Some life cycle assessment practitioners have defined afourth component, the scoping and goal definition orinitiation step, which serves to tailor the analysis to itsintended use.24 Other efforts have also focused on de-veloping streamlined tools that are not as rigorous asLCA (e.g., Canadian Standards Association.)
METHODOLOGY
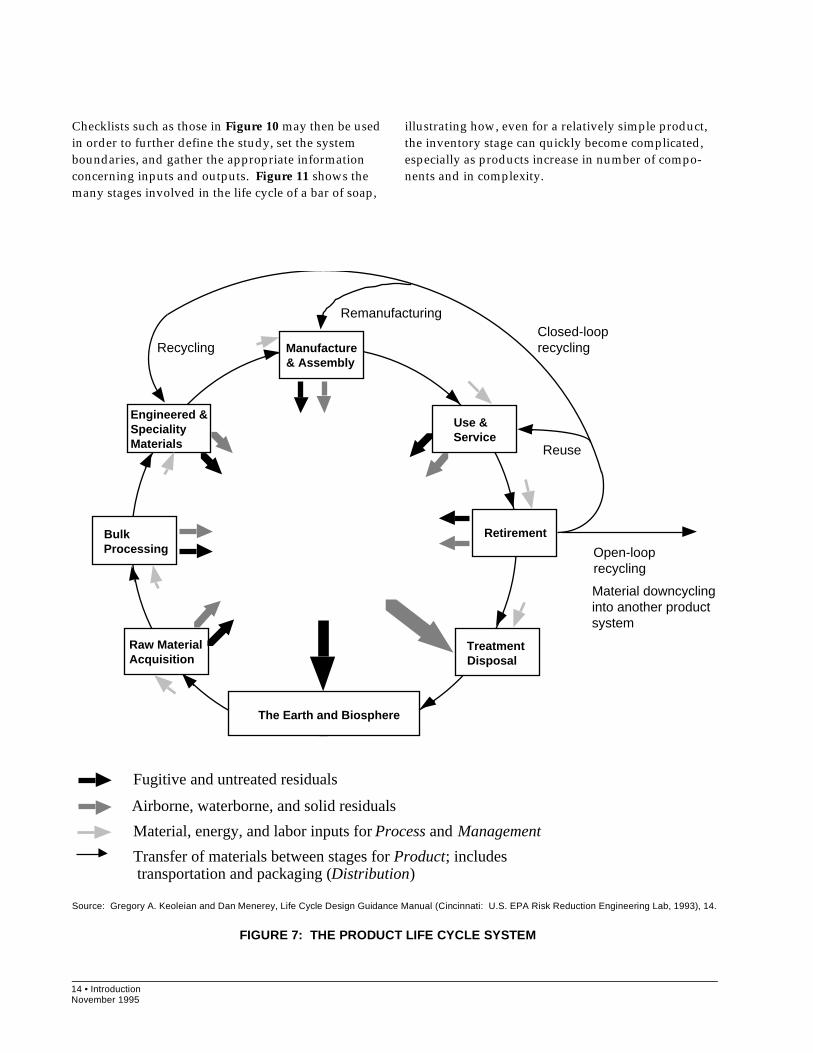
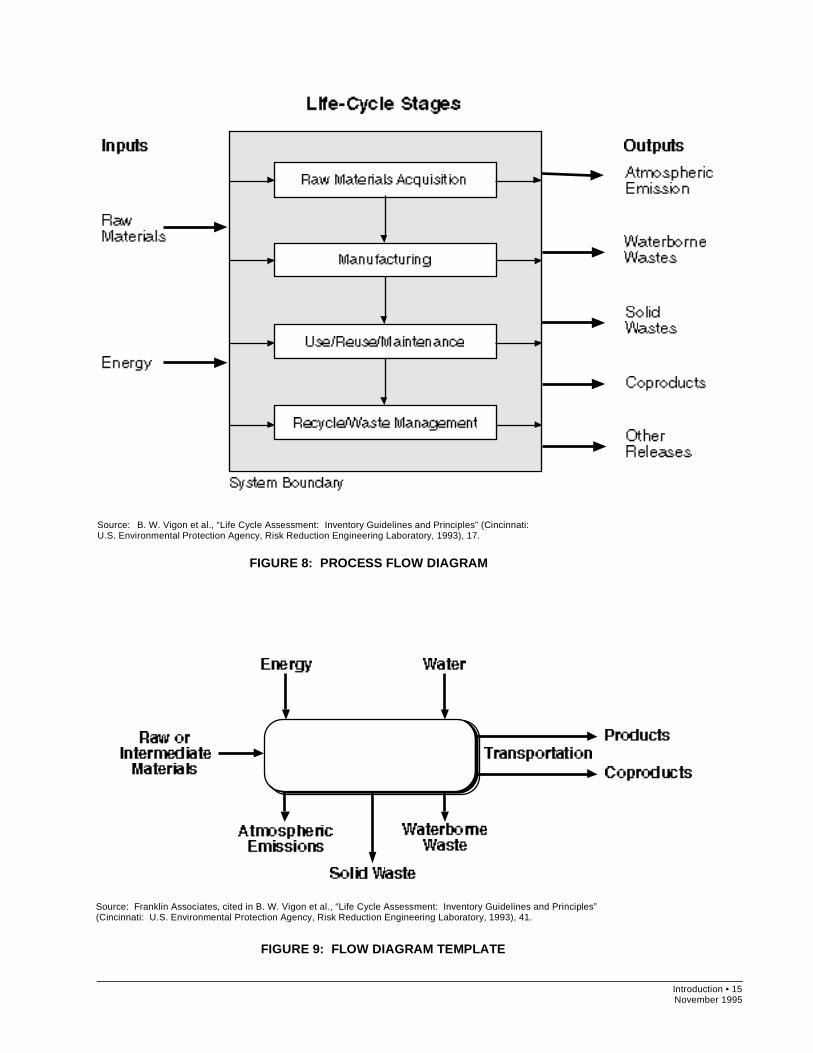
A Life Cycle Assessment focuses on the product lifecycle system as shown in Figure 7. Most research ef-forts have been focused on the inventory stage. For aninventory analysis, a process flow diagram is constructedand material and energy inputs and outputs for theproduct system are identified and quantified as depictedin Figure 8. A template for constructing a detailedflow diagram for each subsystem is shown in Figure 9.
the environmental burdens associated with a product,process, or activity.”22 The U.S. EPA has stated that anLCA “is a tool to evaluate the environmental conse-quences of a product or activity holistically, across itsentire life.”23 In the United States, SETAC, the U.S. EPAand consulting firms are active in developing LCAs.
COMPONENTS OF AN LCA
LCA methodology is still evolving. However, the threedistinct components defined by SETAC and the U.S.EPA (see Figure 6) are the most widely recognized:
1. inventory analysis — identification and quantificationof energy and resource use and environmentalreleases to air, water, and land
2. impact analysis — technical qualitative and quantitativecharacterization and assessment of the consequenceson the environment
FIGURE 6: TECHNICAL FRAMEWORK FOR LIFE-CYCLE ASSESSMENT
Reprinted with permission from Guidelines for Life-Cycle Assessment: A “Code of Practice,” F. Consoli et al., eds. Proceedings from theSETAC Workshop held in Sesimbra, Portugal, 31 March–3 April 1993. Copyright 1993 Society of Environmental Toxicology and Chemistry,Pensacola, Florida, and Brussels, Belgium.
GoalDefinition
andScoping
Impact Assessment - Ecological Health - Human Health - Resource Depletion
ImprovementAssessment
Inventory Analysis - Materials and Energy Acquisition - Manufacturing - Use - Waste Management
14 • IntroductionNovember 1995
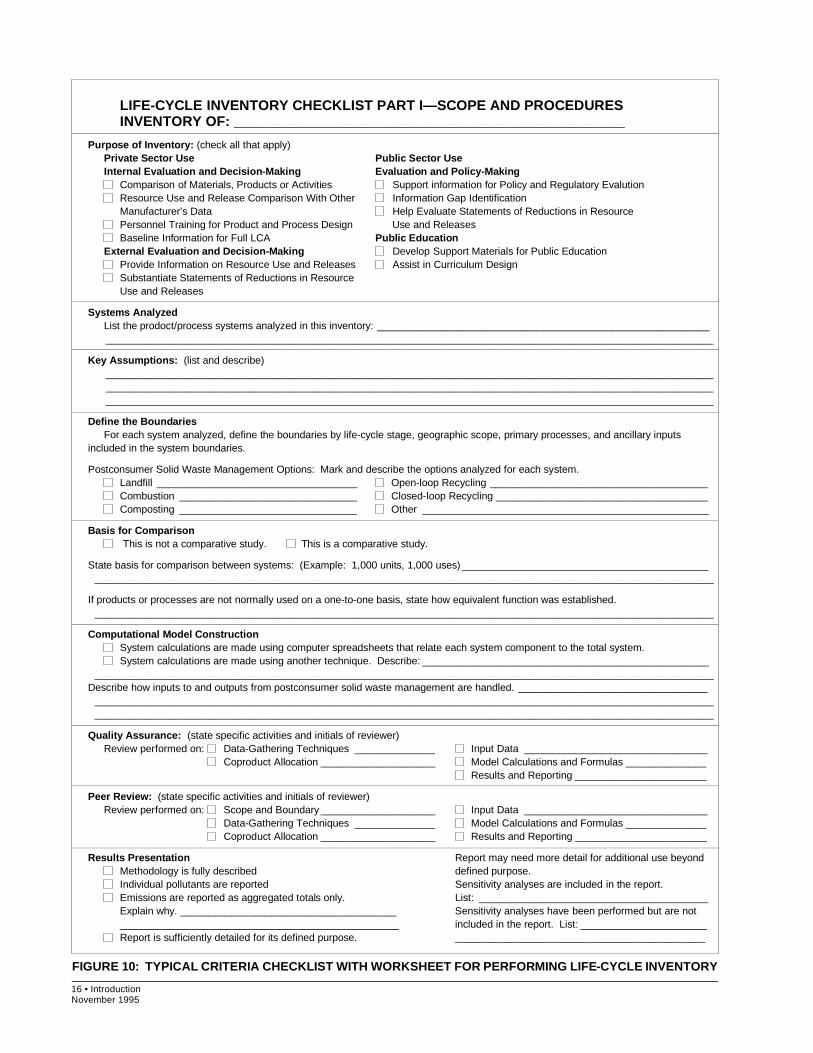
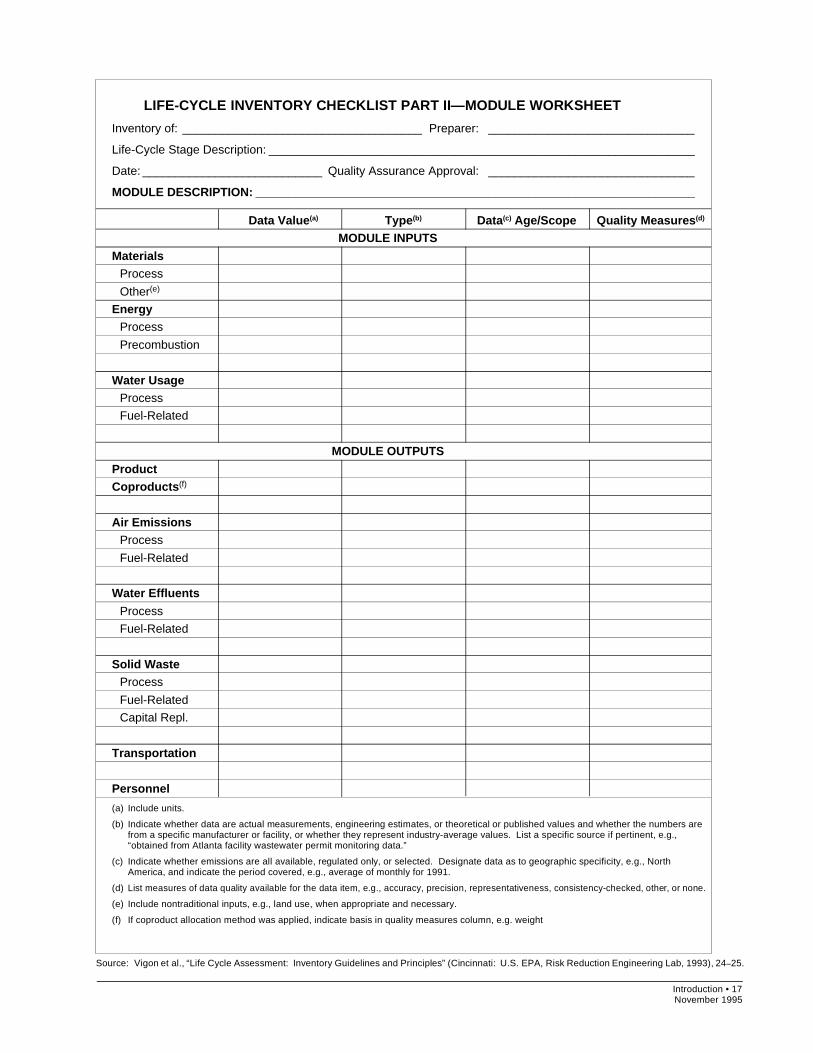
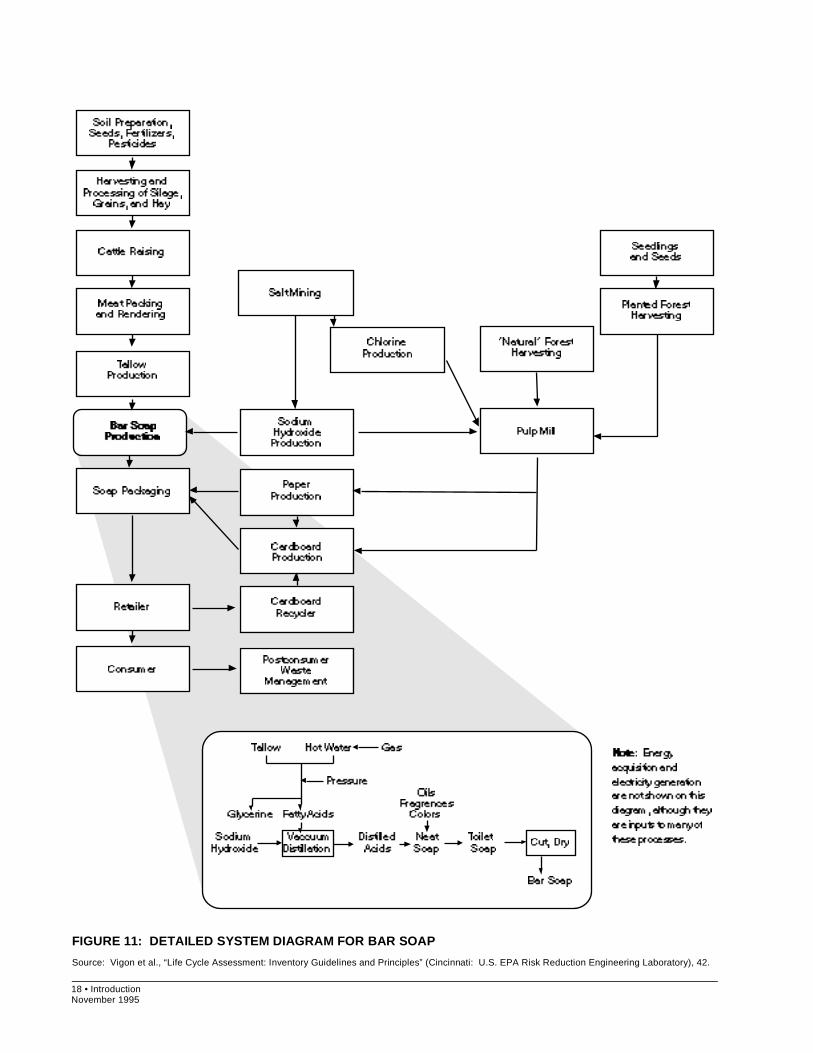
Checklists such as those in Figure 10 may then be usedin order to further define the study, set the systemboundaries, and gather the appropriate informationconcerning inputs and outputs. Figure 11 shows themany stages involved in the life cycle of a bar of soap,
illustrating how, even for a relatively simple product,the inventory stage can quickly become complicated,especially as products increase in number of compo-nents and in complexity.
Use &Service
Manufacture& Assembly
Engineered &SpecialityMaterials
BulkProcessing
Raw MaterialAcquisition
The Earth and Biosphere
TreatmentDisposal
Retirement
Reuse
Open-loop recycling
RemanufacturingClosed-loop recyclingRecycling
Material downcycling into another product system
Fugitive and untreated residuals
Airborne, waterborne, and solid residuals
Material, energy, and labor inputs for Process and Management
Transfer of materials between stages for Product; includes transportation and packaging (Distribution)
Source: Gregory A. Keoleian and Dan Menerey, Life Cycle Design Guidance Manual (Cincinnati: U.S. EPA Risk Reduction Engineering Lab, 1993), 14.
FIGURE 7: THE PRODUCT LIFE CYCLE SYSTEM
Introduction • 15November 1995
FIGURE 8: PROCESS FLOW DIAGRAM
Source: B. W. Vigon et al., “Life Cycle Assessment: Inventory Guidelines and Principles” (Cincinnati:U.S. Environmental Protection Agency, Risk Reduction Engineering Laboratory, 1993), 17.
FIGURE 9: FLOW DIAGRAM TEMPLATE
Source: Franklin Associates, cited in B. W. Vigon et al., “Life Cycle Assessment: Inventory Guidelines and Principles”(Cincinnati: U.S. Environmental Protection Agency, Risk Reduction Engineering Laboratory, 1993), 41.
16 • IntroductionNovember 1995
LIFE-CYCLE INVENTORY CHECKLIST PART I—SCOPE AND PROCEDURESINVENTORY OF: __________________________________________________
Purpose of Inventory: (check all that apply)Private Sector Use Public Sector UseInternal Evaluation and Decision-Making Evaluation and Policy-Making
Comparison of Materials, Products or Activities Support information for Policy and Regulatory EvalutionResource Use and Release Comparison With Other Information Gap IdentificationManufacturer’s Data Help Evaluate Statements of Reductions in ResourcePersonnel Training for Product and Process Design Use and ReleasesBaseline Information for Full LCA Public Education
External Evaluation and Decision-Making Develop Support Materials for Public EducationProvide Information on Resource Use and Releases Assist in Curriculum DesignSubstantiate Statements of Reductions in ResourceUse and Releases
Systems AnalyzedList the prodoct/process systems analyzed in this inventory: ____________________________________________________________________________________________________________________________________________________________________
Key Assumptions: (list and describe)______________________________________________________________________________________________________________________________________________________________________________________________________________________________________________________________________________________________________________________________
Define the BoundariesFor each system analyzed, define the boundaries by life-cycle stage, geographic scope, primary processes, and ancillary inputs
included in the system boundaries.
Postconsumer Solid Waste Management Options: Mark and describe the options analyzed for each system.Landfill ___________________________________ Open-loop Recycling ______________________________________Combustion _______________________________ Closed-loop Recycling _____________________________________Composting _______________________________ Other __________________________________________________
Basis for Comparison This is not a comparative study. This is a comparative study.
State basis for comparison between systems: (Example: 1,000 units, 1,000 uses) _______________________________________________________________________________________________________________________________________________________
If products or processes are not normally used on a one-to-one basis, state how equivalent function was established.____________________________________________________________________________________________________________
Computational Model ConstructionSystem calculations are made using computer spreadsheets that relate each system component to the total system.System calculations are made using another technique. Describe: __________________________________________________
____________________________________________________________________________________________________________Describe how inputs to and outputs from postconsumer solid waste management are handled. _________________________________
________________________________________________________________________________________________________________________________________________________________________________________________________________________
Quality Assurance: (state specific activities and initials of reviewer)Review performed on: Data-Gathering Techniques ______________ Input Data ________________________________
Coproduct Allocation ____________________ Model Calculations and Formulas ______________Results and Reporting _______________________
Peer Review: (state specific activities and initials of reviewer)Review performed on: Scope and Boundary ____________________ Input Data ________________________________
Data-Gathering Techniques ______________ Model Calculations and Formulas ______________Coproduct Allocation ____________________ Results and Reporting _______________________
Results Presentation Report may need more detail for additional use beyondMethodology is fully described defined purpose.Individual pollutants are reported Sensitivity analyses are included in the report.Emissions are reported as aggregated totals only. List: ________________________________________Explain why. ______________________________________ Sensitivity analyses have been performed but are not_________________________________________________ included in the report. List: ______________________Report is sufficiently detailed for its defined purpose. ____________________________________________
FIGURE 10: TYPICAL CRITERIA CHECKLIST WITH WORKSHEET FOR PERFORMING LIFE-CYCLE INVENTORY
Introduction • 17November 1995
Source: Vigon et al., “Life Cycle Assessment: Inventory Guidelines and Principles” (Cincinnati: U.S. EPA, Risk Reduction Engineering Lab, 1993), 24–25.
(a) Include units.
(b) Indicate whether data are actual measurements, engineering estimates, or theoretical or published values and whether the numbers arefrom a specific manufacturer or facility, or whether they represent industry-average values. List a specific source if pertinent, e.g.,“obtained from Atlanta facility wastewater permit monitoring data.”
(c) Indicate whether emissions are all available, regulated only, or selected. Designate data as to geographic specificity, e.g., NorthAmerica, and indicate the period covered, e.g., average of monthly for 1991.
(d) List measures of data quality available for the data item, e.g., accuracy, precision, representativeness, consistency-checked, other, or none.
(e) Include nontraditional inputs, e.g., land use, when appropriate and necessary.
(f) If coproduct allocation method was applied, indicate basis in quality measures column, e.g. weight
LIFE-CYCLE INVENTORY CHECKLIST PART II—MODULE WORKSHEET
Inventory of: ____________________________________ Preparer: _______________________________
Life-Cycle Stage Description: ________________________________________________________________
Date: ___________________________ Quality Assurance Approval: _______________________________
MODULE DESCRIPTION: __________________________________________________________________
Data Value(a) Type(b) Data(c) Age/Scope Quality Measures(d)
MODULE INPUTS
MaterialsProcess
Other(e)
EnergyProcess
Precombustion
Water UsageProcess
Fuel-Related
MODULE OUTPUTS
ProductCoproducts(f)
Air EmissionsProcess
Fuel-Related
Water Effluents
Process
Fuel-Related
Solid WasteProcess
Fuel-Related
Capital Repl.
Transportation
Personnel
18 • IntroductionNovember 1995
FIGURE 11: DETAILED SYSTEM DIAGRAM FOR BAR SOAP
Source: Vigon et al., “Life Cycle Assessment: Inventory Guidelines and Principles” (Cincinnati: U.S. EPA Risk Reduction Engineering Laboratory), 42.
Introduction • 19November 1995
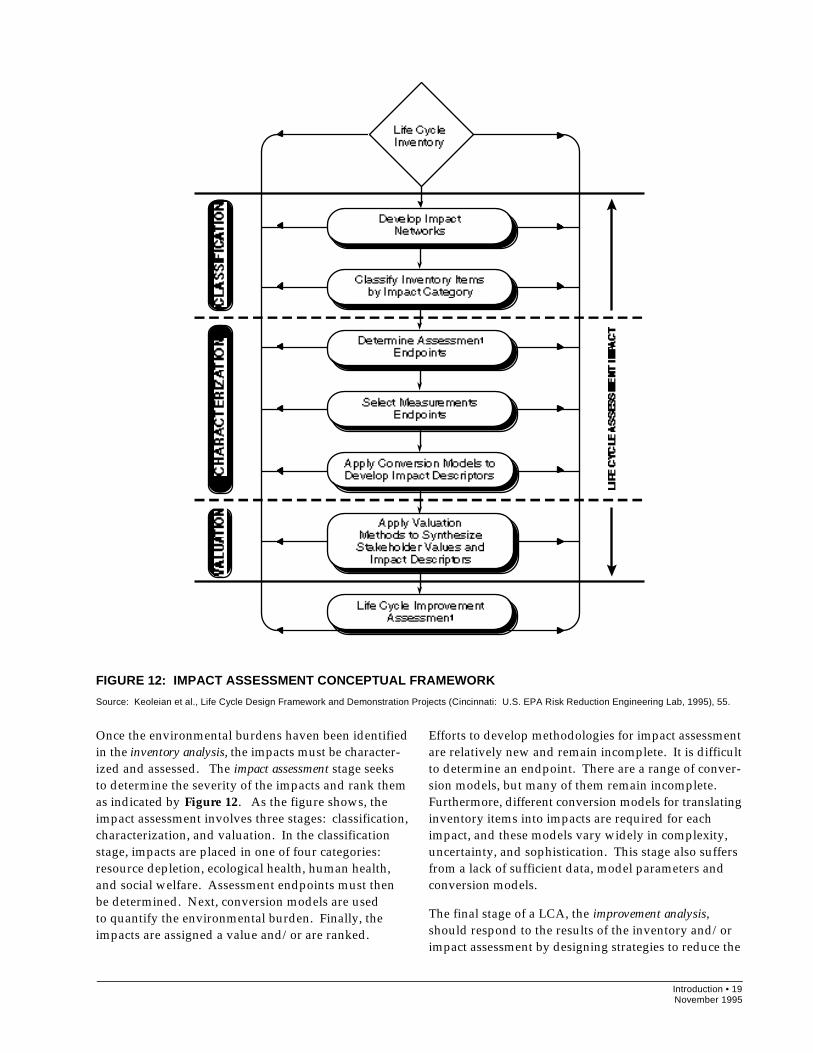
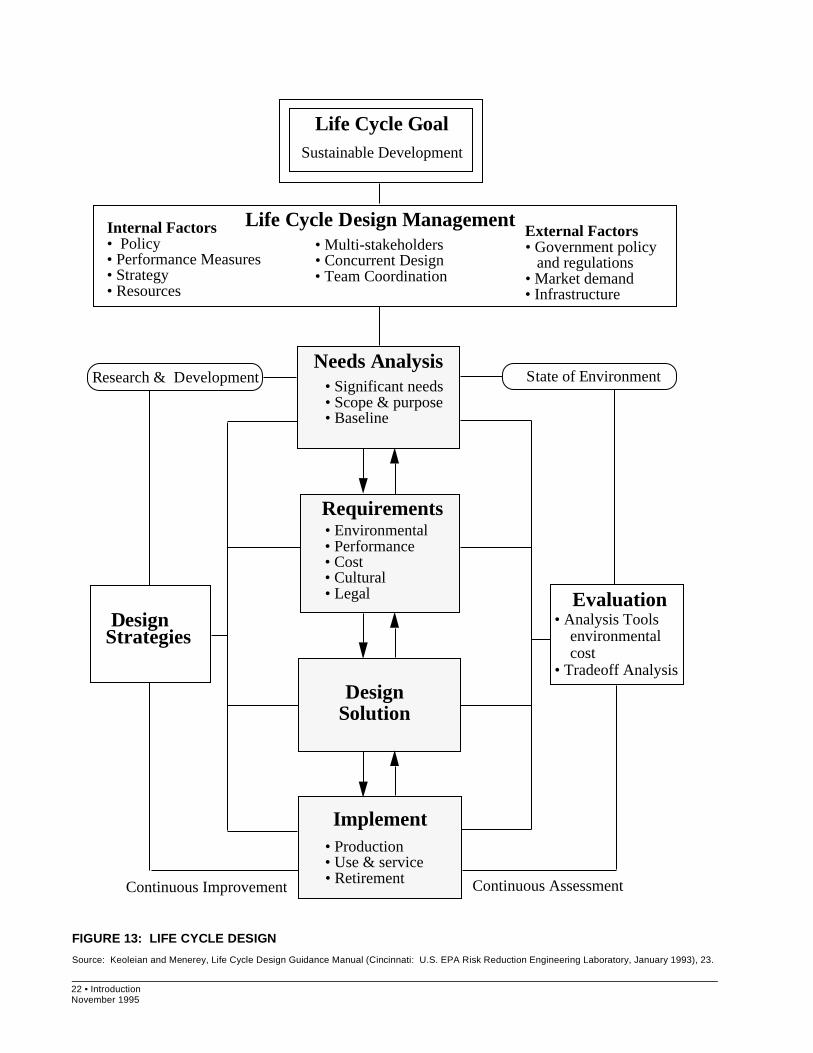
Once the environmental burdens haven been identifiedin the inventory analysis, the impacts must be character-ized and assessed. The impact assessment stage seeksto determine the severity of the impacts and rank themas indicated by Figure 12. As the figure shows, theimpact assessment involves three stages: classification,characterization, and valuation. In the classificationstage, impacts are placed in one of four categories:resource depletion, ecological health, human health,and social welfare. Assessment endpoints must thenbe determined. Next, conversion models are usedto quantify the environmental burden. Finally, theimpacts are assigned a value and/or are ranked.
Efforts to develop methodologies for impact assessmentare relatively new and remain incomplete. It is difficultto determine an endpoint. There are a range of conver-sion models, but many of them remain incomplete.Furthermore, different conversion models for translatinginventory items into impacts are required for eachimpact, and these models vary widely in complexity,uncertainty, and sophistication. This stage also suffersfrom a lack of sufficient data, model parameters andconversion models.
The final stage of a LCA, the improvement analysis,should respond to the results of the inventory and/orimpact assessment by designing strategies to reduce the
FIGURE 12: IMPACT ASSESSMENT CONCEPTUAL FRAMEWORK
Source: Keoleian et al., Life Cycle Design Framework and Demonstration Projects (Cincinnati: U.S. EPA Risk Reduction Engineering Lab, 1995), 55.
20 • IntroductionNovember 1995
identified environmental impacts. Proctor and Gambleis one company that has used life cycle inventory studiesto guide environmental improvement for several prod-ucts.25 One of its case studies on hard surface cleanersrevealed that heating water for use with the productresulted in a significant percentage of total energy useand air emissions related to cleaning.26 Based on thisinformation, opportunities for reducing impacts wereidentified, such as designing cold-water and no-rinseformulas and educating consumers to use cold water.
APPLICATIONS OF LCA
Life cycle assessments can be used both internally(within an organization) and externally (by the publicand private sectors).27 Internally, LCAs can be used toestablish a comprehensive baseline (i.e., requirements)that product design teams should meet, identify themajor impacts of a product’s life cycle, and guide theimprovement of new product systems toward a netreduction of resource requirements and emissions inthe industrial system as a whole. Externally, LCAs canbe used to compare the environmental profiles of alter-
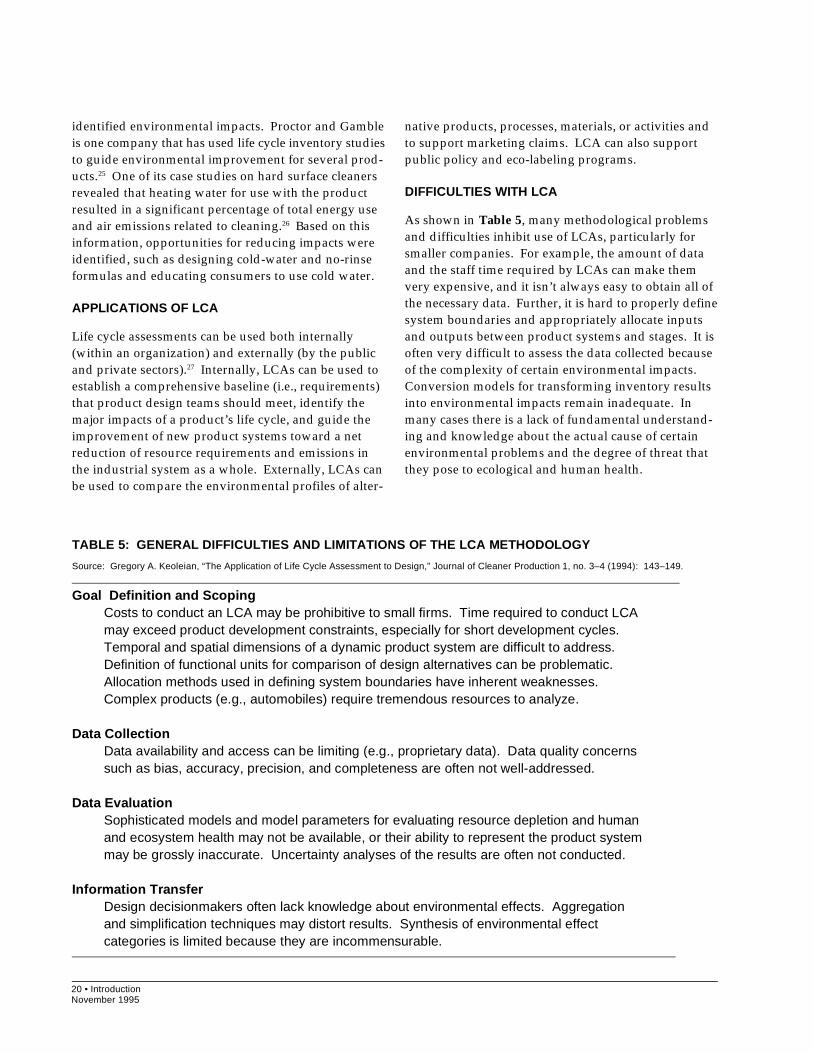
TABLE 5: GENERAL DIFFICULTIES AND LIMITATIONS OF THE LCA METHODOLOGY
Source: Gregory A. Keoleian, “The Application of Life Cycle Assessment to Design,” Journal of Cleaner Production 1, no. 3–4 (1994): 143–149.
Goal Definition and ScopingCosts to conduct an LCA may be prohibitive to small firms. Time required to conduct LCAmay exceed product development constraints, especially for short development cycles.Temporal and spatial dimensions of a dynamic product system are difficult to address.Definition of functional units for comparison of design alternatives can be problematic.Allocation methods used in defining system boundaries have inherent weaknesses.Complex products (e.g., automobiles) require tremendous resources to analyze.
Data CollectionData availability and access can be limiting (e.g., proprietary data). Data quality concernssuch as bias, accuracy, precision, and completeness are often not well-addressed.
Data EvaluationSophisticated models and model parameters for evaluating resource depletion and humanand ecosystem health may not be available, or their ability to represent the product systemmay be grossly inaccurate. Uncertainty analyses of the results are often not conducted.
Information TransferDesign decisionmakers often lack knowledge about environmental effects. Aggregationand simplification techniques may distort results. Synthesis of environmental effectcategories is limited because they are incommensurable.
native products, processes, materials, or activities andto support marketing claims. LCA can also supportpublic policy and eco-labeling programs.
DIFFICULTIES WITH LCA
As shown in Table 5, many methodological problemsand difficulties inhibit use of LCAs, particularly forsmaller companies. For example, the amount of dataand the staff time required by LCAs can make themvery expensive, and it isn’t always easy to obtain all ofthe necessary data. Further, it is hard to properly definesystem boundaries and appropriately allocate inputsand outputs between product systems and stages. It isoften very difficult to assess the data collected becauseof the complexity of certain environmental impacts.Conversion models for transforming inventory resultsinto environmental impacts remain inadequate. Inmany cases there is a lack of fundamental understand-ing and knowledge about the actual cause of certainenvironmental problems and the degree of threat thatthey pose to ecological and human health.
Introduction • 21November 1995
In the absence of an accepted methodology, resultsof LCAs can differ. Order-of-magnitude differencesare not uncommon. Discrepancies can be attributedto differences in assumptions and system boundaries.
Regardless of the current limitations, LCAs offer apromising tool to identify and then implement strate-gies to reduce the environmental impacts of specificproducts and processes as well as to compare the rela-tive merits of product and process options. However,much work needs to be done to develop, utilize, evalu-ate, and refine the LCA framework.
Life Cycle Design (LCD) andDesign For the Environment (DfE)
The design of products shapes the environmental per-formance of the goods and services that are producedto satisfy our individual and societal needs.28 Environ-mental concerns need to be more effectively addressedin the design process to reduce the environmental im-pacts associated with a product over its life cycle. LifeCycle Design, Design for Environment, and other simi-lar initiatives based on the product life cycle are beingdeveloped to systematically incorporate these environ-mental concerns into the design process.
Life Cycle Design (LCD) is a systems-oriented approachfor designing more ecologically and economically sus-tainable product systems. Coupling the product devel-opment cycle used in business with a product’s physicallife cycle, LCD integrates environmental requirementsinto each design stage so total impacts caused by theproduct system can be reduced.29
Design for Environment (DfE) is another design strategythat can be used to design products with reduced envi-ronmental burden. DfE and LCD can be difficult todistinguish. They have similar goals but evolved fromdifferent sources. DfE evolved from the “Design for X”approach, where X can represent manufacturability,testability, reliability, or other “downstream” designconsiderations. 30 Braden Allenby has developed a DfEframework to address the entire product life cycle.Like LCD, DfE uses a series of matrices in an attempt todevelop and then incorporate environmental require-ments into the design process. DfE is based on theproduct life cycle framework and focuses on integratingenvironmental issues into products and process design.
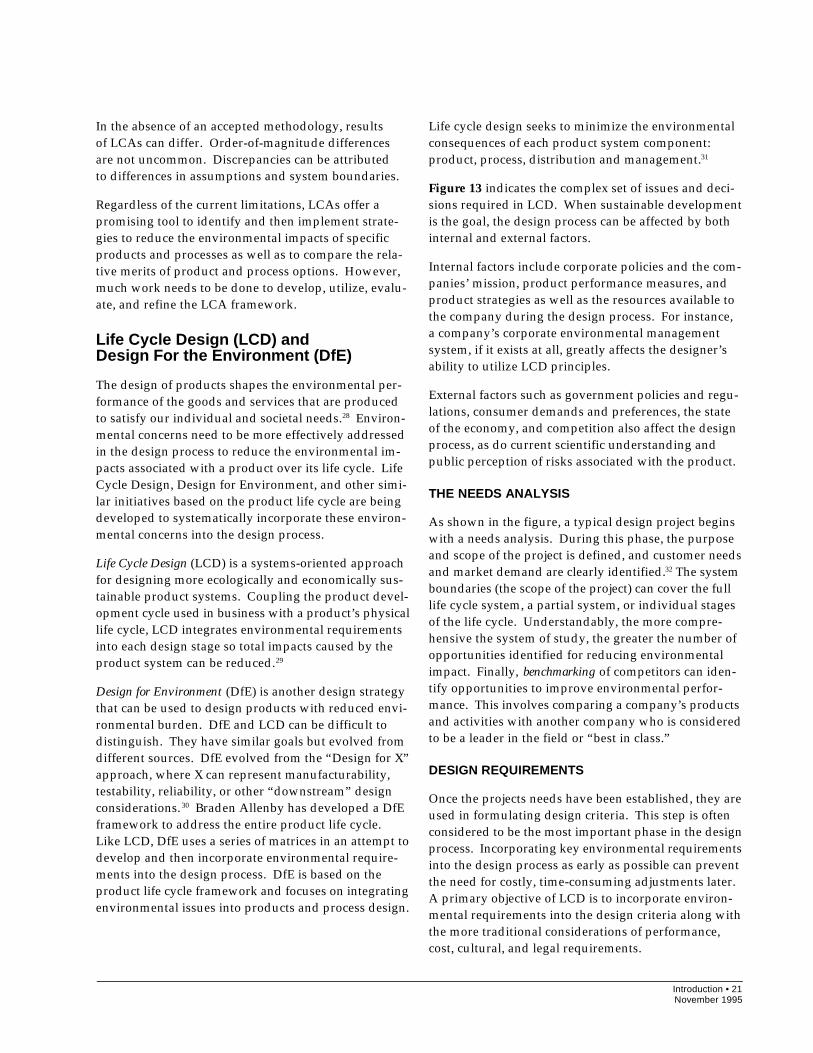
Life cycle design seeks to minimize the environmentalconsequences of each product system component:product, process, distribution and management.31
Figure 13 indicates the complex set of issues and deci-sions required in LCD. When sustainable developmentis the goal, the design process can be affected by bothinternal and external factors.
Internal factors include corporate policies and the com-panies’ mission, product performance measures, andproduct strategies as well as the resources available tothe company during the design process. For instance,a company’s corporate environmental managementsystem, if it exists at all, greatly affects the designer’sability to utilize LCD principles.
External factors such as government policies and regu-lations, consumer demands and preferences, the stateof the economy, and competition also affect the designprocess, as do current scientific understanding andpublic perception of risks associated with the product.
THE NEEDS ANALYSIS
As shown in the figure, a typical design project beginswith a needs analysis. During this phase, the purposeand scope of the project is defined, and customer needsand market demand are clearly identified.32 The systemboundaries (the scope of the project) can cover the fulllife cycle system, a partial system, or individual stagesof the life cycle. Understandably, the more compre-hensive the system of study, the greater the number ofopportunities identified for reducing environmentalimpact. Finally, benchmarking of competitors can iden-tify opportunities to improve environmental perfor-mance. This involves comparing a company’s productsand activities with another company who is consideredto be a leader in the field or “best in class.”
DESIGN REQUIREMENTS
Once the projects needs have been established, they areused in formulating design criteria. This step is oftenconsidered to be the most important phase in the designprocess. Incorporating key environmental requirementsinto the design process as early as possible can preventthe need for costly, time-consuming adjustments later.A primary objective of LCD is to incorporate environ-mental requirements into the design criteria along withthe more traditional considerations of performance,cost, cultural, and legal requirements.
22 • IntroductionNovember 1995
Life Cycle Design ManagementInternal Factors• Policy• Performance Measures• Strategy• Resources
Research & DevelopmentNeeds Analysis
State of Environment
Requirements
DesignSolution
Implement
Continuous Improvement
Design Strategies
Life Cycle GoalSustainable Development
Evaluation• Analysis Tools environmental cost• Tradeoff Analysis
• Environmental • Performance • Cost • Cultural • Legal
• Significant needs • Scope & purpose • Baseline
• Production• Use & service• Retirement
• Multi-stakeholders• Concurrent Design• Team Coordination
Continuous Assessment
External Factors• Government policy and regulations• Market demand• Infrastructure
FIGURE 13: LIFE CYCLE DESIGN
Source: Keoleian and Menerey, Life Cycle Design Guidance Manual (Cincinnati: U.S. EPA Risk Reduction Engineering Laboratory, January 1993), 23.
Introduction • 23November 1995
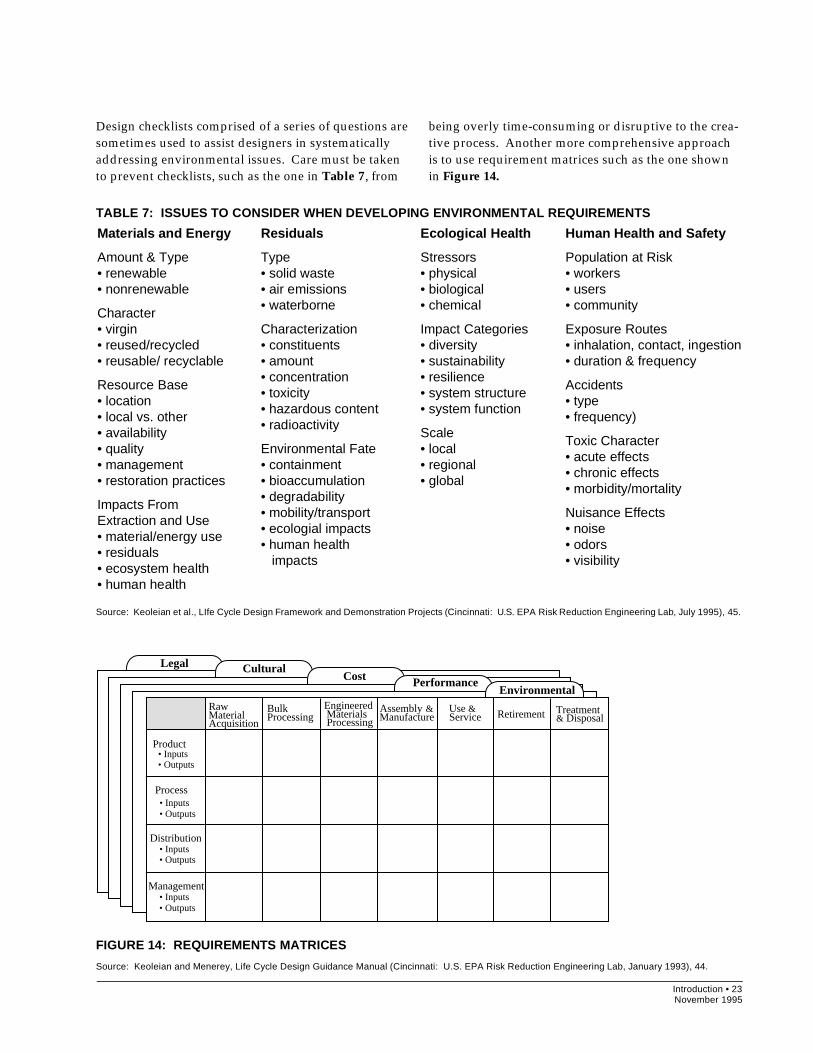
Design checklists comprised of a series of questions aresometimes used to assist designers in systematicallyaddressing environmental issues. Care must be takento prevent checklists, such as the one in Table 7, from
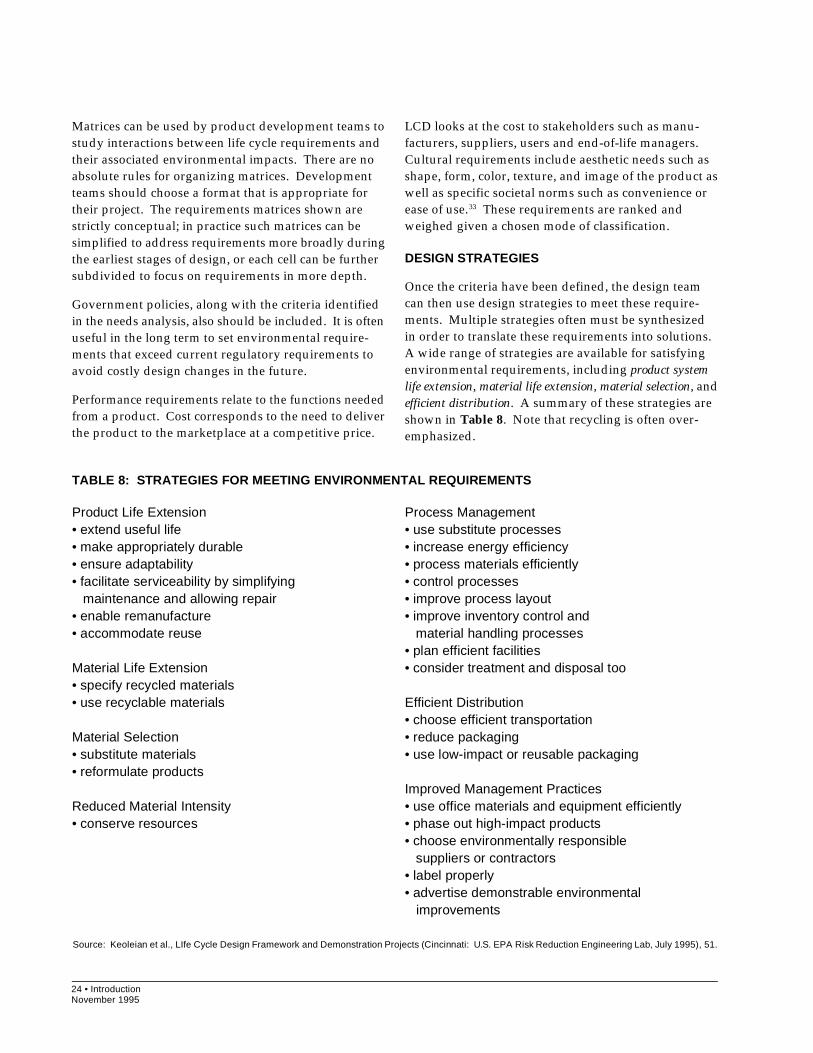
being overly time-consuming or disruptive to the crea-tive process. Another more comprehensive approachis to use requirement matrices such as the one shownin Figure 14.
TABLE 7: ISSUES TO CONSIDER WHEN DEVELOPING ENVIRONMENTAL REQUIREMENTS
Legal CulturalCost Performance
EnvironmentalRaw Material Acquisition
Bulk Processing
Engineered Materials Processing
Use & Service Retirement Treatment
& Disposal
Product • Inputs• Outputs
Process
Distribution
Management
• Inputs• Outputs
• Inputs• Outputs
• Inputs• Outputs
Assembly &Manufacture
Materials and Energy
Amount & Type• renewable• nonrenewable
Character• virgin• reused/recycled• reusable/ recyclable
Resource Base• location• local vs. other• availability• quality• management• restoration practices
Impacts FromExtraction and Use• material/energy use• residuals• ecosystem health• human health
Ecological Health
Stressors• physical• biological• chemical
Impact Categories• diversity• sustainability• resilience• system structure• system function
Scale• local• regional• global
Residuals
Type• solid waste• air emissions• waterborne
Characterization• constituents• amount• concentration• toxicity• hazardous content• radioactivity
Environmental Fate• containment• bioaccumulation• degradability• mobility/transport• ecologial impacts• human health impacts
Human Health and Safety
Population at Risk• workers• users• community
Exposure Routes• inhalation, contact, ingestion• duration & frequency
Accidents• type• frequency)
Toxic Character• acute effects• chronic effects• morbidity/mortality
Nuisance Effects• noise• odors• visibility
Source: Keoleian et al., LIfe Cycle Design Framework and Demonstration Projects (Cincinnati: U.S. EPA Risk Reduction Engineering Lab, July 1995), 45.
FIGURE 14: REQUIREMENTS MATRICES
Source: Keoleian and Menerey, Life Cycle Design Guidance Manual (Cincinnati: U.S. EPA Risk Reduction Engineering Lab, January 1993), 44.
24 • IntroductionNovember 1995
Matrices can be used by product development teams tostudy interactions between life cycle requirements andtheir associated environmental impacts. There are noabsolute rules for organizing matrices. Developmentteams should choose a format that is appropriate fortheir project. The requirements matrices shown arestrictly conceptual; in practice such matrices can besimplified to address requirements more broadly duringthe earliest stages of design, or each cell can be furthersubdivided to focus on requirements in more depth.
Government policies, along with the criteria identifiedin the needs analysis, also should be included. It is oftenuseful in the long term to set environmental require-ments that exceed current regulatory requirements toavoid costly design changes in the future.
Performance requirements relate to the functions neededfrom a product. Cost corresponds to the need to deliverthe product to the marketplace at a competitive price.
LCD looks at the cost to stakeholders such as manu-facturers, suppliers, users and end-of-life managers.Cultural requirements include aesthetic needs such asshape, form, color, texture, and image of the product aswell as specific societal norms such as convenience orease of use.33 These requirements are ranked andweighed given a chosen mode of classification.
DESIGN STRATEGIES
Once the criteria have been defined, the design teamcan then use design strategies to meet these require-ments. Multiple strategies often must be synthesizedin order to translate these requirements into solutions.A wide range of strategies are available for satisfyingenvironmental requirements, including product systemlife extension, material life extension, material selection, andefficient distribution. A summary of these strategies areshown in Table 8. Note that recycling is often over-emphasized.
TABLE 8: STRATEGIES FOR MEETING ENVIRONMENTAL REQUIREMENTS
Product Life Extension• extend useful life• make appropriately durable• ensure adaptability• facilitate serviceability by simplifying maintenance and allowing repair• enable remanufacture• accommodate reuse
Material Life Extension• specify recycled materials• use recyclable materials
Material Selection• substitute materials• reformulate products
Reduced Material Intensity• conserve resources
Process Management• use substitute processes• increase energy efficiency• process materials efficiently• control processes• improve process layout• improve inventory control and material handling processes• plan efficient facilities• consider treatment and disposal too
Efficient Distribution• choose efficient transportation• reduce packaging• use low-impact or reusable packaging
Improved Management Practices• use office materials and equipment efficiently• phase out high-impact products• choose environmentally responsible suppliers or contractors• label properly• advertise demonstrable environmental improvements
Source: Keoleian et al., LIfe Cycle Design Framework and Demonstration Projects (Cincinnati: U.S. EPA Risk Reduction Engineering Lab, July 1995), 51.
Introduction • 25November 1995
DESIGN EVALUATION
Finally, it is critical that the design is evaluated andanalyzed throughout the design process. Tools fordesign evaluation range from LCA to single-focusenvironmental metrics. In each case, design solutionsare evaluated with respect to a full spectrum of criteria,which includes cost and performance.
DfE methods developed by Allenby use a semi-quantitative matrix approach for evaluating life cycleenvironmental impacts.34 35 A graphic scoring systemweighs environmental effects according to availablequantitative information for each life cycle stage. In
addition to an environmental matrix and toxicology/exposure matrix, manufacturing and social/politicalmatrices are used to address both technical and non-technical aspects of design alternatives.
Although LCD is not yet widely practiced, it has beenused by companies like AT&T and AlliedSignal andis recognized as an important approach for reducingenvironmental burdens. To enhance the use of LCD,appropriate government policies must be evaluatedand established. In addition, environmental accountingmethods must be further developed and utilized byindustry (these methods are often referred to as LifeCycle Costing or Full Cost Accounting — see Table 9.)
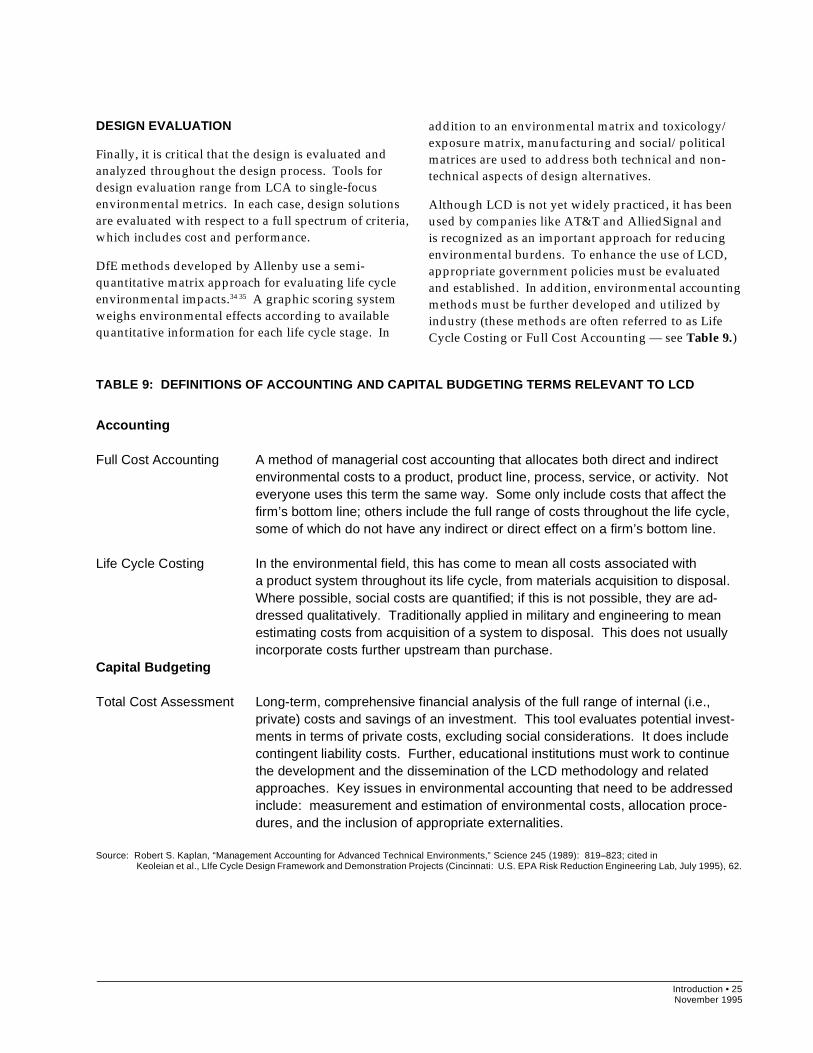
TABLE 9: DEFINITIONS OF ACCOUNTING AND CAPITAL BUDGETING TERMS RELEVANT TO LCD
Accounting
Full Cost Accounting A method of managerial cost accounting that allocates both direct and indirectenvironmental costs to a product, product line, process, service, or activity. Noteveryone uses this term the same way. Some only include costs that affect thefirm’s bottom line; others include the full range of costs throughout the life cycle,some of which do not have any indirect or direct effect on a firm’s bottom line.
Life Cycle Costing In the environmental field, this has come to mean all costs associated witha product system throughout its life cycle, from materials acquisition to disposal.Where possible, social costs are quantified; if this is not possible, they are ad-dressed qualitatively. Traditionally applied in military and engineering to meanestimating costs from acquisition of a system to disposal. This does not usuallyincorporate costs further upstream than purchase.
Capital Budgeting
Total Cost Assessment Long-term, comprehensive financial analysis of the full range of internal (i.e.,private) costs and savings of an investment. This tool evaluates potential invest-ments in terms of private costs, excluding social considerations. It does includecontingent liability costs. Further, educational institutions must work to continuethe development and the dissemination of the LCD methodology and relatedapproaches. Key issues in environmental accounting that need to be addressedinclude: measurement and estimation of environmental costs, allocation proce-dures, and the inclusion of appropriate externalities.
Source: Robert S. Kaplan, “Management Accounting for Advanced Technical Environments,” Science 245 (1989): 819–823; cited in Keoleian et al., LIfe Cycle Design Framework and Demonstration Projects (Cincinnati: U.S. EPA Risk Reduction Engineering Lab, July 1995), 62.
26 • IntroductionNovember 1995
Future Needs forthe Developmentof Industrial Ecology
Industrial ecology is an emerging framework. Thusmuch research and development of the field and itsconcepts need to be done. Future needs for the furtherdevelopment of industrial ecology include:
• A clearer definition of the field and its concepts. Thedefinition of industrial ecology, its scope and itsgoals need to be clarified and unified in order to bemore useful. The application of systems analysismust be further refined.
• A clearer definition of sustainable development,what constitutes sustainable development, and howit might be achieved, will help define the goals andobjectives of industrial ecology. Difficult goals to ad-dress, along with the maintenance of ecological sys-tem health, are intergenerational and intersocietalequity.
• More participation from a cross section of fields suchas ecology, public health, business, natural resourcesand engineering should be encouraged in order tomeet some of the vast research and information re-quirements needed to identify and implement strate-gies to reduce environmental burdens.
• Increased curriculum development efforts on sus-tainable development in professional schools of engi-neering, business, public health, natural resources,and law. The role of industrial ecology in these ef-forts should be further explored and defined. Deter-mining whether industrial ecology courses should bediscipline specific, interdisciplinary or integrated asmodules into existing courses.
• Further research on the impacts of industrial ecosys-tem activities on natural ecosystems in order to iden-tify what problems need to be resolved and how.
• Greater recognition of the importance of the systemsapproach to identifying and resolving environmentalproblems.
• Further development of tools such as life cycle as-sessment and life cycle design and design for the en-vironment.
• The improvement of governmental policies that willstrengthen incentives for industry to reduce environ-mental burdens.
Further Information
Further resources, references and sources of informa-tion are provided in other sections of this compen-dium. Please forward any comments or concerns di-rectly to the National Pollution Prevention Center.Your input is encouraged and appreciated.

Introduction • 27November 1995
Endnotes1 Robert A. Frosch, “Industrial Ecology: A Philosophical Introduction,”Proceedings of the National Academy of Sciences, USA 89 (February1992): 800–803.2 Robert U. Ayres, “Industrial Metabolism” in Technology and Environment(Washington: National Academy Press, 1989), 23–49.3 Ibid.4 Daniel R. Lynch and Charles E. Hutchinson, “Environmental Education,”Proceedings of the National Academy of Sciences, USA 89 (February1992): 864-867.5 Chauncey Starr, “Education For Industrial Ecology,” Proceedings ofthe National Academy of Sciences, USA 89 (February 1992).6 Eugene P. Odum, Ecology and Our Endangered Life-Support Systems,2nd ed. (Sunderland, MA: Sinauer Associates, Inc., 1993).7 Michael Begens, John Harper, and Colin Townsend, Ecology: Individuals,Populations and Communities (London: Blackwell Press, 1991).8 Gregory A. Keoleian and Dan Menerey, “Sustainable Development byDesign: Review of Life Cycle Design and Related Approaches,” Air andWaste (Journal Of the Air and Waste Management Association) 44 (May1994): 646.9 United Nations World Commission on Environment and Development,Our Common Future (New York: Oxford University Press, 1987).10 Keoleian and Menerey, “Sustainable Development,” 649.11 Ibid., 650.12 Ibid., 650.13 Kenneth Boulding, “General Systems Theory—The Skeleton of Science,”Management Science 2, no. 3 (April 1956): 197–198.14 Frosch, 800–803.15 Harry Freeman, Teresa Harten, Johnny Springer, Paul Randall, Mary AnnCurran, and Kenneth Stone, “Industrial Pollution Prevention: A CriticalReview,” Air and Waste (Journal of the Air and Waste ManagementAssociation) 42, no. 5 (May 1992): 619.16 Ibid., 620.17 Ibid., 620.18 Tim Jackson, ed., Clean Production Strategies: Developing PreventiveEnvironmental Management in the Industrial Economy (New York: LewisPublishers, 1993).
19 Society of Environmental Toxicology and Chemistry Foundation forEnvironmental Education, “A Technical Framework for Life-CycleAssessment — SETAC Workshop, Smuggler’s Notch, VT, 18 August 1990”(Pensacola, Florida: SETAC, 1991).20 B. W. Vigon, D. A. Tolle, B. W. Cornary, H. C. Latham, C. L. Harrison,T. L. Bouguski, R. G. Hunt, and J. D. Sellers, “Life Cycle Assessment:Inventory Guidelines and Principles,” EPA/600/R-92/245 (Cincinnati: U.S.Environmental Protection Agency, Risk Reduction Engineering Laboratory,February 1993).21 R. Hiejungs, J. B. Guinee, G. Huppes, R. M. Lankreijer, H. S. Udo deHaes, A. Wegener Sleeswijk, A. M. M. Ansems, P. G. Eggels, R. van Duin,and de Goede, “Environmental Life Cycle Assessment of Products—Back-grounds” (Leiden, Netherlands: Center of Environmental Science, 1992).22 Society of Environmental Toxicology and Chemistry, Guidelines for Life-Cycle Assessment: A “Code of Practice” (Pensacola, Florida: SETAC, 1993).23 Vigon et al., p. 5.24 Ibid.25 Mary Ann Curran, “Broad-Based Environmental Life Cycle Assessment,”Environmental Science and Technology 27, no. 3 (1993): 430-436.26 Franklin and Associates, “Resource and Environmental Profile Analysisof Hard Surface Cleaners and Mix-Your-Own Cleaning Systems” (PrairieVillage, KS: Franklin and Associates, 1993).27 Vigon et al.28 Keoleian and Menerey, “Sustainable Development,” 645.29 Gregory A. Keoleian and Dan Menerey, Life Cycle Design GuidanceManual, EPA/600/R-92/226 (Cincinnati: U.S. EPA Risk ReductionEngineering Laboratory, January 1993).30 Braden Allenby, “Design For the Environment: A Tool Whose Time HasCome,” SSA Journal (September 1991): 6.31 Keoleian and Menerey, “Sustainable Development,” 665.32 Ibid., 651.33 Ibid., 654.34 Braden R. Allenby and Ann Fullerton, “Design for Environment—A NewStrategy for Environmental Management,” Pollution Prevention Review(Winter 1991): 51-61.35 Allenby, “Design For the Environment: A Tool Whose Time Has Come,” 6-9.
28 • IntroductionNovember 1995
Participants in the Kalundborg symbiosis are:
• Asnæsværket, Denmark’s largest power plant.The plant is coal-fired with a capacity of 1,500 MW.It employs about 600 people.
• The Statoil oil refinery, Denmark’s largest refinerywith a capacity of about three million tons/year.The refinery is currently being expanded to acapacity of five million tons/year with a manninglevel of about 250 people.
• Gyproc A/S, a plaster board manufacturing plantproducing about 14 million m2/year of plasterboard for the building industry. The employmentis about 175 people.
• Novo Nordisk, a biotechnological industry produc-ing about 45% of the world market of insulin andabout 50% of the world market of enzymes. Inaddition, there is substantial production of growthhormones and other pharmaceutical products.Novo Nordisk is operating in several countries,but the Kalundborg plant with its 1,100 people isthe largest production site.
• The Kalundborg municipality, who through itstechnical administration is the operator of alldistribution of water, electricity, and district heatingin the Kalundborg city area.
Development of the symbiosis
• In 1959 Asnæsværket, who is the central partnerin the symbiosis, was started up.
• In 1961 Tidewater Oil Company commissionedthe first oil refinery in Denmark. The refinery wastaken over by Esso two years later and acquiredby Statoil in 1987 along with Esso’s Danish market-ing facilities. To ensure adequate water supply, apipeline from the Lake Tissø was constructed.
• In 1972 Gyproc established a plaster boardmanufacturing plant. A pipeline for supply ofexcess refinery gas was constructed.
• In 1973 the Asnæs power plan was expanded.The additional water requirements were suppliedthrough a connection to the Tissø pipeline follow-ing an agreement with the refinery.
• In 1976 Novo Nordisk started delivery byspecial tank trucks of biological sludge to theneighbouring farming community.
Appendix A: “The Industrial Symbiosisat Kalundborg, Denmark”
Presented at the National Academy of EngineeringInternational Conference on Industrial Ecology
Irvine, California, May 9–13, 1994By Henning Grann, Statoil
Reprinted with permission of the author
Background
The concept of sustainable development is beingwidely referred to by politicians, authorities, industri-alists, and the press. Although there is agreement inprinciple about the meaning of this concept, there aremany and differing opinions as to what it means inpractice and how the concept should be translatedinto specific action.
The subject for my presentation is “Industrial Sym-biosis,” and I think that this could well be viewed asa practical example of application of the sustainabledevelopment concept. The industrial symbiosisproject at Kalundborg (100 km west of Copenhagen)in Denmark has attracted a good deal of internationalattention, notably by the EC Commission, and theproject has been awarded a number of environmentalprizes.
The symbiosis project is originally not the result of acareful environmental planning process. It is ratherthe result of a gradual development of co-operationbetween four neighbouring industries and theKalundborg municipality. From a stage where thingshappened by chance, this co-operation has nowdeveloped into a high level of environmental con-sciousness, where the participants are constantlyexploring new avenues of environmental co-operation.
What is industrial symbiosis? In short, it is a processwhereby a waste product in one industry is turnedinto a resource for use in one or more other industries.A more profound definition could be:
“A co-operation between different industries bywhich the presence of each of them increases theviability of the others and by which the demandsfrom society for resource conservation and envi-ronmental protection are taken into consideration.”
Introduction • 29November 1995
• In 1979 the power plant started supply of fly ash(until then a troublesome waste product) tocement manufacturers (e.g., Aalborg Portland).
• In 1981 the Kalundborg municipality completed adistrict heating distribution network within the cityof Kalundborg utilising waste heat from the powerplant.
• In 1982 Novo Nordisk and the Statoil refinerycompleted the construction of steam supplypipelines from the power plant. The subsequentpurchase of process steam from the power plantenabled the shut-down of their own inefficientsteam boiler capacity.
• In 1987 the Statoil refinery completed a pipelinefor supply of cooling water effluent to the powerplant for use as raw boiler feed water.
• In 1989 the power plant started to use thewaste heat in salt cooling water (+7–8°C) forfish production (trouts and turbot).
• In 1989 Novo Nordisk entered into an agreementwith the Kalundborg municipality, the power plant,and the refinery for supply of Tissø water to meetNovo’s rising demand for cooling water followingseveral expansions.
• In 1990 the Statoil refinery completed the con-struction of a sulphur recovery plant for productionof elemental sulphur being sold as a raw materialfor sulphuric acid manufacture.
• In 1991 the Statoil refinery commissioned apipeline for supply of biologically treated refineryeffluent water to the power plant for use in variouscleaning purposes and for fly ash stabilisation.
• In 1992 the Statoil refinery commissioned apipeline for supply of refinery flare gas to thepower plant as a supplementary fuel.
• In 1993 the power plant completed a stack flue gasdesulphurisation project. This process convertsflue gas SO2 to calcium sulphate (or gypsum)which is sold to the Gyproc plaster board plant,where it replaces imports of natural gypsum asraw material. The new raw material from thepower plant results in increased plaster boardquality characteristics.
• The construction of green houses are beingconsidered by the power plant and by the refineryfor utilisation of residual waste heat.
Typical characteristics of an effective symbiosis
• The participating industries must fit together,but be different.
• The individual industry agreements are basedon commercially sound principles.
• Environmental improvements, resource conser-vation, and economic incentives go hand in hand.
• The development of the symbiosis has been on avoluntary basis, but in close co-operation with theauthorities.
• Short physical distances between participatingplants are a definite advantage.
• Short “mental” distances are equally important.
• Mutual management understanding andco-operative commitment is essential.
• Effective operative communication betweenparticipants is required.
• Significant side benefits are achieved in otherareas such as safety and training.
Achieved results of the symbiosis
The most significant achievements of the industrialsymbiosis co-operation at Kalundborg may besummarised as:
• Significant reductions of the consumption ofenergy and utilities in terms of coal, oil, and water.
• Environmental improvements through reducedSO2 and CO2 emissions and through reducedvolumes of effluent water of an improved quality.
• Conversion of traditional waste products such asfly ash, sulphur, biological sludge, and gypsuminto raw materials for production.
• Gradual development of a systematic environ-mental “way of thinking” which is applicable tomany other industries and which may proveparticularly beneficial in the planning of futureindustrial complexes.
• Creation of a deservedly positive image ofKalundborg as a clean industrial city.
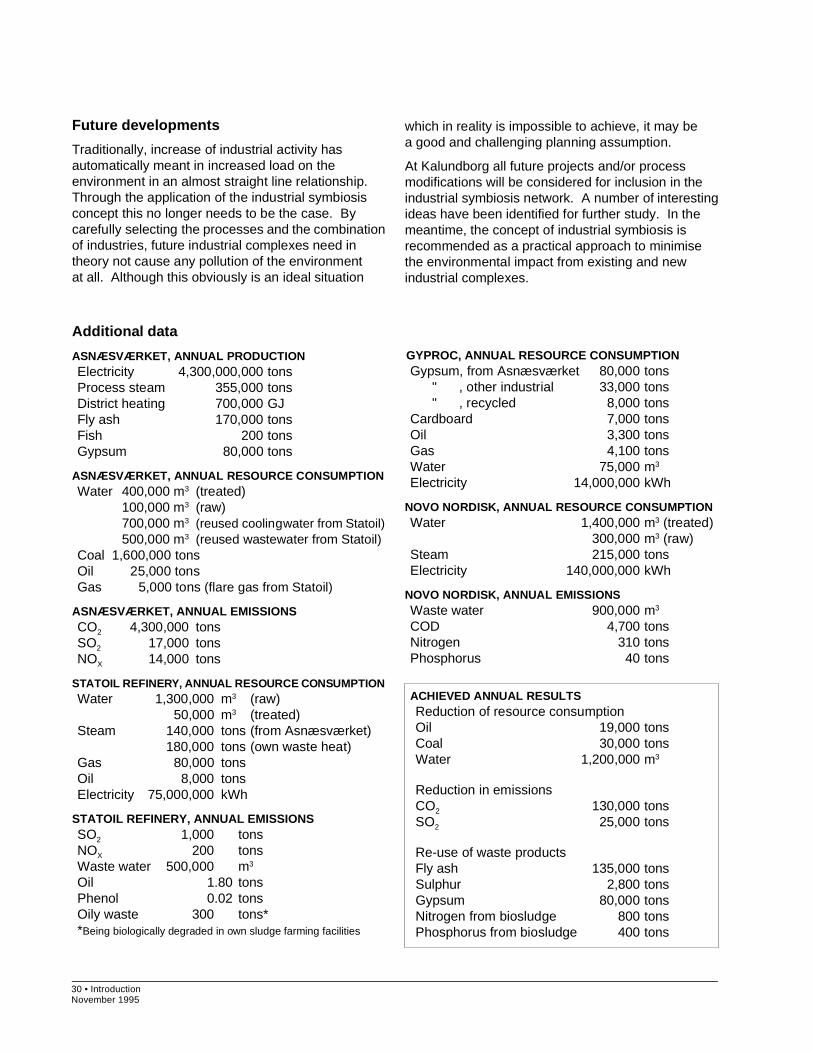
30 • IntroductionNovember 1995
Future developments
Traditionally, increase of industrial activity hasautomatically meant in increased load on theenvironment in an almost straight line relationship.Through the application of the industrial symbiosisconcept this no longer needs to be the case. Bycarefully selecting the processes and the combinationof industries, future industrial complexes need intheory not cause any pollution of the environmentat all. Although this obviously is an ideal situation
which in reality is impossible to achieve, it may bea good and challenging planning assumption.
At Kalundborg all future projects and/or processmodifications will be considered for inclusion in theindustrial symbiosis network. A number of interestingideas have been identified for further study. In themeantime, the concept of industrial symbiosis isrecommended as a practical approach to minimisethe environmental impact from existing and newindustrial complexes.
Additional data
ASNÆSVÆRKET, ANNUAL PRODUCTIONElectricity 4,300,000,000 tonsProcess steam 355,000 tonsDistrict heating 700,000 GJFly ash 170,000 tonsFish 200 tonsGypsum 80,000 tons
ASNÆSVÆRKET, ANNUAL RESOURCE CONSUMPTIONWater 400,000 m3 (treated)
100,000 m3 (raw)700,000 m3 (reused coolingwater from Statoil)500,000 m3 (reused wastewater from Statoil)
Coal 1,600,000 tonsOil 25,000 tonsGas 5,000 tons (flare gas from Statoil)
ASNÆSVÆRKET, ANNUAL EMISSIONSCO2 4,300,000 tonsSO2 17,000 tonsNOX 14,000 tons
STATOIL REFINERY, ANNUAL RESOURCE CONSUMPTIONWater 1,300,000 m3 (raw)
50,000 m3 (treated)Steam 140,000 tons (from Asnæsværket)
180,000 tons (own waste heat)Gas 80,000 tonsOil 8,000 tonsElectricity 75,000,000 kWh
STATOIL REFINERY, ANNUAL EMISSIONSSO2 1,000 tonsNOX 200 tonsWaste water 500,000 m3
Oil 1.80 tonsPhenol 0.02 tonsOily waste 300 tons**Being biologically degraded in own sludge farming facilities
GYPROC, ANNUAL RESOURCE CONSUMPTIONGypsum, from Asnæsværket 80,000 tons " , other industrial 33,000 tons " , recycled 8,000 tonsCardboard 7,000 tonsOil 3,300 tonsGas 4,100 tonsWater 75,000 m3
Electricity 14,000,000 kWh
NOVO NORDISK, ANNUAL RESOURCE CONSUMPTIONWater 1,400,000 m3 (treated)
300,000 m3 (raw)Steam 215,000 tonsElectricity 140,000,000 kWh
NOVO NORDISK, ANNUAL EMISSIONSWaste water 900,000 m3
COD 4,700 tonsNitrogen 310 tonsPhosphorus 40 tons
ACHIEVED ANNUAL RESULTSReduction of resource consumptionOil 19,000 tonsCoal 30,000 tonsWater 1,200,000 m3
Reduction in emissionsCO2 130,000 tonsSO2 25,000 tons
Re-use of waste productsFly ash 135,000 tonsSulphur 2,800 tonsGypsum 80,000 tonsNitrogen from biosludge 800 tonsPhosphorus from biosludge 400 tons
Introduction • 31November 1995
Industrial ecology can be best defined as the totalityor the pattern of relationships between various indus-trial activities, their products, and the environment.Traditional ecological activities have focused on twotime aspects of interactions between the industrialactivities and the environment — the past and thepresent. Industrial ecology, a systems view of theenvironment, pertains to the future.
— C. Kumar N. Patel, “Industrial Ecology,”Proceedings of the National Academy ofSciences, USA 89 (February 1992).
Industrial Ecology is the study of how we humanscan continue rearranging Earth, but in such a wayas to protect our own health, the health of naturalecosystems, and the health of future generations ofplants and animals and humans. It encompassesmanufacturing, agriculture, energy production, andtransportation — nearly all of those things we do toprovide food and make life easier and more pleasantthan it would be without them.
— Bette Hileman, “Industrial Ecology Route to SlowGlobal Change Proposed,” Chemical and Engineer-ing News (Aug. 24 ,1992): 7.
Industrial ecology involves designing industrialinfrastructures as if they were a series of interlockingmanmade ecosystems interfacing with the naturalglobal ecosystem. Industrial ecology takes the patternof the natural environment as a model for solvingenvironmental problems, creating a new paradigmfor the industrial system in the process. . . . The aimof industrial ecology is to interpret and adapt anunderstanding of the natural system and apply it tothe design of the manmade system, in order toachieve a pattern of industrialization that is not onlymore efficient, but that is intrinsically adjusted to thetolerance and characteristics of the natural system.The emphasis is on forms of technology that workwith natural systems, not against them.
— Hardin B. C. Tibbs, “Industrial Ecology: AnEnvironmental Agenda for Industry,” Whole EarthReview 77 (December 1992).
The heart of industrial ecology is a simple recognitionthat manufacturing and service systems are in factnatural systems, intimately connected to their local andregional ecosystems and the global biosphere. . . theultimate goal . . . is bringing the industrial system asclose as possible to being a closed-loop system, withnear complete recycling of all materials.
— Ernest Lowe. “Industrial Ecology — An Orga-nizing Framework for Environmental Management.”TQEM (Autumn 1993).
Appendix B: “Selected Definitions ofIndustrial Ecology”
The idea of an industrial ecology is based upon astraightforward analogy with natural ecological systems.In nature an ecological system operates through a webof connections in which organisms live and consumeeach other and each other’s waste. The system hasevolved so that the characteristic of communities ofliving organisms seems to be that nothing that containsavailable energy or useful material will be lost. Therewill evolve some organism that will manage to make itsliving by dealing with any waste product that providesavailable energy or usable material. Ecologists talk ofa food web: an interconnection of uses of both organ-isms and their wastes. In the industrial context wemay think of this as being use of products and wasteproducts. The system structure of a natural ecologyand the structure of an industrial system, or an eco-nomic system, are extremely similar.
— Robert A. Frosch, “Industrial Ecology: APhilosophical Introduction,” Proceedings of theNational Academy of Sciences, USA 89 (February1992): 800–803.
Somewhat teleologically, “industrial ecology” may bedefined as the means by which a state of sustainabledevelopment is approached and maintained. It consistsof a systems view of human economic activity and itsinterrelationship with fundamental biological, chemical,and physical systems with the goal of establishing andmaintaining the human species at levels that can besustained indefinitely, given continued economic,cultural, and technological evolution.
— Braden Allenby, “Achieving Sustainable Develop-ment Through Industrial Ecology,” InternationalEnvironmental Affairs 4, no.1 (1992).
Industrial Ecology is a new approach to the industrialdesign of products and processes and the implementa-tion of sustainable manufacturing strategies. It is aconcept in which an industrial system is viewed not inisolation from its surrounding systems but in concertwith them. Industrial ecology seeks to optimize thetotal materials cycle from virgin material to finishedmaterial to component, to product, to waste products,and to ultimate disposal. . . . Characteristics are:(1) proactive not reactive, (2) designed in not added on,(3) flexible not rigid, and (4) encompassing not insular.
— L.W. Jelinski, T. E. Graedel, R. A. Laudise, D. W.McCall, and C. Kumar N. Patel, “Industrial Ecology:Concepts and Approaches,” Proceedings of NationalAcademy of Sciences, USA 89 (February 1992).

32 • IntroductionNovember 1995
Industrial ecology is the means by which humanity candeliberately and rationally approach and maintain adesirable carrying capacity, given continued economic,cultural, and technological evolution. The conceptrequires that an industrial system be viewed not inisolation from its surrounding systems, but in concertwith them. It is a systems view in which one seeks tooptimize the total materials cycle from virgin material,to finished material, to component, to product, to wasteproduct, and to ultimate disposal. Factors to be opti-mized include resources, energy, and capital.
— Braden Allenby and Thomas E. Graedel,Industrial Ecology (New York: Prentice Hall,1993; pre-publication edition).
Industrial ecology provides for the first time a large-scale, integrated management tool that designsindustrial infrastructures “as if they were a series ofinterlocking, artificial ecosystems interfacing with thenatural global ecosystem.” For the first time, industryis going beyond life-cycle analysis methodology andapplying the concept of an ecosystem to the whole ofan industrial operation, linking the “metabolism” of onecompany with that of another.
— Paul Hawken, The Ecology of Commerce(New York: HarperBusiness, 1993).
In addition to developing educational materials and conductingresearch, the NPPC also offers an internship program, profes-sional education and training, and conferences.
The NPPC provides educational materials through the WorldWide Web at this URL: http://www.umich.edu/~nppcpub/Please contact us if you have comments about our onlineresources or suggestions for publicizing our educationalmaterials through the Internet.
National Pollution Prevention Center for Higher Education430 East University Ave., Ann Arbor, MI 48109-1115734-764-1412 • fax: 734-647-5841 • [email protected]
The mission of the NPPC is to promote sustainable developmentby educating students, faculty, and professionals about pollutionprevention; create educational materials; provide tools andstrategies for addressing relevant environmental problems; andestablish a national network of pollution prevention educators.