Embed Size (px)
DESCRIPTION
Presented at the Basin Focal Project workshop 'Clarifying the global picture of water, food and poverty' from 18-20th September in Chiang Mai, Thailand.
Citation preview
Indo-Ganges: A Basin under Extreme Pressure
Targeting Double Dividends:Improving Water Productivity and Alleviating Poverty
http://bfp-indogangetic.iwmi.org:8080/
Bharat Sharma On behalf of
BFP-IGB Team
Nexus-
Paradoxon
Hydrology Socio-Ecology
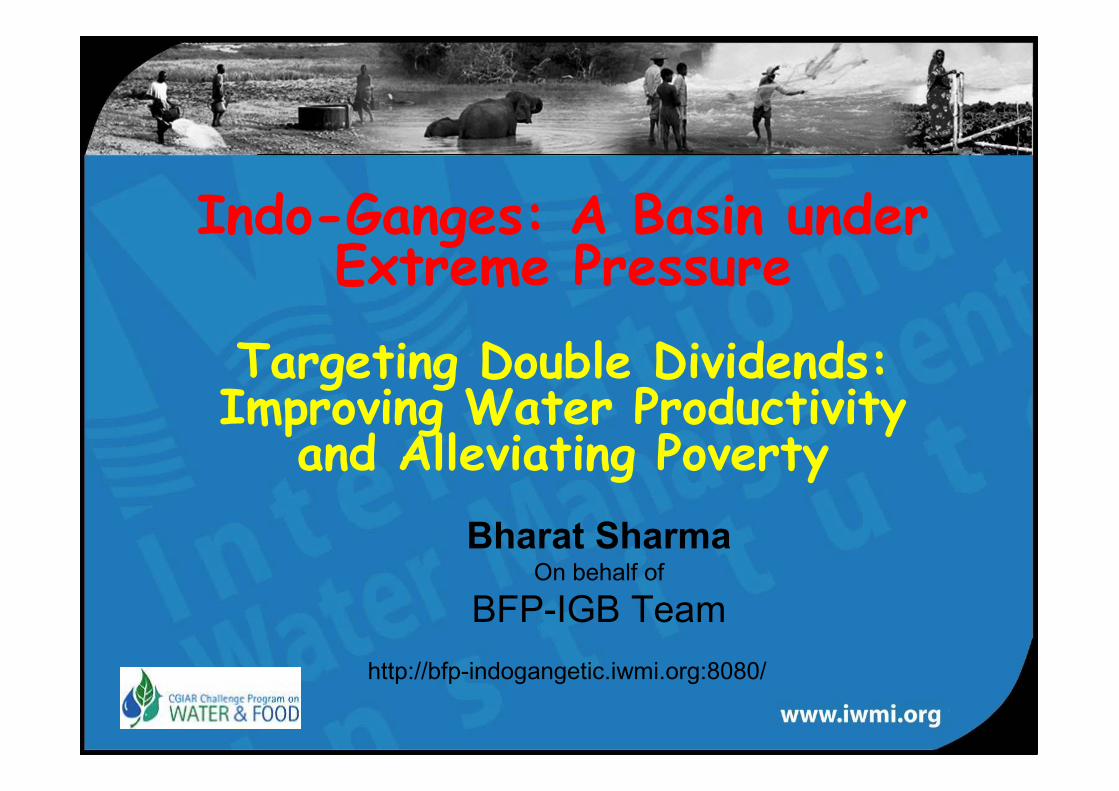
Water Availability, Cost of Water,
Poverty
Water Development, Holding size
Energy, Productivity
Indus- Gangetic Basin
PakistanIndiaNepal
Bangladesh
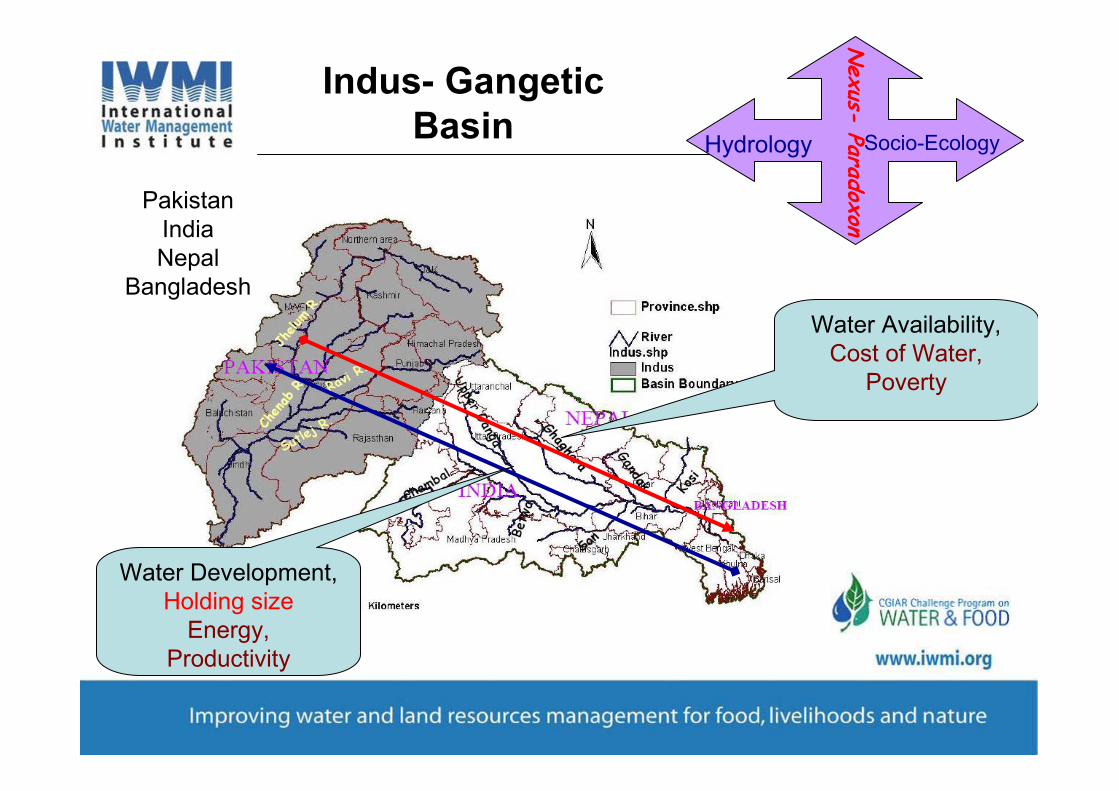
Parameters Bangla. India Nepal Pakistan
Acc. to improved water resources,%
74 86 90 91
Acc.to improved sanitation, % 39 33 35 59
Per cap. Electricity consumption, kWh
145 594 91 493
Popu. Below national poverty line
49.8 28.6 30.9 32.6
Agriculture, % of GDP 20.1 18.3 38.2 21.6
Per capita GDP (USD) 406 640 252 632
IRWR (m3/cap./yr) 688 1149 7539 325
SocioSocio--economic and Water Status of economic and Water Status of
IG Basin CountriesIG Basin Countries
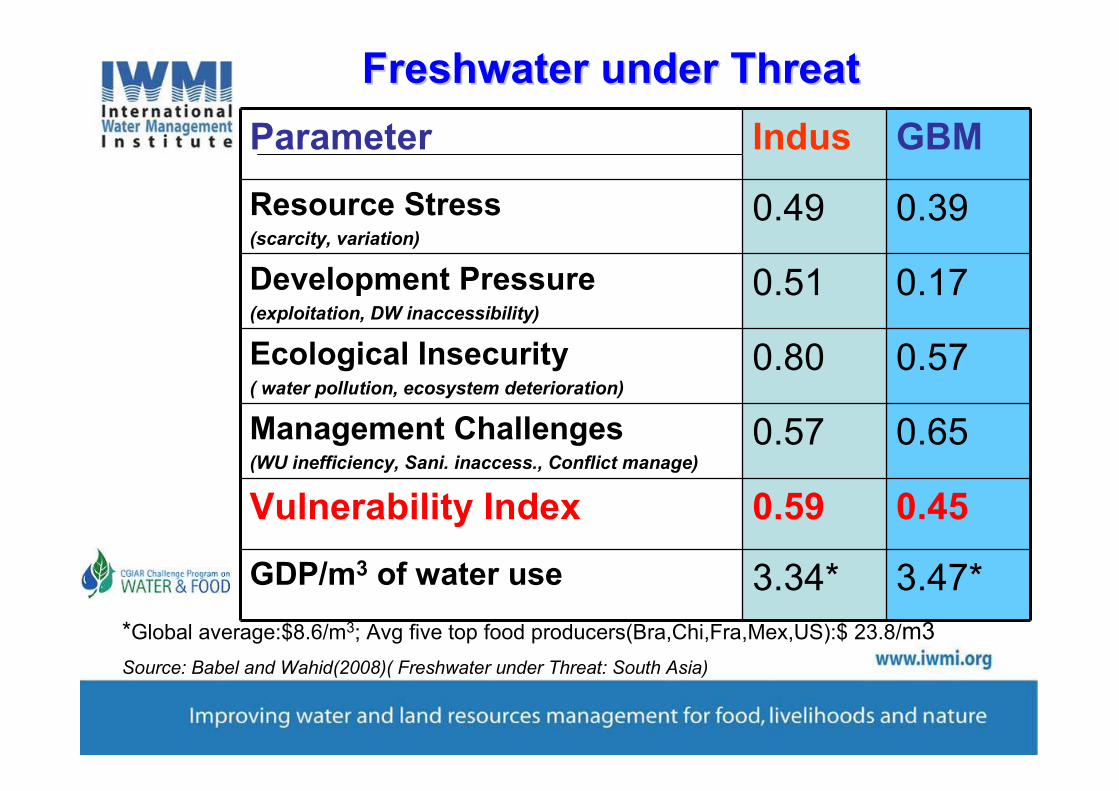
Parameter Indus GBM
Resource Stress (scarcity, variation)
0.49 0.39
Development Pressure (exploitation, DW inaccessibility)
0.51 0.17
Ecological Insecurity ( water pollution, ecosystem deterioration)
0.80 0.57
Management Challenges (WU inefficiency, Sani. inaccess., Conflict manage)
0.57 0.65
Vulnerability Index 0.59 0.45
GDP/m3 of water use 3.34* 3.47*
*Global average:$8.6/m3; Avg five top food producers(Bra,Chi,Fra,Mex,US):$ 23.8/m3
Source: Babel and Wahid(2008)( Freshwater under Threat: South Asia)
Freshwater under ThreatFreshwater under Threat
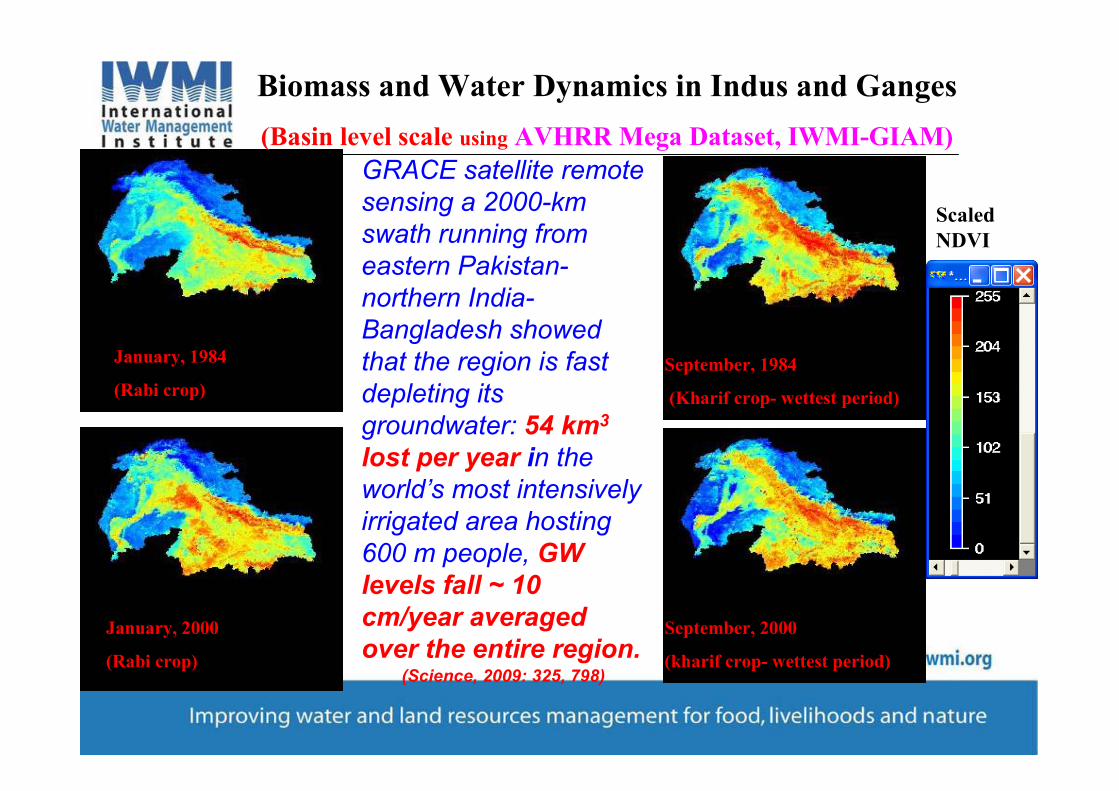
January, 1984
(Rabi crop)
September, 1984
(Kharif crop- wettest period)
January, 2000
(Rabi crop)
September, 2000
(kharif crop- wettest period)
Scaled
$DVI
Biomass and Water Dynamics in Indus and Ganges
(Basin level scale using AVHRR Mega Dataset, IWMI-GIAM)
GRACE satellite remote
sensing a 2000-km
swath running from
eastern Pakistan-
northern India-
Bangladesh showed
that the region is fast
depleting its
groundwater: 54 km3
lost per year in the
world’s most intensively
irrigated area hosting
600 m people, GW
levels fall ~ 10
cm/year averaged
over the entire region.(Science, 2009: 325, 798)
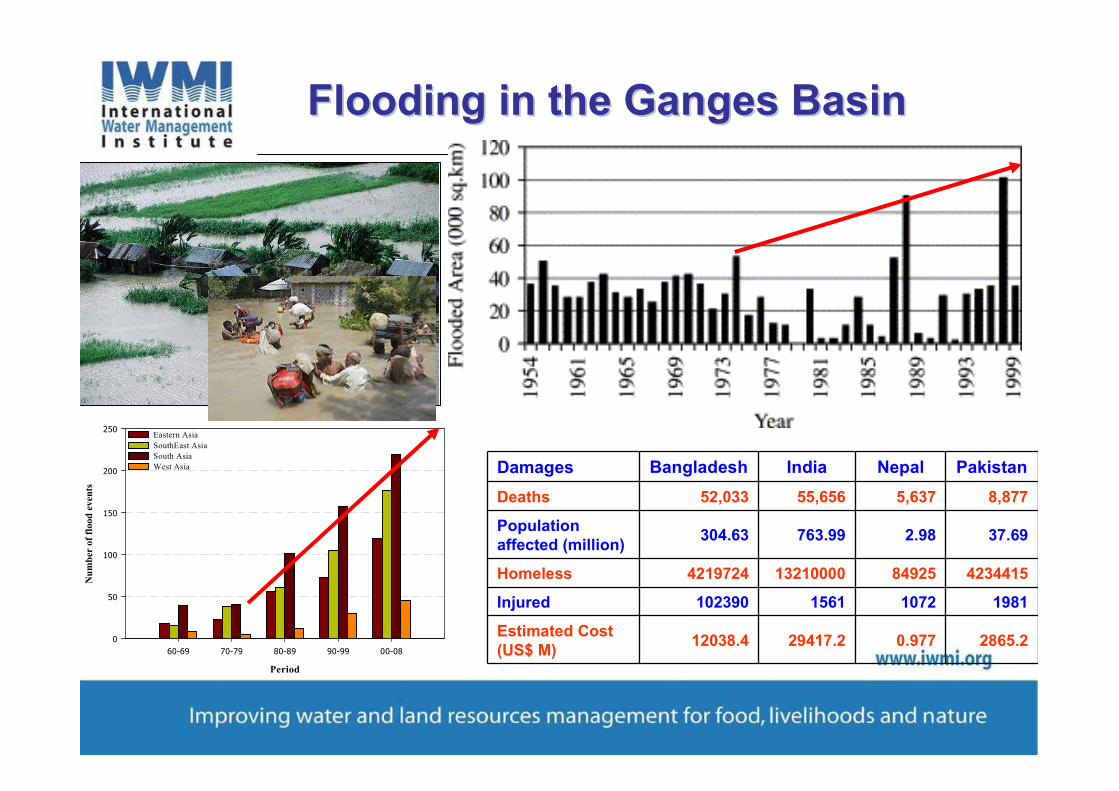
Flooding in the Ganges Basin Flooding in the Ganges Basin
Damages Bangladesh India Nepal Pakistan
Deaths 52,033 55,656 5,637 8,877
Population affected (million)
304.63 763.99 2.98 37.69
Homeless 4219724 13210000 84925 4234415
Injured 102390 1561 1072 1981
Estimated Cost (US$ M)
12038.4 29417.2 0.977 2865.2
Period
60-69 70-79 80-89 90-99 00-08
$u
mb
er o
f fl
ood
even
ts
0
50
100
150
200
250Eastern Asia
SouthEast Asia
South Asia
West Asia
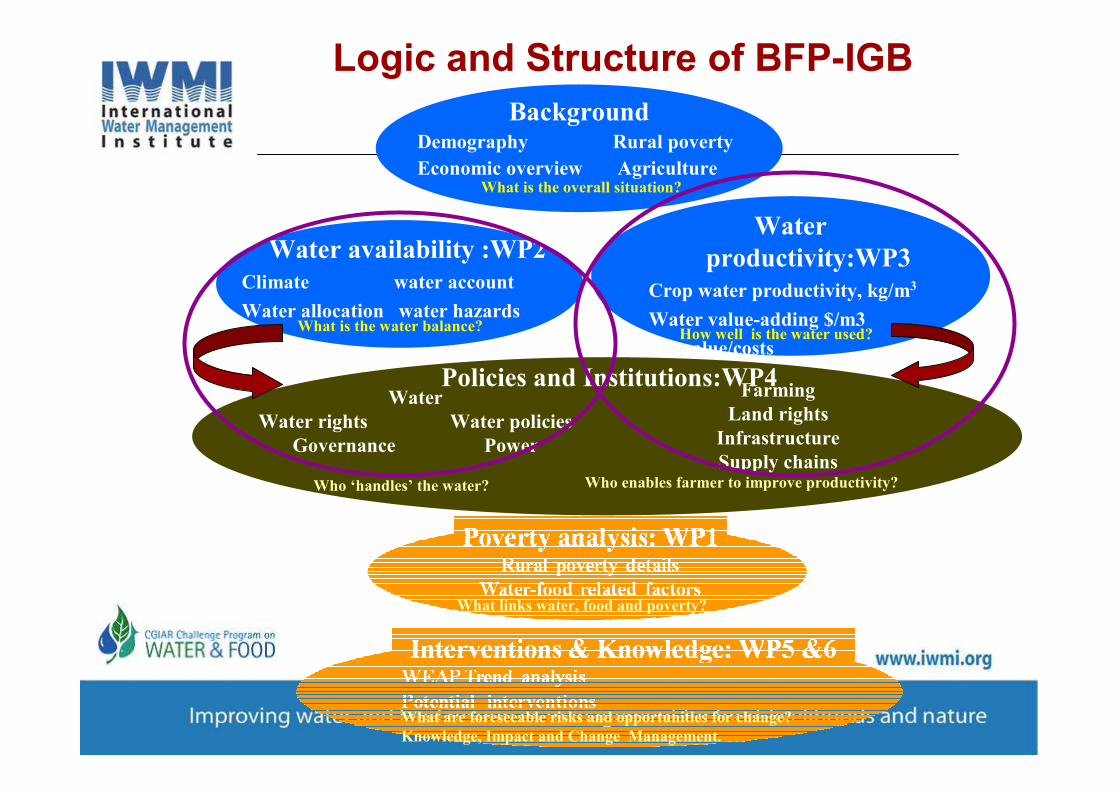
Water
productivity:WP3
Crop water productivity, kg/m3
Water value-adding $/m3
$et value/costs
Water availability :WP2
Climate water account
Water allocation water hazards
Logic and Structure of BFP-IGB
What is the water balance?How well is the water used?
Policies and Institutions:WP4Water
Water rights Water policies
Governance Power
Farming
Land rights
Infrastructure
Supply chains
Who ‘handles’ the water? Who enables farmer to improve productivity?
What links water, food and poverty?
What are foreseeable risks and opportunities for change?
Knowledge, Impact and Change Management.
BackgroundDemography Rural poverty
Economic overview AgricultureWhat is the overall situation?

Approach of Analysis:Basin to Sub-Basin to Household
• Macro or basin level analysis of poverty/ water poverty, water resources, water productivity, water laws and potential interventions.
•Sub-basin wise HH level detailed analysis of poverty, water resources, water institutions/ policies, interventions.
•Strong linkages with GGA, NRLP, RWC, Climate Change impact projects
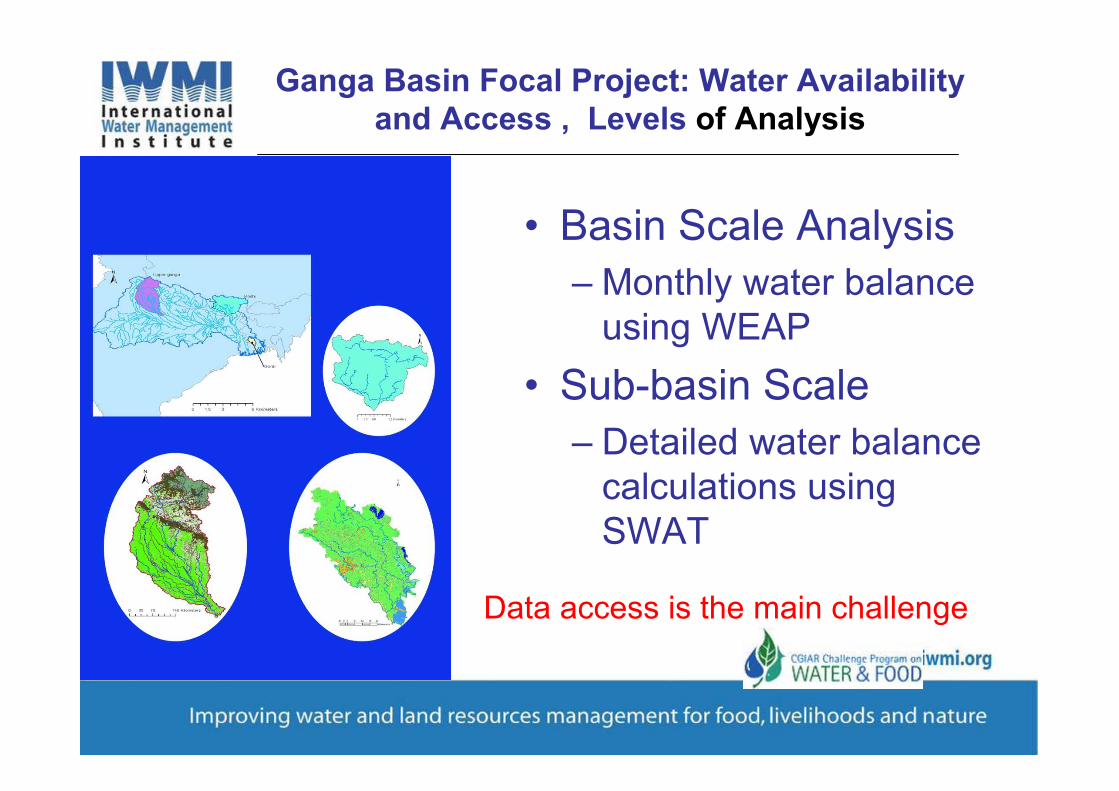
Ganga Basin Focal Project: Water Availability and Access , Levels of Analysis
• Basin Scale Analysis
– Monthly water balance using WEAP
• Sub-basin Scale
– Detailed water balance calculations using SWAT
Data access is the main challenge
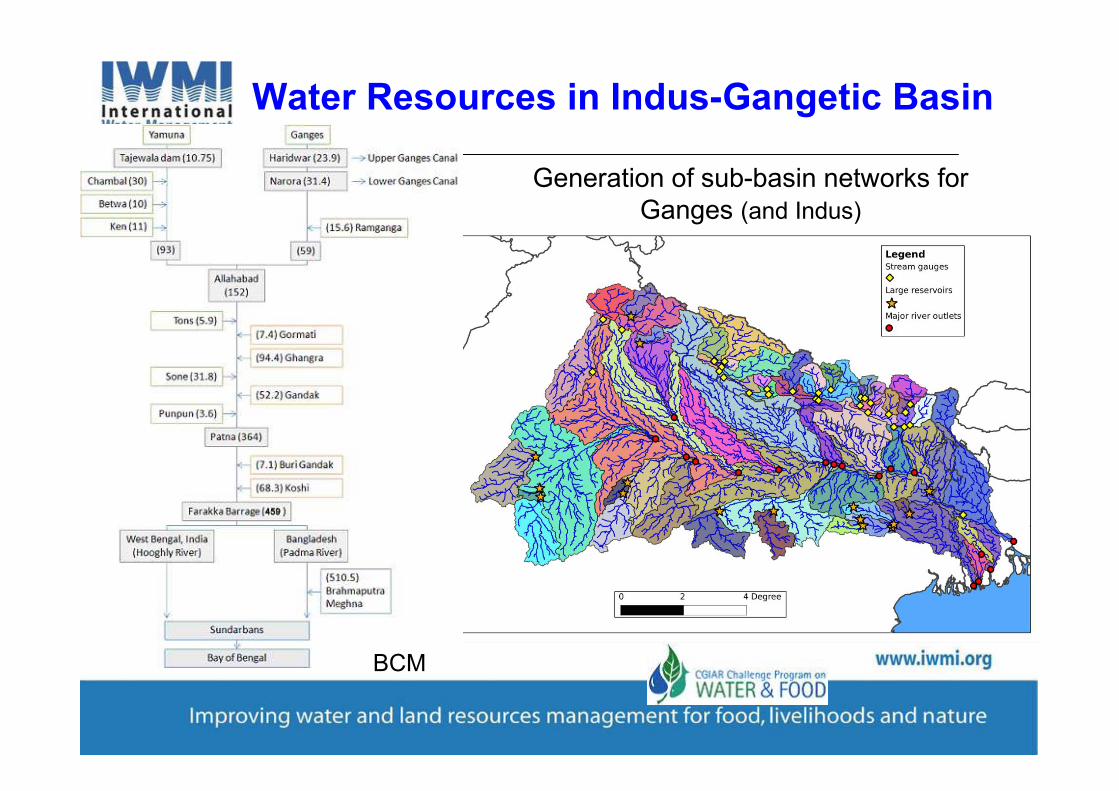
Water Resources in Indus-Gangetic Basin
Generation of sub-basin networks for Ganges (and Indus)
BCM
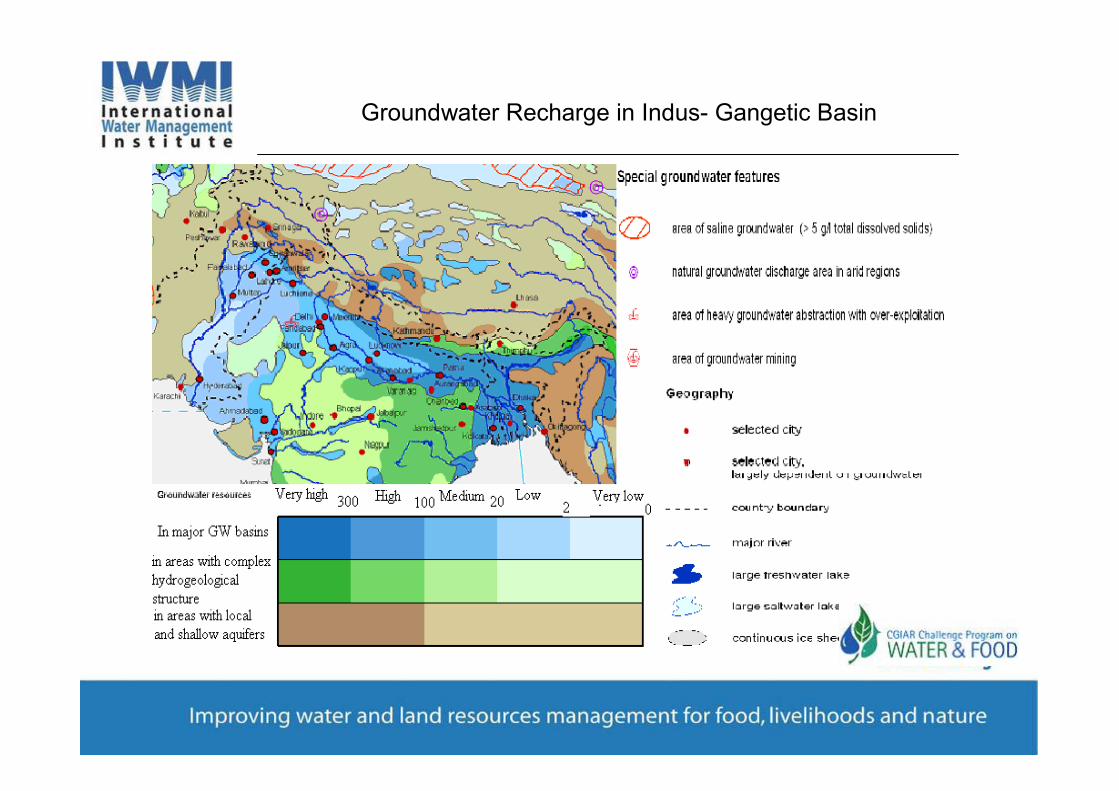
Groundwater Recharge in Indus- Gangetic Basin
Basin $ame Groundwater
Available
(BCM)
Annual Groundwater Draft
(BCM)
Stage of GW
Development
(%)Irrigation Domestic,
Industrial
& others
Total
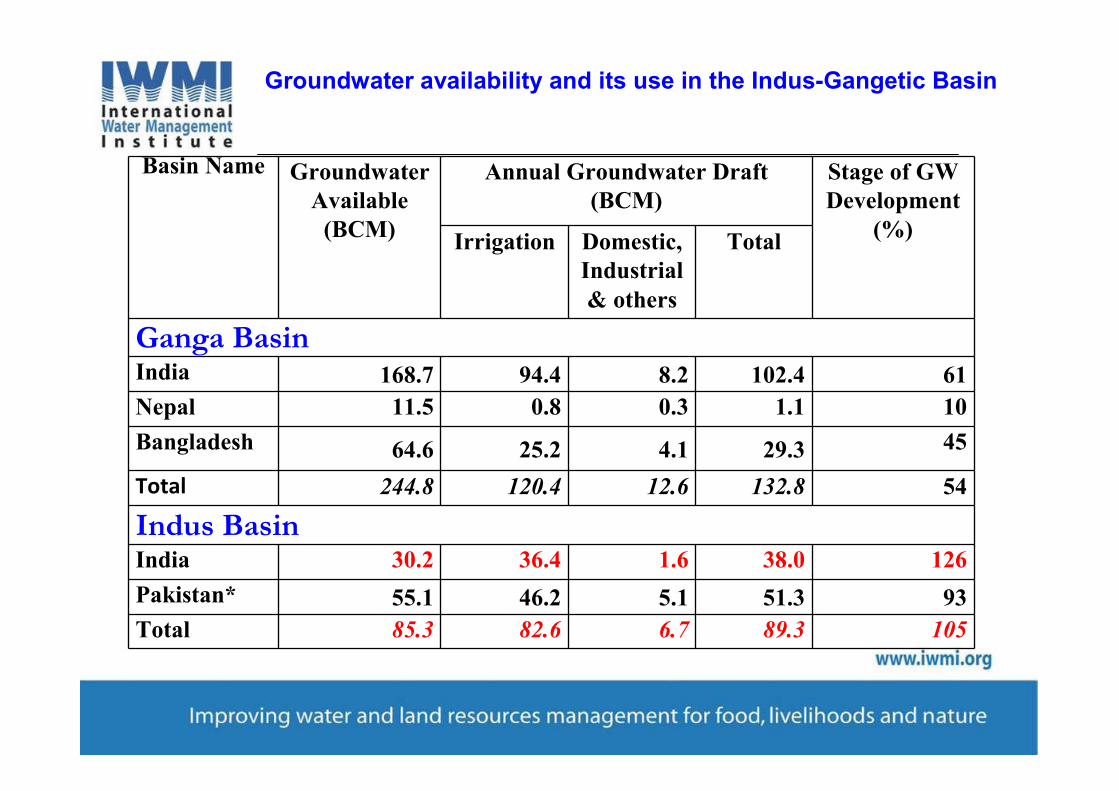
Ganga BasinIndia 168.7 94.4 8.2 102.4 61
$epal 11.5 0.8 0.3 1.1 10
Bangladesh 64.6 25.2 4.1 29.3 45
Total 244.8 120.4 12.6 132.8 54
Indus BasinIndia 30.2 36.4 1.6 38.0 126
Pakistan* 55.1 46.2 5.1 51.3 93
Total 85.3 82.6 6.7 89.3 105
Groundwater availability and its use in the Indus-Gangetic Basin
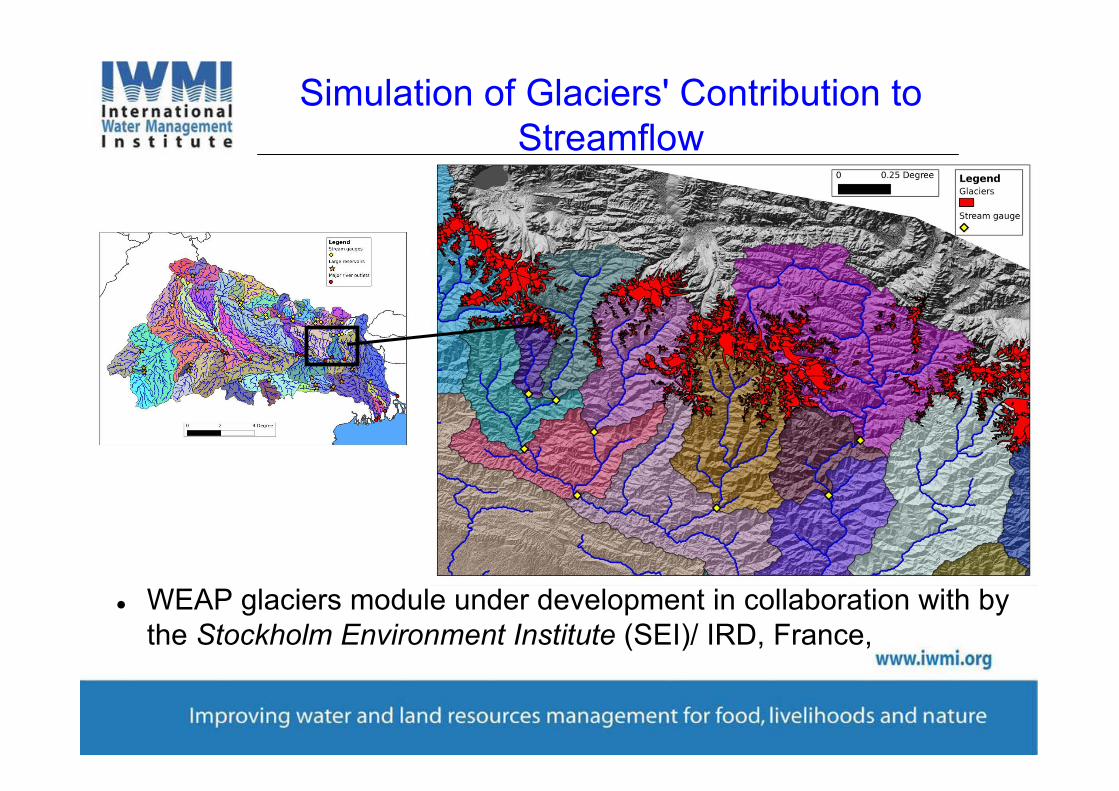
Simulation of Glaciers' Contribution to Streamflow
� WEAP glaciers module under development in collaboration with by the Stockholm Environment Institute (SEI)/ IRD, France,
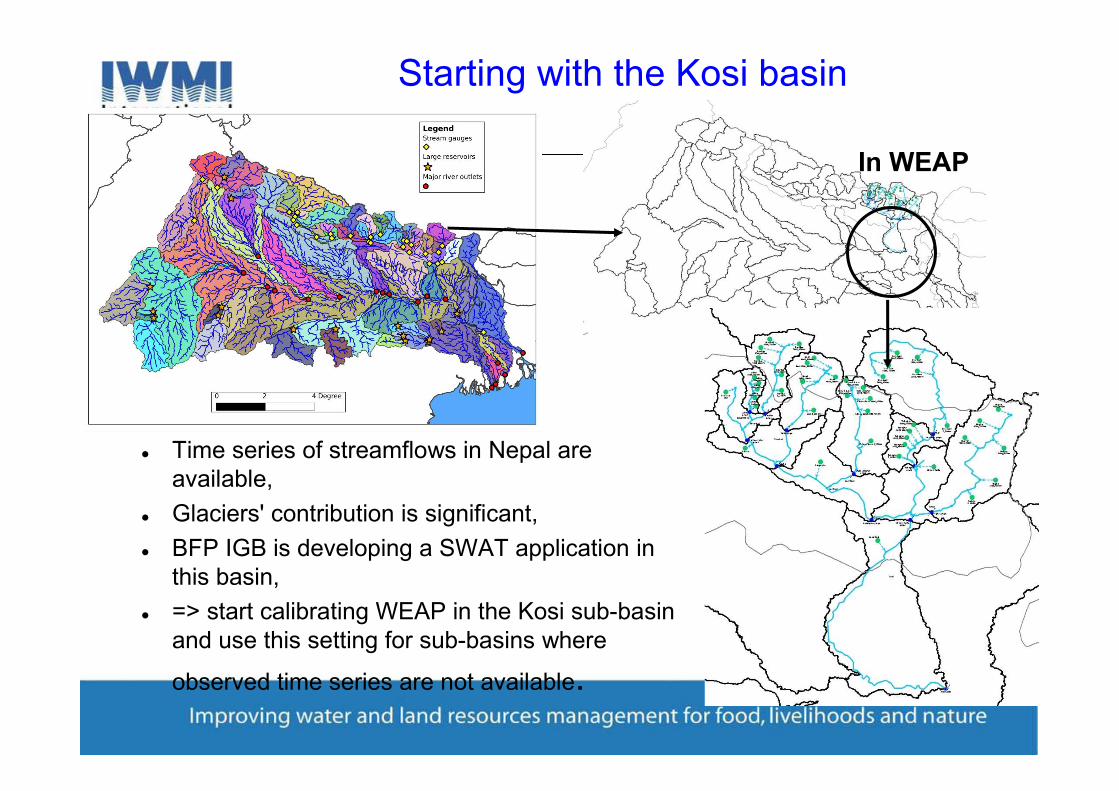
Starting with the Kosi basin
� Time series of streamflows in Nepal are available,
� Glaciers' contribution is significant,
� BFP IGB is developing a SWAT application in this basin,
� => start calibrating WEAP in the Kosi sub-basin and use this setting for sub-basins where
observed time series are not available.
In WEAP
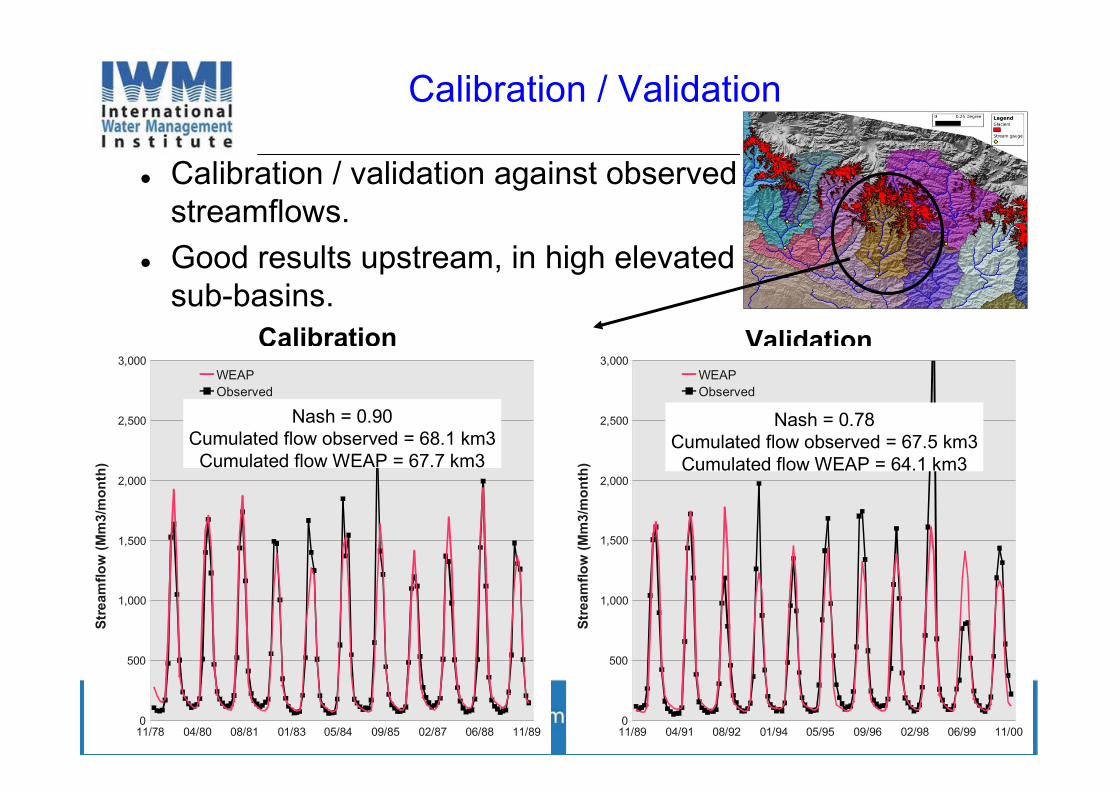
Calibration / Validation
� Calibration / validation against observed streamflows.
� Good results upstream, in high elevated sub-basins.
Calibration Validation
11/78 04/80 08/81 01/83 05/84 09/85 02/87 06/88 11/890
500
1,000
1,500
2,000
2,500
3,000
WEAP
Observed
Str
eam
flo
w (
Mm
3/m
on
th)
Nash = 0.90Cumulated flow observed = 68.1 km3
Cumulated flow WEAP = 67.7 km3
11/89 04/91 08/92 01/94 05/95 09/96 02/98 06/99 11/000
500
1,000
1,500
2,000
2,500
3,000
WEAP
Observed
Str
eam
flo
w (
Mm
3/m
on
th)
Nash = 0.78Cumulated flow observed = 67.5 km3
Cumulated flow WEAP = 64.1 km3
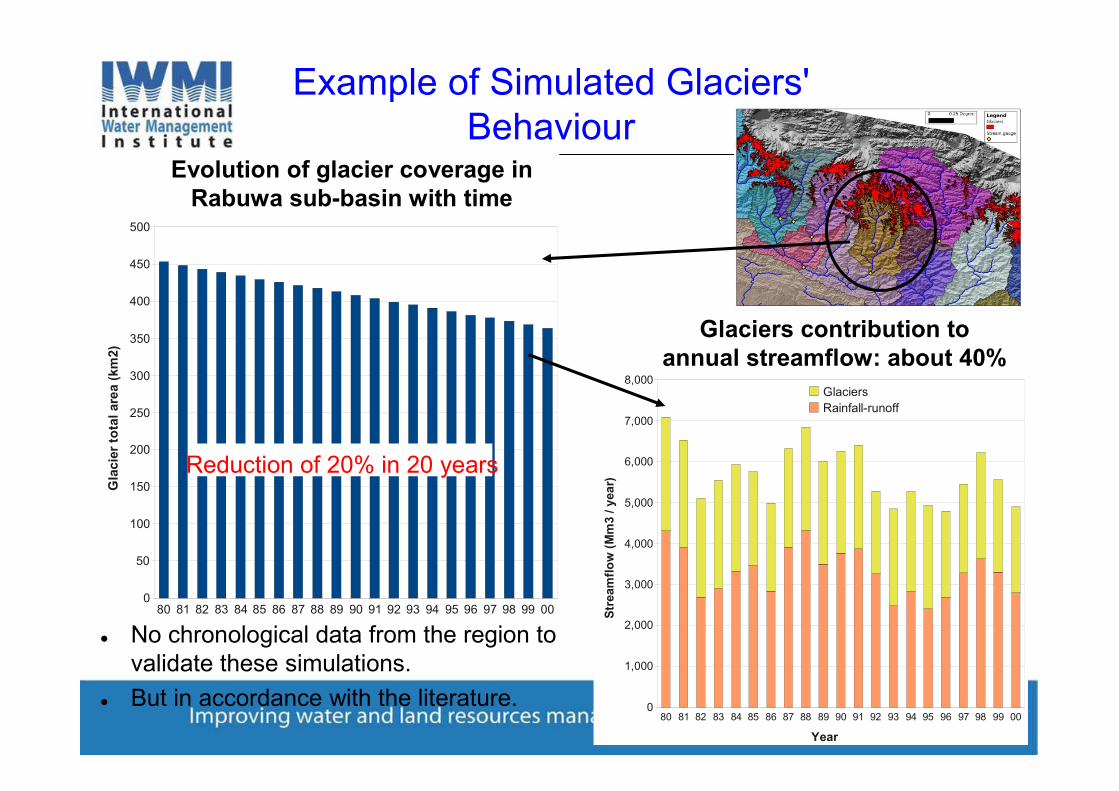
Example of Simulated Glaciers' Behaviour
� No chronological data from the region to validate these simulations.
� But in accordance with the literature.
80 81 82 83 84 85 86 87 88 89 90 91 92 93 94 95 96 97 98 99 000
50
100
150
200
250
300
350
400
450
500
Gla
cie
r to
tal
are
a (
km
2)
Evolution of glacier coverage inRabuwa sub-basin with time
Reduction of 20% in 20 years
80 81 82 83 84 85 86 87 88 89 90 91 92 93 94 95 96 97 98 99 000
1,000
2,000
3,000
4,000
5,000
6,000
7,000
8,000Glaciers
Rainfall-runoff
Year
Str
eam
flo
w (
Mm
3 / y
ea
r)
Glaciers contribution toannual streamflow: about 40%
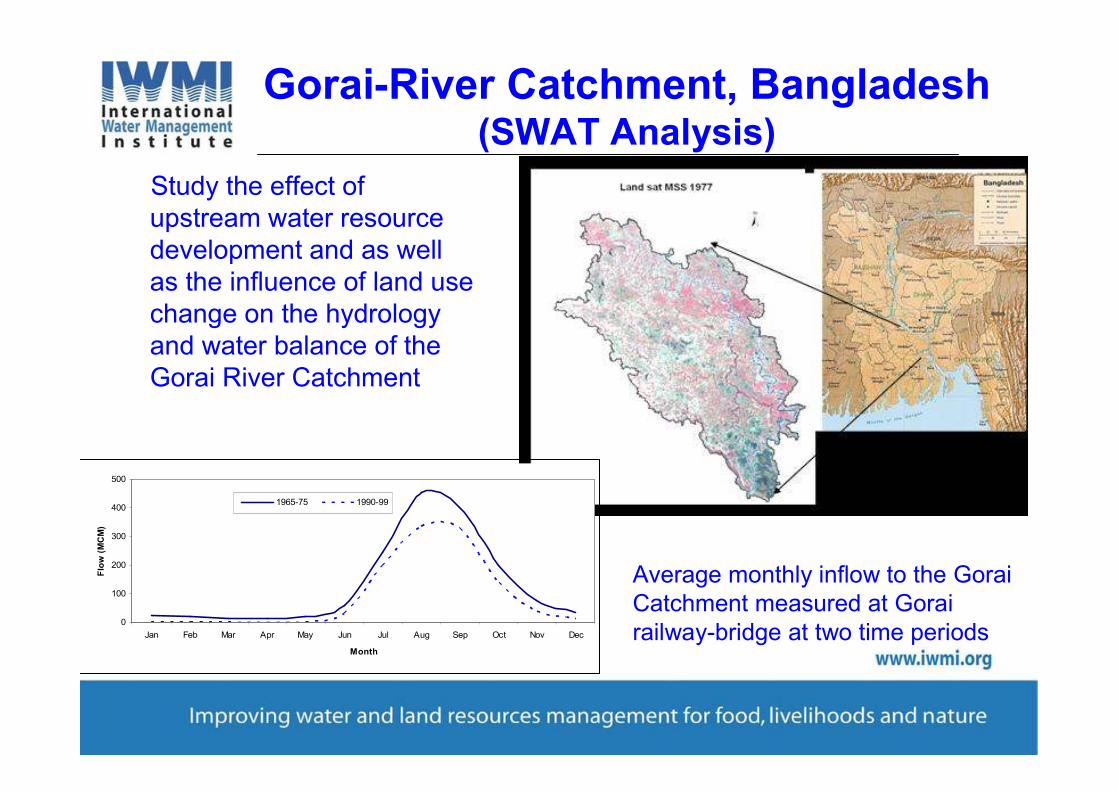
Study the effect of upstream water resource development and as well as the influence of land use change on the hydrology and water balance of the Gorai River Catchment
Gorai-River Catchment, Bangladesh (SWAT Analysis)
0
100
200
300
400
500
Jan Feb Mar Apr May Jun Jul Aug Sep Oct Nov Dec
Month
Flo
w (
MC
M)
1965-75 1990-99
Average monthly inflow to the Gorai Catchment measured at Gorai railway-bridge at two time periods
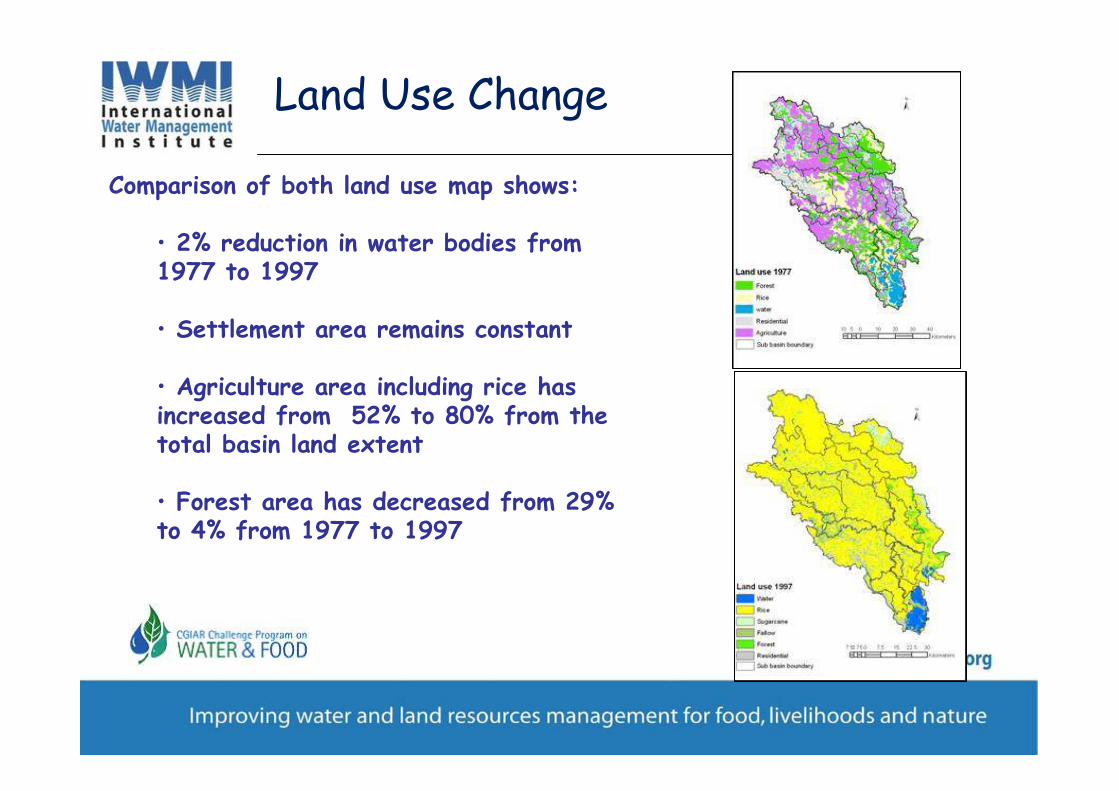
Land Use Change
Comparison of both land use map shows:
• 2% reduction in water bodies from 1977 to 1997
• Settlement area remains constant
• Agriculture area including rice has increased from 52% to 80% from the total basin land extent
• Forest area has decreased from 29% to 4% from 1977 to 1997
-4000
-2000
0
2000
4000
1 2 3 4 5 6 7 8 9 10 11 12 13 14 15 16 17 18 19 20 21 22
Inp
ut/
Ou
tpu
t (m
m)
Average annual RF (mm) Average annual ET (mm) Average annual RO (mm) Balance closer (mm)
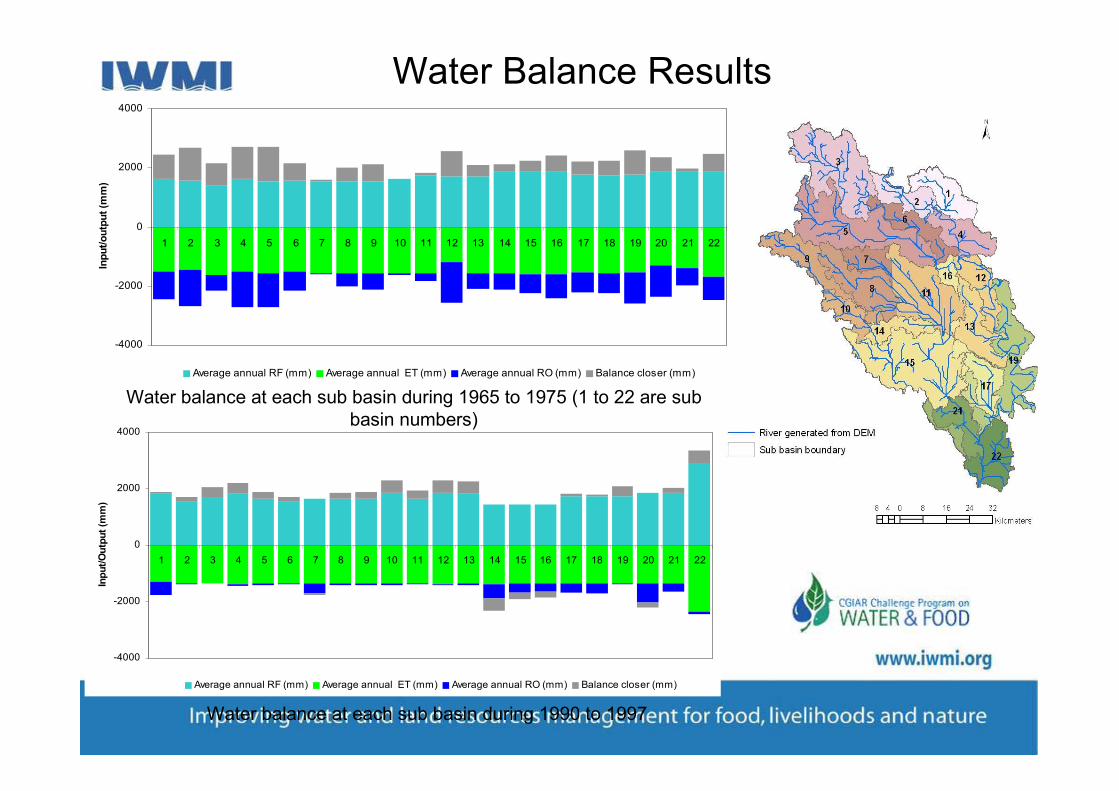
Water Balance Results
-4000
-2000
0
2000
4000
1 2 3 4 5 6 7 8 9 10 11 12 13 14 15 16 17 18 19 20 21 22
Inp
ut/
ou
tpu
t (m
m)
Average annual RF (mm) Average annual ET (mm) Average annual RO (mm) Balance closer (mm)
Water balance at each sub basin during 1965 to 1975 (1 to 22 are sub basin numbers)
Water balance at each sub basin during 1990 to 1997
0
100
200
300
400
500
Jan Feb Mar Apr May Jun Jul Aug Sep Oct Nov Dec
Month
Flo
w (
MC
M)
1965-75 _obs
1990-1999_sim_97LU
1965-75 _sim_77LU
0
100
200
300
400
500
Jan Feb Mar Apr May Jun Jul Aug Sep Oct Nov Dec
Month
Flo
w (
MC
M)
1965-75_sim_77LU
1990-1999_sim_97LU
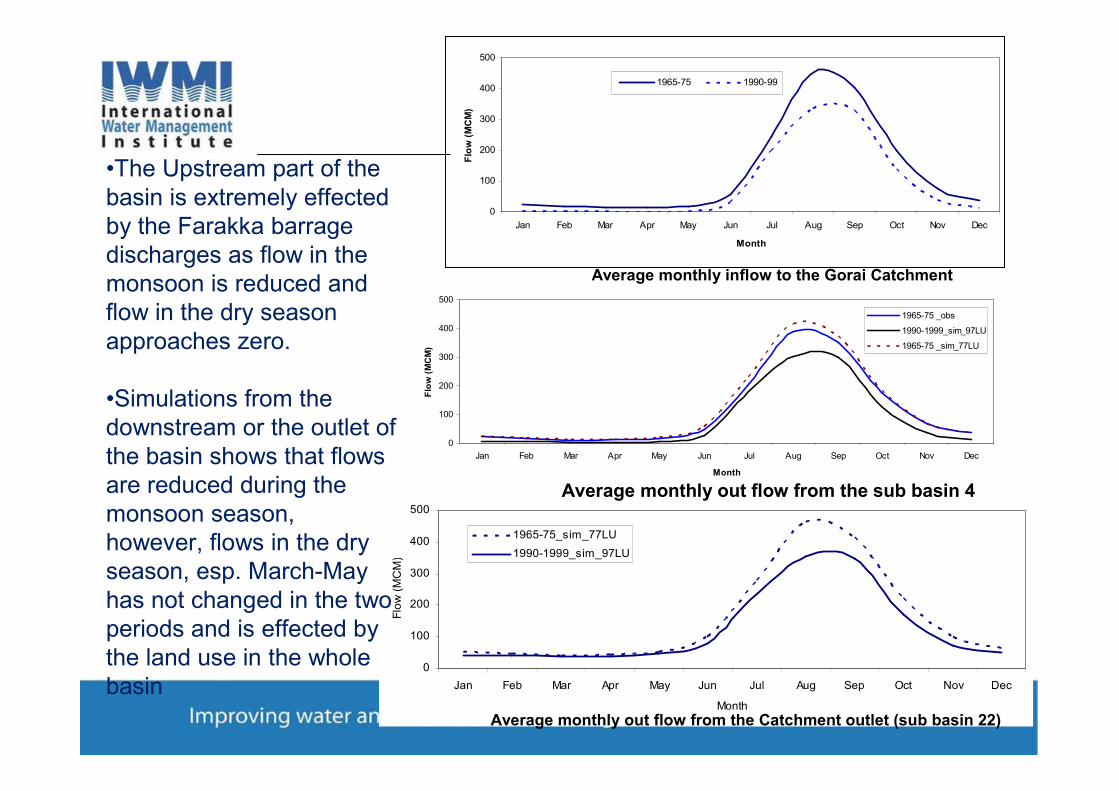
Average monthly out flow from the sub basin 4
Average monthly out flow from the Catchment outlet (sub basin 22)
0
100
200
300
400
500
Jan Feb Mar Apr May Jun Jul Aug Sep Oct Nov Dec
Month
Flo
w (
MC
M)
1965-75 1990-99
Average monthly inflow to the Gorai Catchment
•The Upstream part of the basin is extremely effected by the Farakka barrage discharges as flow in the monsoon is reduced and flow in the dry season approaches zero.
•Simulations from the downstream or the outlet of the basin shows that flows are reduced during the monsoon season, however, flows in the dry season, esp. March-May has not changed in the two periods and is effected by the land use in the whole basin
Completed/ Planned Outputs for WP 2
1. Energy supply and expansion of irrigation in the Indus-Gangetic basin: Published(C A Scott, Bharat Sharma, JRBM,2009, 7(1): 1-6)
2. Hydro-geology and Water Resources of Indus-Gangetic Basin: Comparative Analysis of Issues and Opportunities" ( Bharat R Sharma and G. Ambili )- Accepted as a Review Paper
3. Setting of a Decision Support Tool for Assessment and Allocation of the Water Resource in the Indo-Ganges Basin (WEAP Modelling):
(Dev D Condappa, Luna Bharati, Bharat Sharma)
4. Challenges and Prospects of Sustainable Groundwater Management in the Indus Basin, Pakistan: ( Asad Qureshi and //.)
5. Water, Climate Change, and Adaptation: Focus on the Gages River Basin : (H R
Hostermann, PG McCornick, EJ Kistin, A Pant, B R Sharma, L Bharati, Working Paper
published in collaboration with Nicholas Institute, Duke University, USA)
6. Water Availability and Access Analysis in Selected Sub-basins of the Ganges basin ( Luna Bharati, V. Smakhtin, Bharat Sharma, Priyantha)
Estimating Water Productivity in the Indus-Gangetic Basin
http://bfp-indogangetic.iwmi.org:8080/
• Magnitude – What’s the current status?
• Spatial Variation – How does it vary within and among regions?
• Causes – Why is WP varying (both high and low)?
• Scope for improvement – How much potential for, where?
• Irrigated vs. rainfed – What’s the option for sustainable development under water scarcity and food deficit condition?
• Crop vs. livestock and fisheries – How is livestock and fisheries contributing to water use outputs?
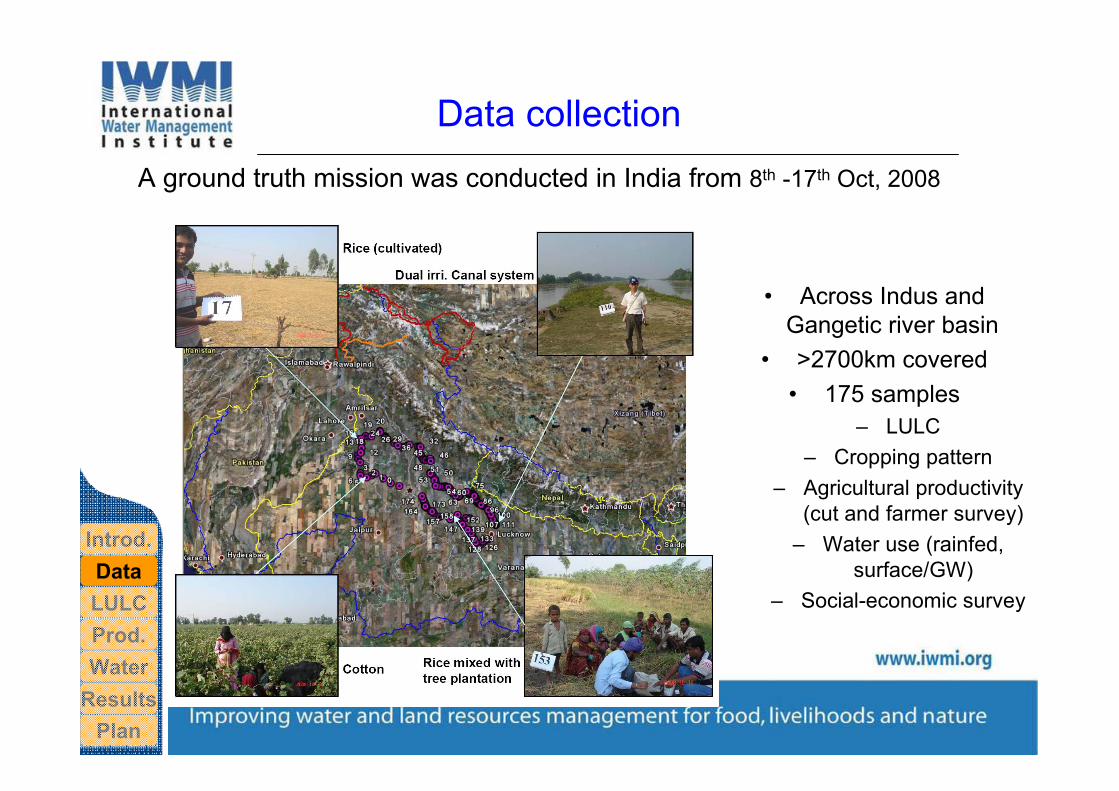
Data collection
Introd.
Data
LULC
Prod.
Water
Results
Plan
A ground truth mission was conducted in India from 8th -17th Oct, 2008
• Across Indus and Gangetic river basin
• >2700km covered
• 175 samples
– LULC
– Cropping pattern
– Agricultural productivity (cut and farmer survey)
– Water use (rainfed, surface/GW)
– Social-economic survey
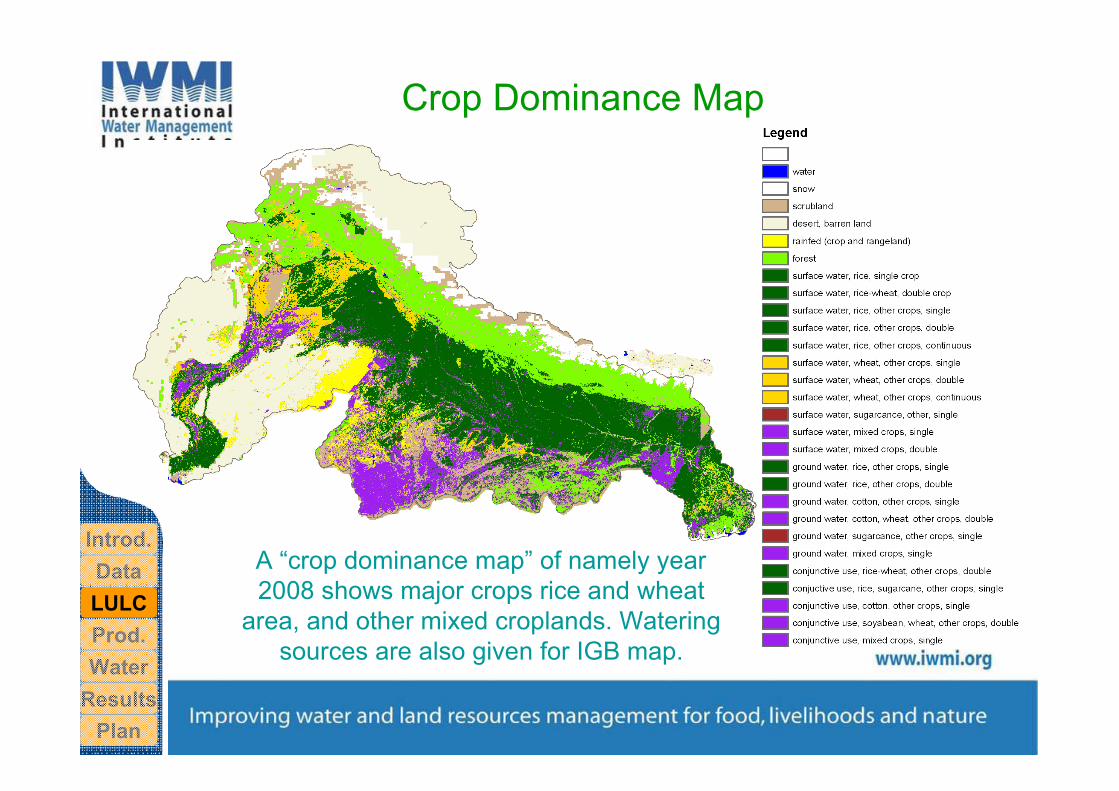
A “crop dominance map” of namely year 2008 shows major crops rice and wheat
area, and other mixed croplands. Watering sources are also given for IGB map.
Introd.
Data
LULC
Prod.
Water
Results
Plan
Crop Dominance Map
Introd.
Data
LULC
Prod.
Water
Results
Plan
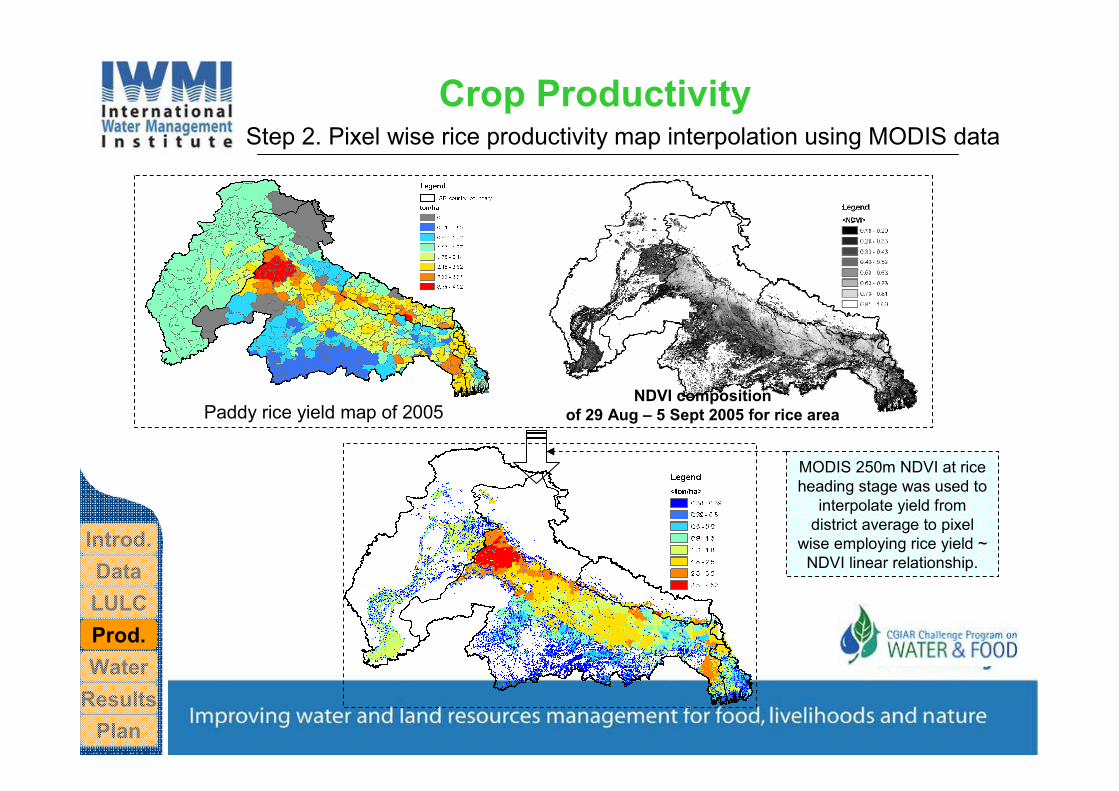
Crop ProductivityStep 2. Pixel wise rice productivity map interpolation using MODIS data
Paddy rice yield map of 2005NDVI composition
of 29 Aug – 5 Sept 2005 for rice area
MODIS 250m NDVI at rice heading stage was used to
interpolate yield from district average to pixel
wise employing rice yield ~ NDVI linear relationship.
Actual ET Estimation
Introd.
Data
LULC
Prod.
Water
Results
Plan
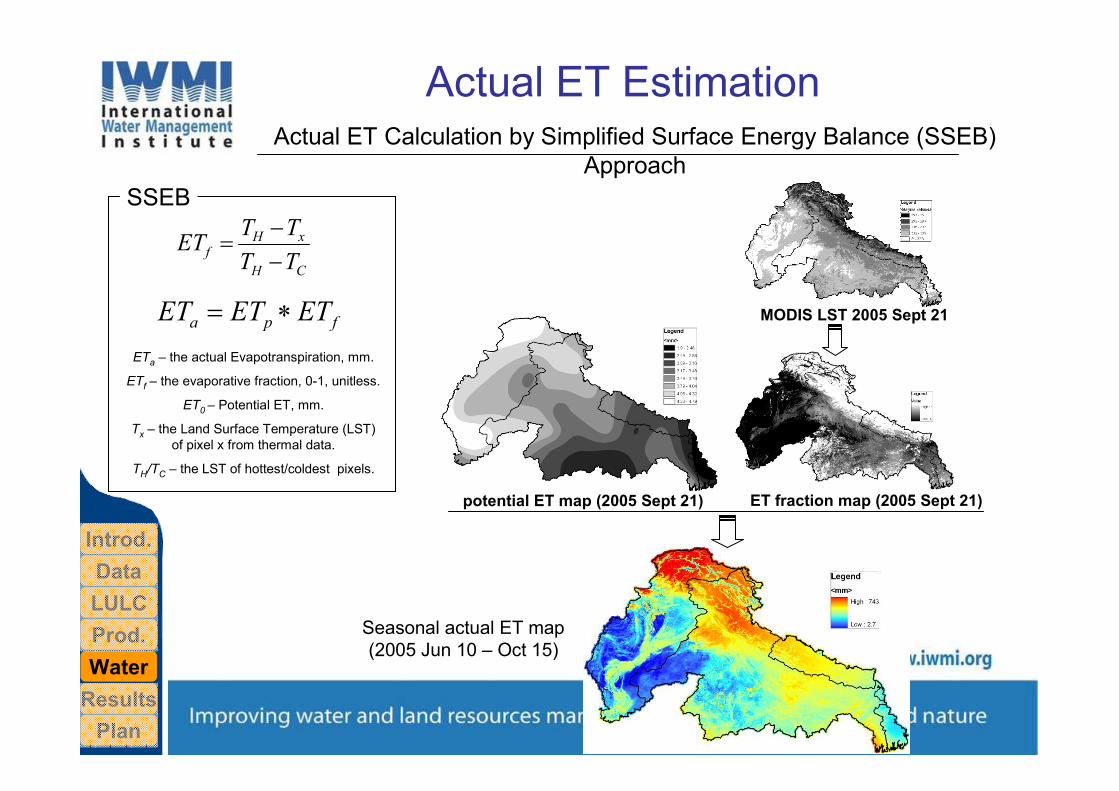
Actual ET Calculation by Simplified Surface Energy Balance (SSEB) Approach
Seasonal actual ET map (2005 Jun 10 – Oct 15)
potential ET map (2005 Sept 21)
ETa – the actual Evapotranspiration, mm.
ETf – the evaporative fraction, 0-1, unitless.
ET0 – Potential ET, mm.
Tx – the Land Surface Temperature (LST) of pixel x from thermal data.
TH/TC – the LST of hottest/coldest pixels.
CH
xHf
TT
TTET
−
−=
fpa ETETET ∗=
SSEB
ET fraction map (2005 Sept 21)
MODIS LST 2005 Sept 21
Water Productivity Maps
Introd.
Data
LULC
Prod.
Water
Results
Plan
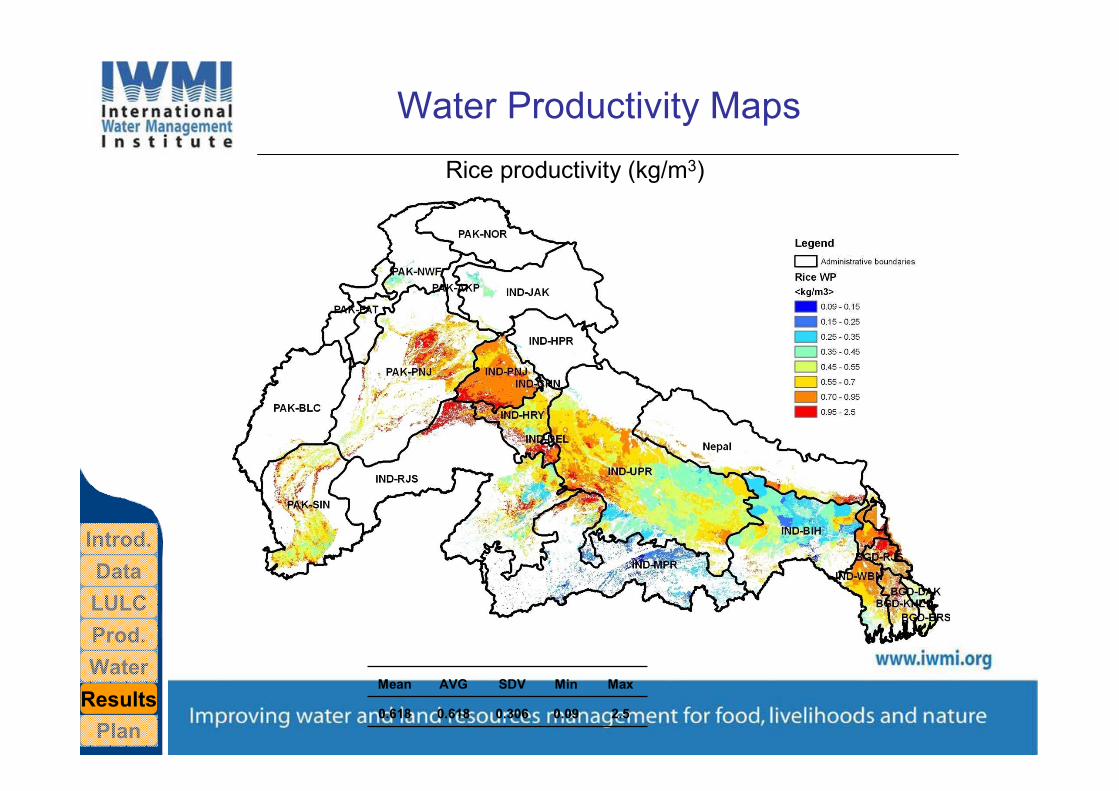
Rice productivity (kg/m3)
Mean AVG SDV Min Max
0.618 0.618 0.306 0.09 2.5

Rice water productivity for 4 major IGB countries (unit: kg/m3)
Country ADMIN_NAME WP_MEAN Country ADMIN_NAME WP_MEAN
Bangladesh Chittagong 0.445 Pakistan North-west Frontier 0.451
Bangladesh Dhaka 0.496 Pakistan FAT 0.525
Bangladesh Barisal 0.533 Pakistan Azad Kashmir 0.580
Bangladesh Khulna 0.796 Pakistan Baluchistan 0.657
Bangladesh Rajshahi 0.856 Pakistan Sind 0.732
Pakistan Punjab 0.755
Average 0.625 Average 0.617
Nepal Lumbini 0.542 India Madhya Pradesh 0.393
Nepal Sagarmatha 0.556 India Himachal Pradesh 0.407
Nepal Janakpur 0.578 India Bihar 0.408
Nepal Bagmati 0.583 India Jammu & Kashmir 0.430
Nepal Gandaki 0.607 India Uttar Pradesh 0.560
Nepal Seti 0.699 India West Bengal 0.718
Nepal Bheri 0.713 India Rajasthan 0.720
Nepal Rapti 0.715 India Haryana 0.746
Nepal Narayani 0.754 India Delhi 0.818
Nepal Mahakali 0.792 India Punjab 0.833
Nepal Kosi 0.904
Nepal Mechi 0.964
Average 0.701 Average 0.603
Water Productivity Maps
Introd.
Data
LULC
Prod.
Water
Results
Plan
Paddy productivity (kg/m3)
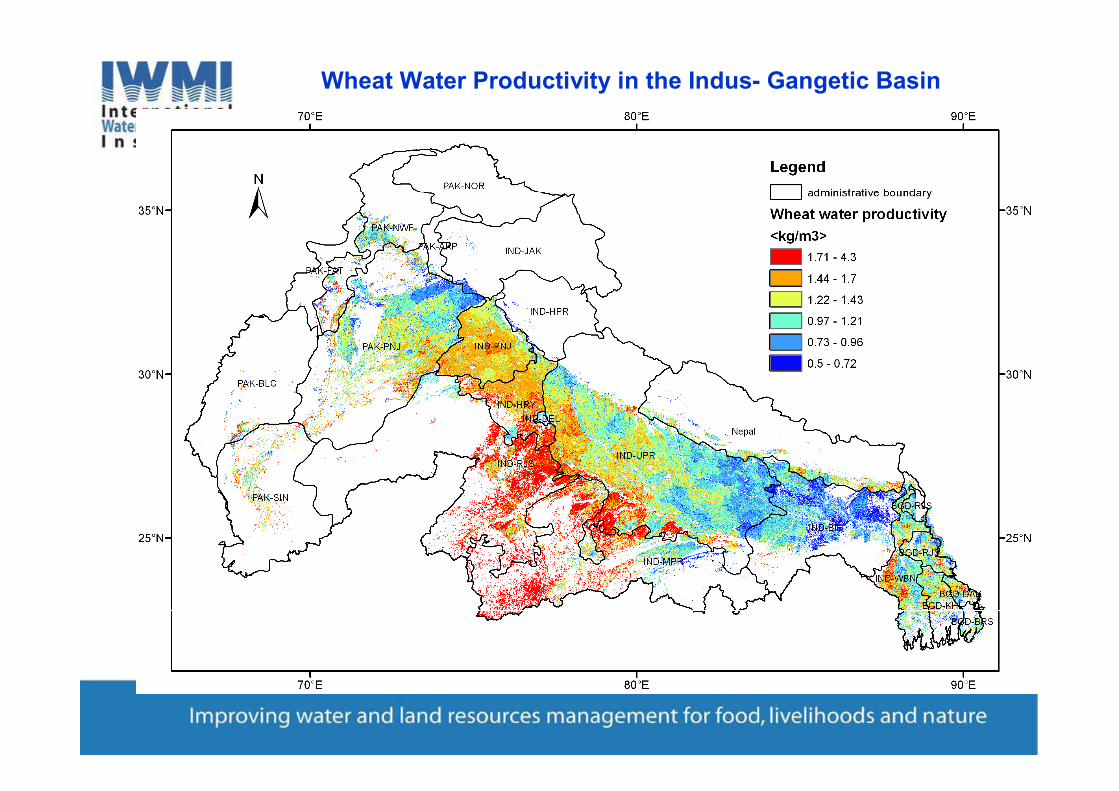
Wheat Water Productivity in the Indus- Gangetic Basin
Water Productivity Maps
Introd.
Data
LULC
Prod.
Water
Results
Plan
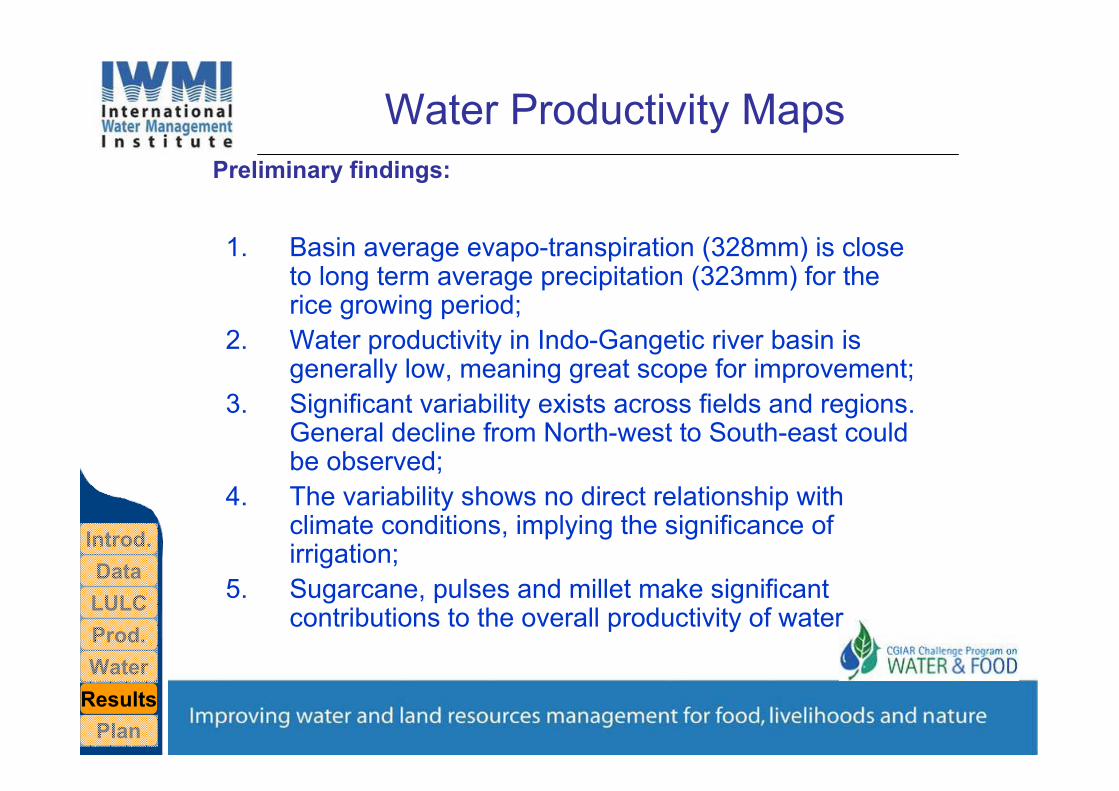
Preliminary findings:
1. Basin average evapo-transpiration (328mm) is close to long term average precipitation (323mm) for the rice growing period;
2. Water productivity in Indo-Gangetic river basin is generally low, meaning great scope for improvement;
3. Significant variability exists across fields and regions. General decline from North-west to South-east could be observed;
4. The variability shows no direct relationship with climate conditions, implying the significance of irrigation;
5. Sugarcane, pulses and millet make significant contributions to the overall productivity of water.
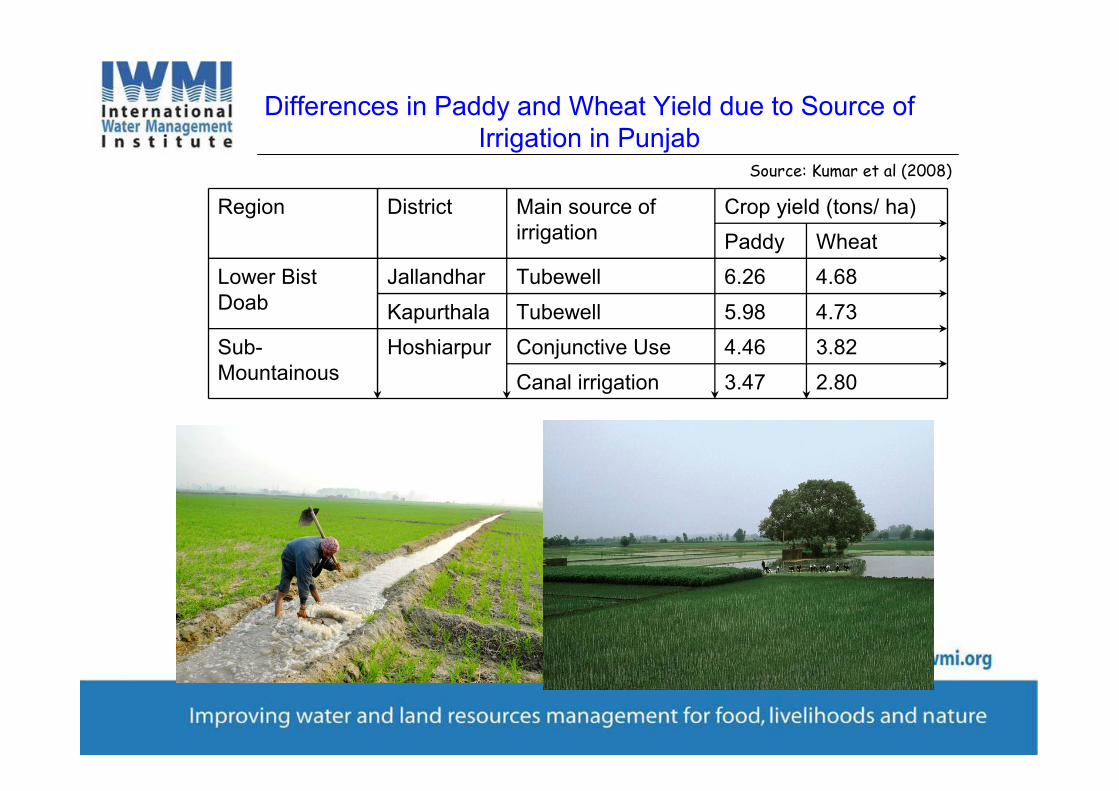
Region District Main source of irrigation
Crop yield (tons/ ha)
Paddy Wheat
Lower Bist Doab
Jallandhar Tubewell 6.26 4.68
Kapurthala Tubewell 5.98 4.73
Sub-Mountainous
Hoshiarpur Conjunctive Use 4.46 3.82
Canal irrigation 3.47 2.80
Source: Kumar et al (2008)
Differences in Paddy and Wheat Yield due to Source of Irrigation in Punjab
32
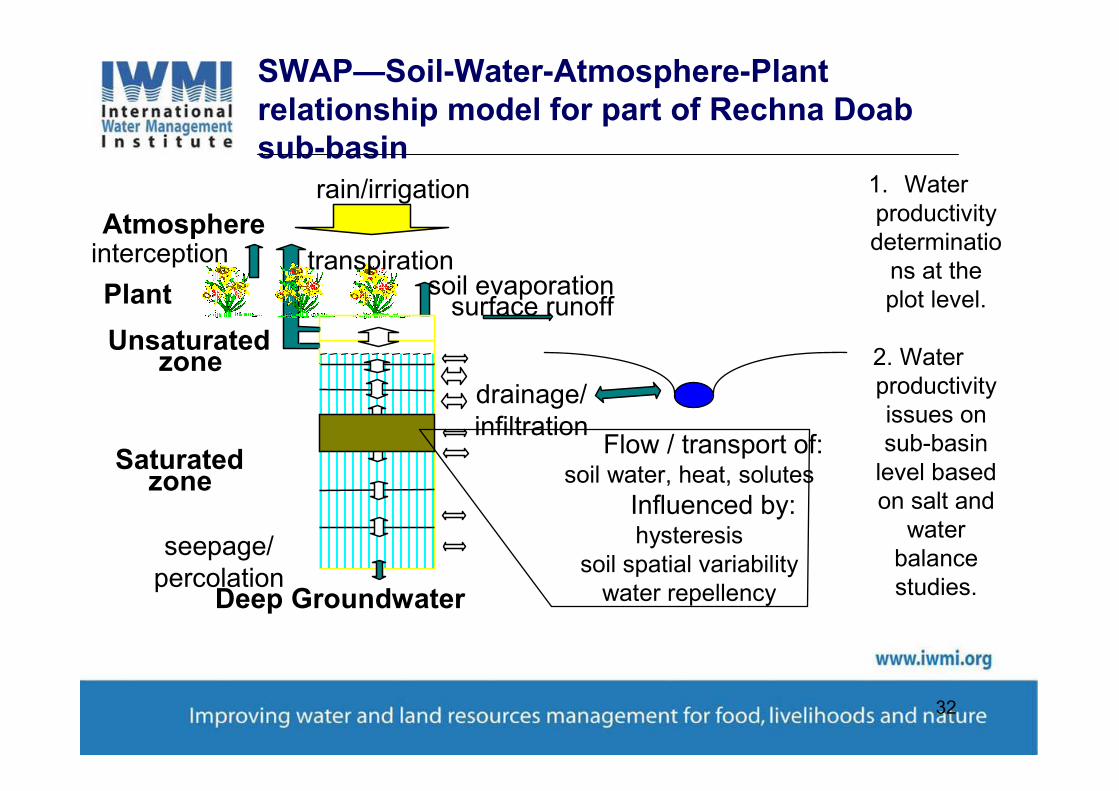
SWAP—Soil-Water-Atmosphere-Plant relationship model for part of Rechna Doab sub-basin
Saturatedzone
Plant
rain/irrigation
Deep Groundwater
Atmosphere
Unsaturatedzone
interception
surface runoff
drainage/infiltration
transpirationsoil evaporation
Flow / transport of:soil water, heat, solutes
Influenced by:hysteresis
soil spatial variabilitywater repellency
seepage/percolation
1. Water productivity determinatio
ns at the plot level.
2. Water productivity issues on sub-basin
level based on salt and
water balance studies.
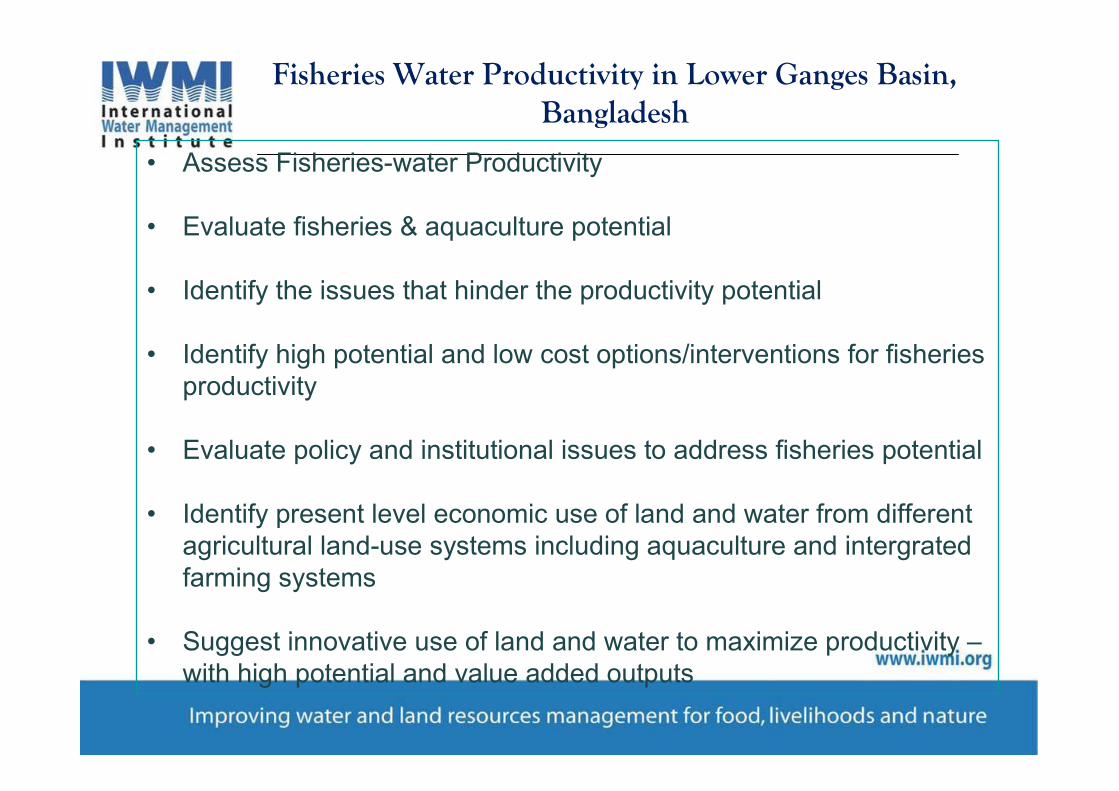
Fisheries Water Productivity in Lower Ganges Basin,
Bangladesh
• Assess Fisheries-water Productivity
• Evaluate fisheries & aquaculture potential
• Identify the issues that hinder the productivity potential
• Identify high potential and low cost options/interventions for fisheries productivity
• Evaluate policy and institutional issues to address fisheries potential
• Identify present level economic use of land and water from different agricultural land-use systems including aquaculture and intergrated farming systems
• Suggest innovative use of land and water to maximize productivity –with high potential and value added outputs
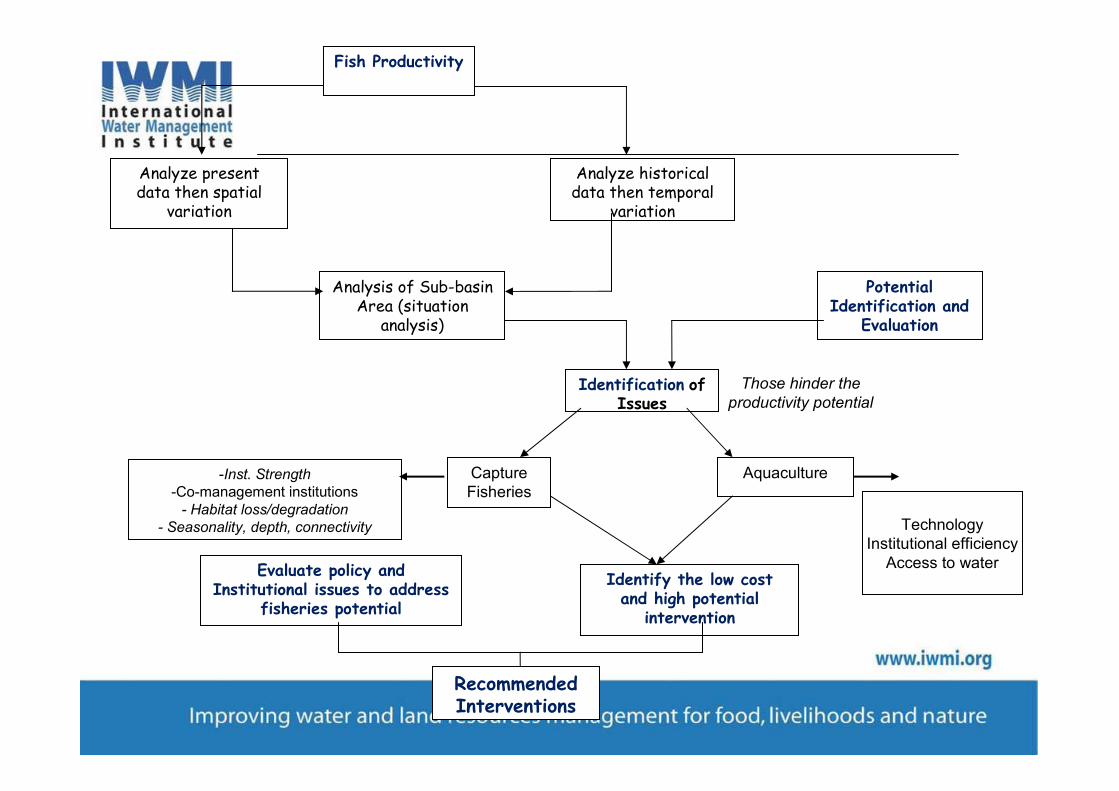
Those hinder the
productivity potential
Fish Productivity
Analyze historical data then temporal
variation
Analysis of Sub-basin Area (situation analysis)
Potential Identification and
Evaluation
Identification ofIssues
Capture Fisheries
Aquaculture
Identify the low cost and high potential intervention
Evaluate policy and Institutional issues to address
fisheries potential
Analyze present data then spatial
variation
-Inst. Strength
-Co-management institutions- Habitat loss/degradation
- Seasonality, depth, connectivity
Recommended Interventions
TechnologyInstitutional efficiency
Access to water
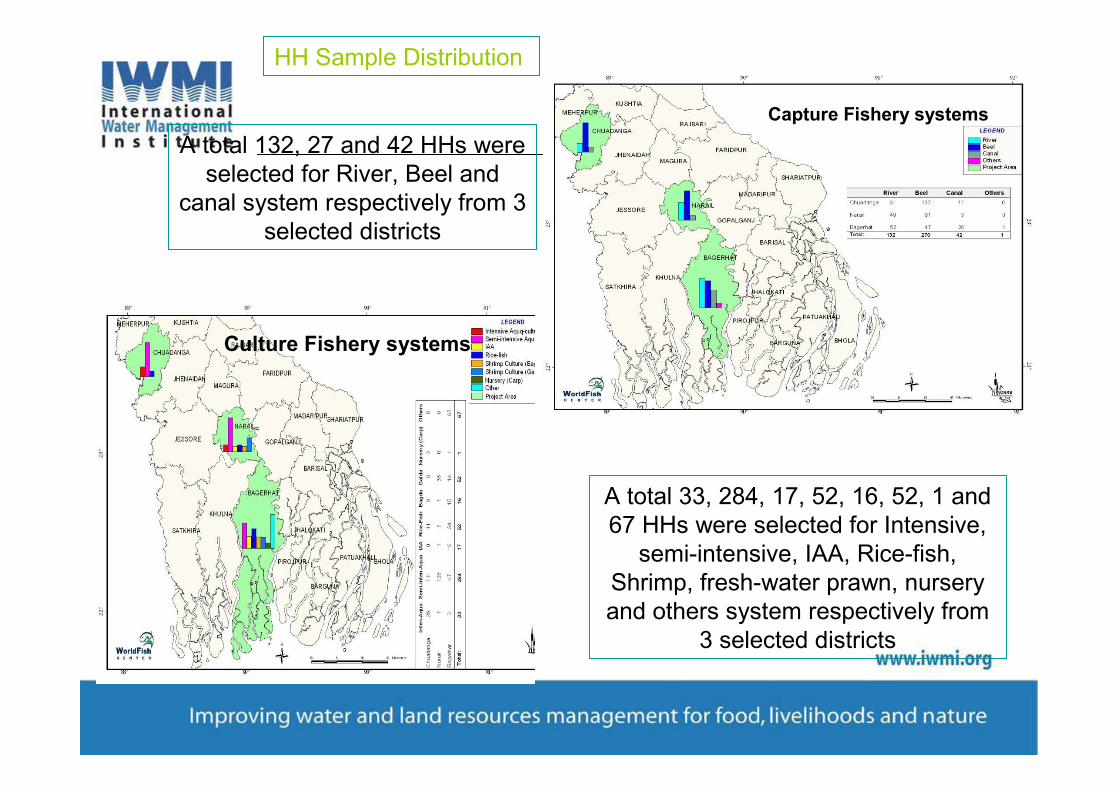
HH Sample Distribution
Capture Fishery systems
A total 132, 27 and 42 HHs were selected for River, Beel and
canal system respectively from 3 selected districts
Culture Fishery systems
A total 33, 284, 17, 52, 16, 52, 1 and 67 HHs were selected for Intensive,
semi-intensive, IAA, Rice-fish, Shrimp, fresh-water prawn, nursery and others system respectively from
3 selected districts
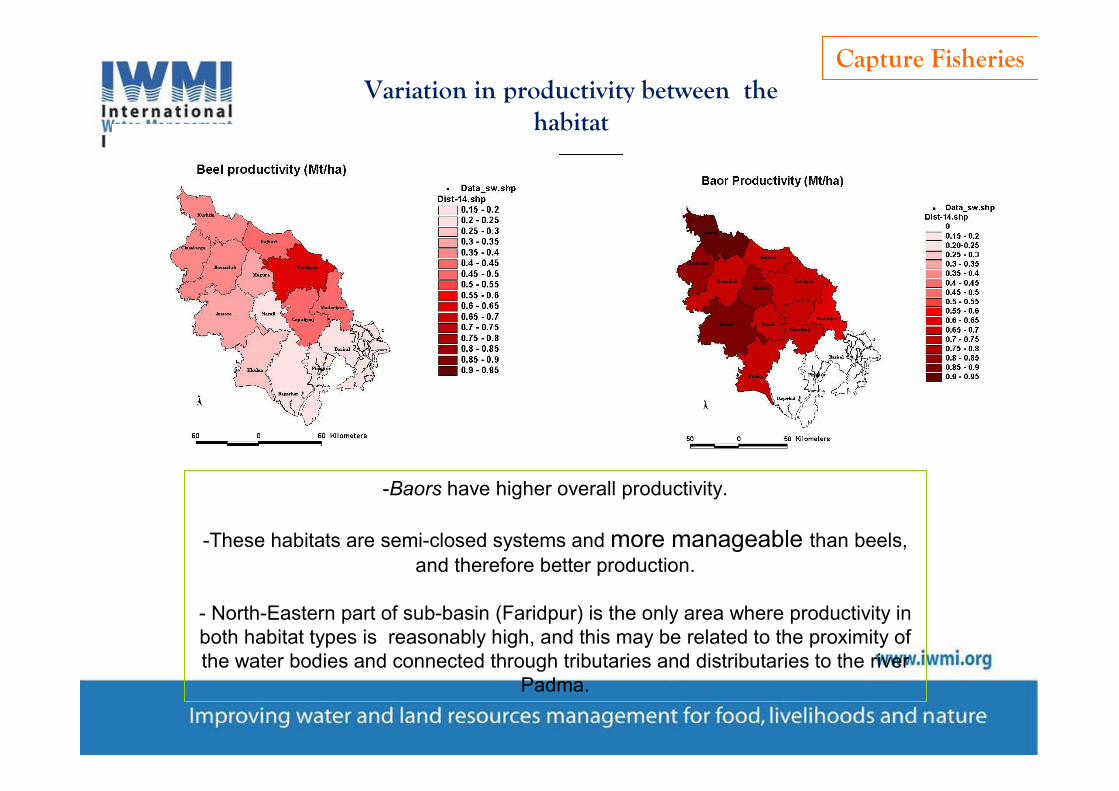
Variation in productivity between the
habitat
Capture Fisheries
-Baors have higher overall productivity.
-These habitats are semi-closed systems and more manageable than beels,
and therefore better production.
- North-Eastern part of sub-basin (Faridpur) is the only area where productivity in both habitat types is reasonably high, and this may be related to the proximity of the water bodies and connected through tributaries and distributaries to the river
Padma.
0.00%
20.00%
40.00%
60.00%
80.00%
100.00%
Non Res
pons
e
Yes No
Chuadanga
Narail
Bagerhat
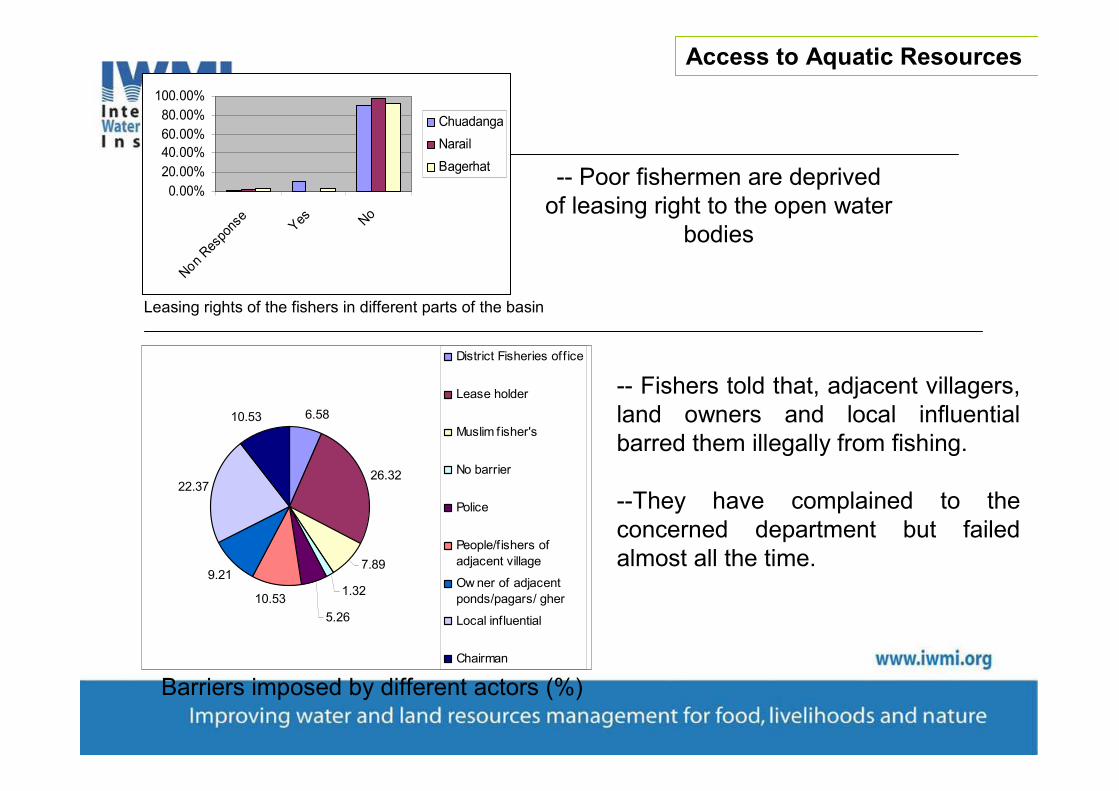
Leasing rights of the fishers in different parts of the basin
Access to Aquatic Resources
-- Fishers told that, adjacent villagers, land owners and local influential barred them illegally from fishing.
--They have complained to the concerned department but failed almost all the time.
6.58
26.32
7.89
1.32
5.26
10.53
9.21
22.37
10.53
District Fisheries office
Lease holder
Muslim f isher's
No barrier
Police
People/f ishers of
adjacent village
Ow ner of adjacent
ponds/pagars/ gher
Local influential
Chairman
Barriers imposed by different actors (%)
-- Poor fishermen are deprived of leasing right to the open water
bodies
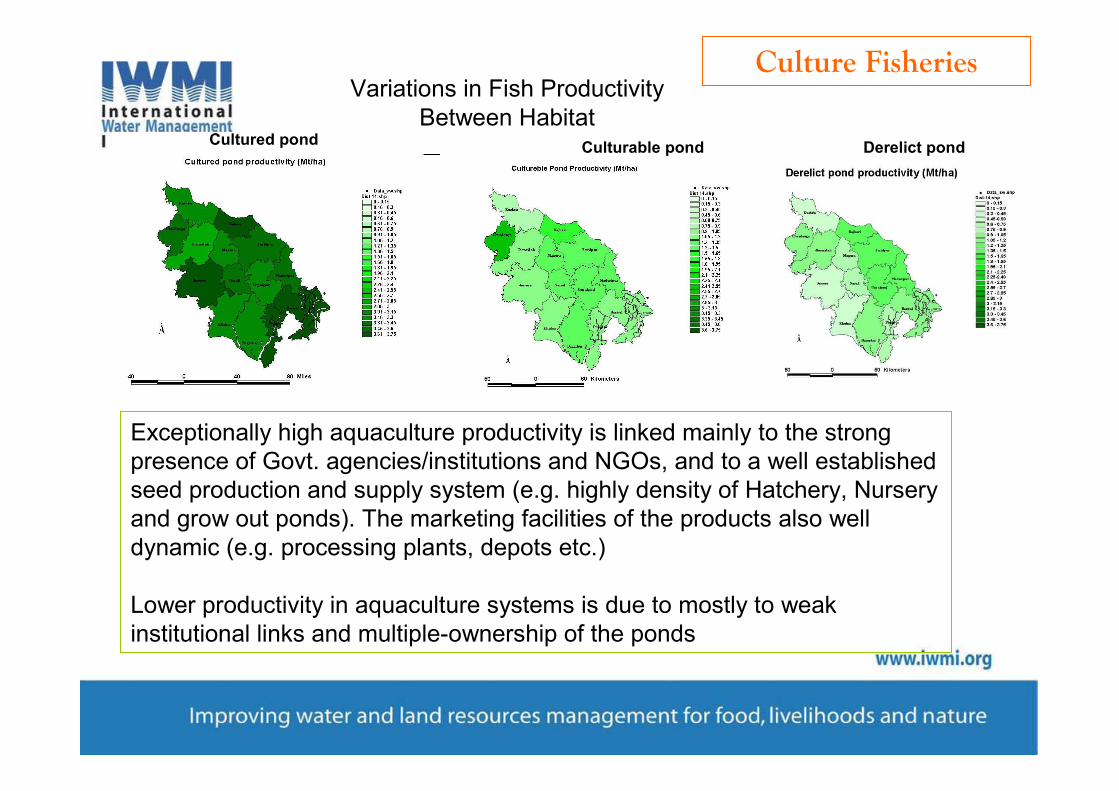
Variations in Fish Productivity Between Habitat
Cultured pondCulturable pond Derelict pond
Culture Fisheries
Exceptionally high aquaculture productivity is linked mainly to the strong presence of Govt. agencies/institutions and NGOs, and to a well established seed production and supply system (e.g. highly density of Hatchery, Nursery and grow out ponds). The marketing facilities of the products also well dynamic (e.g. processing plants, depots etc.)
Lower productivity in aquaculture systems is due to mostly to weak institutional links and multiple-ownership of the ponds
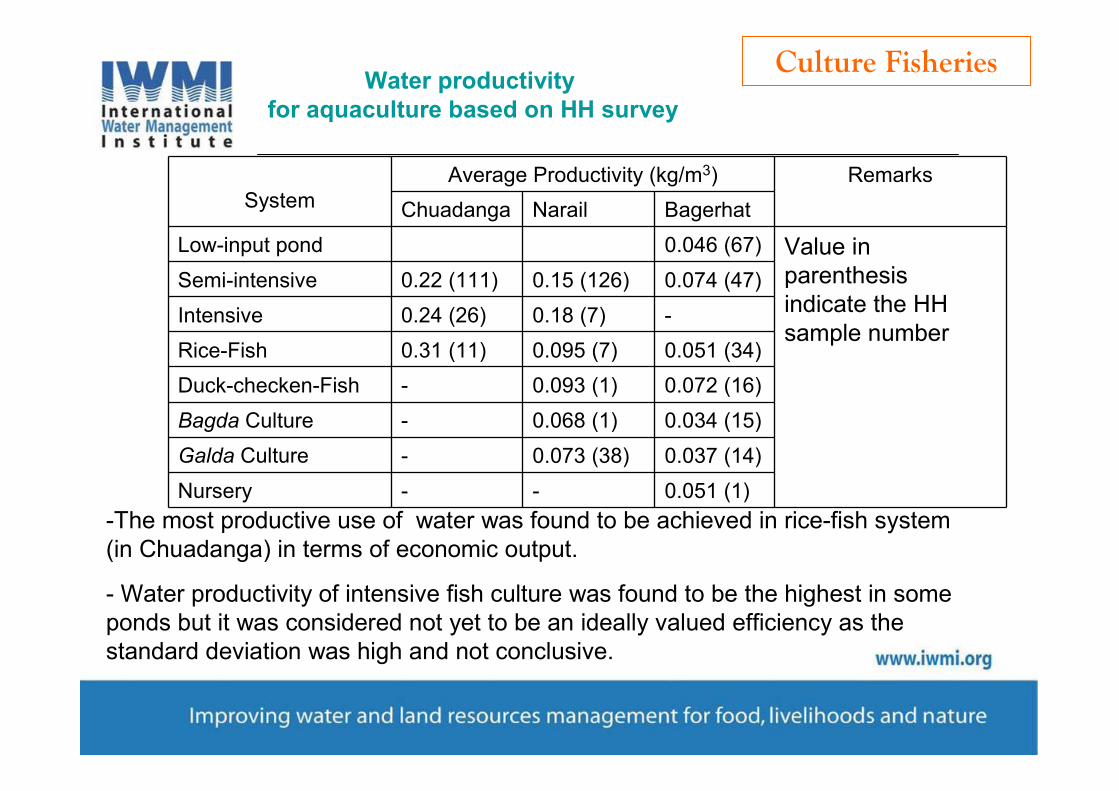
-The most productive use of water was found to be achieved in rice-fish system (in Chuadanga) in terms of economic output.
- Water productivity of intensive fish culture was found to be the highest in some ponds but it was considered not yet to be an ideally valued efficiency as the standard deviation was high and not conclusive.
SystemAverage Productivity (kg/m3) Remarks
Chuadanga Narail Bagerhat
Low-input pond 0.046 (67) Value in parenthesis indicate the HH sample number
Semi-intensive 0.22 (111) 0.15 (126) 0.074 (47)
Intensive 0.24 (26) 0.18 (7) -
Rice-Fish 0.31 (11) 0.095 (7) 0.051 (34)
Duck-checken-Fish - 0.093 (1) 0.072 (16)
Bagda Culture - 0.068 (1) 0.034 (15)
Galda Culture - 0.073 (38) 0.037 (14)
Nursery - - 0.051 (1)
Water productivity for aquaculture based on HH survey
Culture Fisheries
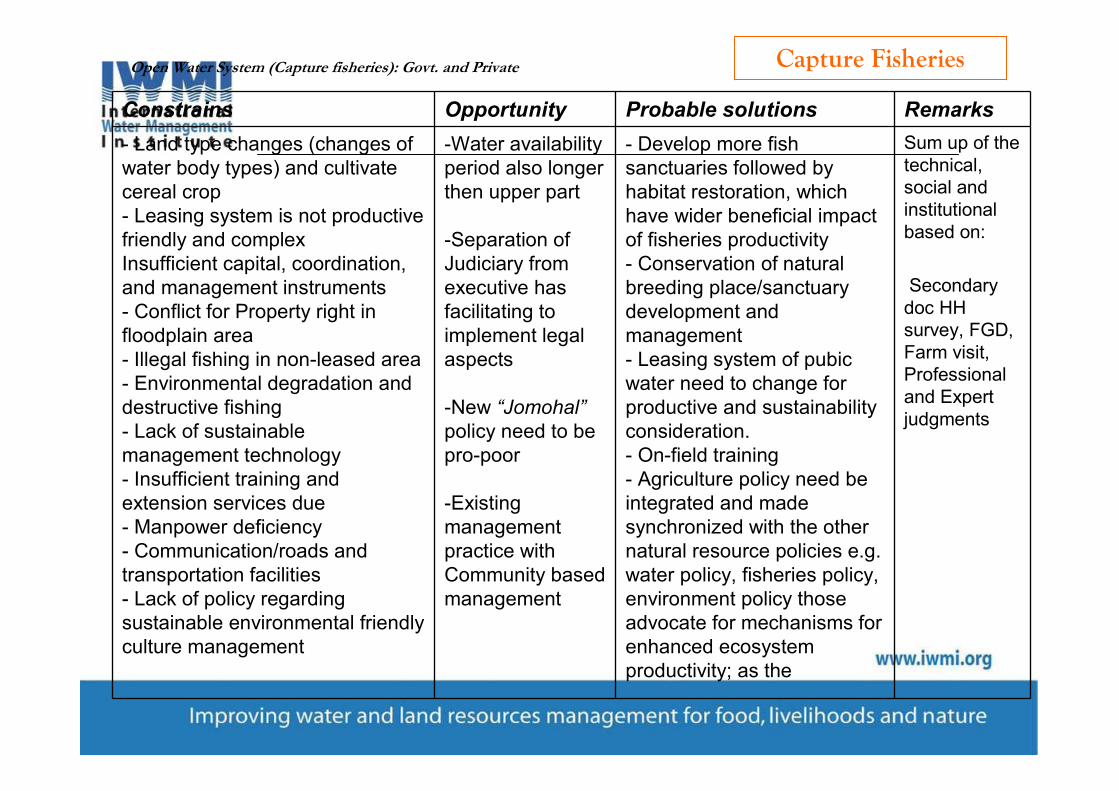
Capture FisheriesOpen Water System (Capture fisheries): Govt. and Private
Constrains Opportunity Probable solutions Remarks
- Land type changes (changes of water body types) and cultivate cereal crop- Leasing system is not productive friendly and complexInsufficient capital, coordination, and management instruments- Conflict for Property right in floodplain area- Illegal fishing in non-leased area- Environmental degradation and destructive fishing- Lack of sustainable management technology- Insufficient training and extension services due- Manpower deficiency- Communication/roads and transportation facilities- Lack of policy regarding sustainable environmental friendly culture management
-Water availability period also longer then upper part
-Separation of Judiciary from executive has facilitating to implement legal aspects
-New “Jomohal”
policy need to be pro-poor
-Existing management practice with Community based management
- Develop more fish sanctuaries followed by habitat restoration, which have wider beneficial impact of fisheries productivity- Conservation of natural breeding place/sanctuary development and management- Leasing system of pubic water need to change for productive and sustainability consideration.- On-field training- Agriculture policy need be integrated and made synchronized with the other natural resource policies e.g. water policy, fisheries policy, environment policy those advocate for mechanisms for enhanced ecosystem productivity; as the
Sum up of the technical, social and institutional based on:
Secondary doc HH survey, FGD, Farm visit, Professional and Expert judgments
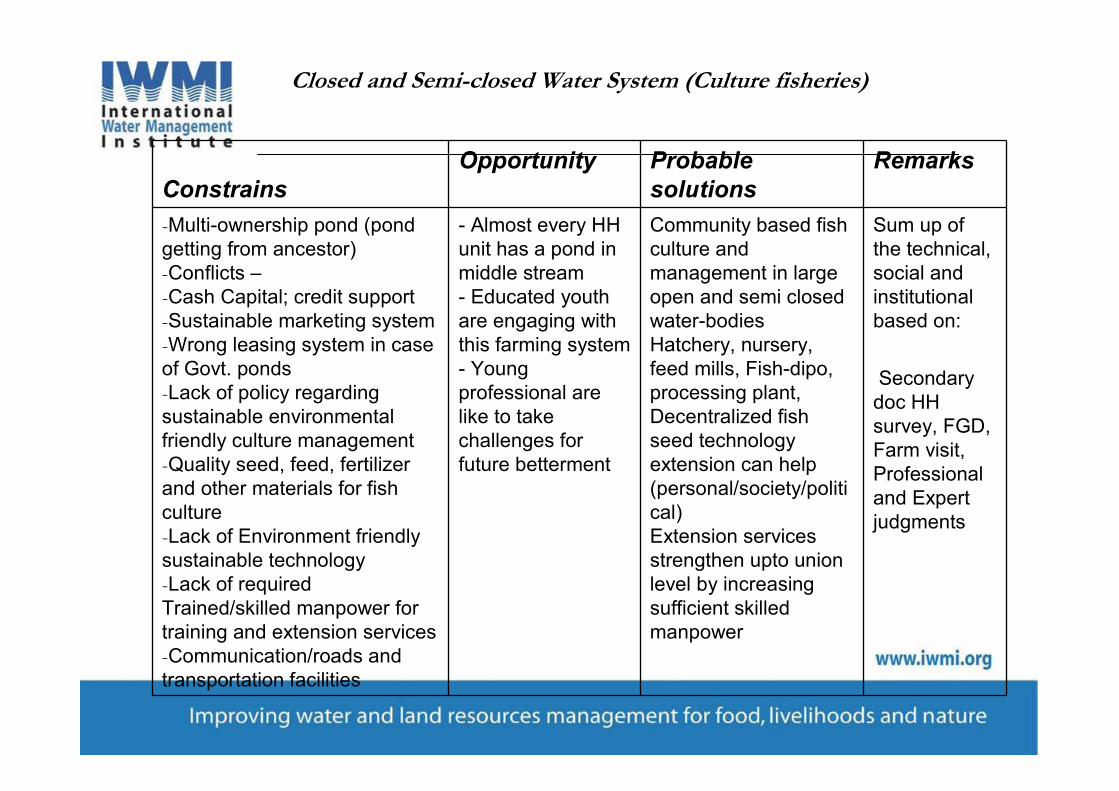
Closed and Semi-closed Water System (Culture fisheries)
Constrains
Opportunity Probable
solutions
Remarks
-Multi-ownership pond (pond getting from ancestor) -Conflicts –-Cash Capital; credit support-Sustainable marketing system-Wrong leasing system in case of Govt. ponds-Lack of policy regarding sustainable environmental friendly culture management-Quality seed, feed, fertilizer and other materials for fish culture-Lack of Environment friendly sustainable technology-Lack of required Trained/skilled manpower for training and extension services-Communication/roads and transportation facilities
- Almost every HH unit has a pond in middle stream - Educated youth are engaging with this farming system- Young professional are like to take challenges for future betterment
Community based fish culture and management in large open and semi closed water-bodiesHatchery, nursery, feed mills, Fish-dipo, processing plant,Decentralized fish seed technology extension can help (personal/society/political)Extension services strengthen upto union level by increasing sufficient skilled manpower
Sum up of the technical, social and institutional based on:
Secondary doc HH survey, FGD, Farm visit, Professional and Expert judgments
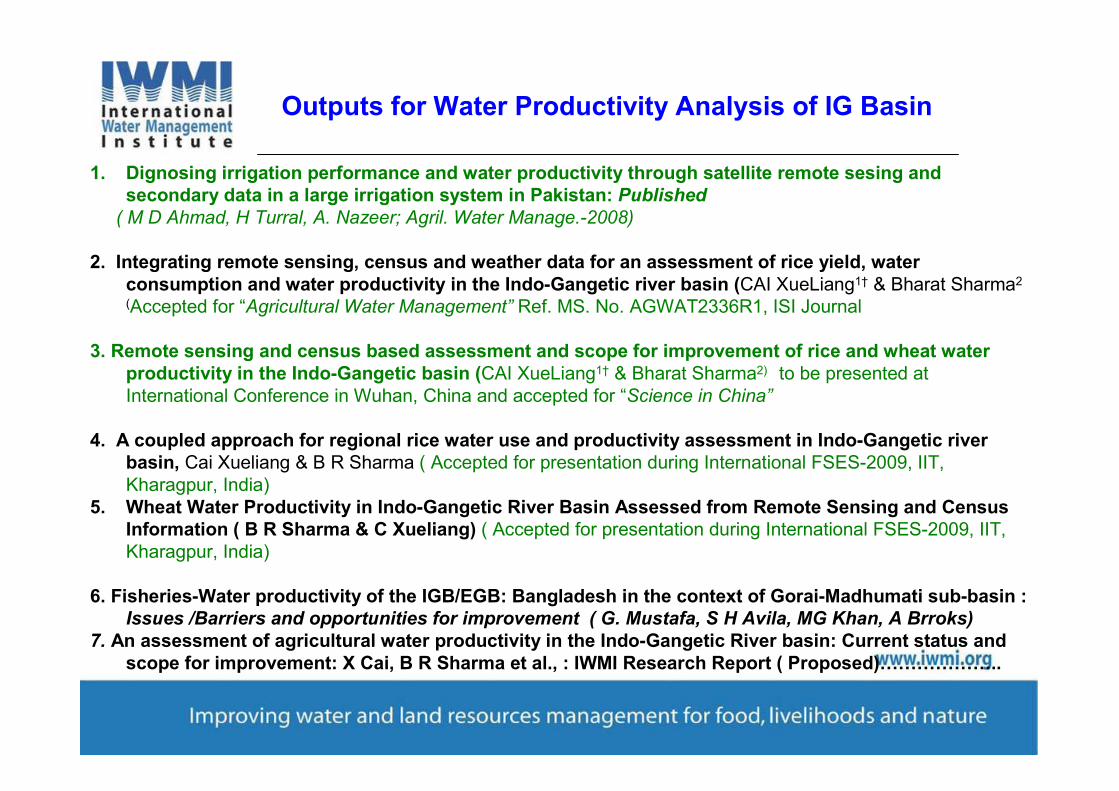
Outputs for Water Productivity Analysis of IG Basin
1. Dignosing irrigation performance and water productivity through satellite remote sesing and secondary data in a large irrigation system in Pakistan: Published
( M D Ahmad, H Turral, A. Nazeer; Agril. Water Manage.-2008)
2. Integrating remote sensing, census and weather data for an assessment of rice yield, water consumption and water productivity in the Indo-Gangetic river basin (CAI XueLiang1† & Bharat Sharma2
(Accepted for “Agricultural Water Management” Ref. MS. No. AGWAT2336R1, ISI Journal
3. Remote sensing and census based assessment and scope for improvement of rice and wheat water productivity in the Indo-Gangetic basin (CAI XueLiang1† & Bharat Sharma2) to be presented at International Conference in Wuhan, China and accepted for “Science in China”
4. A coupled approach for regional rice water use and productivity assessment in Indo-Gangetic river basin, Cai Xueliang & B R Sharma ( Accepted for presentation during International FSES-2009, IIT, Kharagpur, India)
5. Wheat Water Productivity in Indo-Gangetic River Basin Assessed from Remote Sensing and Census Information ( B R Sharma & C Xueliang) ( Accepted for presentation during International FSES-2009, IIT, Kharagpur, India)
6. Fisheries-Water productivity of the IGB/EGB: Bangladesh in the context of Gorai-Madhumati sub-basin : Issues /Barriers and opportunities for improvement ( G. Mustafa, S H Avila, MG Khan, A Brroks)
7. An assessment of agricultural water productivity in the Indo-Gangetic River basin: Current status and scope for improvement: X Cai, B R Sharma et al., : IWMI Research Report ( Proposed)JJJJJJ..
Water and Land Policies and Institutions
• Water and Energy Policies in the Indus-Gangetic Basin
•Governance of Informal Water Economies: Framework for Study of Water Governance in the Indo-Gangetic Basin
•The Water Sector Policy and Legal Framework in the Indo-Gangetic Basin: Trends, their Drivers and Implications
• Land and Water Bodies Leasing Policies in the Indus- Gangetic Basin
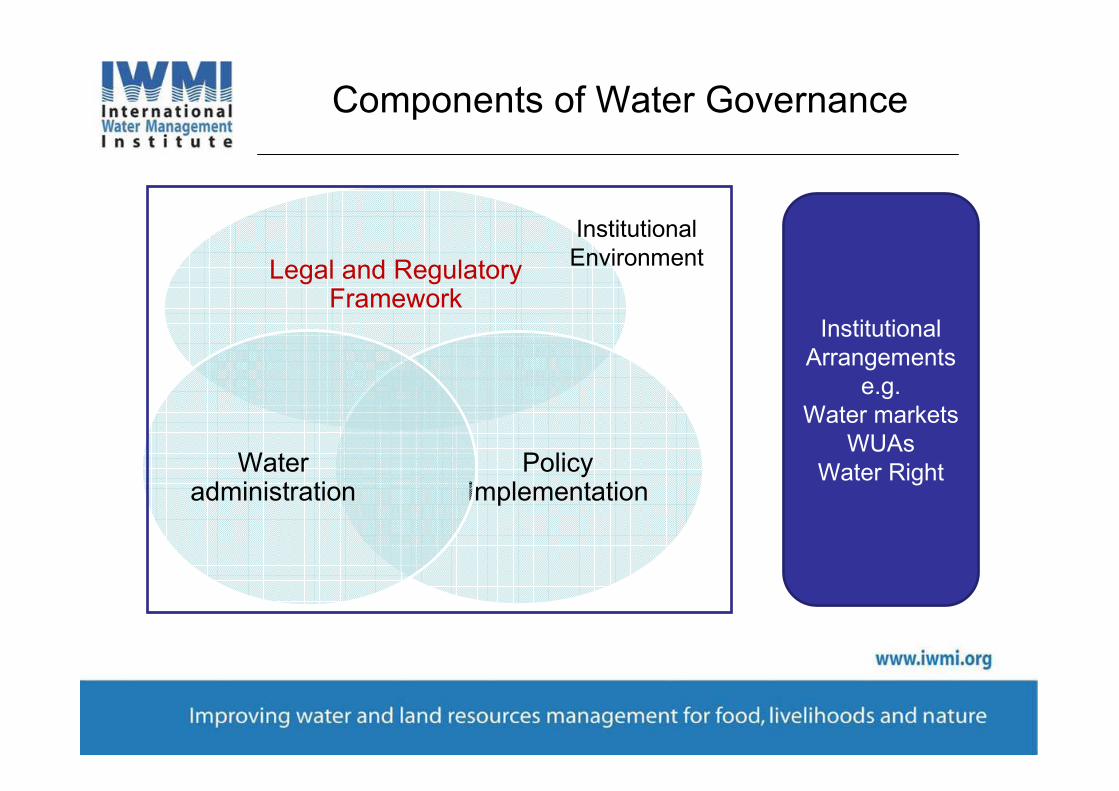
Components of Water Governance
Legal and Regulatory Framework
Policy Implementation
Water administration
InstitutionalEnvironment
Institutional Arrangements
e.g.Water markets
WUAsWater Right
Why are we doing this study?
• South Asian countries are known for their limited state capacity and a huge mismatch between state’s ambitions and capabilities.
• Society is in many ways powerful than the state.
• Laws are most often statement of intent and most often not even that!
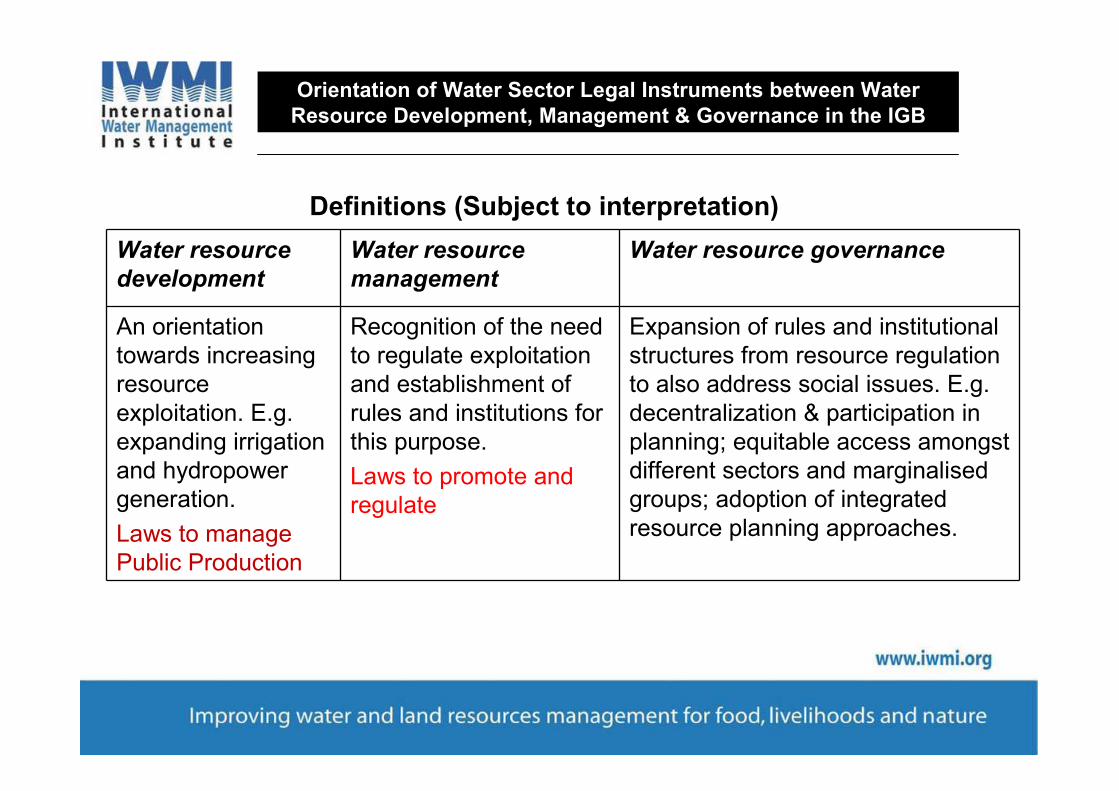
Definitions (Subject to interpretation)
Water resource
development
Water resource
management
Water resource governance
An orientation towards increasing resource exploitation. E.g. expanding irrigation and hydropower generation.
Laws to manage Public Production
Recognition of the need to regulate exploitation and establishment of rules and institutions for this purpose.
Laws to promote and regulate
Expansion of rules and institutional structures from resource regulation to also address social issues. E.g. decentralization & participation in planning; equitable access amongst different sectors and marginalised groups; adoption of integrated resource planning approaches.
Orientation of Water Sector Legal Instruments between Water Resource Development, Management & Governance in the IGB
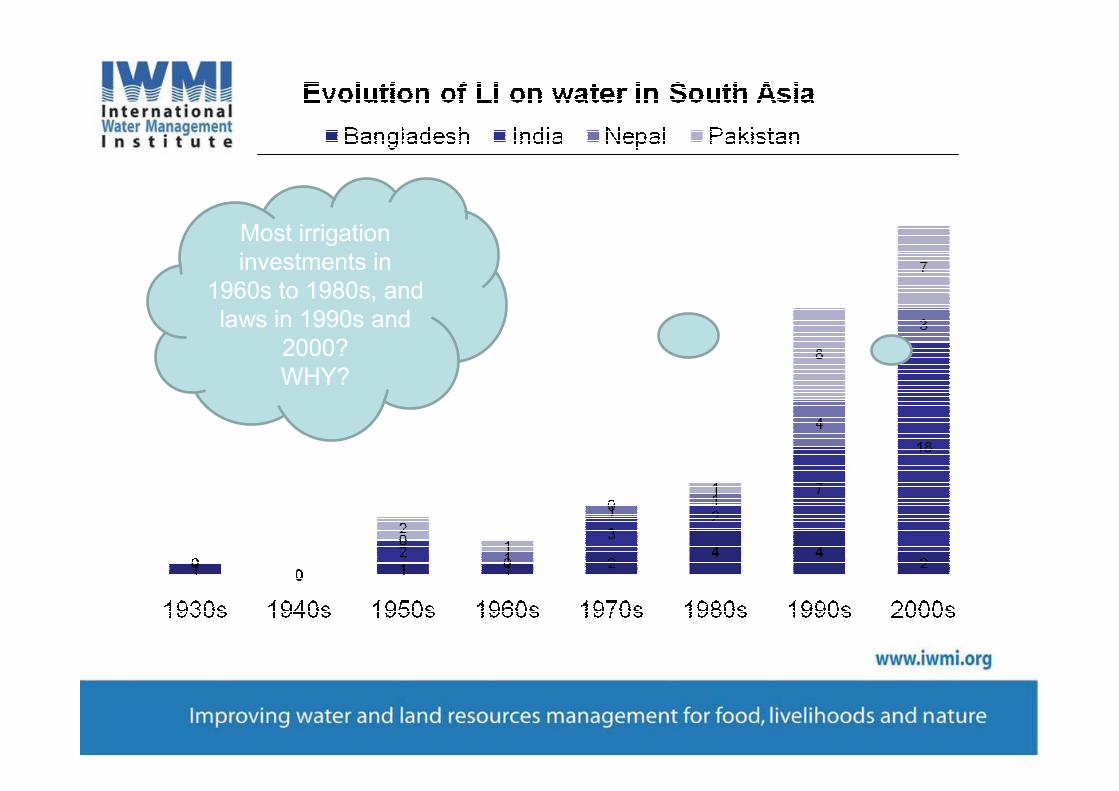
Most irrigation investments in
1960s to 1980s, and laws in 1990s and
2000? WHY?
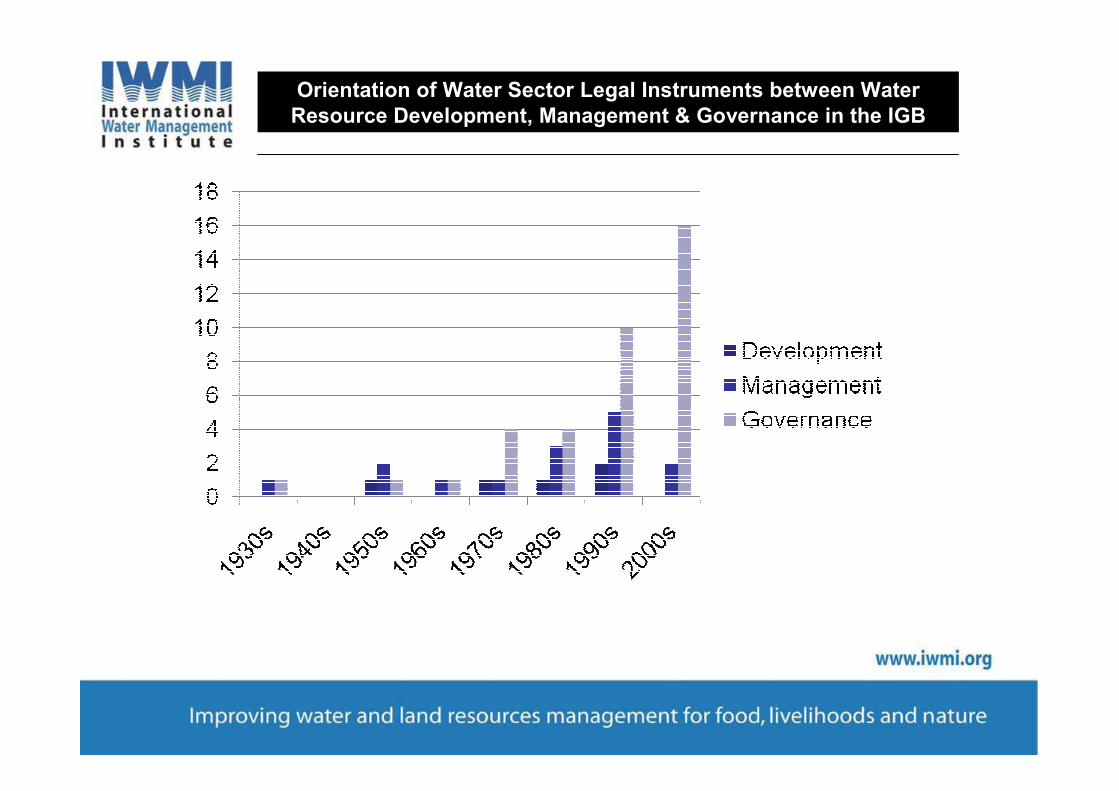
Orientation of Water Sector Legal Instruments between Water Resource Development, Management & Governance in the IGB
02468
1012141618202224262830
Ins
tru
me
nts
1900 to
1909
1910 to
1919
1920 to
1929
1930 to
1939
1940 to
1949
1950 to
1959
1960 to
1969
1970 to
1979
1980 to
1989
1990 to
1999
2000 to
2009
Decade
Irrigation & Drainage Bangladesh Irrigation & Drainage India Irrigation & Drainage Nepal Irrigation & Drainage Pakistan
Hydropower Bangladesh Hydropower India Hydropower Nepal Hydropower Pakistan
Watershed Mgt Bangladesh Watershed Mgt India Watershed Mgt Nepal Watershed Mgt Pakistan
Environmental Mgt Bangladesh Environmental Mgt India Environmental Mgt Nepal Environmental Mgt Pakistan
Flood Mgt Bangladesh Flood Mgt India Flood Mgt Nepal Flood Mgt Pakistan
Water Quality Bangladesh Water Quality India Water Quality Nepal Water Quality Pakistan
Drinking water supply Bangladesh Drinking water supply India Drinking water supply Nepal Drinking water supply Pakistan
Municipal Water Bangladesh Municipal Water India Municipal Water Nepal Municipal Water Pakistan
Water Use Efficiency Bangladesh Water Use Efficiency India Water Use Efficiency Nepal Water Use Efficiency Pakistan
IWRM Bangladesh IWRM India IWRM Nepal IWRM Pakistan
Dispute Resolution Bangladesh Dispute Resolution India Dispute Resolution Nepal Dispute Resolution Pakistan
Groundwater Bangladesh Groundwater India Groundwater Nepal Groundwater Pakistan
Cost Recovery Bangladesh Cost Recovery India Cost Recovery Nepal Cost Recovery Pakistan
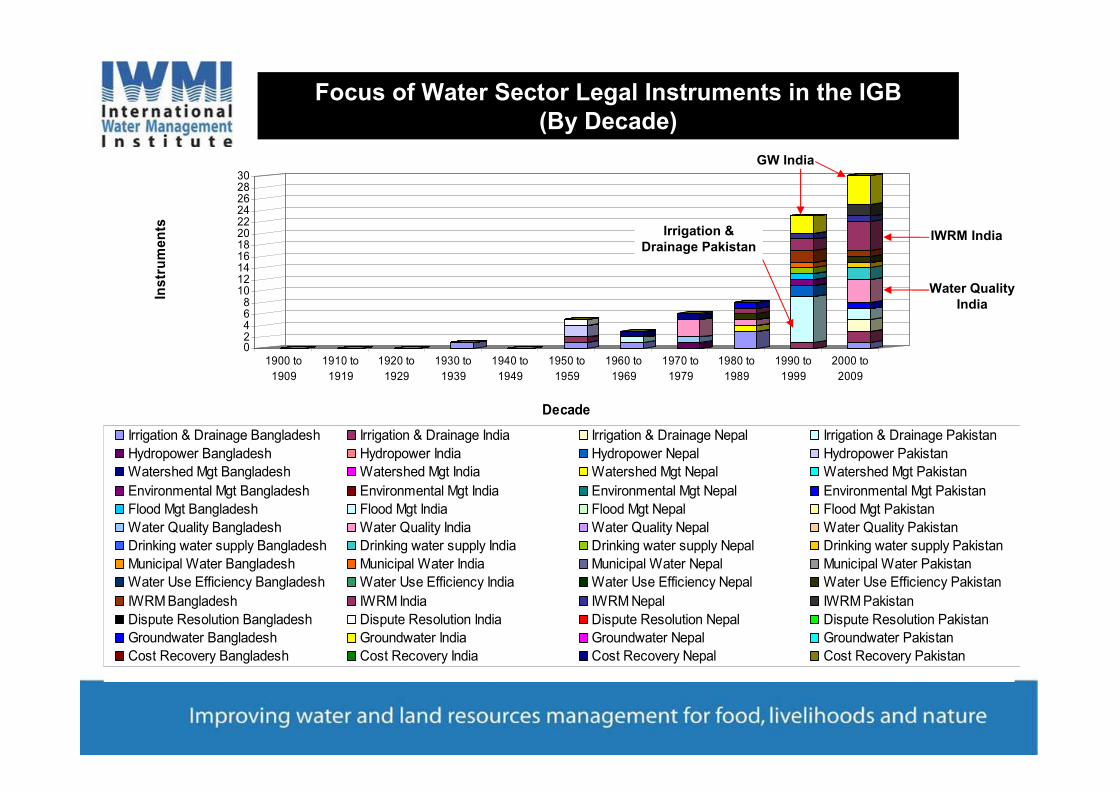
IWRM India
Water Quality India
Irrigation & Drainage Pakistan
GW India
Focus of Water Sector Legal Instruments in the IGB (By Decade)
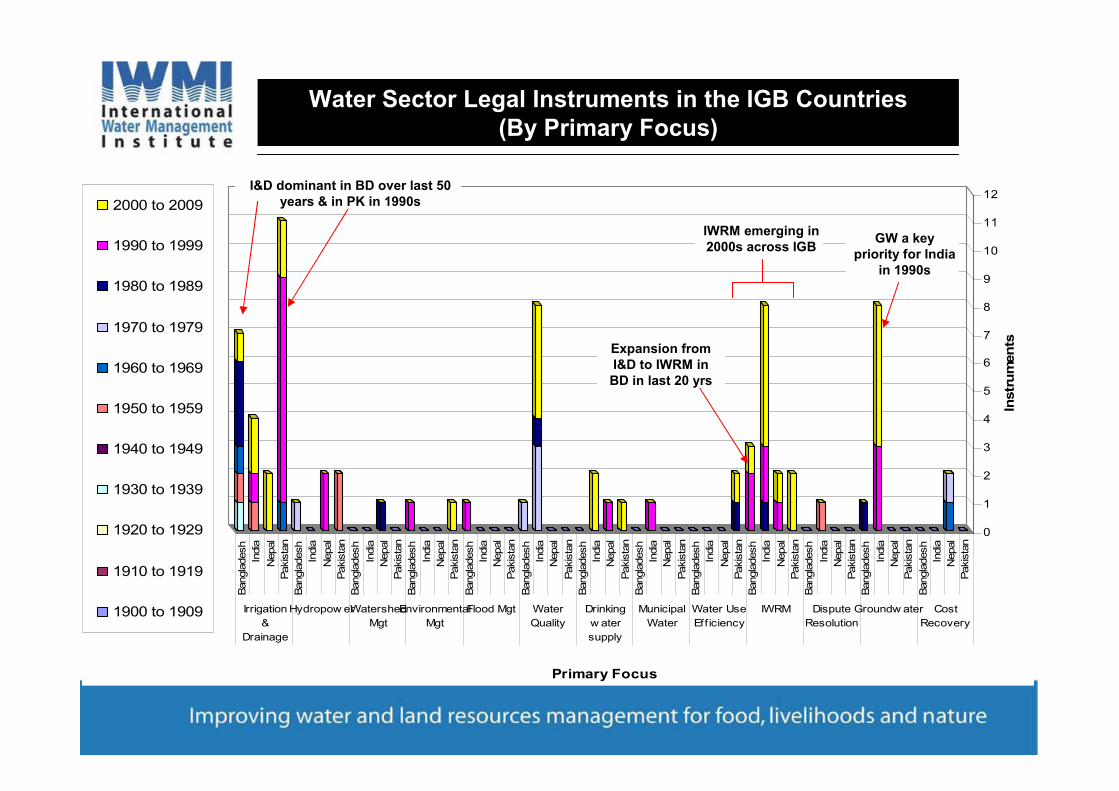
Water Sector Legal Instruments in the IGB Countries (By Primary Focus)
0
1
2
3
4
5
6
7
8
9
10
11
12
Instr
um
en
ts
Bangla
desh
India
Nepal
Pakis
tan
Bangla
desh
India
Nepal
Pakis
tan
Bangla
desh
India
Nepal
Pakis
tan
Bangla
desh
India
Nepal
Pakis
tan
Bangla
desh
India
Nepal
Pakis
tan
Bangla
desh
India
Nepal
Pakis
tan
Bangla
desh
India
Nepal
Pakis
tan
Bangla
desh
India
Nepal
Pakis
tan
Bangla
desh
India
Nepal
Pakis
tan
Bangla
desh
India
Nepal
Pakis
tan
Bangla
desh
India
Nepal
Pakis
tan
Bangla
desh
India
Nepal
Pakis
tan
Bangla
desh
India
Nepal
Pakis
tan
Irrigation
&
Drainage
Hydropow erWatershed
Mgt
Environmental
Mgt
Flood Mgt Water
Quality
Drinking
w ater
supply
Municipal
Water
Water Use
Eff iciency
IWRM Dispute
Resolution
Groundw ater Cost
Recovery
Primary Focus
2000 to 2009
1990 to 1999
1980 to 1989
1970 to 1979
1960 to 1969
1950 to 1959
1940 to 1949
1930 to 1939
1920 to 1929
1910 to 1919
1900 to 1909
IWRM emerging in 2000s across IGB
GW a key priority for India
in 1990s
I&D dominant in BD over last 50 years & in PK in 1990s
Expansion from I&D to IWRM in BD in last 20 yrs
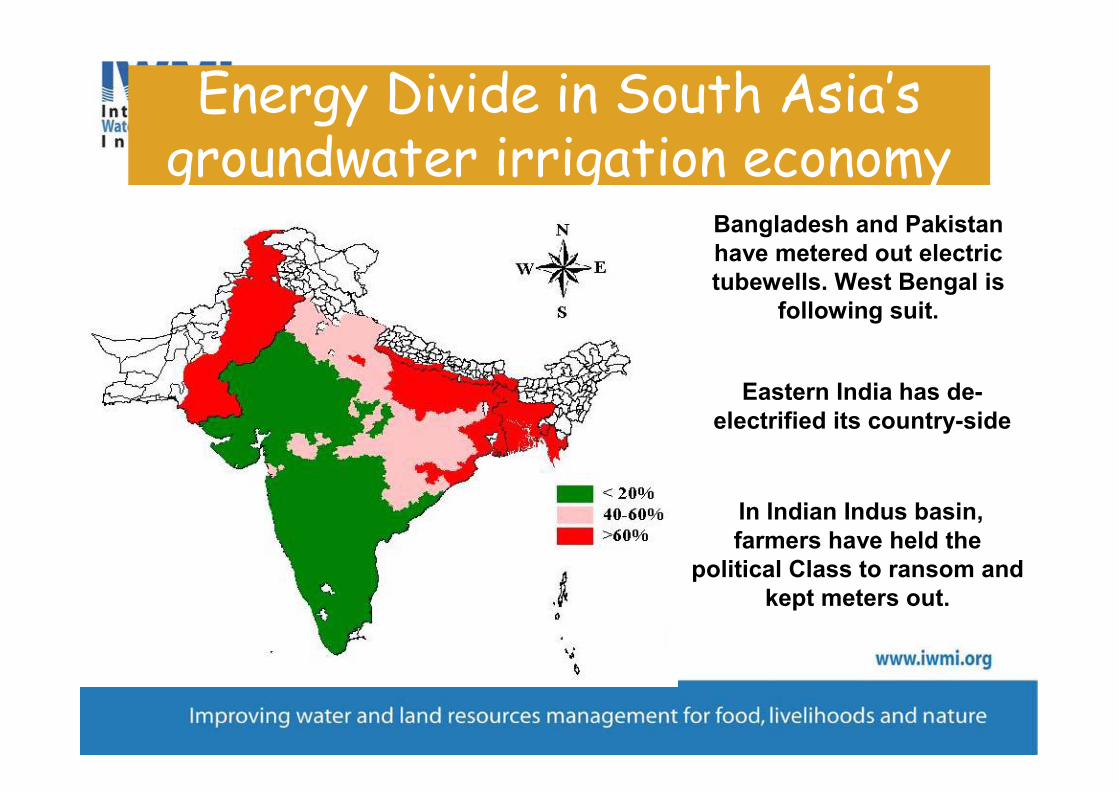
Energy Divide in South Asia’s groundwater irrigation economy
Bangladesh and Pakistan have metered out electric tubewells. West Bengal is
following suit.
Eastern India has de-electrified its country-side
In Indian Indus basin, farmers have held the
political Class to ransom and kept meters out.
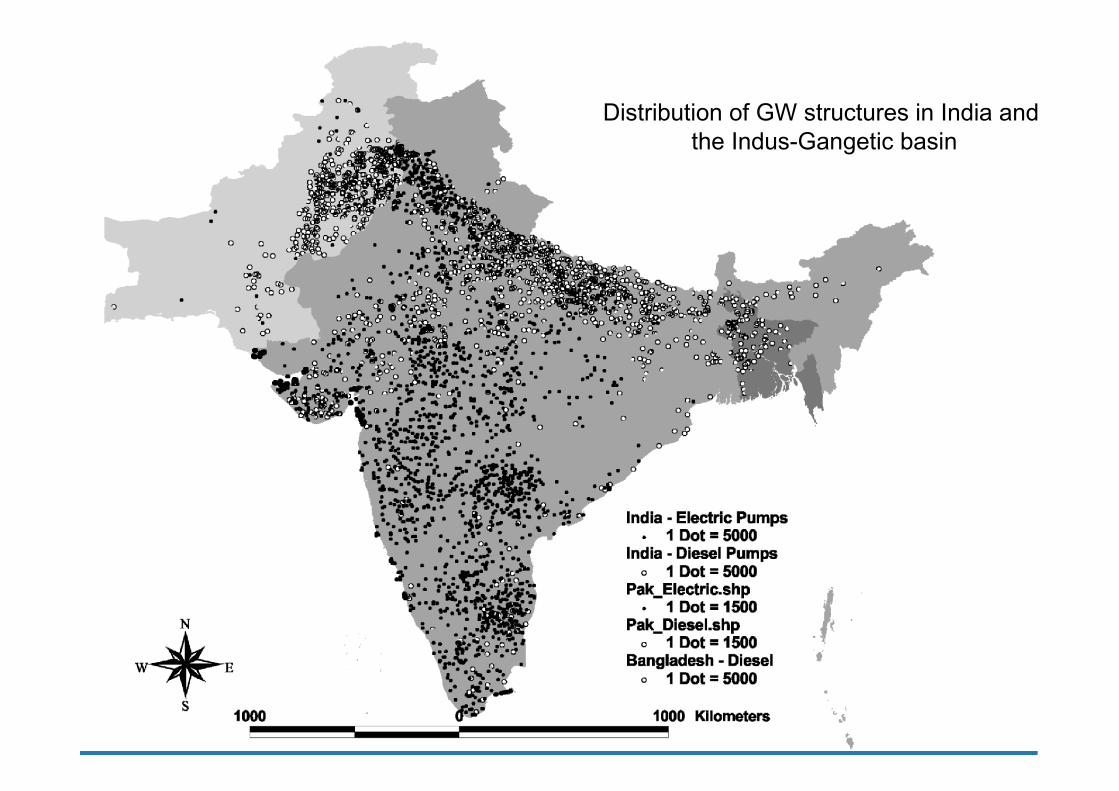
Distribution of GW structures in India andthe Indus-Gangetic basin
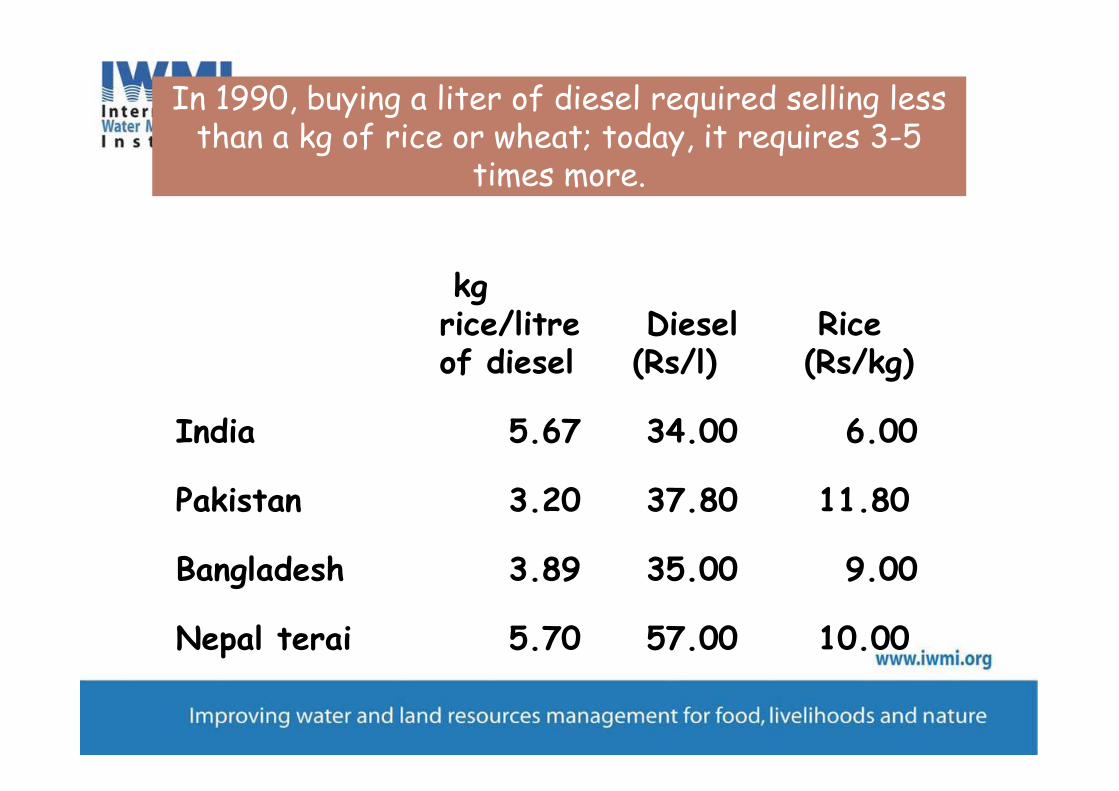
In 1990, buying a liter of diesel required selling less than a kg of rice or wheat; today, it requires 3-5
times more.
kg rice/litre of diesel
Diesel (Rs/l)
Rice (Rs/kg)
India 5.67 34.00 6.00
Pakistan 3.20 37.80 11.80
Bangladesh 3.89 35.00 9.00
Nepal terai 5.70 57.00 10.00
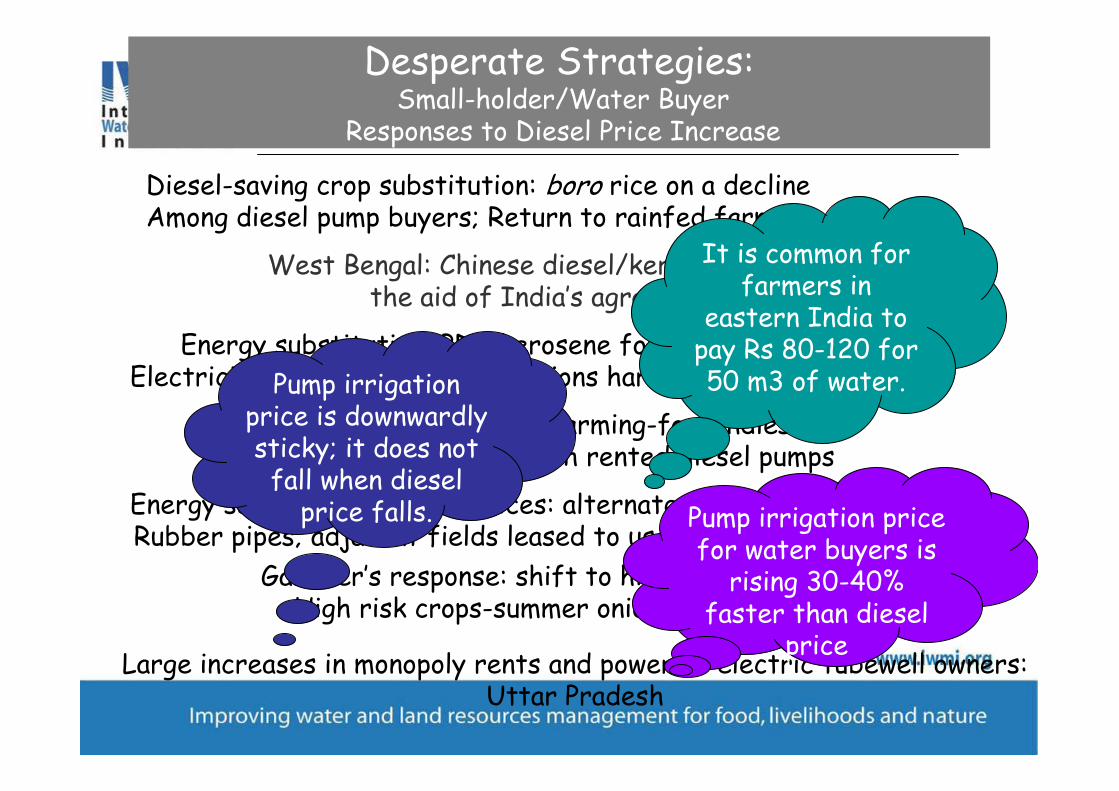
Desperate Strategies:Small-holder/Water Buyer
Responses to Diesel Price Increase
West Bengal: Chinese diesel/kerosene pumps to the aid of India’s agrarian poor
Diesel-saving crop substitution: boro rice on a decline Among diesel pump buyers; Return to rainfed farming
Energy substitution: PDS kerosene for diesel; Electricity preferred but connections hard to come by
Forced exit from unviable farming-for landless who Cultivated leased land with rented diesel pumps
Energy saving irrigation practices: alternate furrow; Rubber pipes; adjacent fields leased to use drainage
Gambler’s response: shift to high value, high input, High risk crops-summer onion in North Bihar
Large increases in monopoly rents and power of electric tubewell owners:Uttar Pradesh
Pump irrigation price for water buyers is rising 30-40%
faster than diesel price
Pump irrigation price is downwardly sticky; it does not fall when diesel price falls.
It is common for farmers in
eastern India to pay Rs 80-120 for 50 m3 of water.
Outputs from Policy and Institutions Studies
1. Is irrigation water free ? A reality check in the Indo-Gangetic basin : T shah, M U Hasan, M Z Khattak, P S Banerjee, OP Singh, SU Rehman;
World Development (2008)- Published
2. An inventory of national, sub-national and transboundary water-related legal instruments in Indus- Gangetic basin :( A Mukherji, S de Silva)
3. Evolution of water sector policies and laws in the Indus-Gangetic Basin – Drivers and Trends: ( A Mukherji, S de Silva)
4. Institutional dynamics of culture fishery economy in the Indo-Gangetic basin: ( T Shah , R Indu)
3. Governance of Informal Water Economies: A Preliminary Framework for Study of Water Governance in the Indo-Gangetic Basin : ( T Shah, RPS Malik) ?
Potential interventions
Definition of interventions and development of intervention matrices
Intervention analysis
Identification of potential intervention
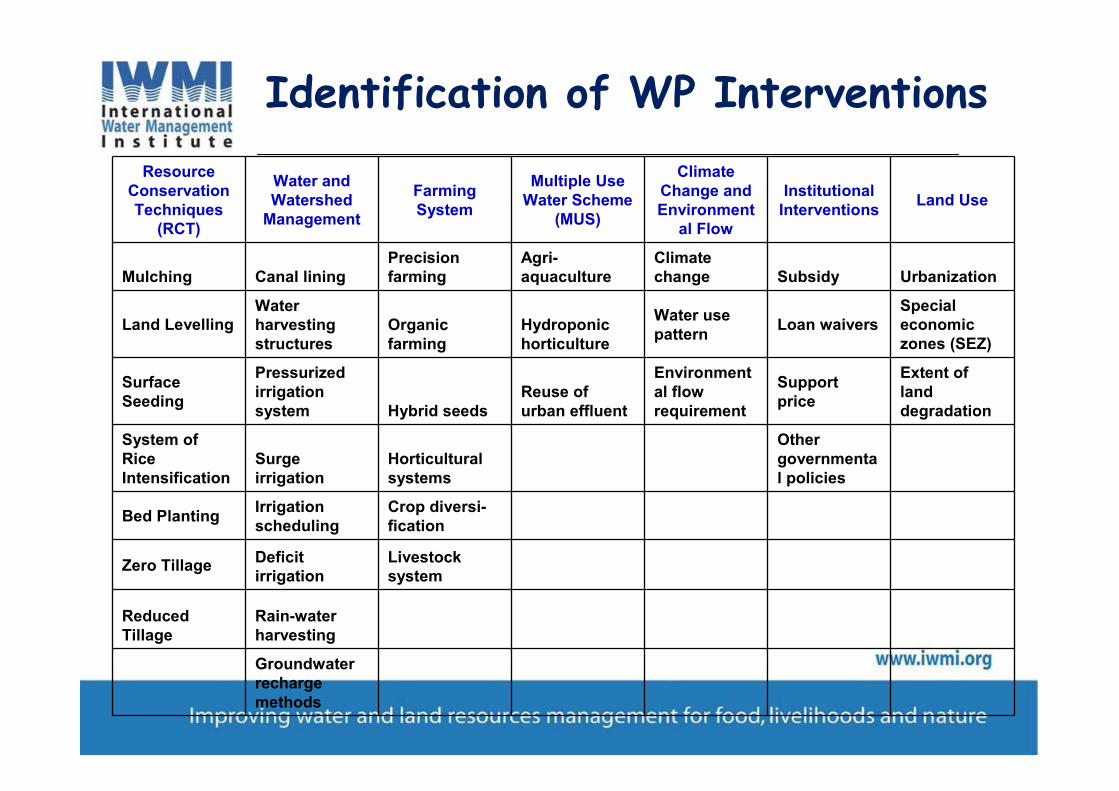
Identification of WP Interventions
Resource Conservation Techniques
(RCT)
Water and Watershed
Management
Farming System
Multiple Use Water Scheme
(MUS)
Climate Change and Environment
al Flow
Institutional Interventions
Land Use
Mulching Canal liningPrecision farming
Agri-aquaculture
Climate change Subsidy Urbanization
Land LevellingWater harvesting structures
Organic farming
Hydroponic horticulture
Water use pattern
Loan waiversSpecial economic zones (SEZ)
Surface Seeding
Pressurized irrigation system Hybrid seeds
Reuse of urban effluent
Environmental flow requirement
Support price
Extent of land degradation
System of Rice Intensification
Surge irrigation
Horticultural systems
Other governmental policies
Bed PlantingIrrigation scheduling
Crop diversi-fication
Zero TillageDeficit irrigation
Livestock system
Reduced Tillage
Rain-water harvesting
Groundwater recharge methods
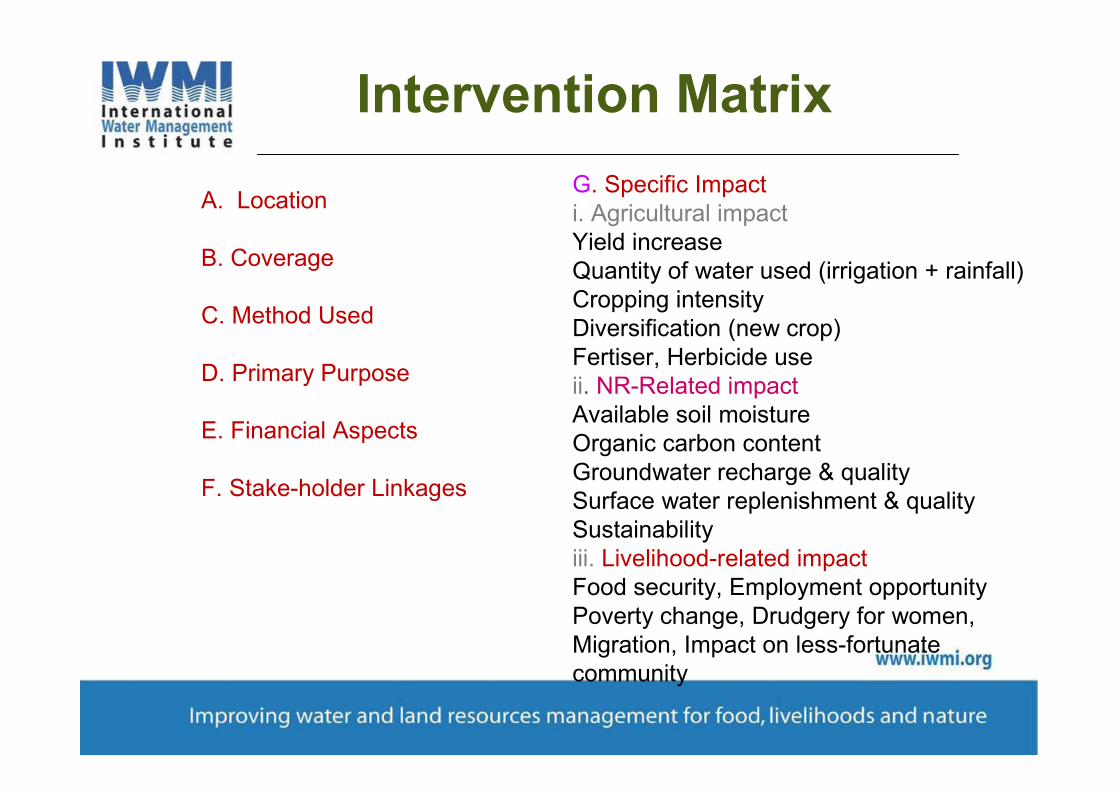
Intervention Matrix
A. Location
B. Coverage
C. Method Used
D. Primary Purpose
E. Financial Aspects
F. Stake-holder Linkages
G. Specific Impacti. Agricultural impactYield increaseQuantity of water used (irrigation + rainfall)Cropping intensityDiversification (new crop)Fertiser, Herbicide useii. NR-Related impactAvailable soil moistureOrganic carbon contentGroundwater recharge & qualitySurface water replenishment & qualitySustainabilityiii. Livelihood-related impactFood security, Employment opportunityPoverty change, Drudgery for women,Migration, Impact on less-fortunate community
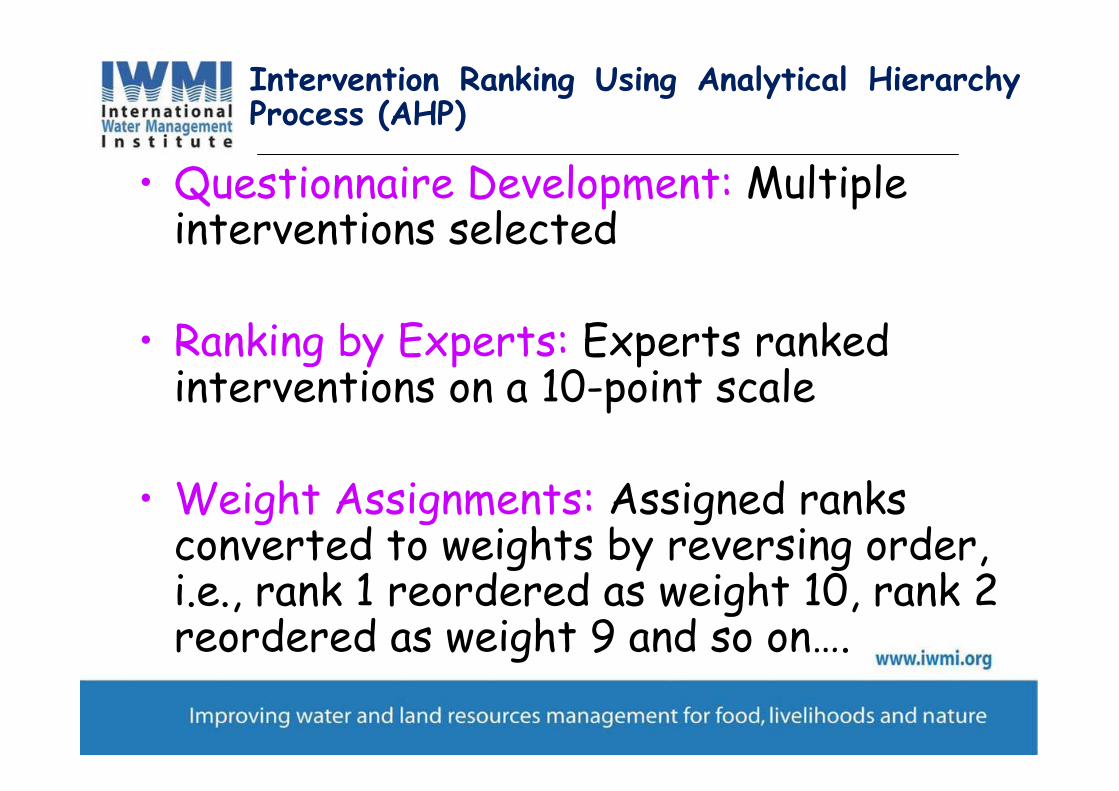
• Questionnaire Development: Multiple interventions selected
• Ranking by Experts: Experts ranked interventions on a 10-point scale
• Weight Assignments: Assigned ranks converted to weights by reversing order, i.e., rank 1 reordered as weight 10, rank 2 reordered as weight 9 and so on….
Intervention Ranking Using Analytical Hierarchy Process (AHP)
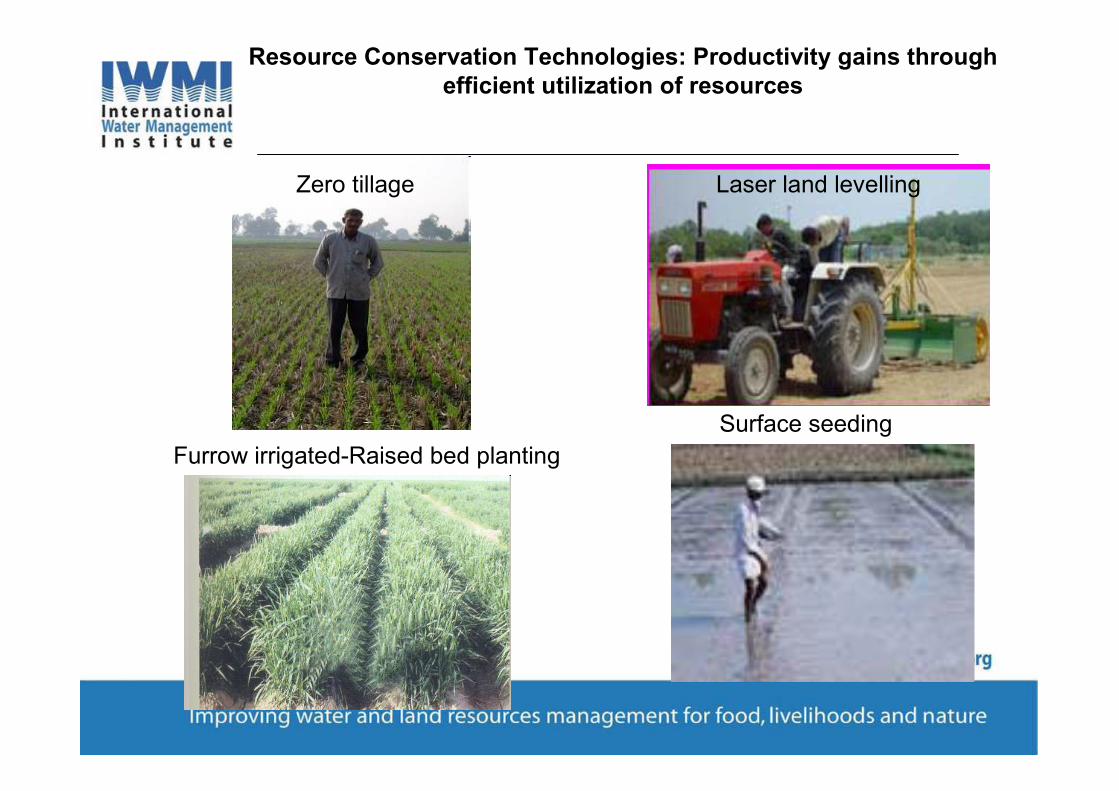
Resource Conservation Technologies: Productivity gains through efficient utilization of resources
Laser land levellingZero tillage
Furrow irrigated-Raised bed planting
Surface seeding
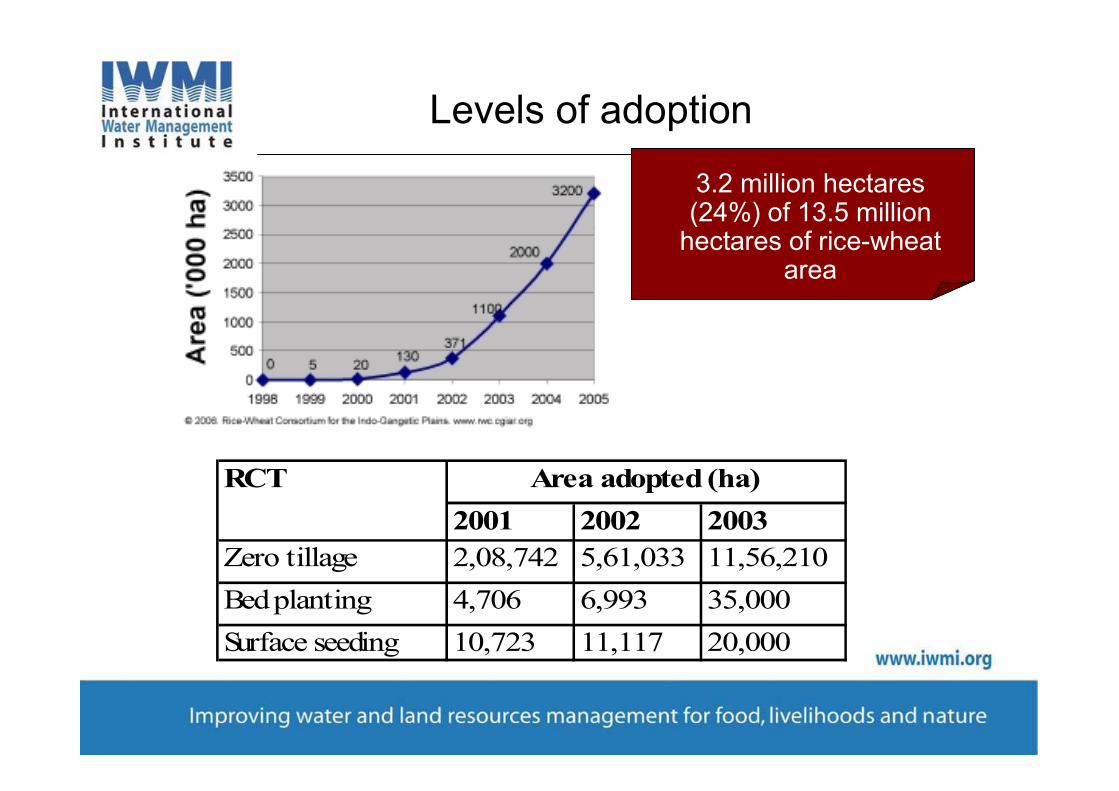
2001 2002 2003
Zero tillage 2,08,742 5,61,033 11,56,210
Bed planting 4,706 6,993 35,000
Surface seeding 10,723 11,117 20,000
RCT Area adopted (ha)
3.2 million hectares (24%) of 13.5 million
hectares of rice-wheat area
Levels of adoption
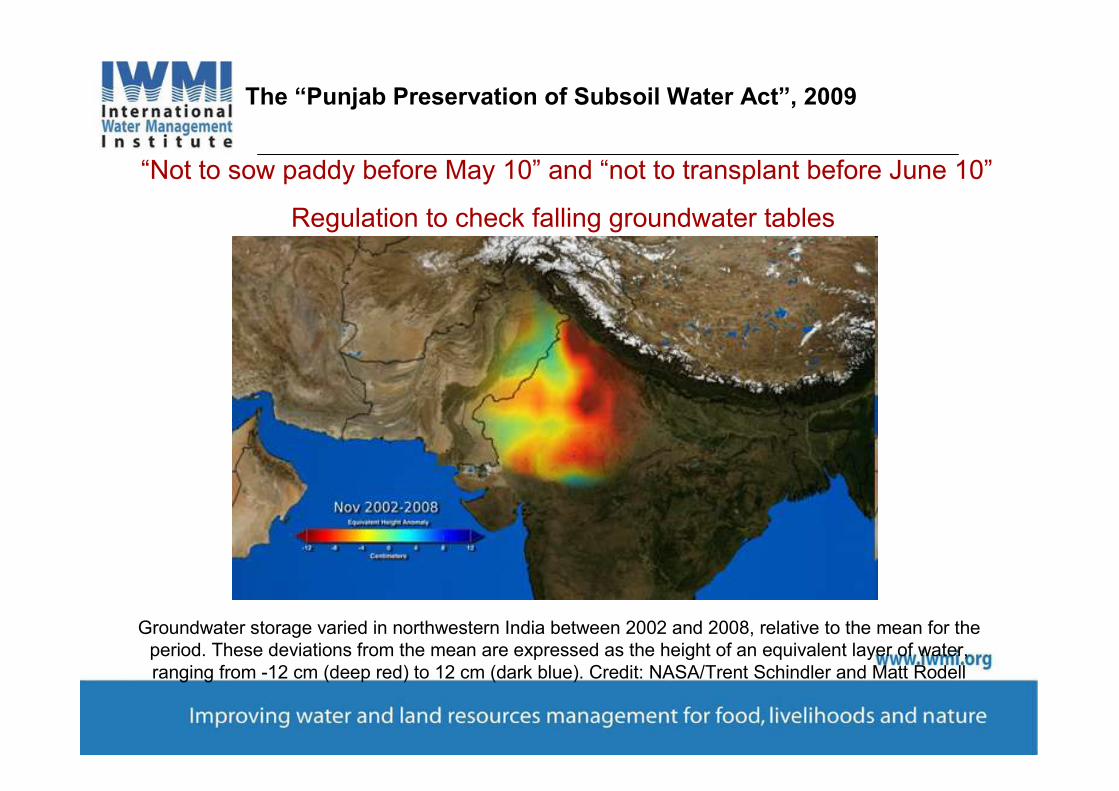
The “Punjab Preservation of Subsoil Water Act”, 2009
“Not to sow paddy before May 10” and “not to transplant before June 10”
Regulation to check falling groundwater tables
Groundwater storage varied in northwestern India between 2002 and 2008, relative to the mean for the period. These deviations from the mean are expressed as the height of an equivalent layer of water, ranging from -12 cm (deep red) to 12 cm (dark blue). Credit: NASA/Trent Schindler and Matt Rodell
0
10
20
30
40
50
60
70
80
90
100
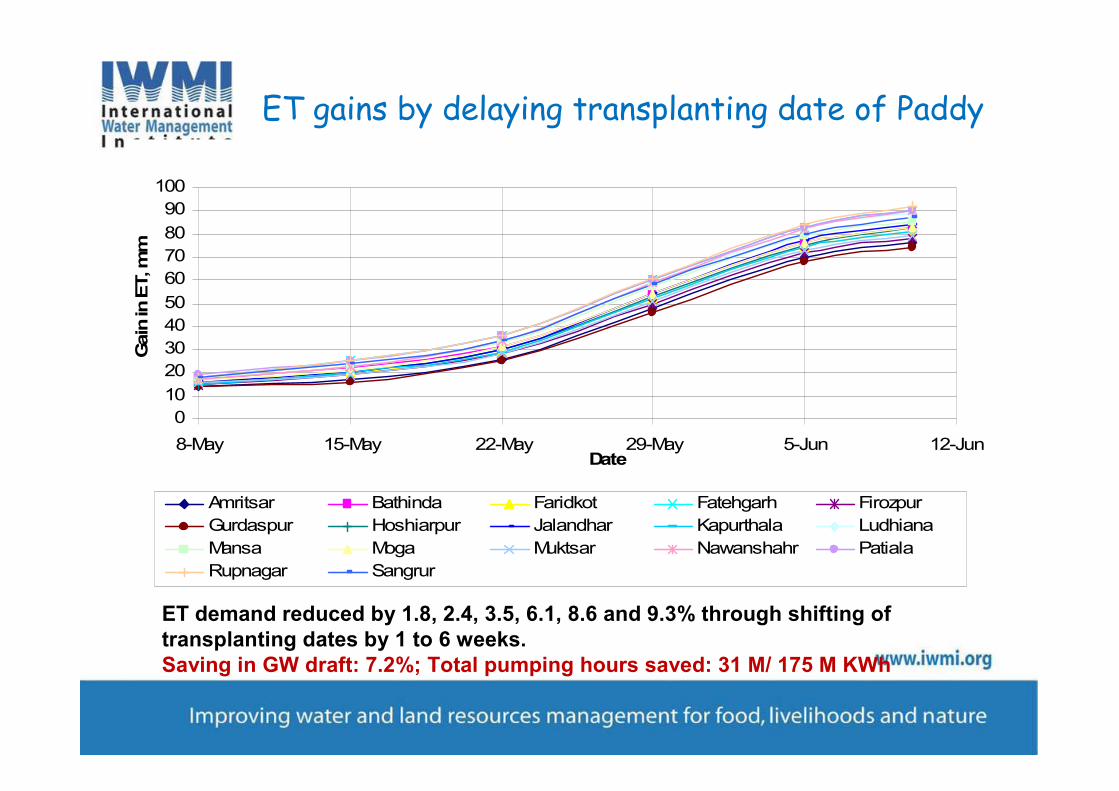
8-May 15-May 22-May 29-May 5-Jun 12-Jun
Amritsar Bathinda Faridkot Fatehgarh Firozpur
Gurdaspur Hoshiarpur Jalandhar Kapurthala Ludhiana
Mansa Moga Muktsar Nawanshahr Patiala
Rupnagar Sangrur
Date
Gain
in E
T, m
m
ET gains by delaying transplanting date of Paddy
ET demand reduced by 1.8, 2.4, 3.5, 6.1, 8.6 and 9.3% through shifting of transplanting dates by 1 to 6 weeks.Saving in GW draft: 7.2%; Total pumping hours saved: 31 M/ 175 M KWh
Outputs from Intervention Analysis
1. Identification and analysis of potential interventions for improving water productivity in the Indus- Gangetic basin: ( R singh, NS Raghuvanshi….et al)
2. Challenges and Prospects of Sustainable Groundwater Management in the Indus- Gangetic Basin: Review and Case Studies ( Bharat Sharma)
3. Improving water productivity in the Indus basin: A review of approaches and strategies: ( A S Qureshi, W Ahmad)
4. The Punjab Preservation of Subsoil Water Act (2009): Impact of a regulatory mechanism for saving water ( Bharat Sharma, G Ambili)
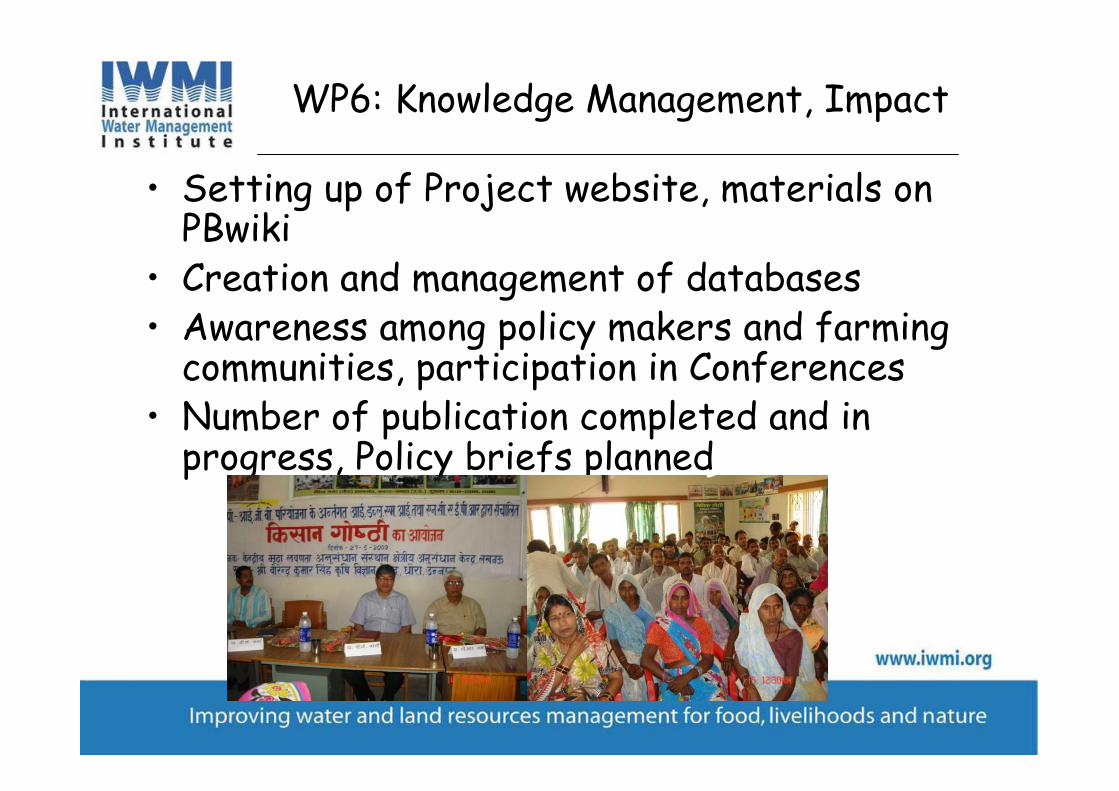
WP6: Knowledge Management, Impact
• Setting up of Project website, materials on PBwiki
• Creation and management of databases• Awareness among policy makers and farming communities, participation in Conferences
• Number of publication completed and in progress, Policy briefs planned
Summary: BFP IGB[.till date
• IGB is a complex basin with poverty and water gradients towards east and productivity towards west.
• Where water availability is not a constraint, poverty reduction is possible through improvements in land productivity.
• Where water availability is a constraint, increasing value of productivity per unit of water can reduce poverty.
• WP of wheat and rice is high in Indus but unsustainable; Ganges basin has both water, inputs and infrastructure constraints. Climate change shall have serious impacts for both basins and more so for Ganges due to higher vulnerability.
• There are attractive physical interventions which need to be up scaled with suitable policy and institutional support, water and energy policies are inter-related; innovative fisheries and integrated farming models has good potential for the poor eastern IGB.
NEED TO THINK AND PLAN FOR MUCH LARGER IMPACT THROUGH CONTINUED NEED TO THINK AND PLAN FOR MUCH LARGER IMPACT THROUGH CONTINUED NEED TO THINK AND PLAN FOR MUCH LARGER IMPACT THROUGH CONTINUED NEED TO THINK AND PLAN FOR MUCH LARGER IMPACT THROUGH CONTINUED ENGAGEMENT POSSIBLY THROUGH SECOND PHASE GANGES BASIN ENGAGEMENT POSSIBLY THROUGH SECOND PHASE GANGES BASIN ENGAGEMENT POSSIBLY THROUGH SECOND PHASE GANGES BASIN ENGAGEMENT POSSIBLY THROUGH SECOND PHASE GANGES BASIN PROJECT AND OTHER RELATED PROJECTS.PROJECT AND OTHER RELATED PROJECTS.PROJECT AND OTHER RELATED PROJECTS.PROJECT AND OTHER RELATED PROJECTS.