Embed Size (px)
Citation preview


Spotify Numbers
60 markets Over 30 million Songs100 million Active Users
(40 million Subscribers)
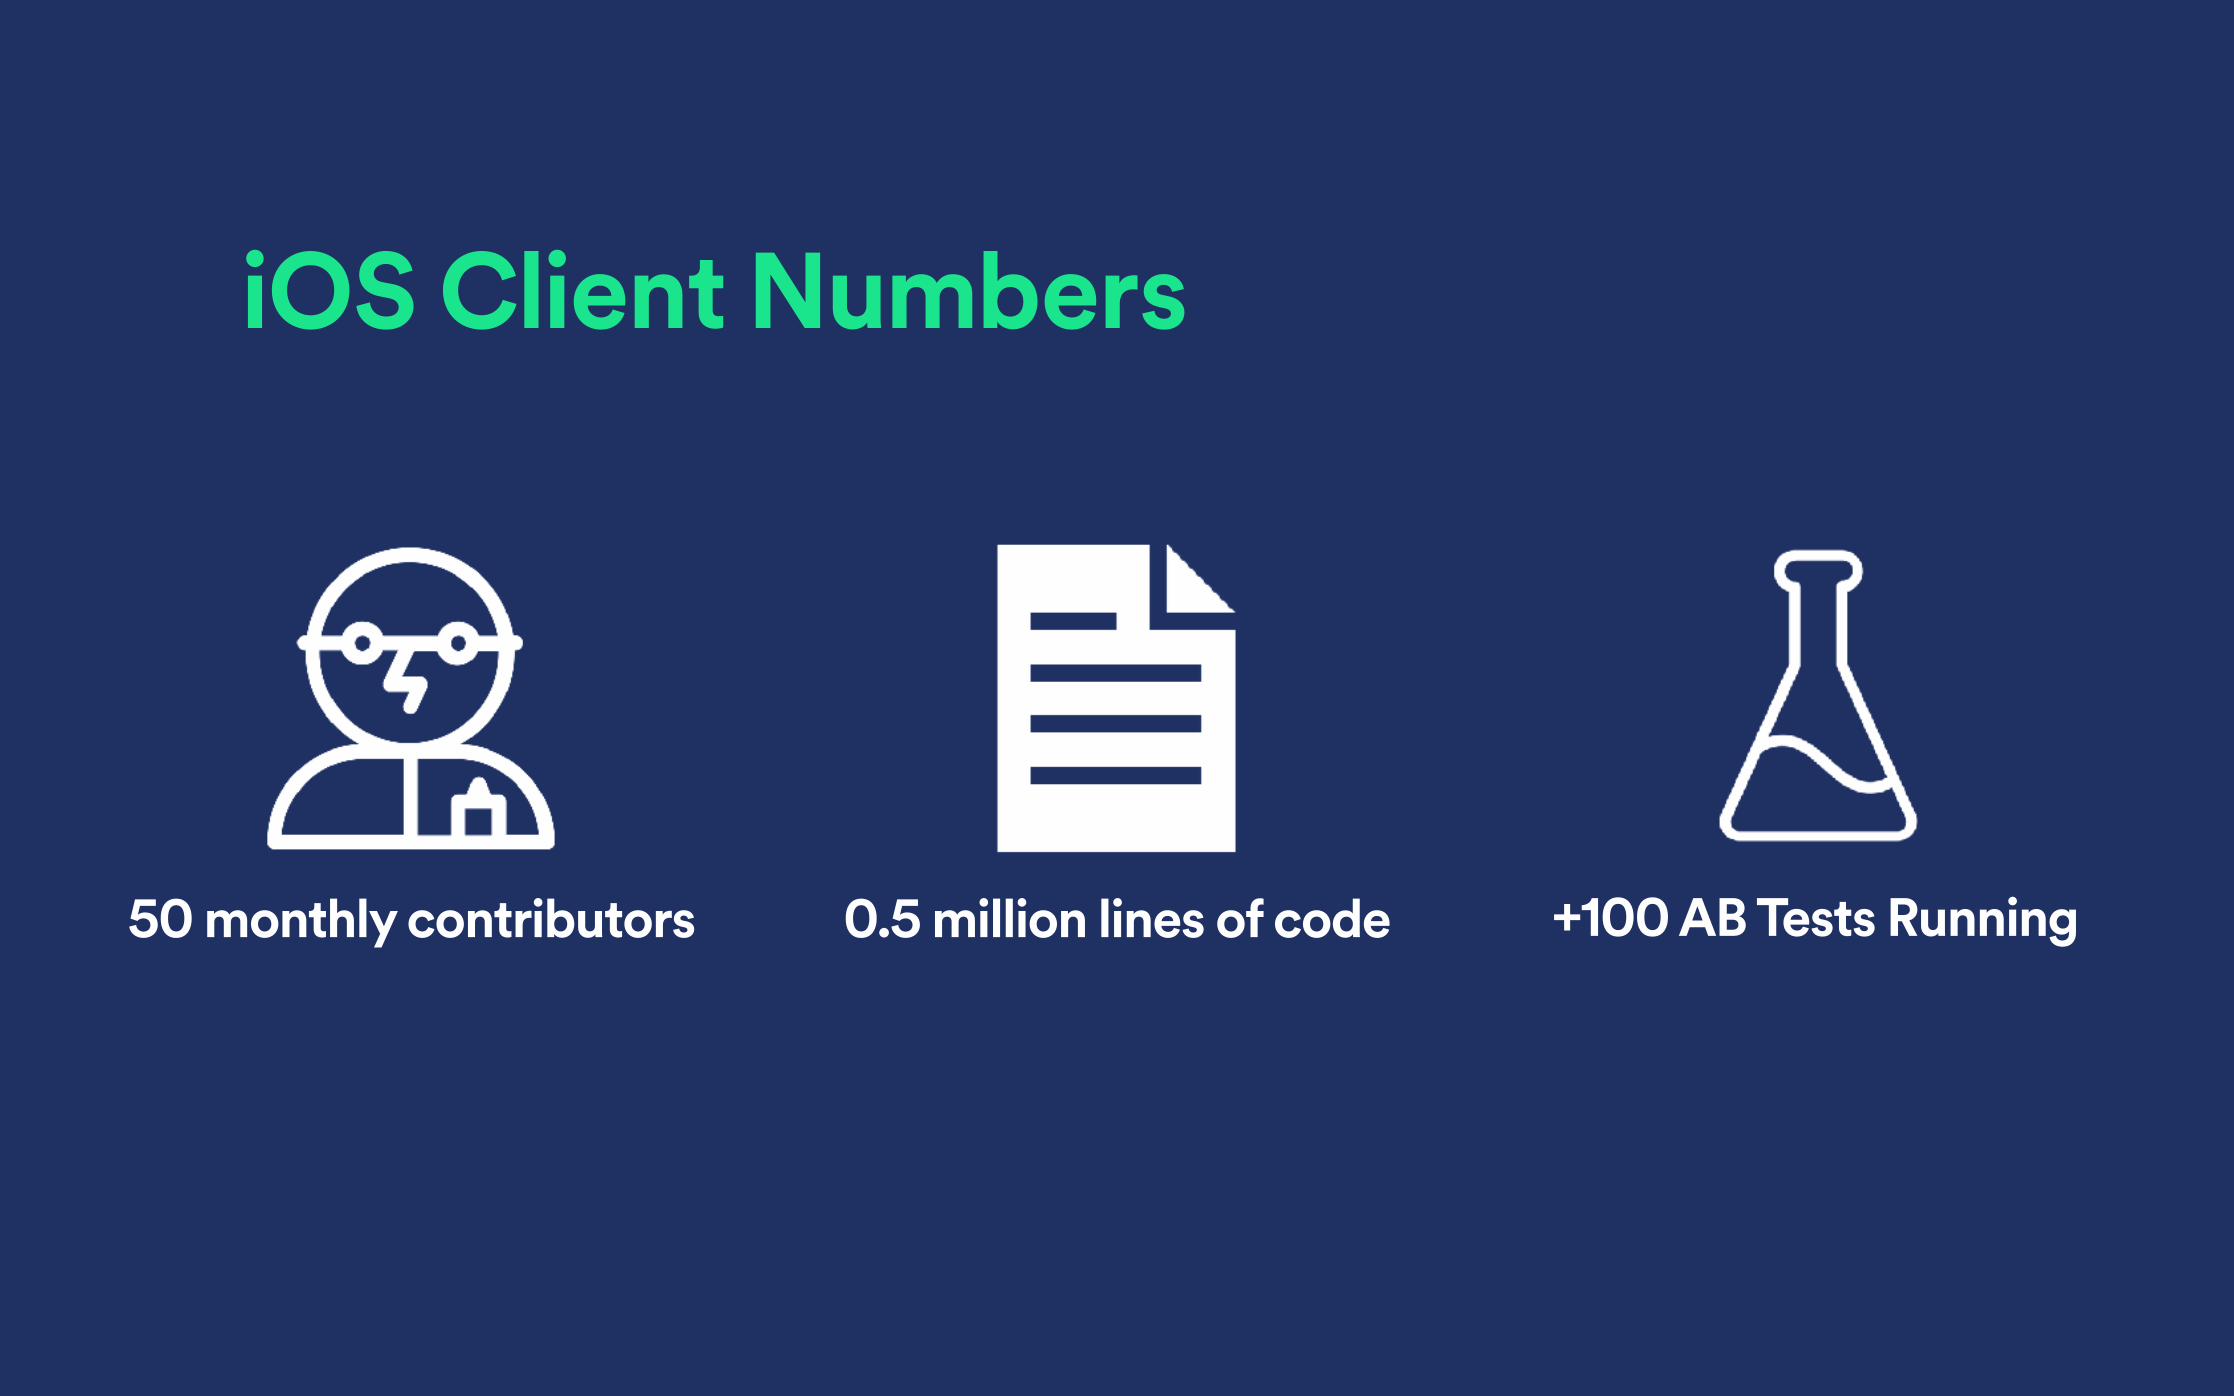
iOS Client Numbers
50 monthly contributors 0.5 million lines of code +100 AB Tests Running

Hector Zarate (@ChocoChipset)Software Engineer at Spotify
Boxun ZhangData Scientist at Spotify

1. What?

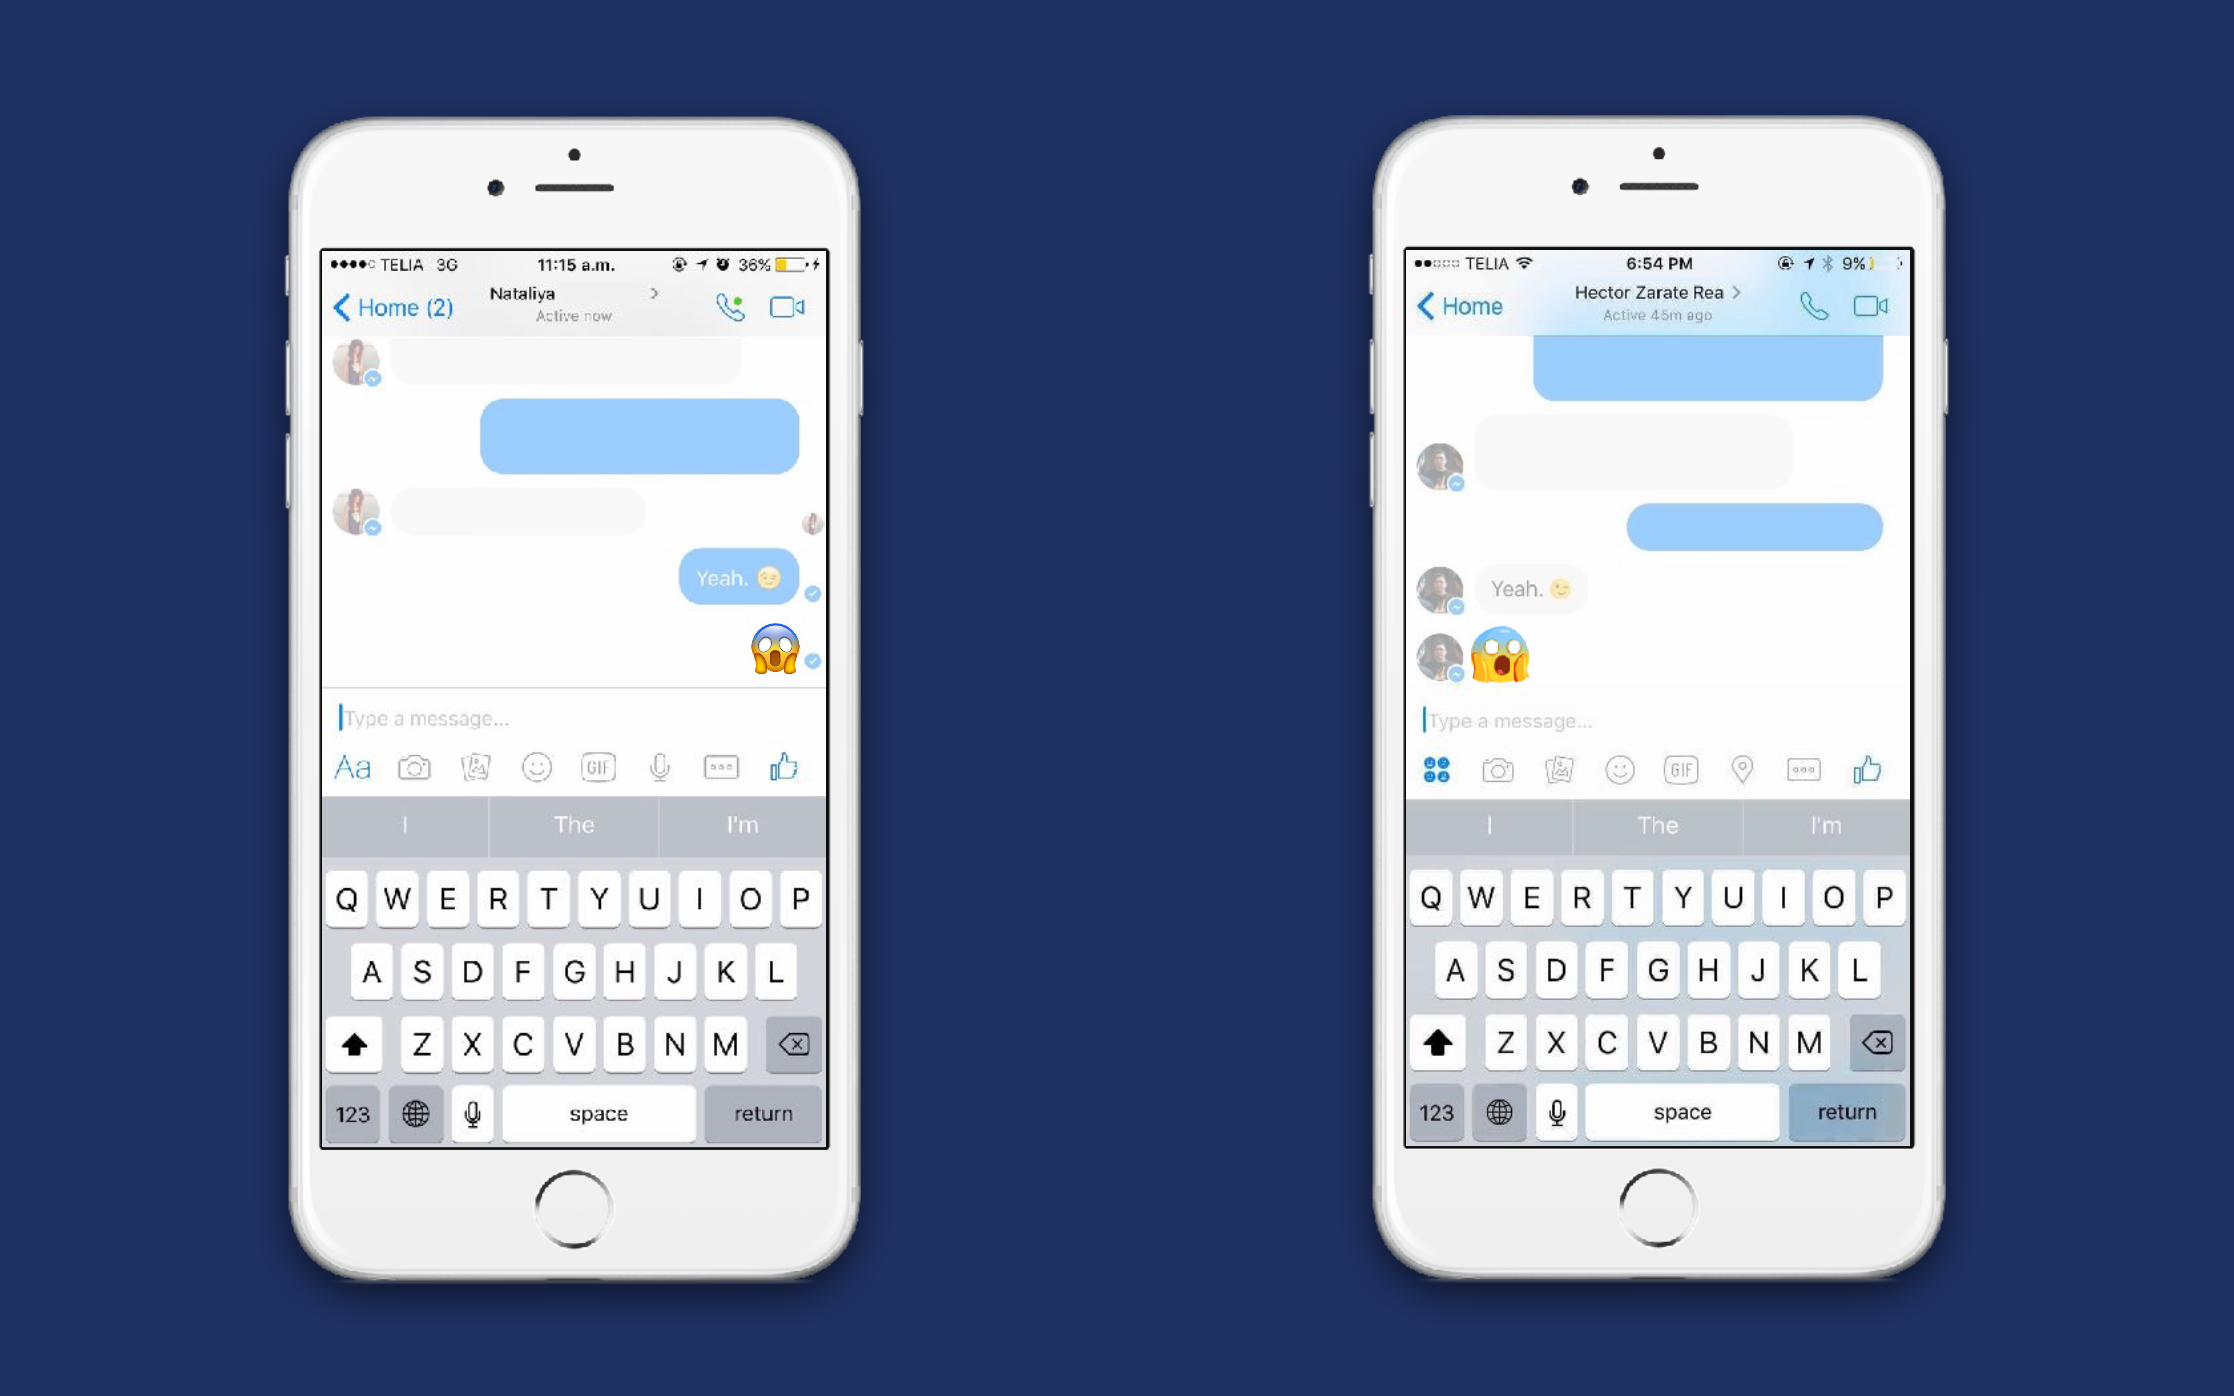
😱

😱

YOU ARE PART OF AN EXPERIMENT

AB Testing
YOU ARE PART OF AN EXPERIMENT

Samson, 3

Max, 30Samson, 3
+5% matches
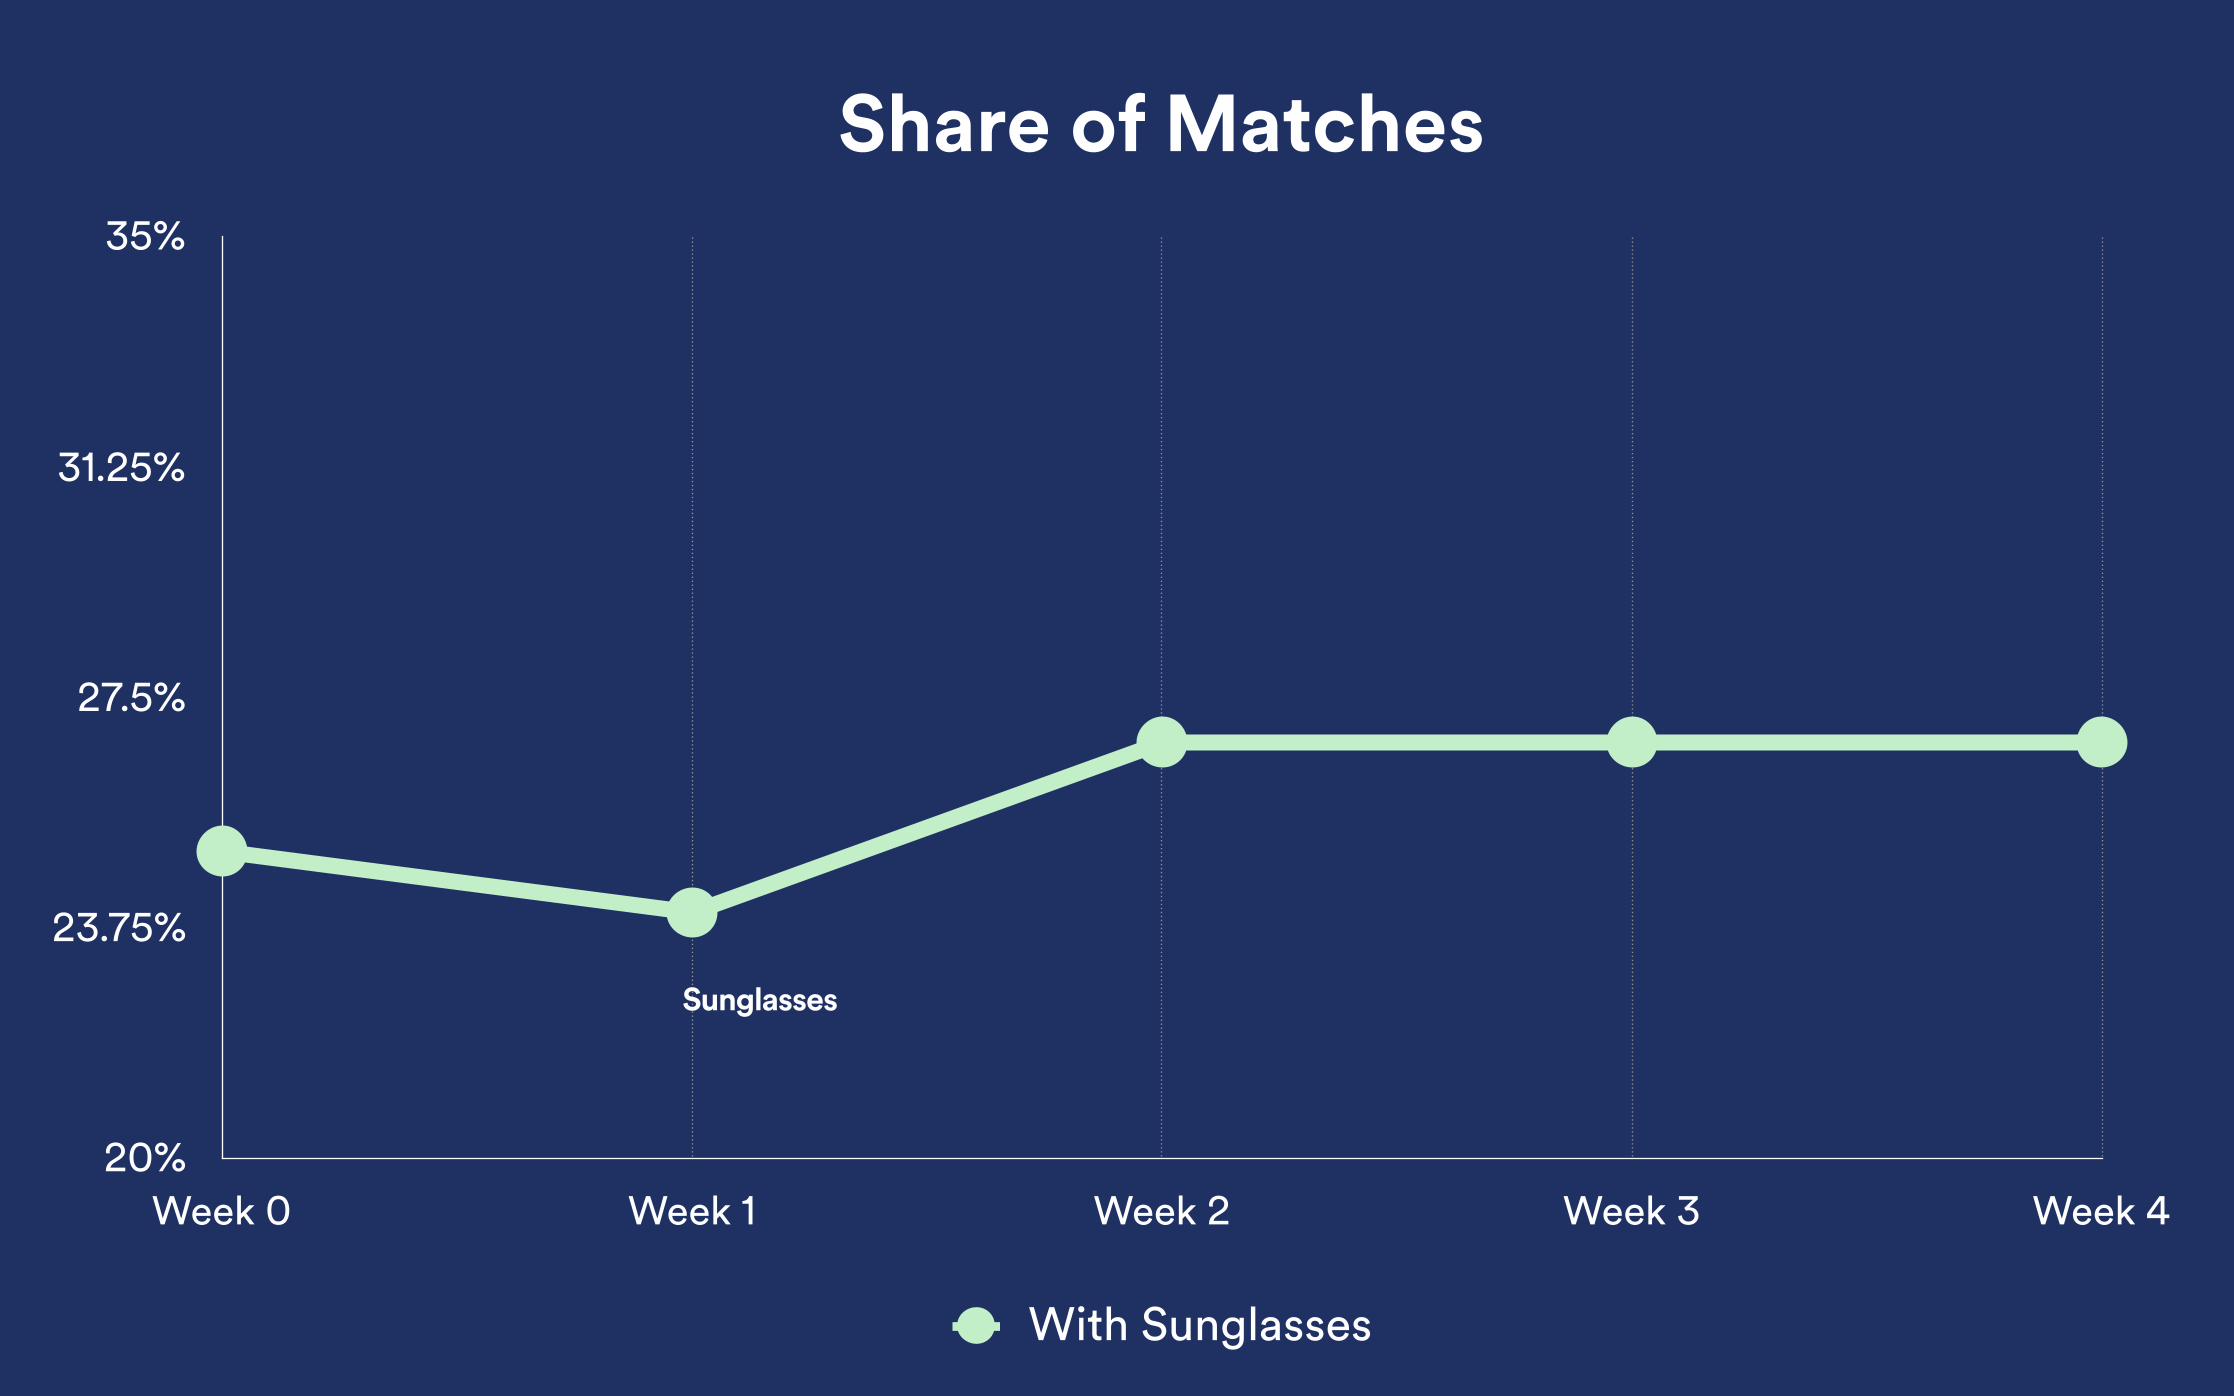
Share of Matches
20%
23.75%
27.5%
31.25%
35%
Week 0 Week 1 Week 2 Week 3 Week 4
With Sunglasses
Sunglasses

Share of Matches
20%
23.75%
27.5%
31.25%
35%
Week 0 Week 1 Week 2 Week 3 Week 4
With Sunglasses Control
Sunglasses

Share of Premium Conversion
20%
23.75%
27.5%
31.25%
35%
Week 0 Week 1 Week 2 Week 3 Week 4
Variation A Control
Sunglasses
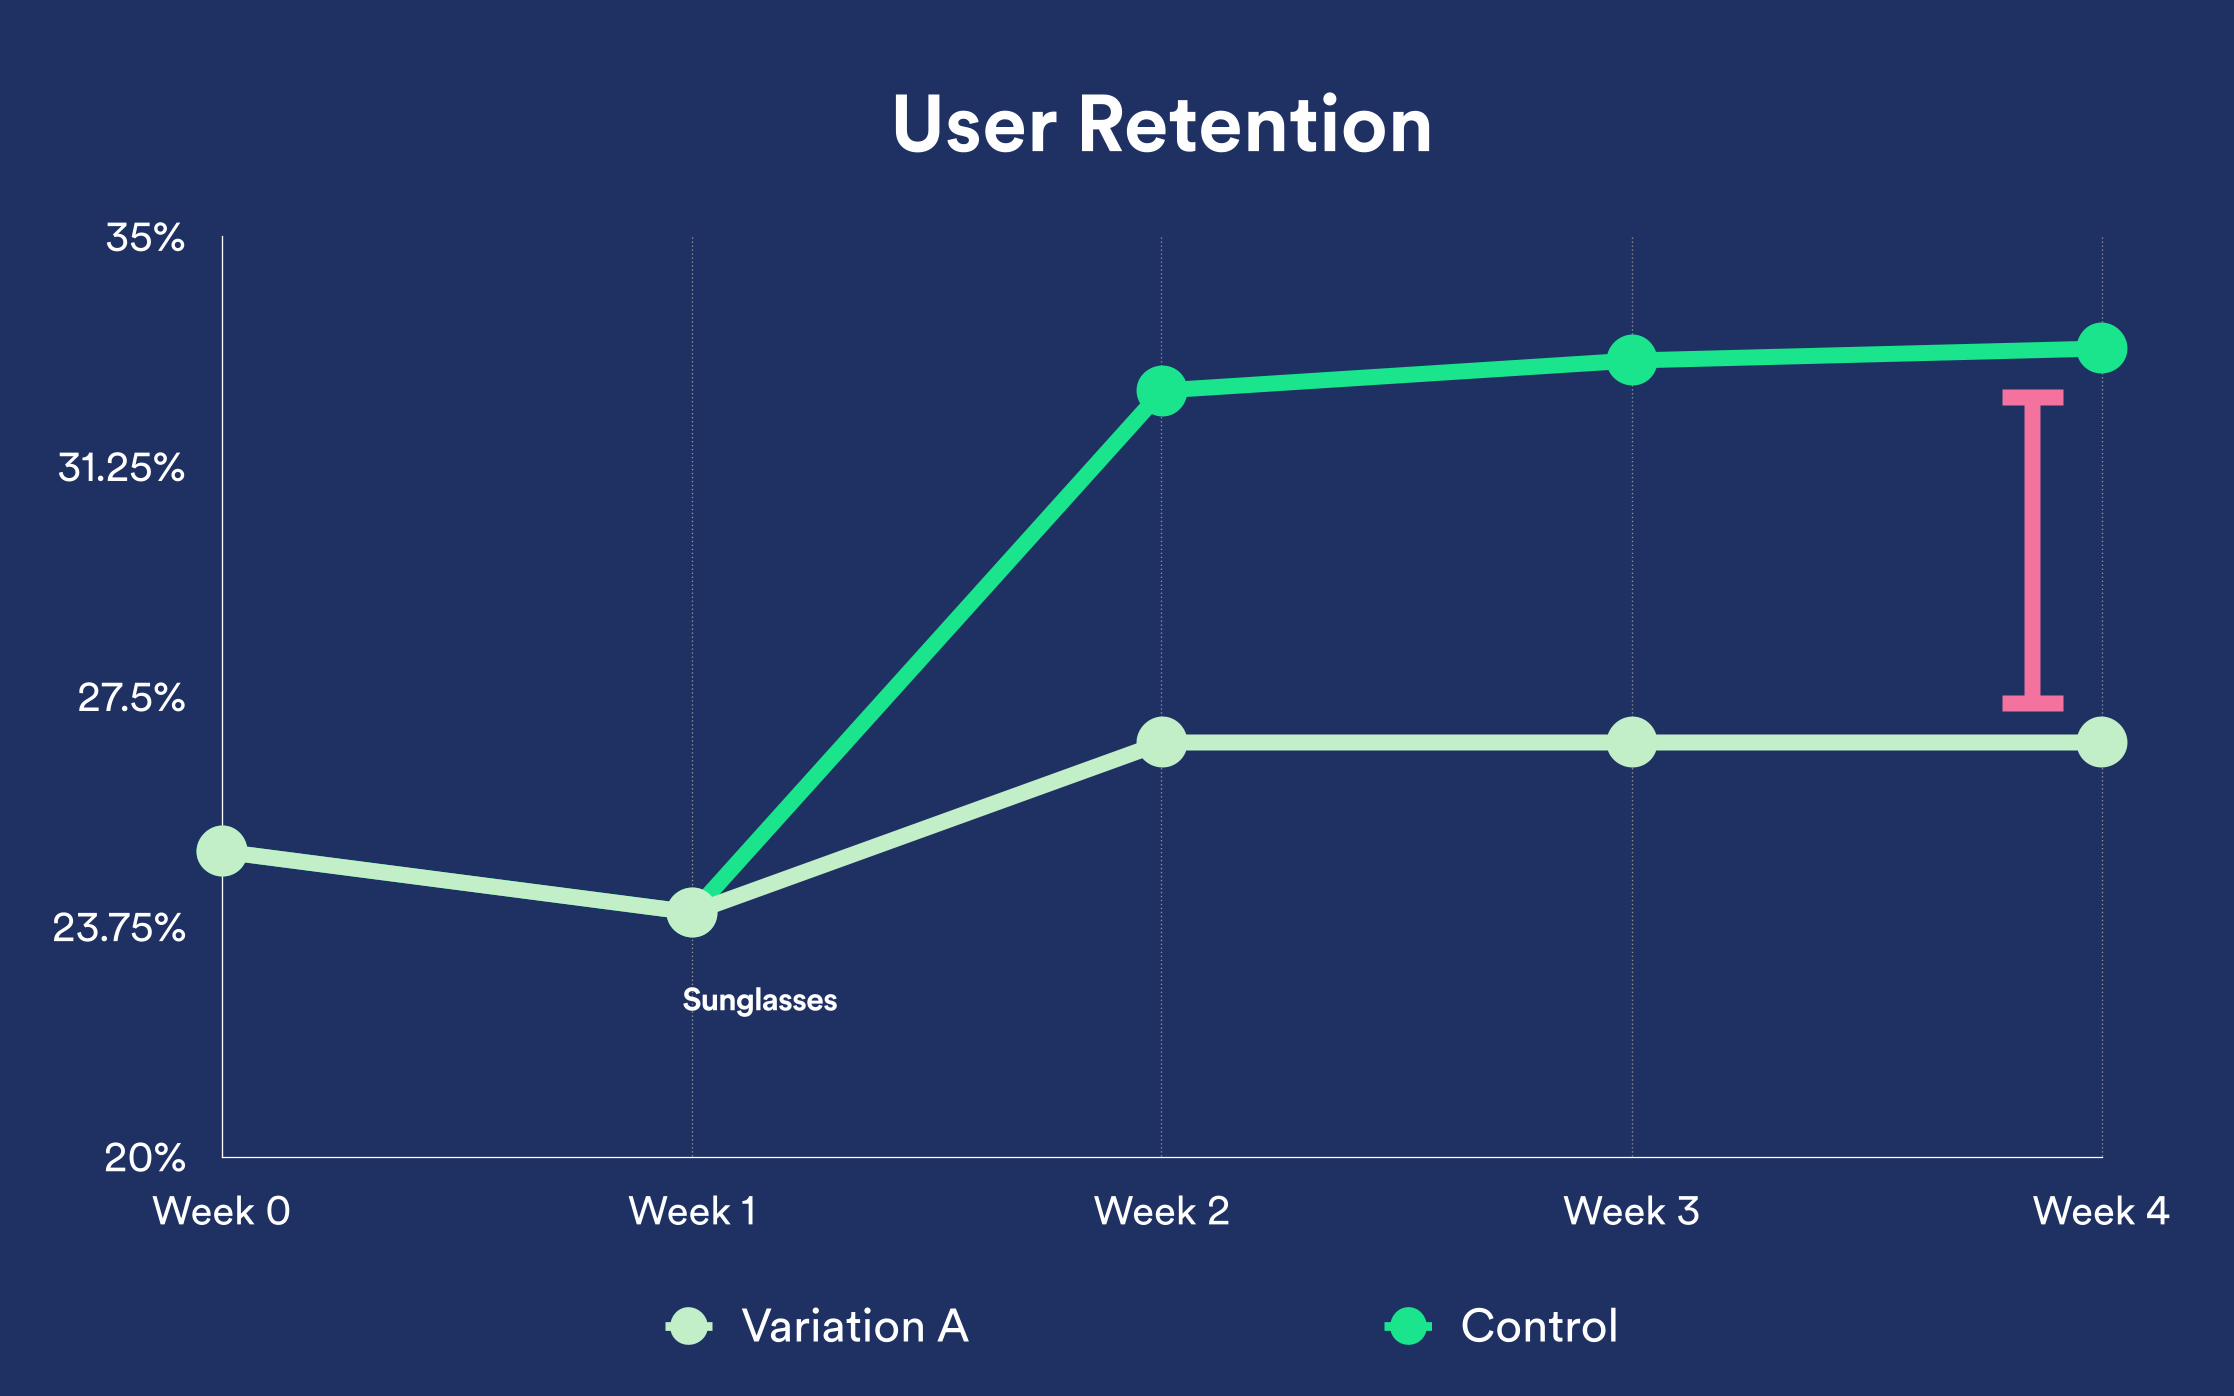
User Retention
20%
23.75%
27.5%
31.25%
35%
Week 0 Week 1 Week 2 Week 3 Week 4
Variation A Control
Sunglasses


spotify:user:chocochipset92b2976bb15d26c9008

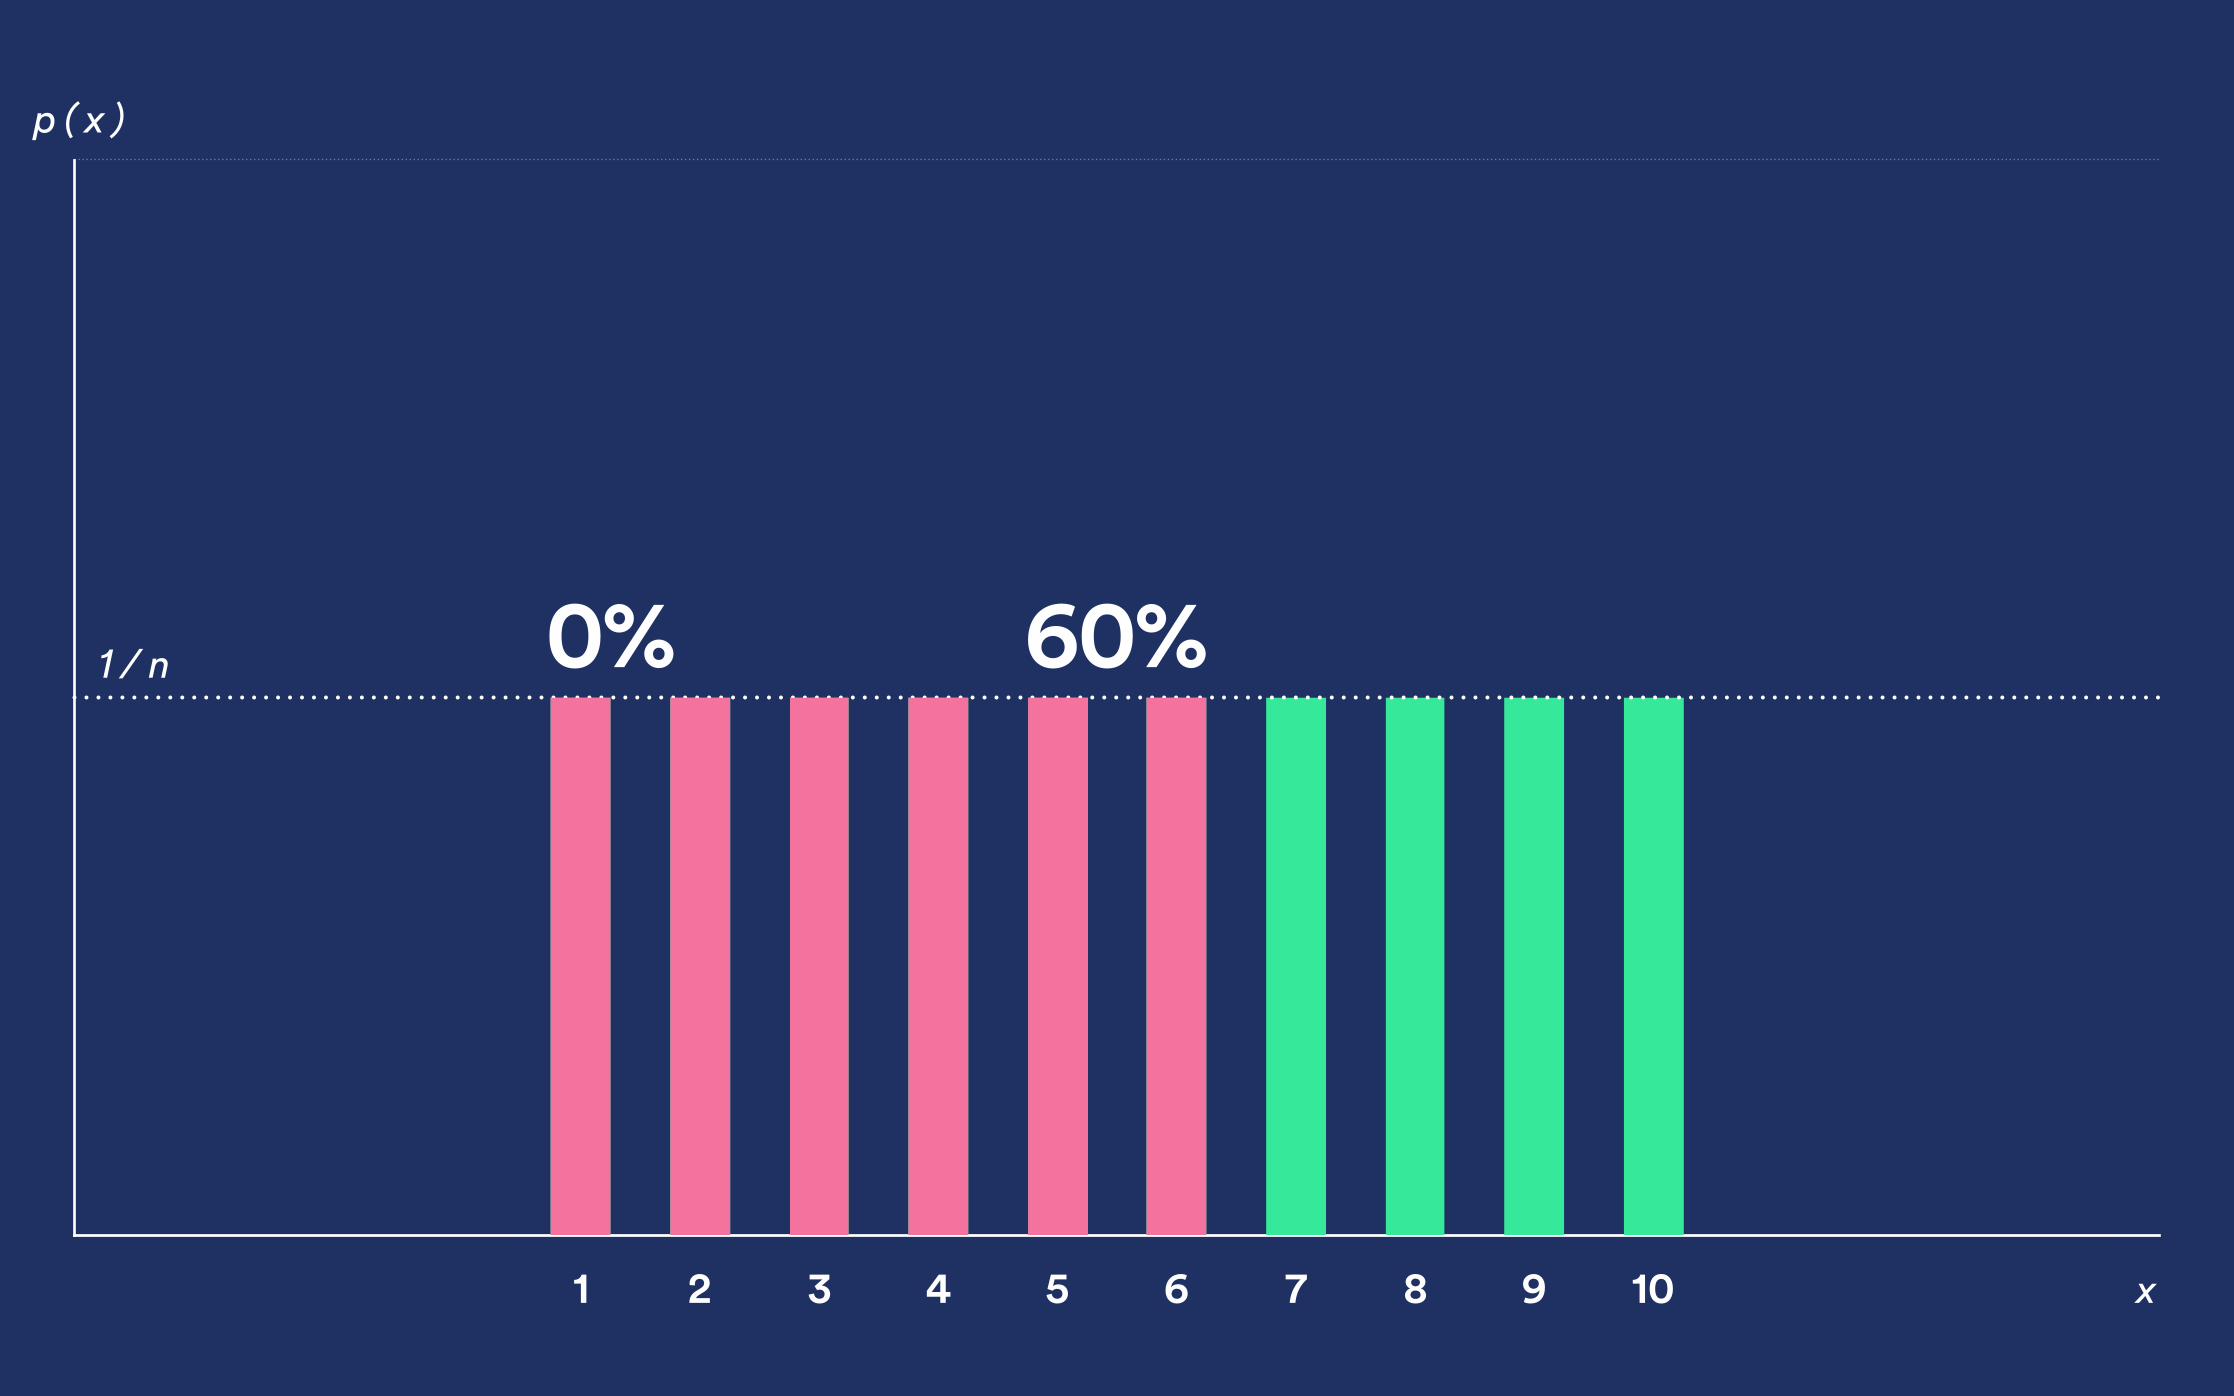
1 2 3 4 5 6 7 8 9 10
p ( x )
x
1 / n

1 2 3 4 5 6 7 8 9 10
p ( x )
x
1 / n
1 2 3 4 5 6 7 8 9 10
p ( x )
x
1 / n 0% 60%

Markets

Demographics

User Attributes
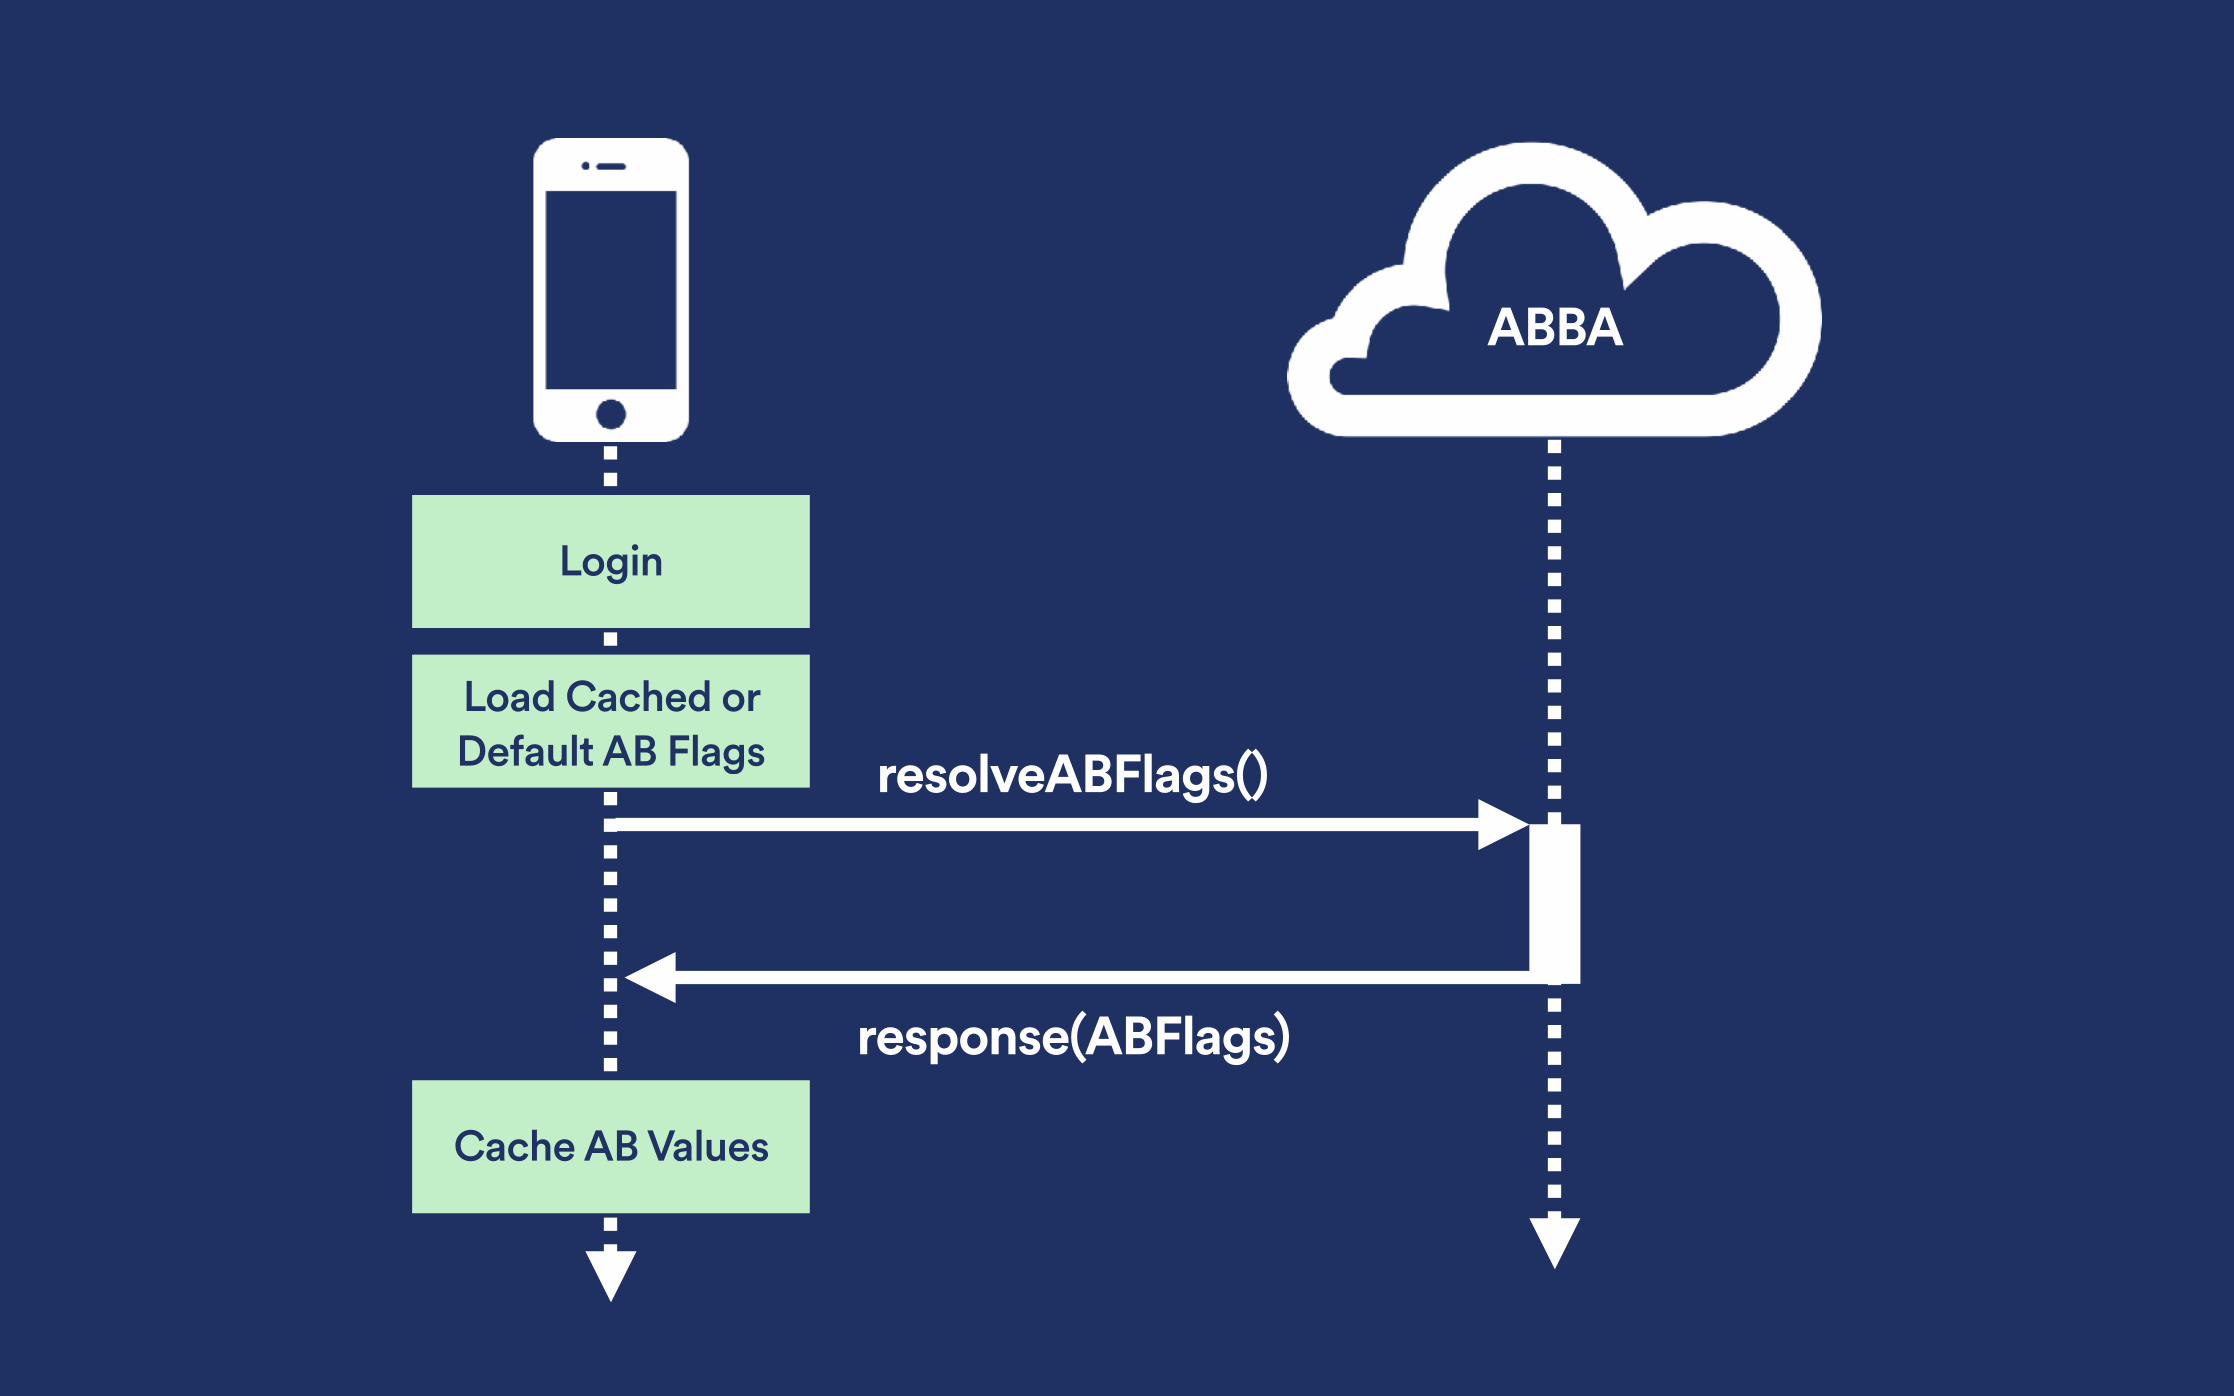
Login
resolveABFlags()
response(ABFlags)
ABBA
Cache AB Values
Load Cached or Default AB Flags

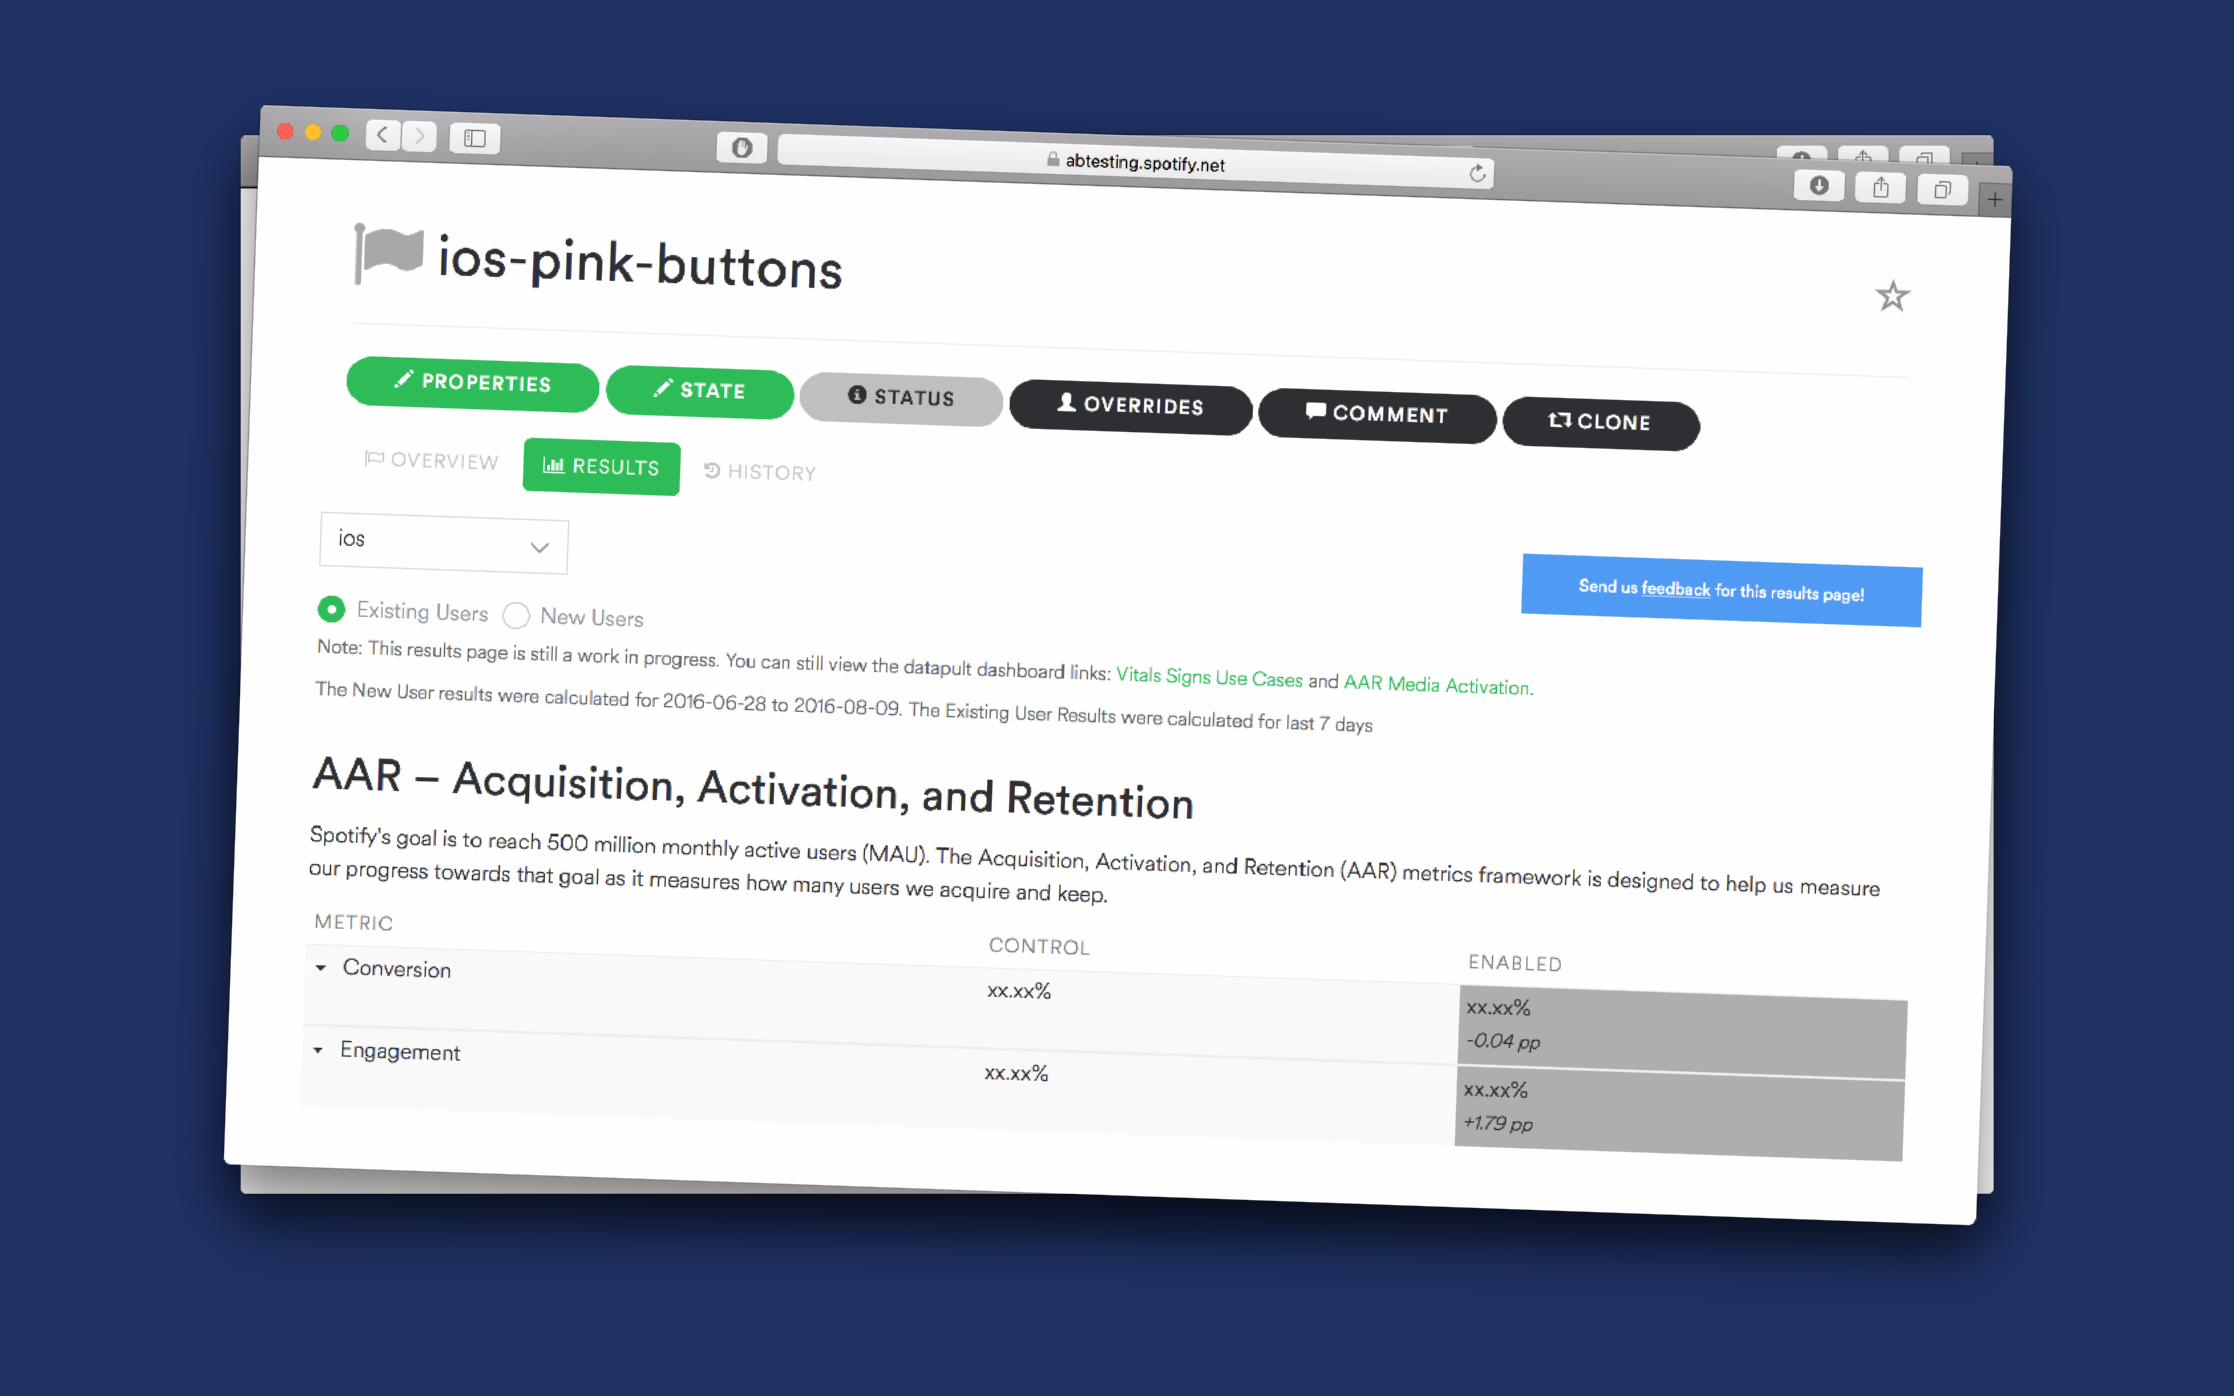
Example
button.color = [UIColor spotifyGreen];
BOOL isButtonPink = ([abFlags[@“pink-buttons"] isEqual:@"1"]); if (isButtonPink) {
// alternate path here: button.color = [UIColor spotifyPink];
}
Key Value
charts Enabled
pink-buttons 0
buffer-quality low
gallery-artist Control

Key Value
charts Enabled
pink-buttons 0
buffer-quality low
gallery-artist Control
Example
button.color = [UIColor spotifyGreen];
BOOL isButtonPink = ([abFlags[@“pink-buttons"] isEqual:@"1"]); if (isButtonPink) {
// alternate path here: button.color = [UIColor spotifyPink];
}
Key Value
charts Enabled
pink-buttons 1
buffer-quality low
gallery-artist Control
pink-button 1
Variation A Control
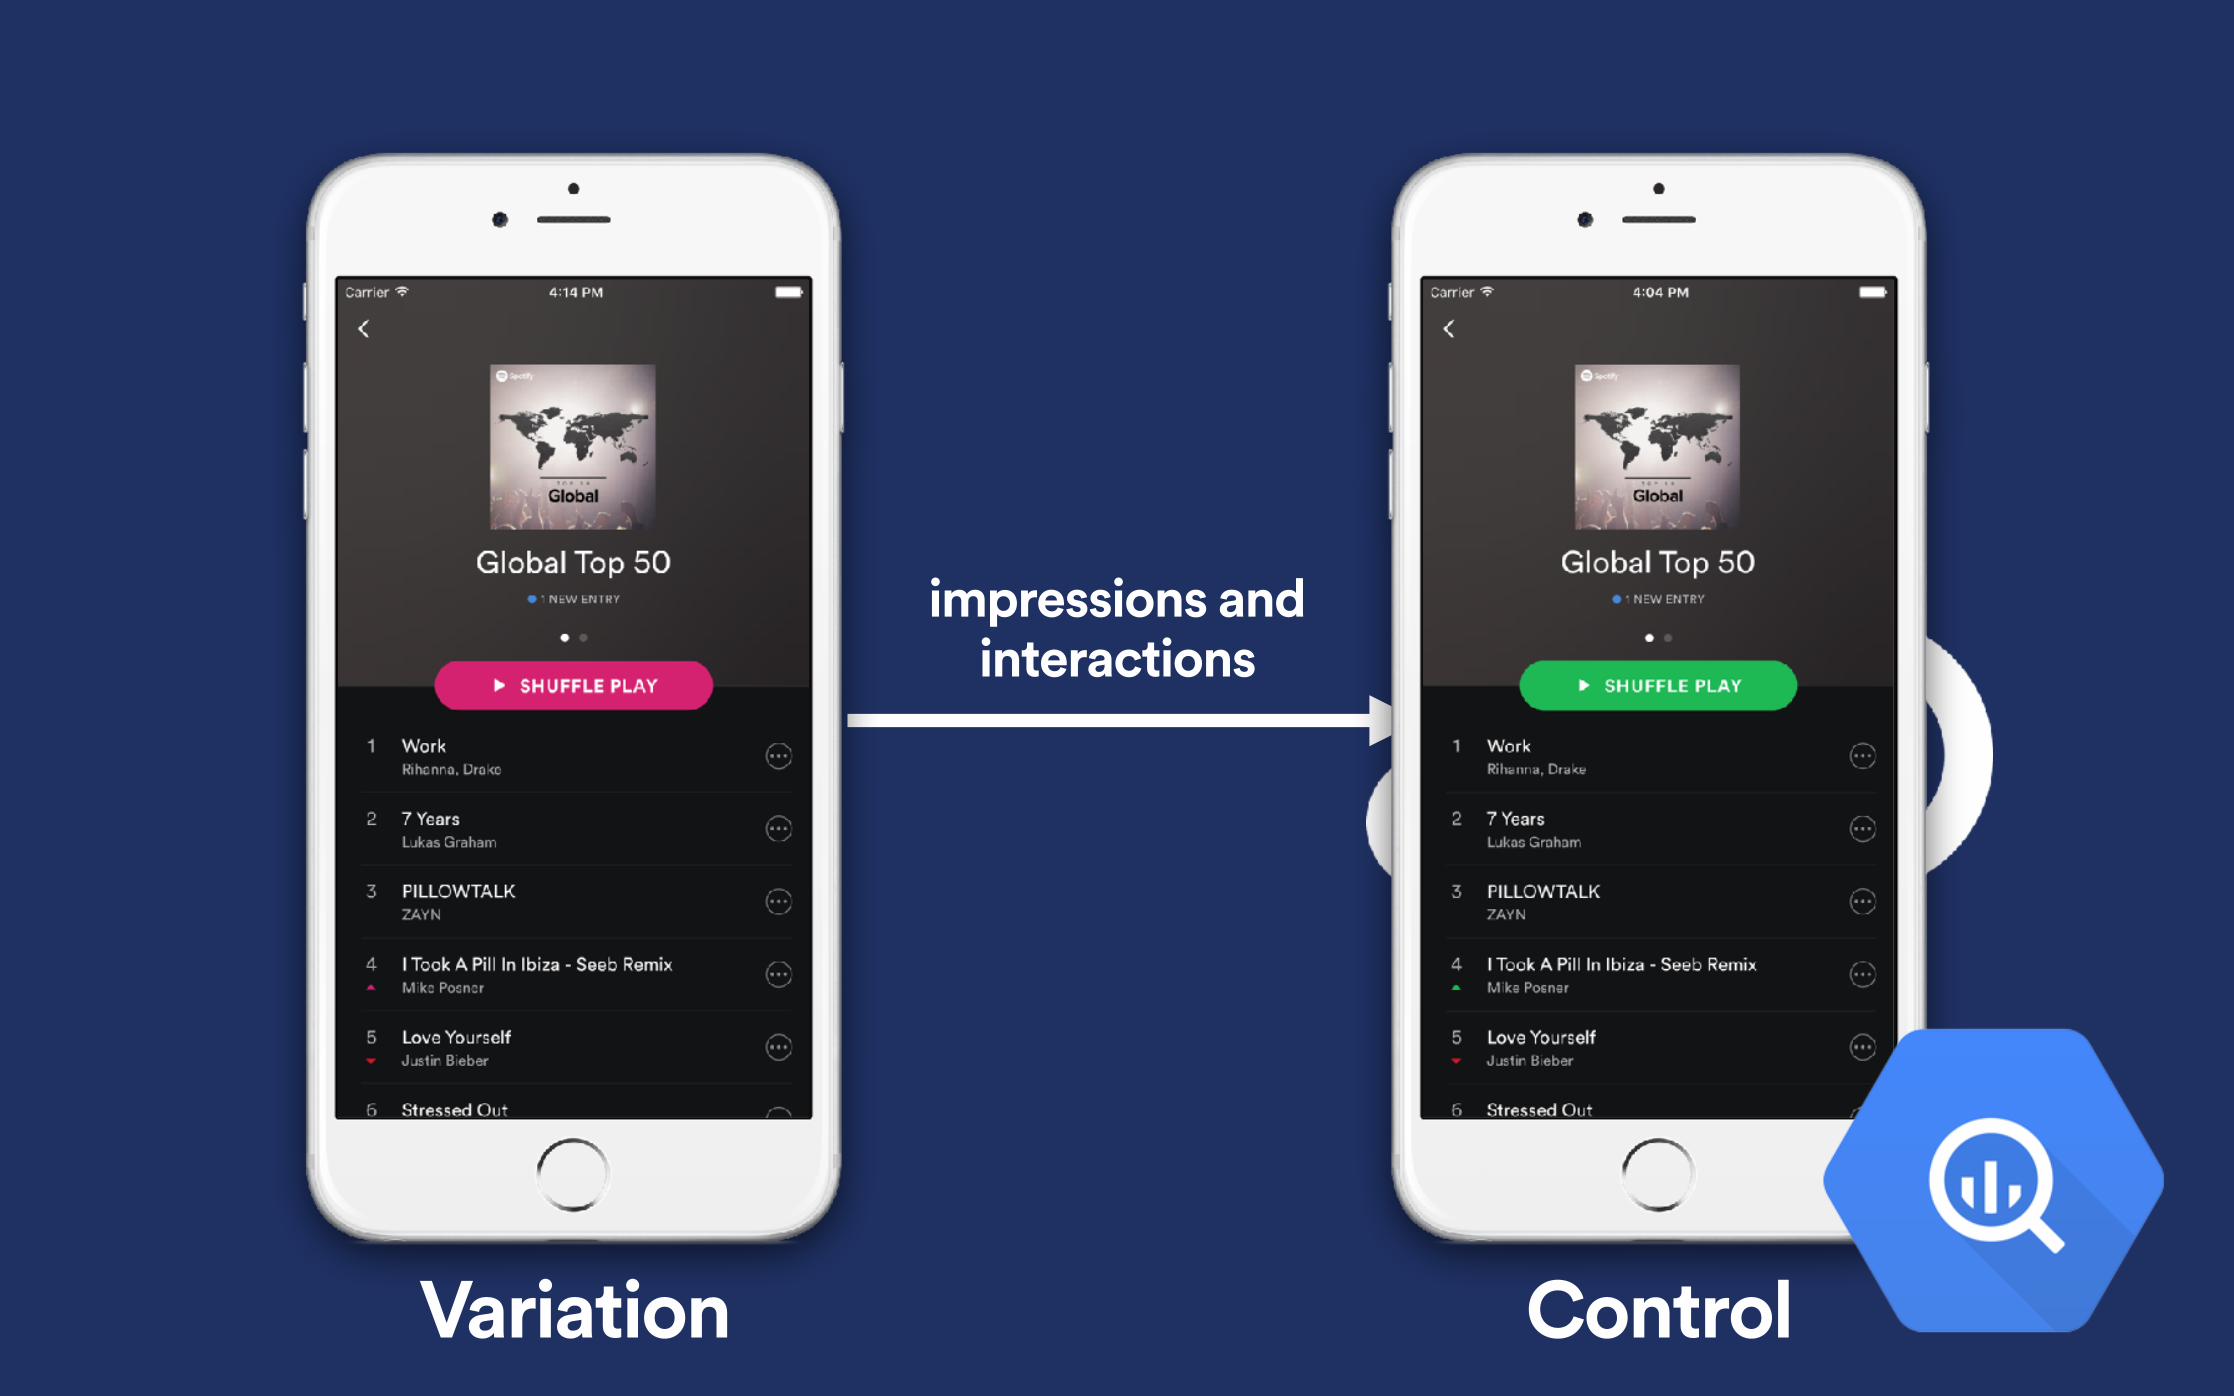
Analytics
impressions and interactions
ControlVariation

* just a personal preference
2. How?

1. Hypothesis 2. Design 3. Run 4. Analysis
1. Formulate a Hypothesis

2. Design the Test

# shuffle
plays
2.1 Target Metrics
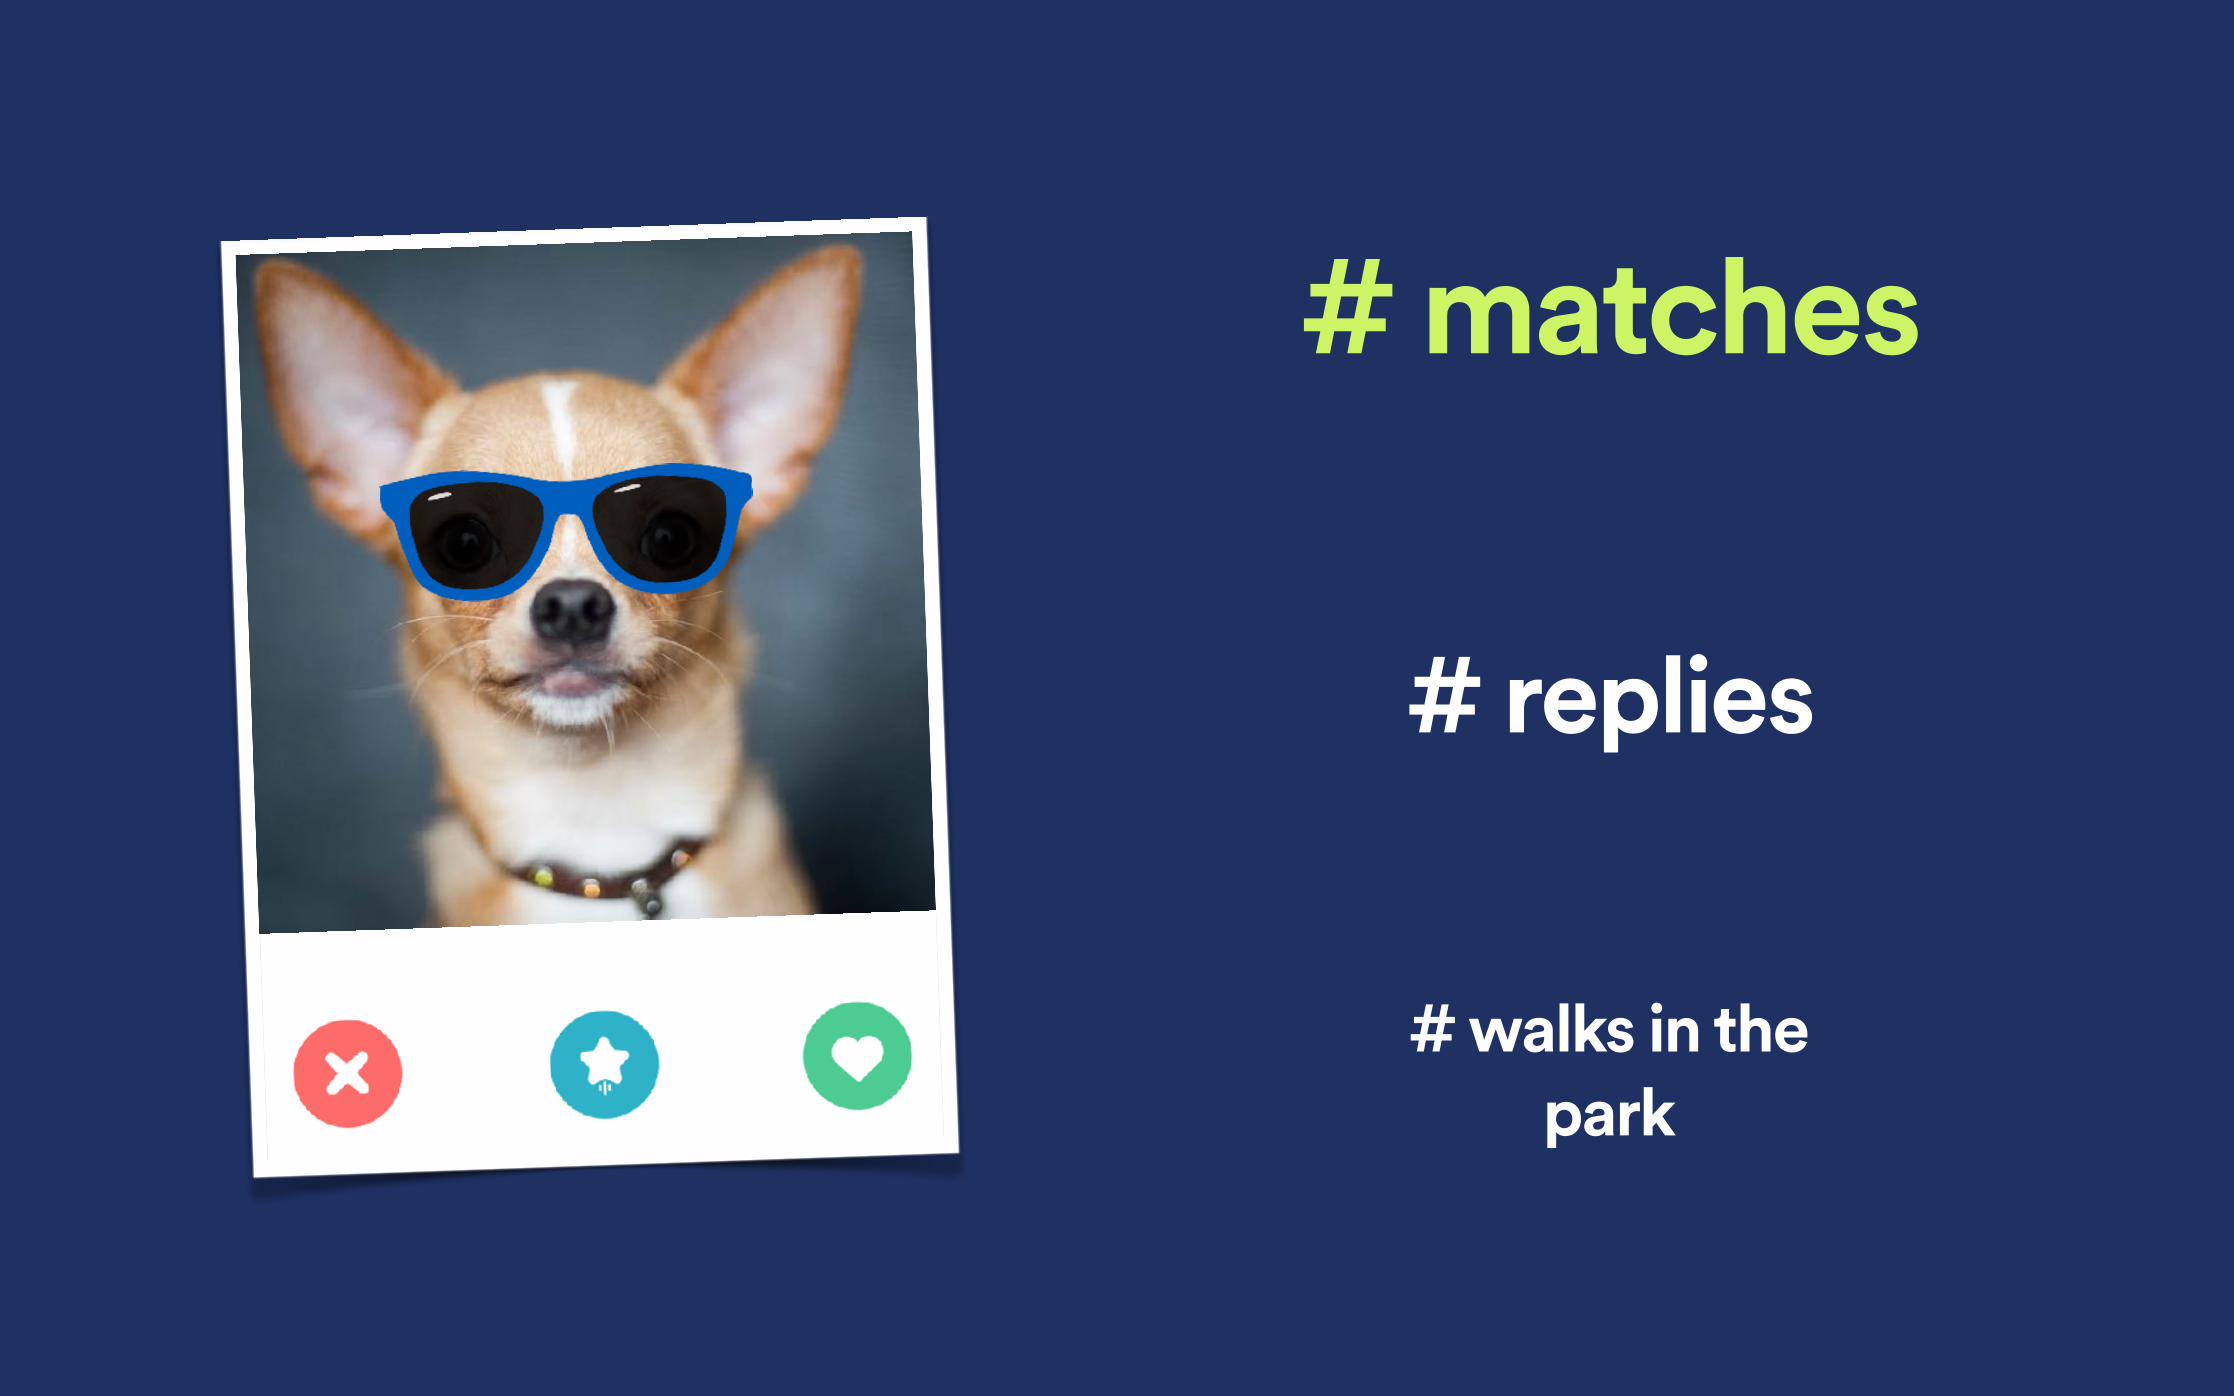
# matches
Samson, 3
# replies
# walks in the park
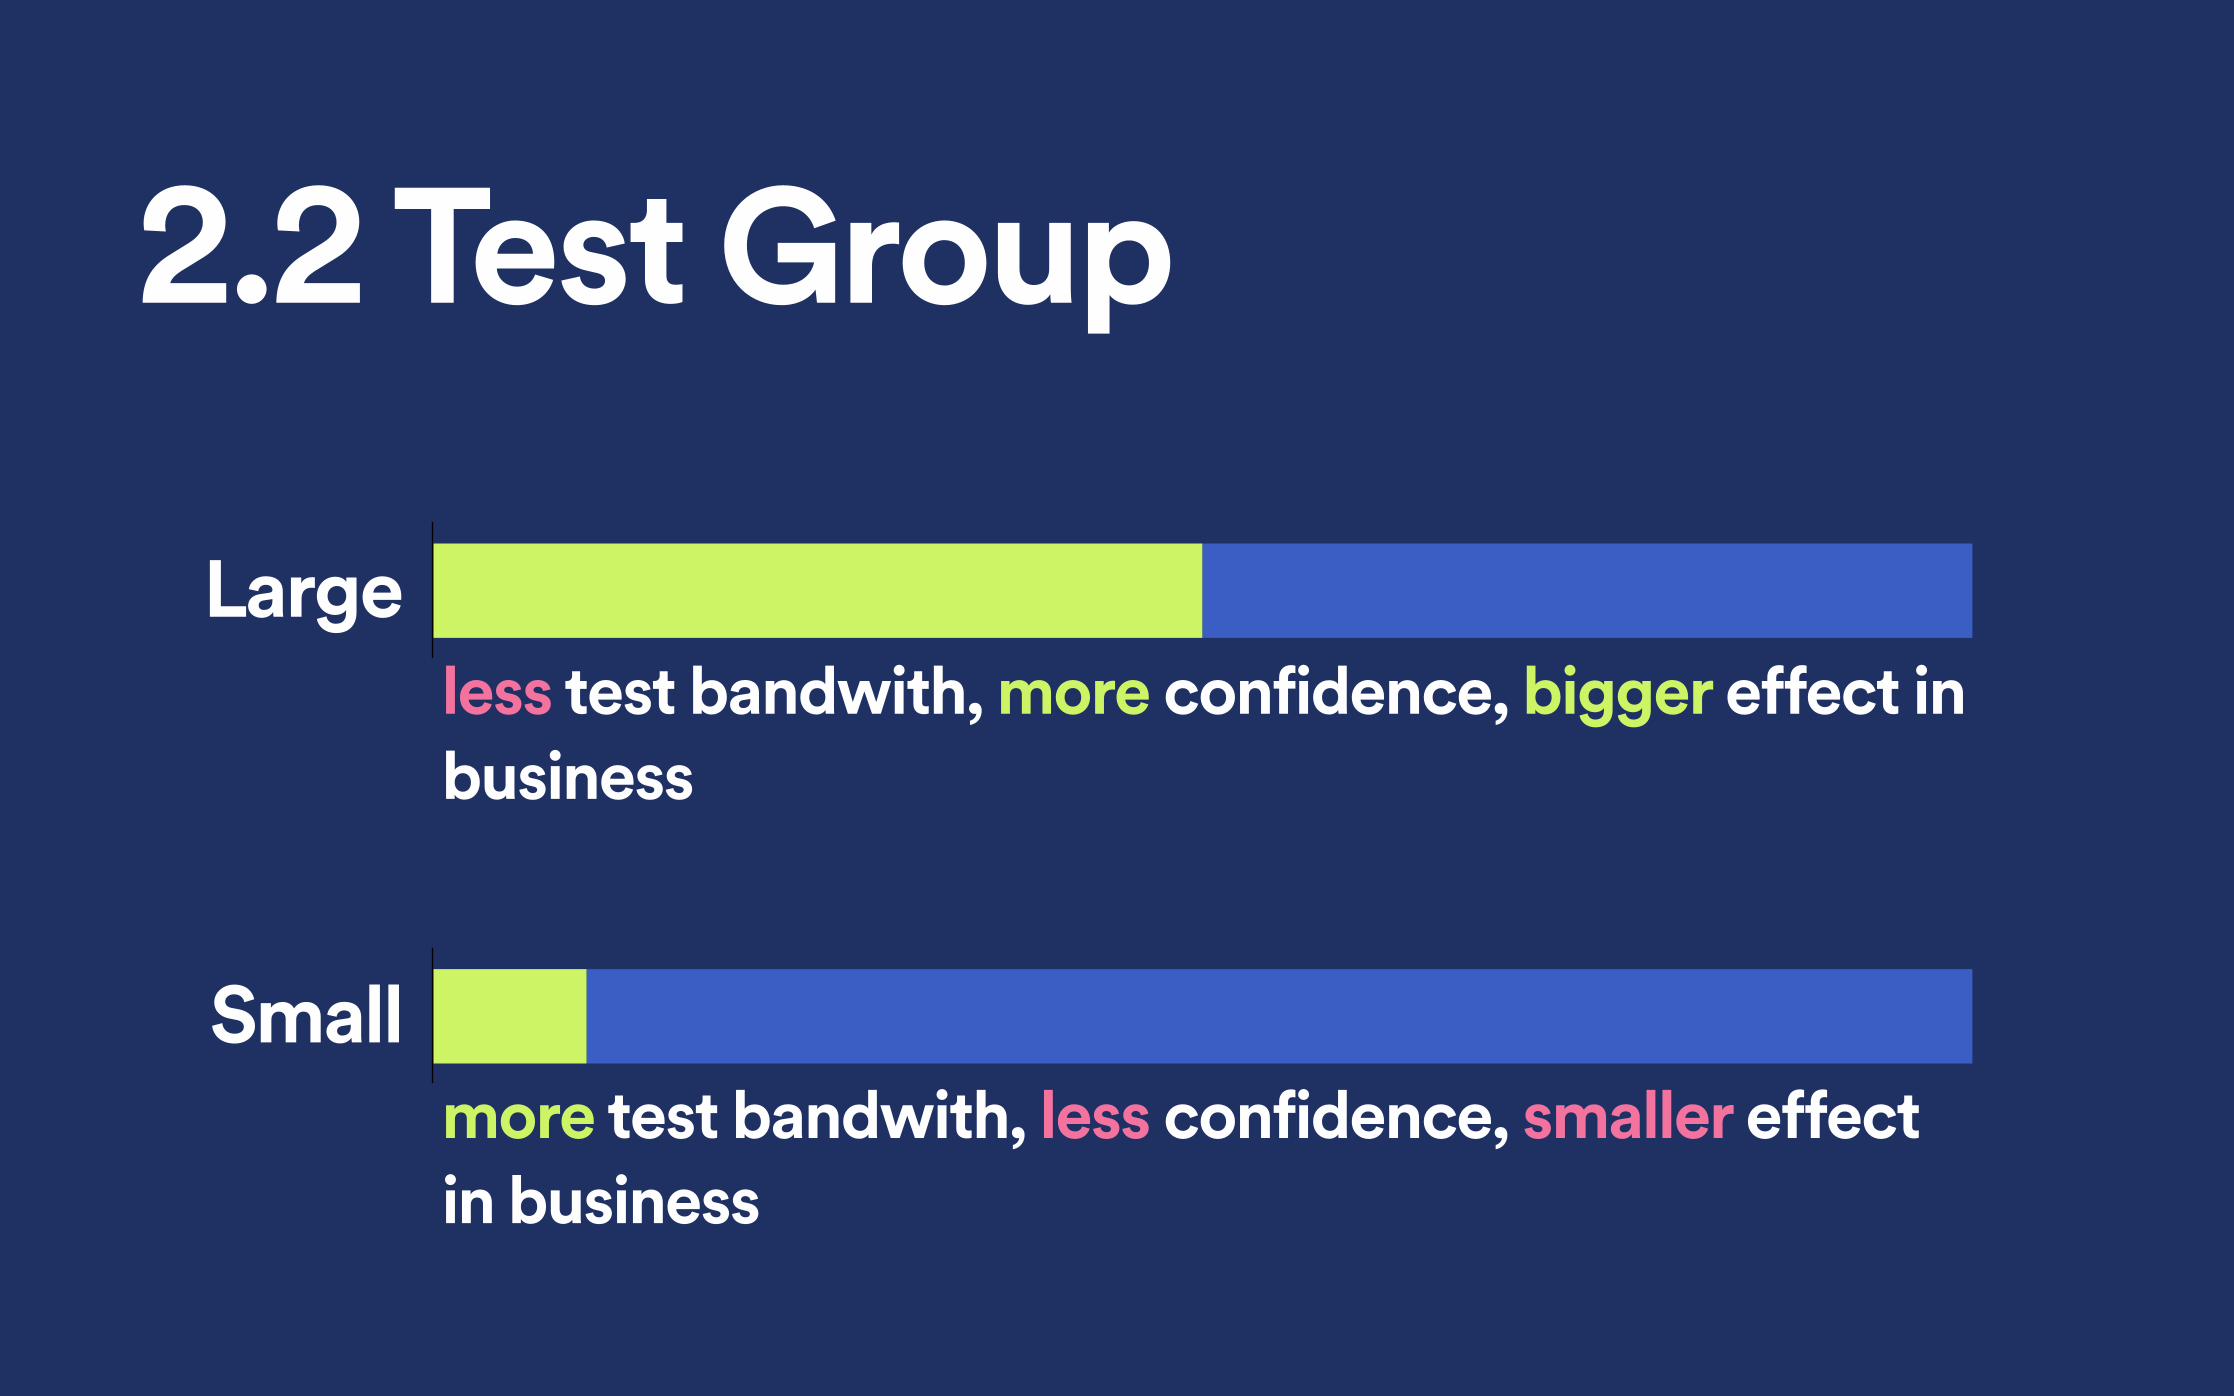
2.2 Test Group
more test bandwith, less confidence, smaller effect in business
less test bandwith, more confidence, bigger effect in business
Small
Large

2.3 Duration

Watch out for seasonality:i.e. Music habits are different on weekdays and weekends.
Purchasing habits are different near paydays.

3. Run the test
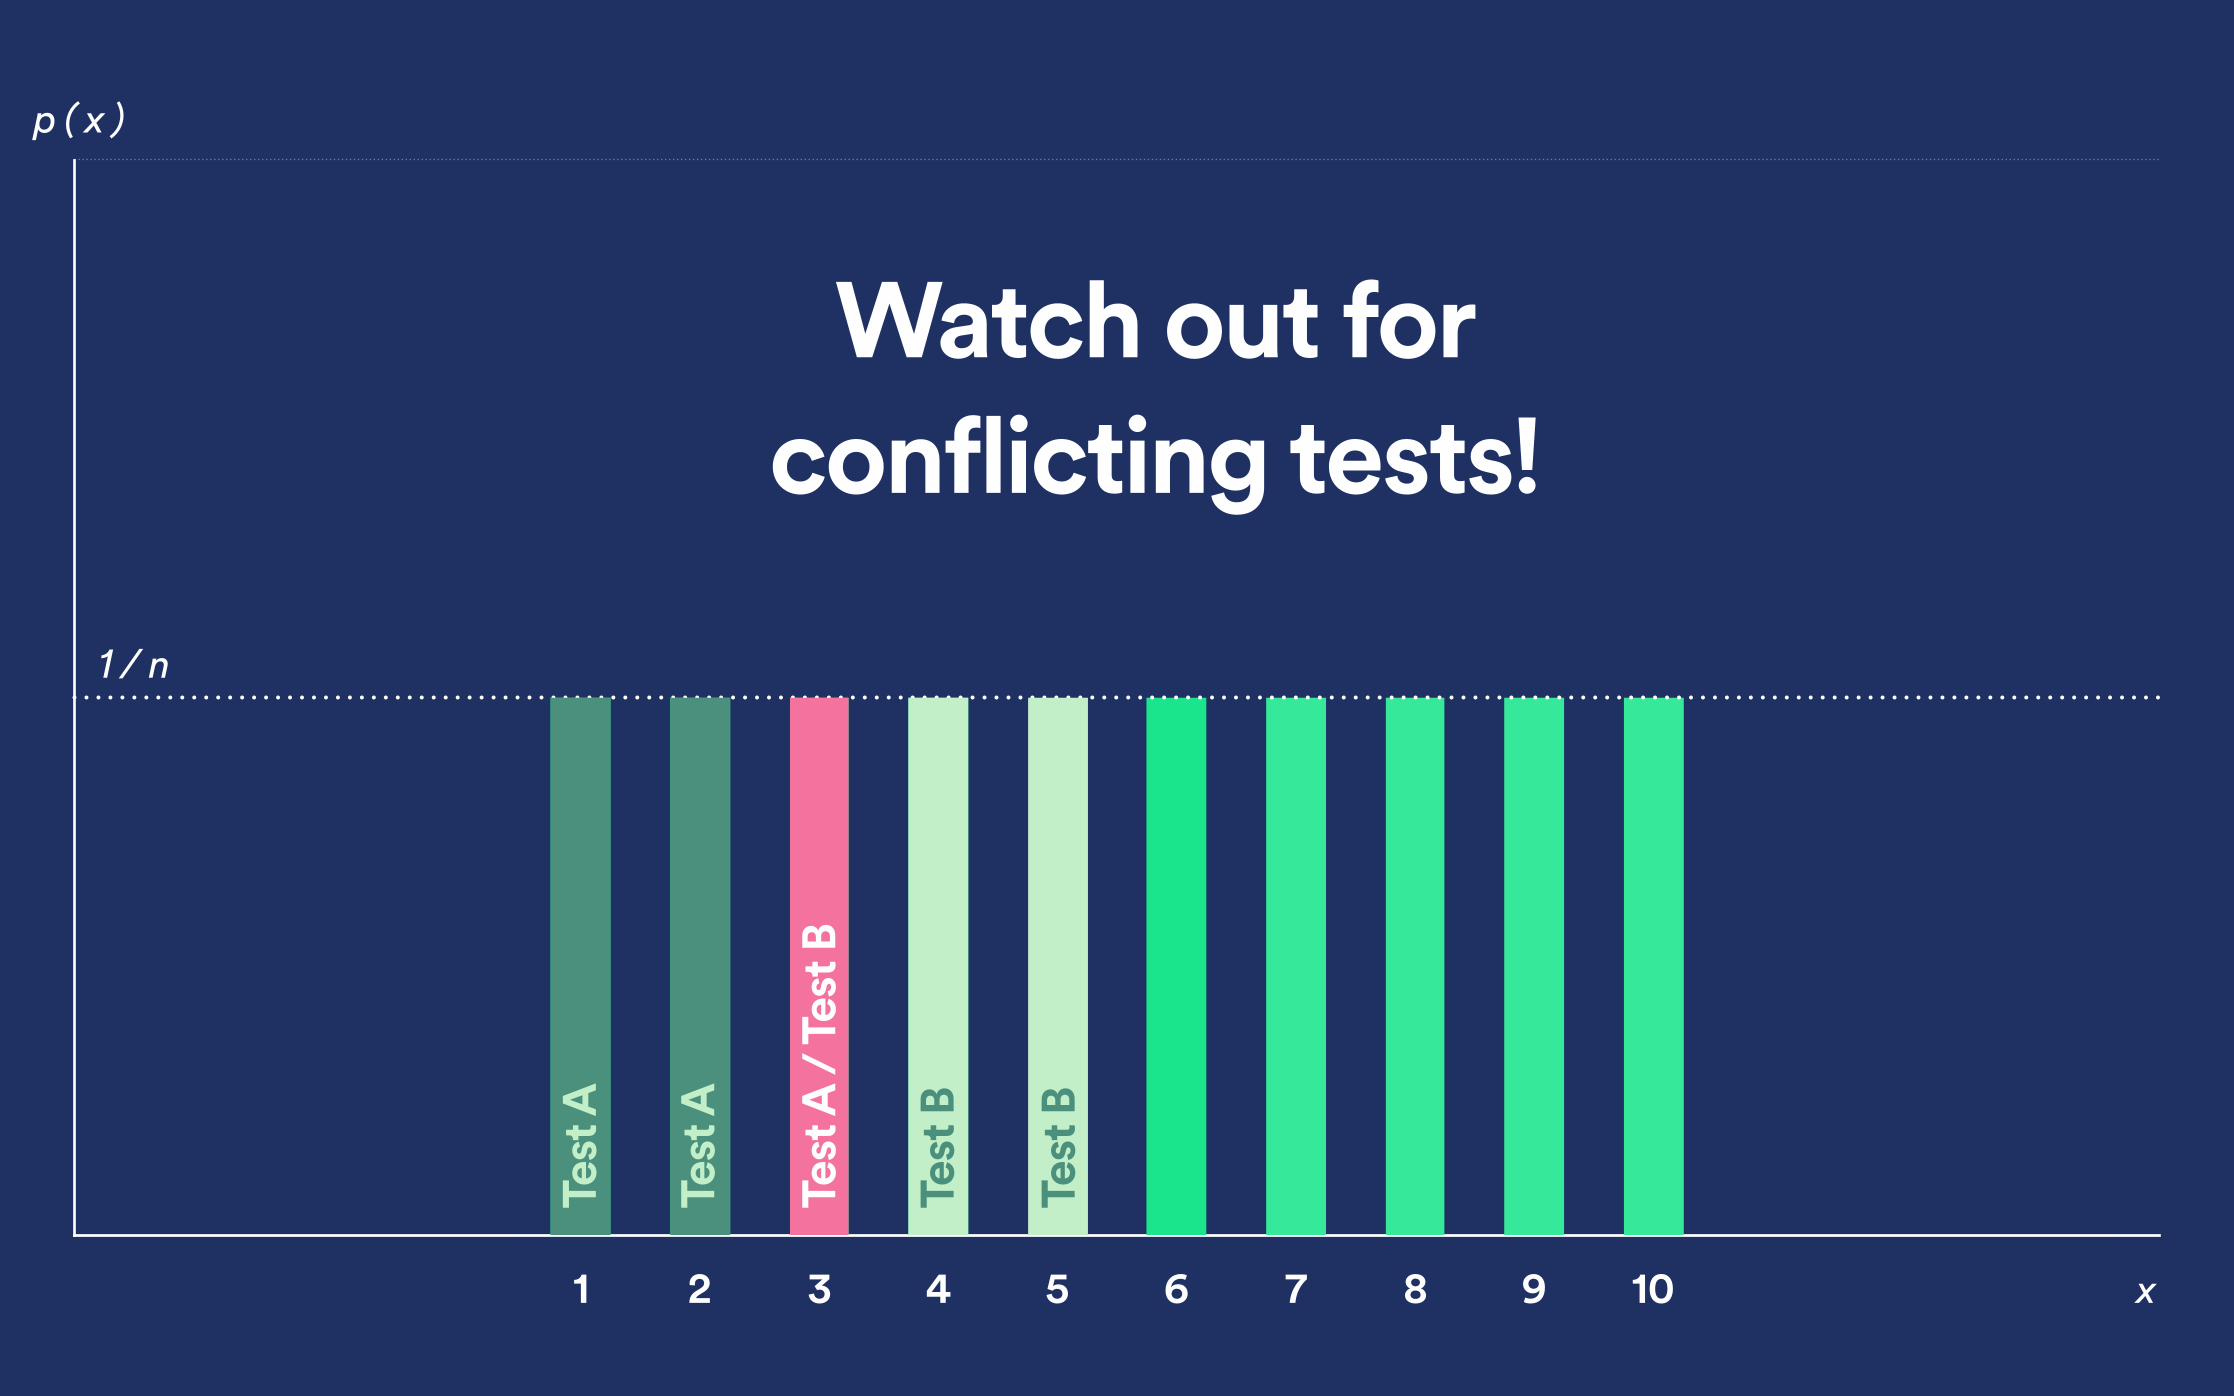
1 2 3 4 5 6 7 8 9 10
p ( x )
x
1 / n
Test
A
Test
A
Test
B
Test
B
Test
A /
Test
B
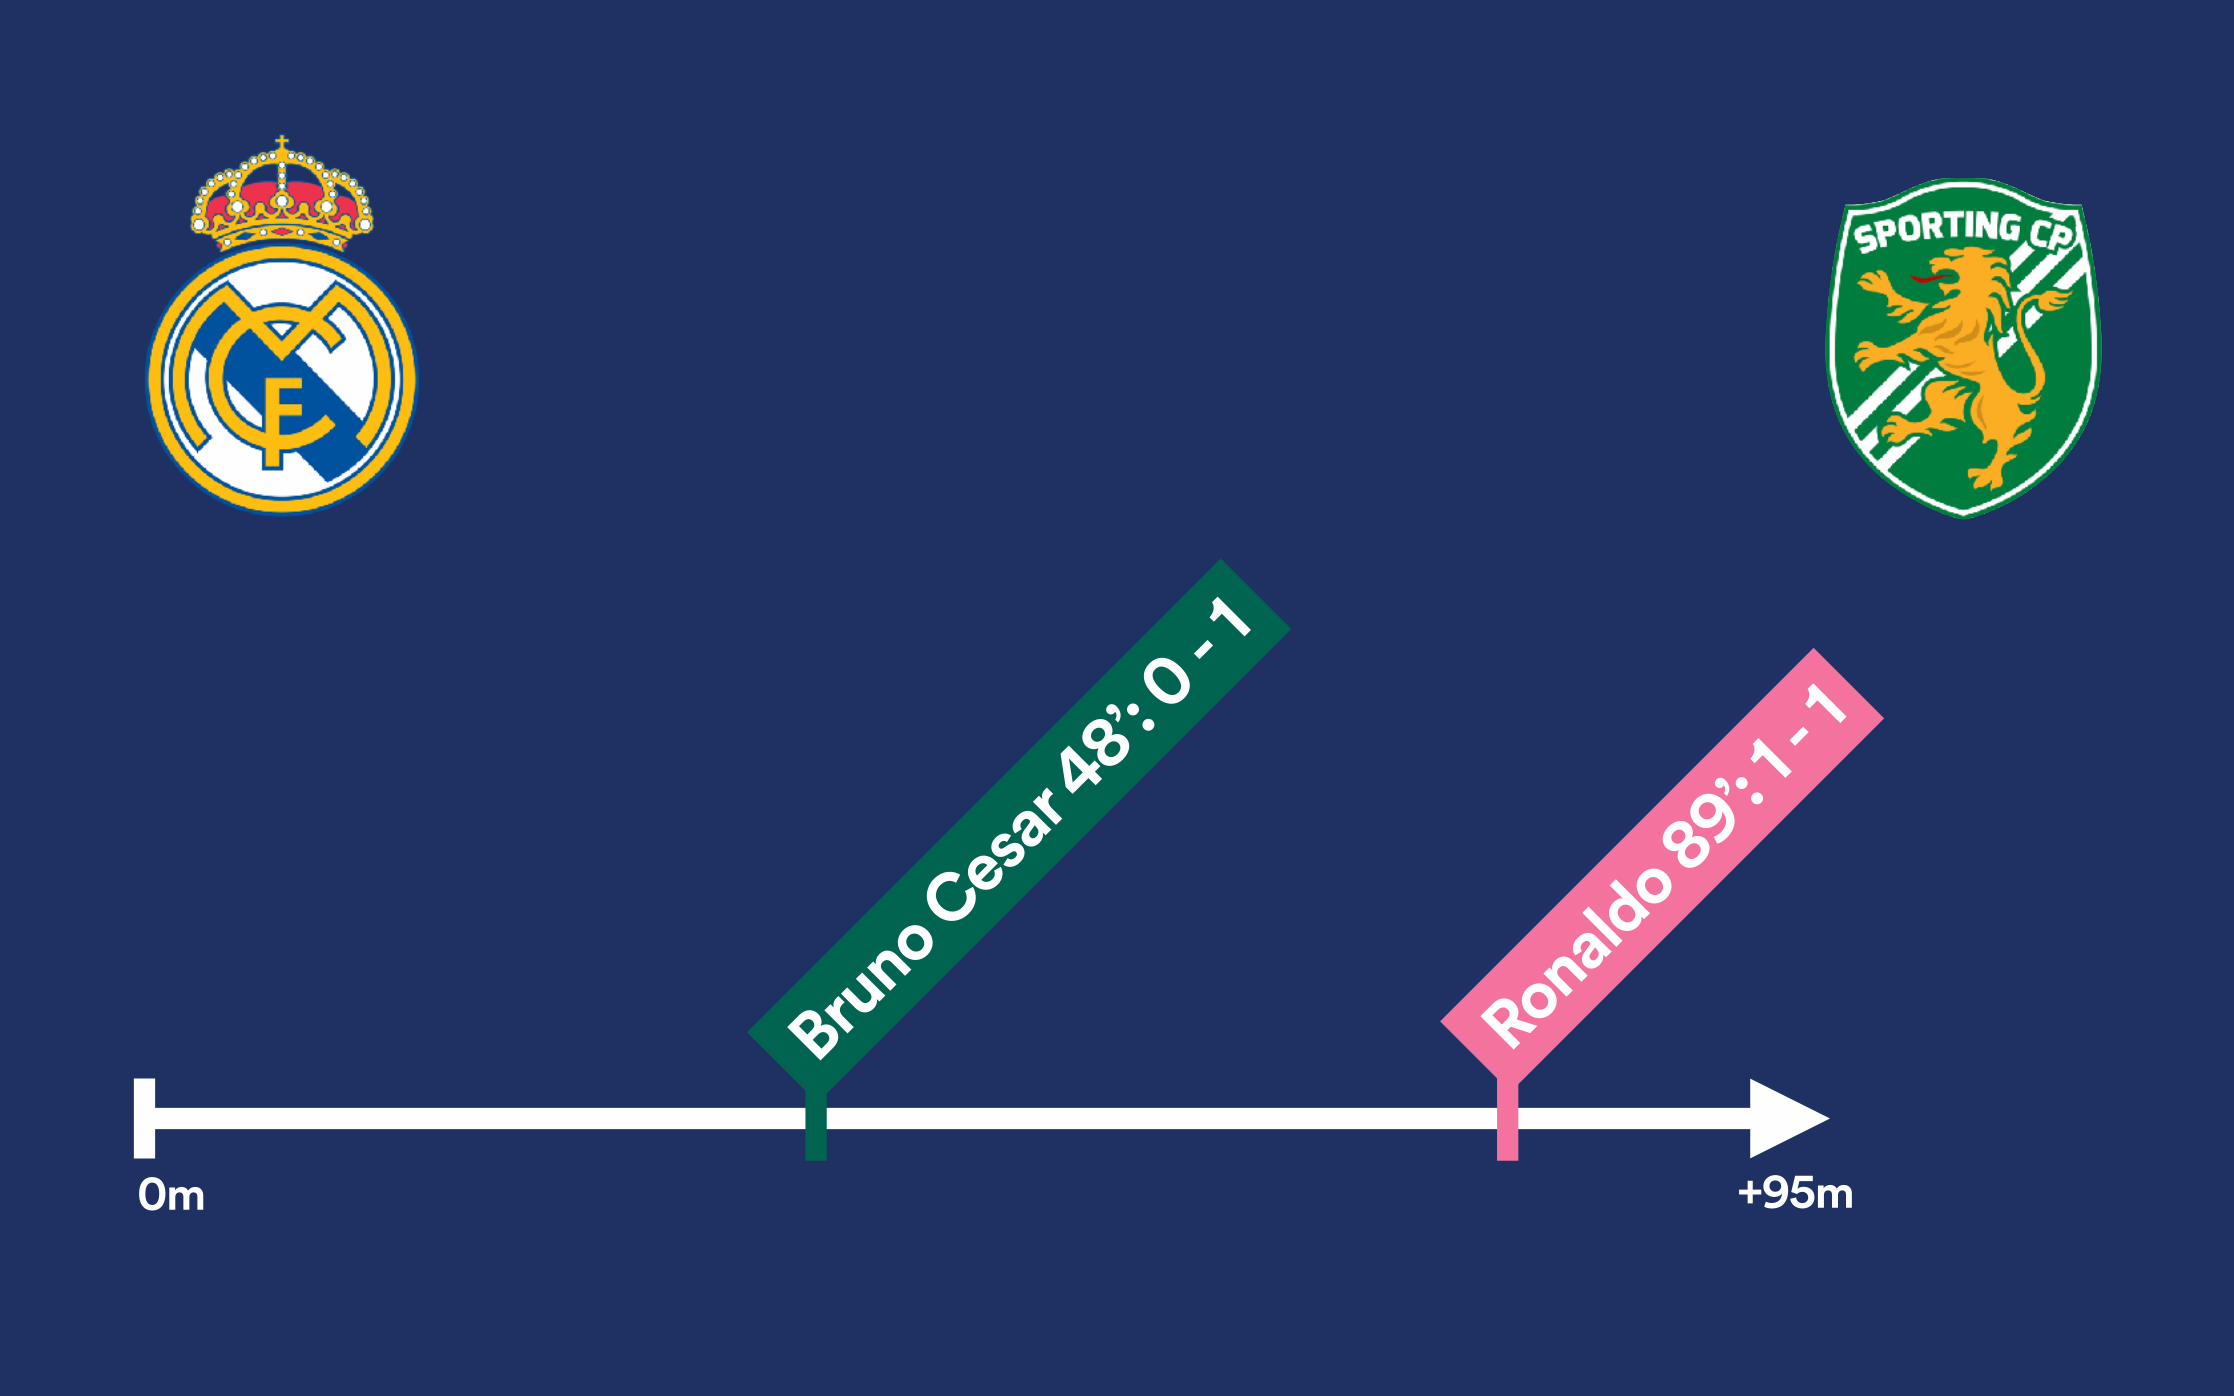
Watch out for conflicting tests!

Don’t cut them short!

0m 90mStandard Match Duration
0m 20mInconclusive
0m +95mUnnecessary
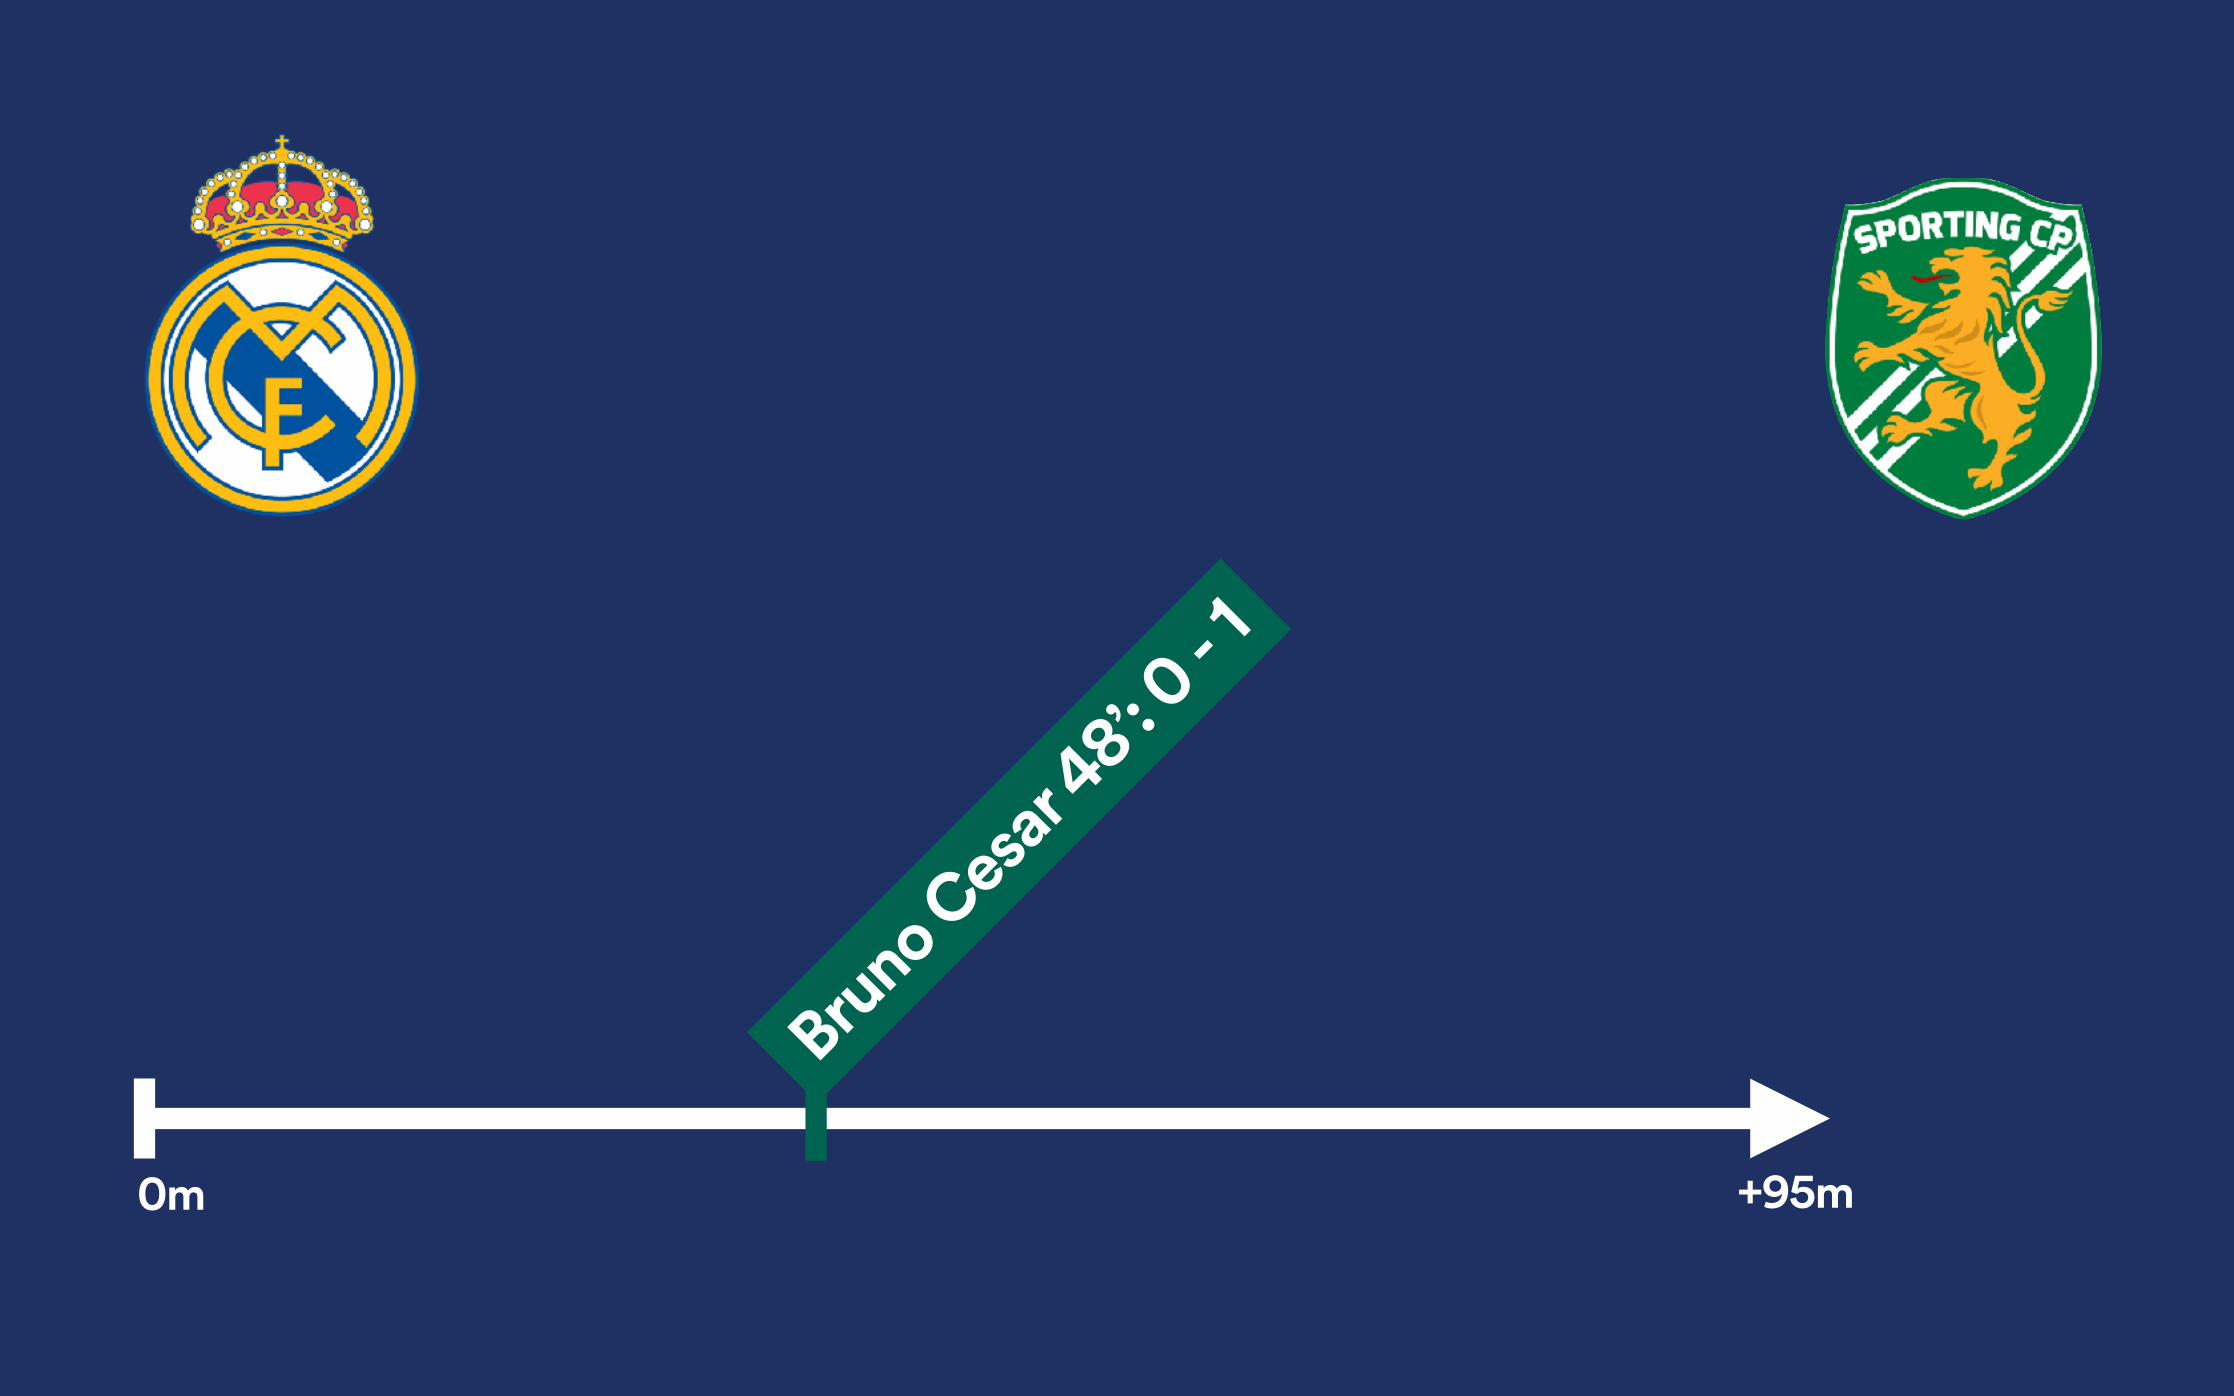
0m +95m
Bruno Cesar 48’: 0
- 1
0m +95m
Bruno Cesar 48’: 0
- 1
Ronaldo 89’: 1 - 1
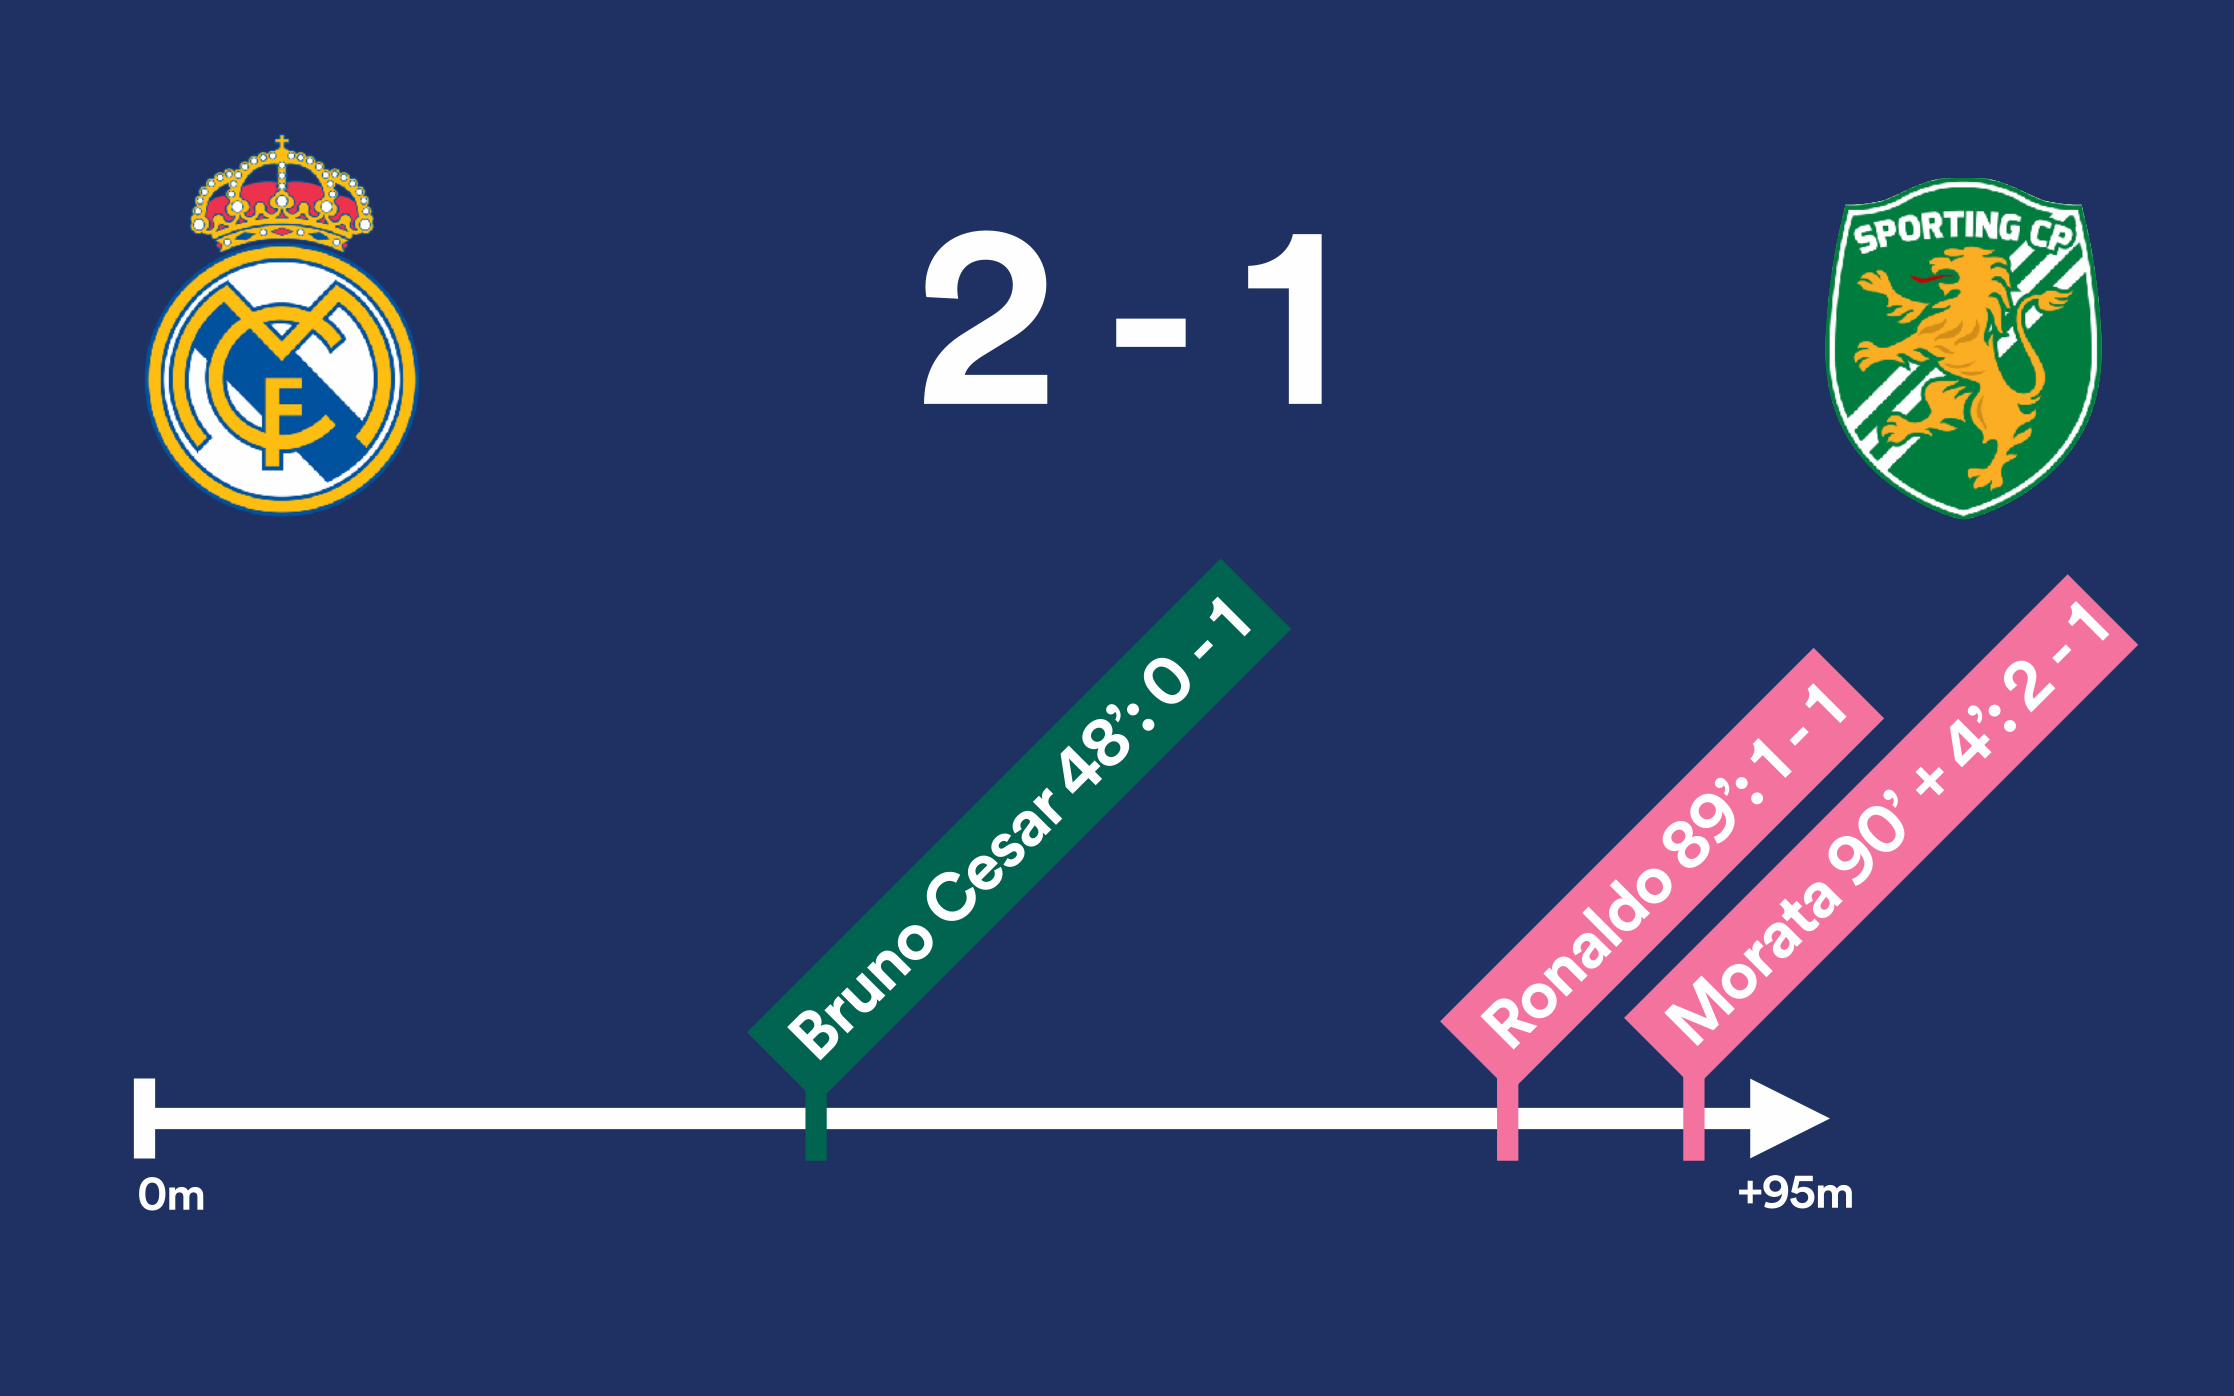
0m +95m
Bruno Cesar 48’: 0
- 1
Ronaldo 89’: 1 - 1
Morata 90’ + 4’: 2 - 1
2 - 1
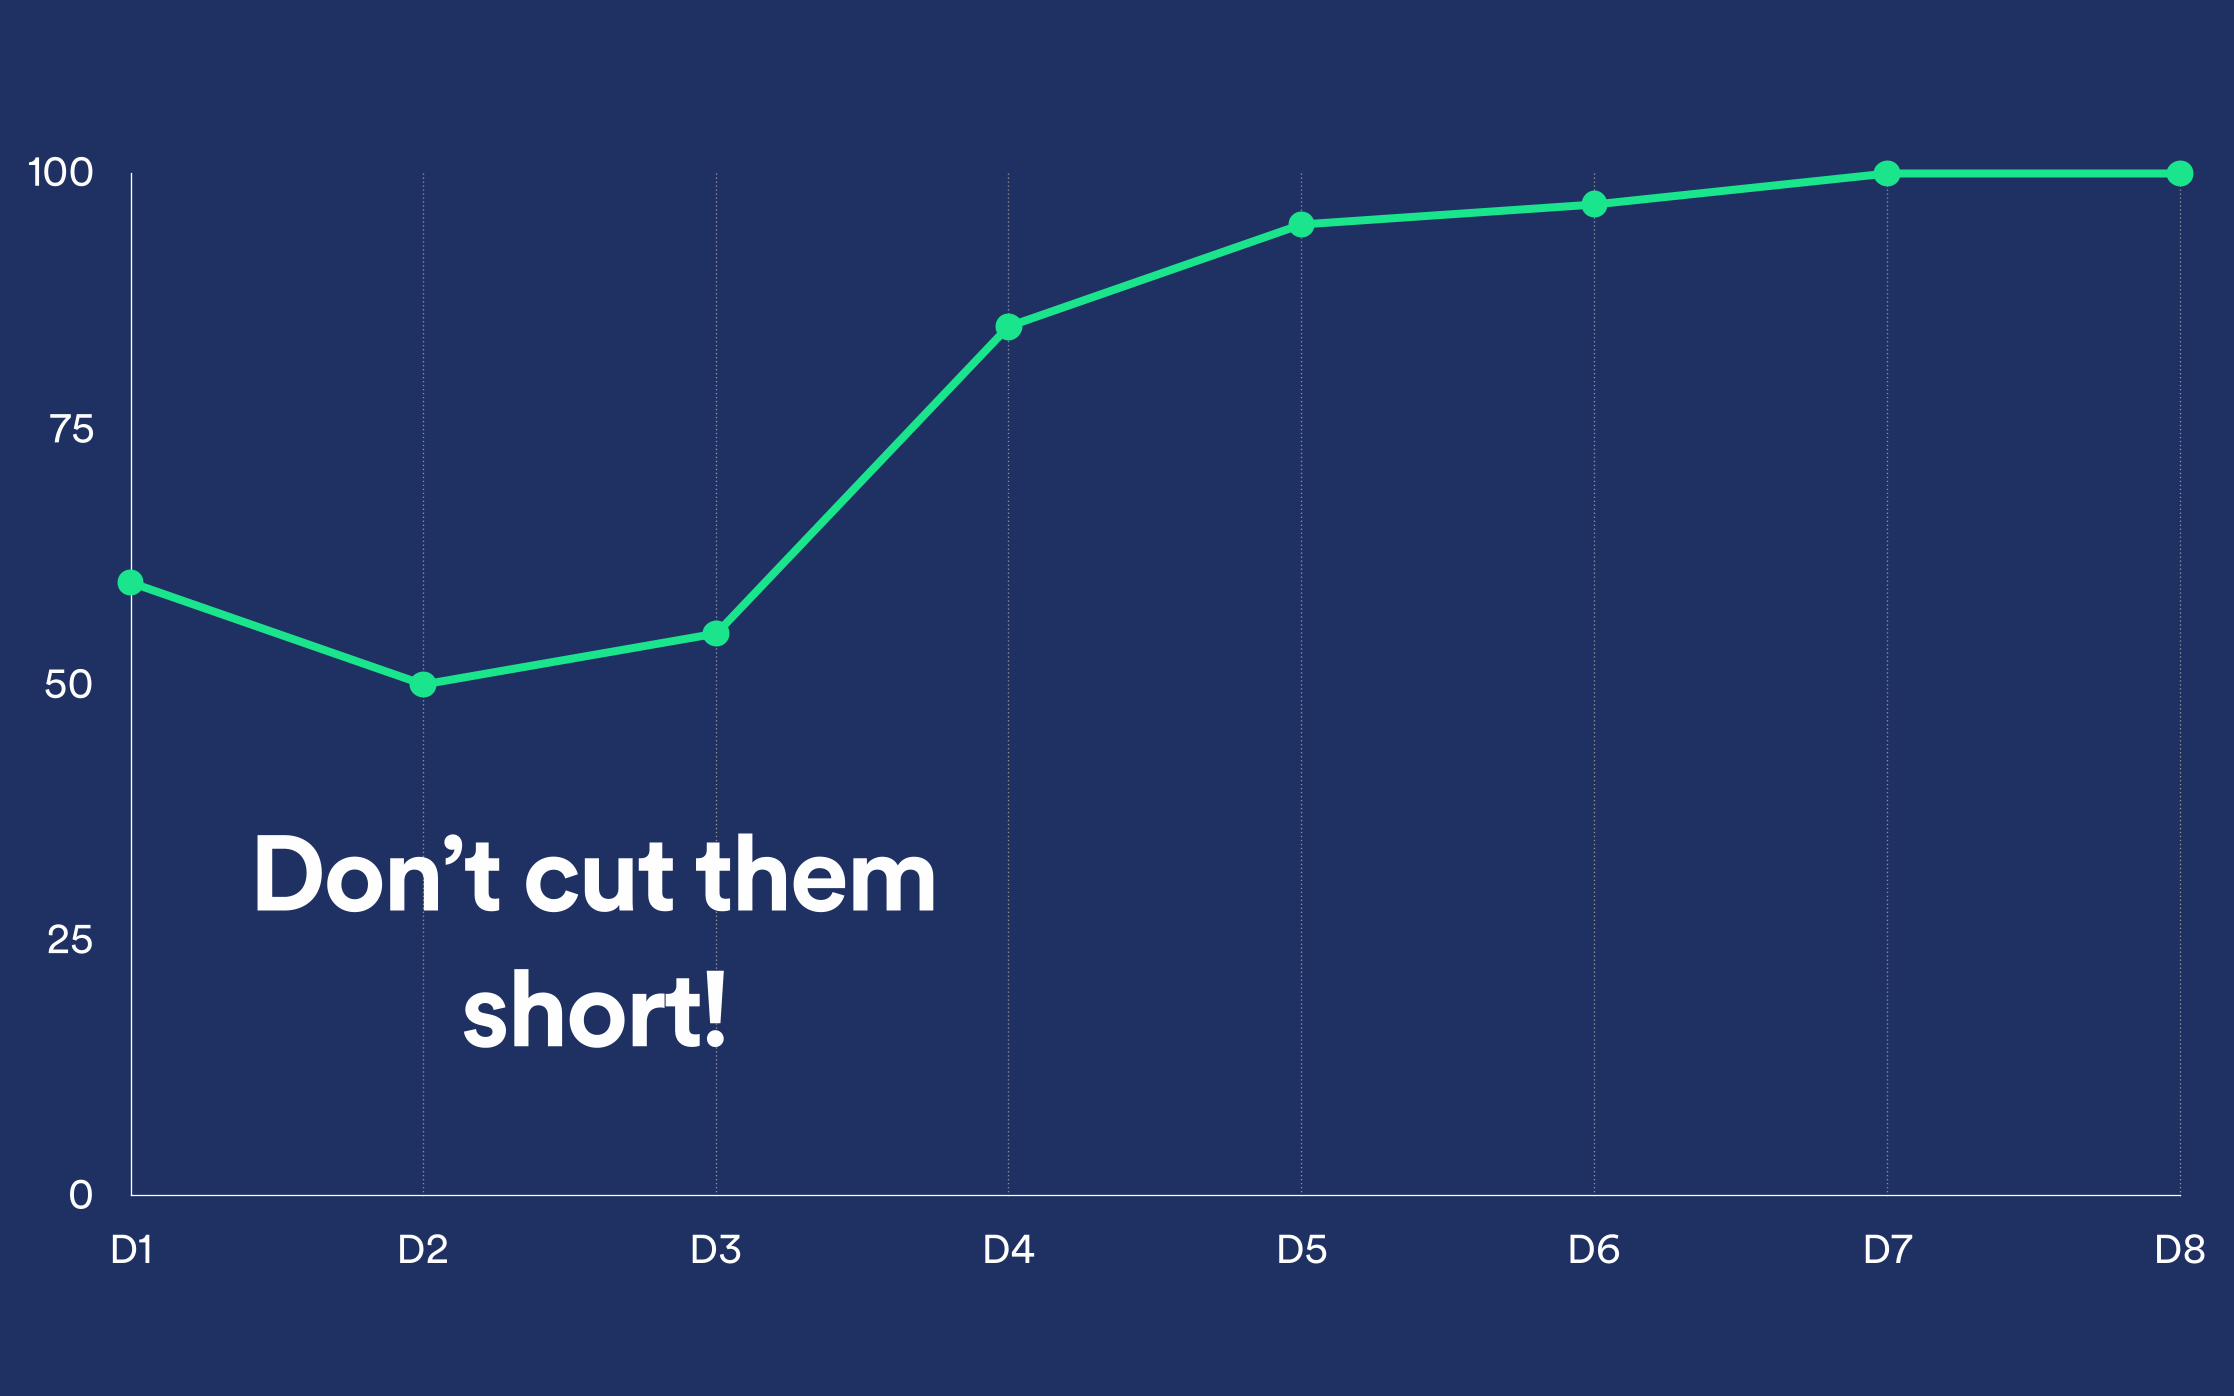
0
25
50
75
100
D1 D2 D3 D4 D5 D6 D7 D8
Don’t cut them short!

4. Analyze the results
1. Formulate a Hypothesisnew

3. Case Studies

3.1. Losing Calories


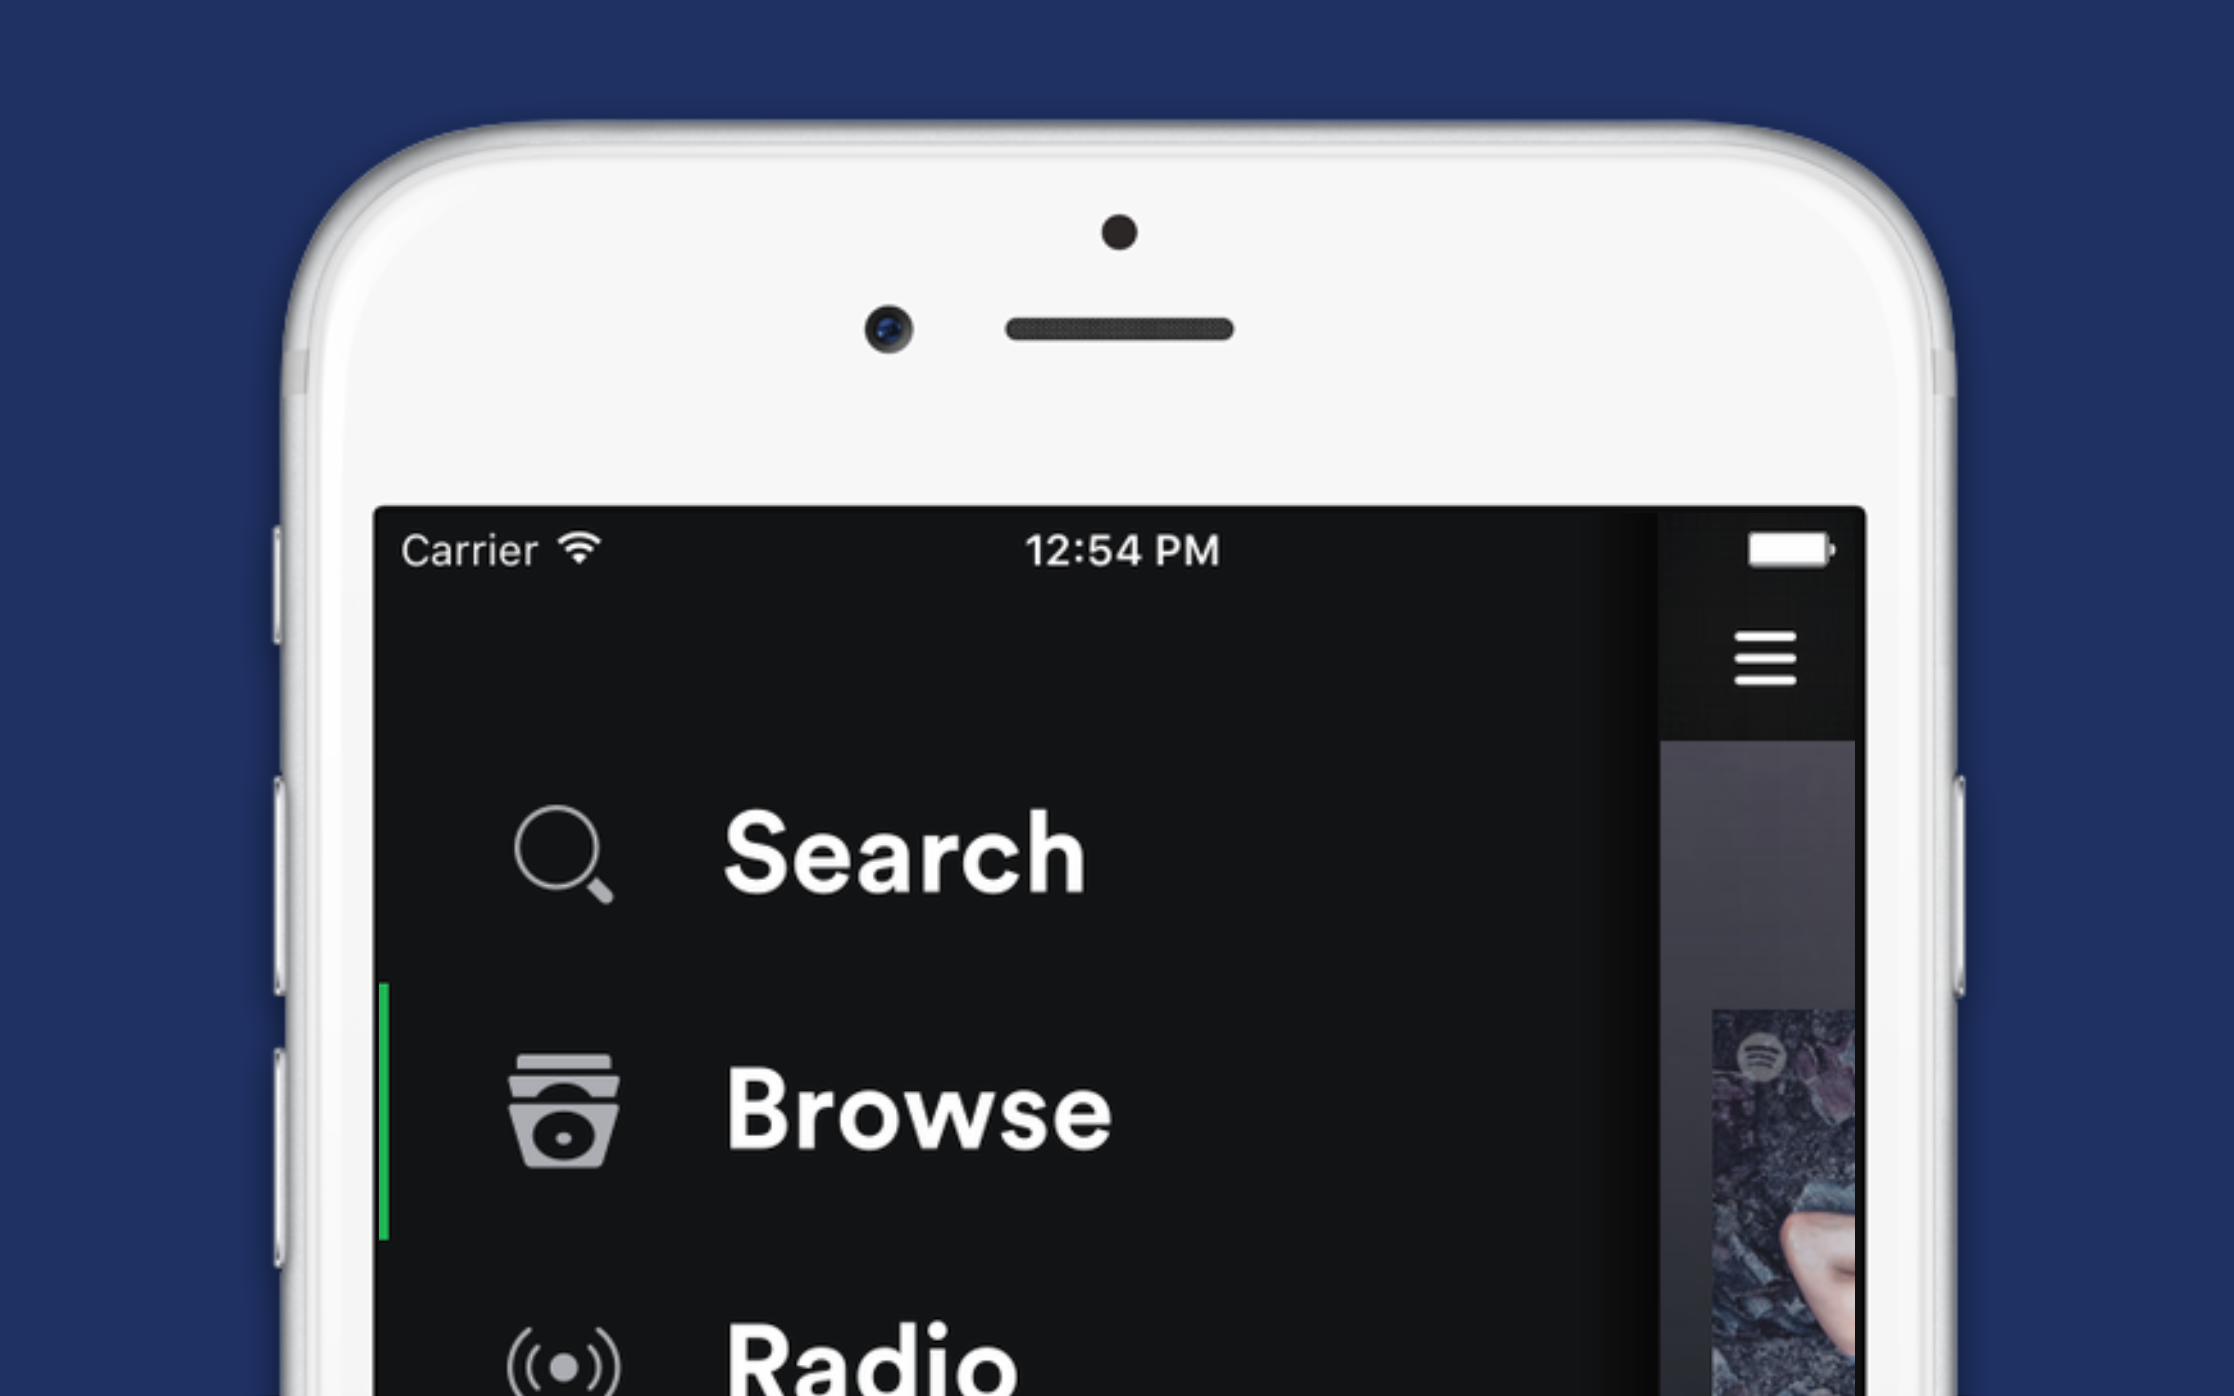
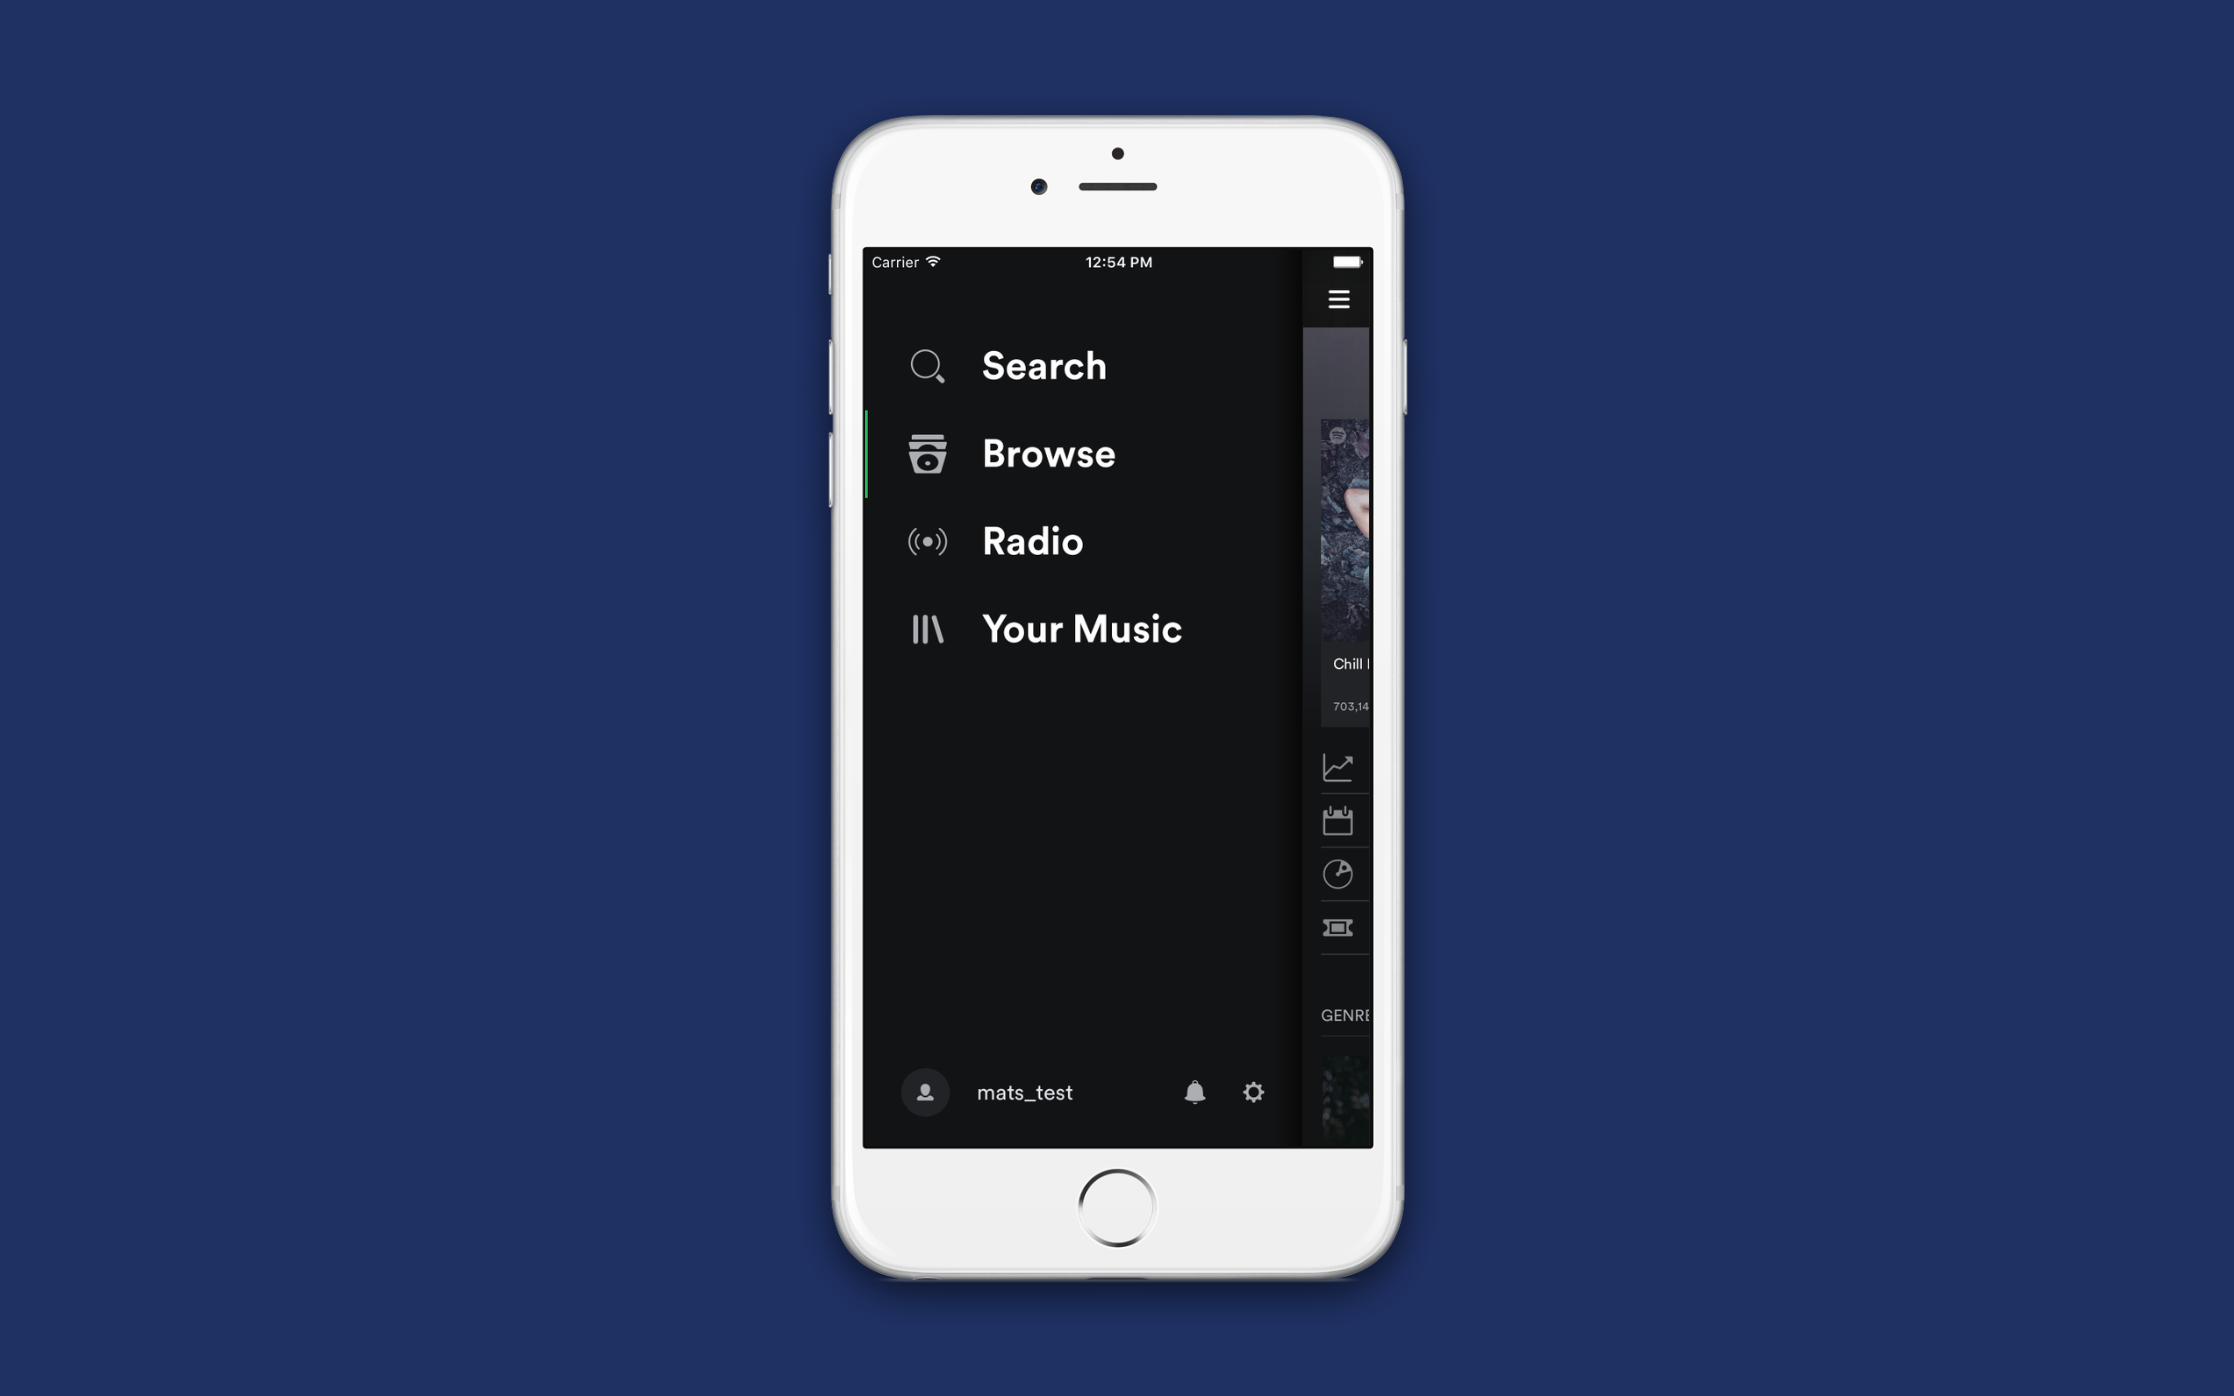


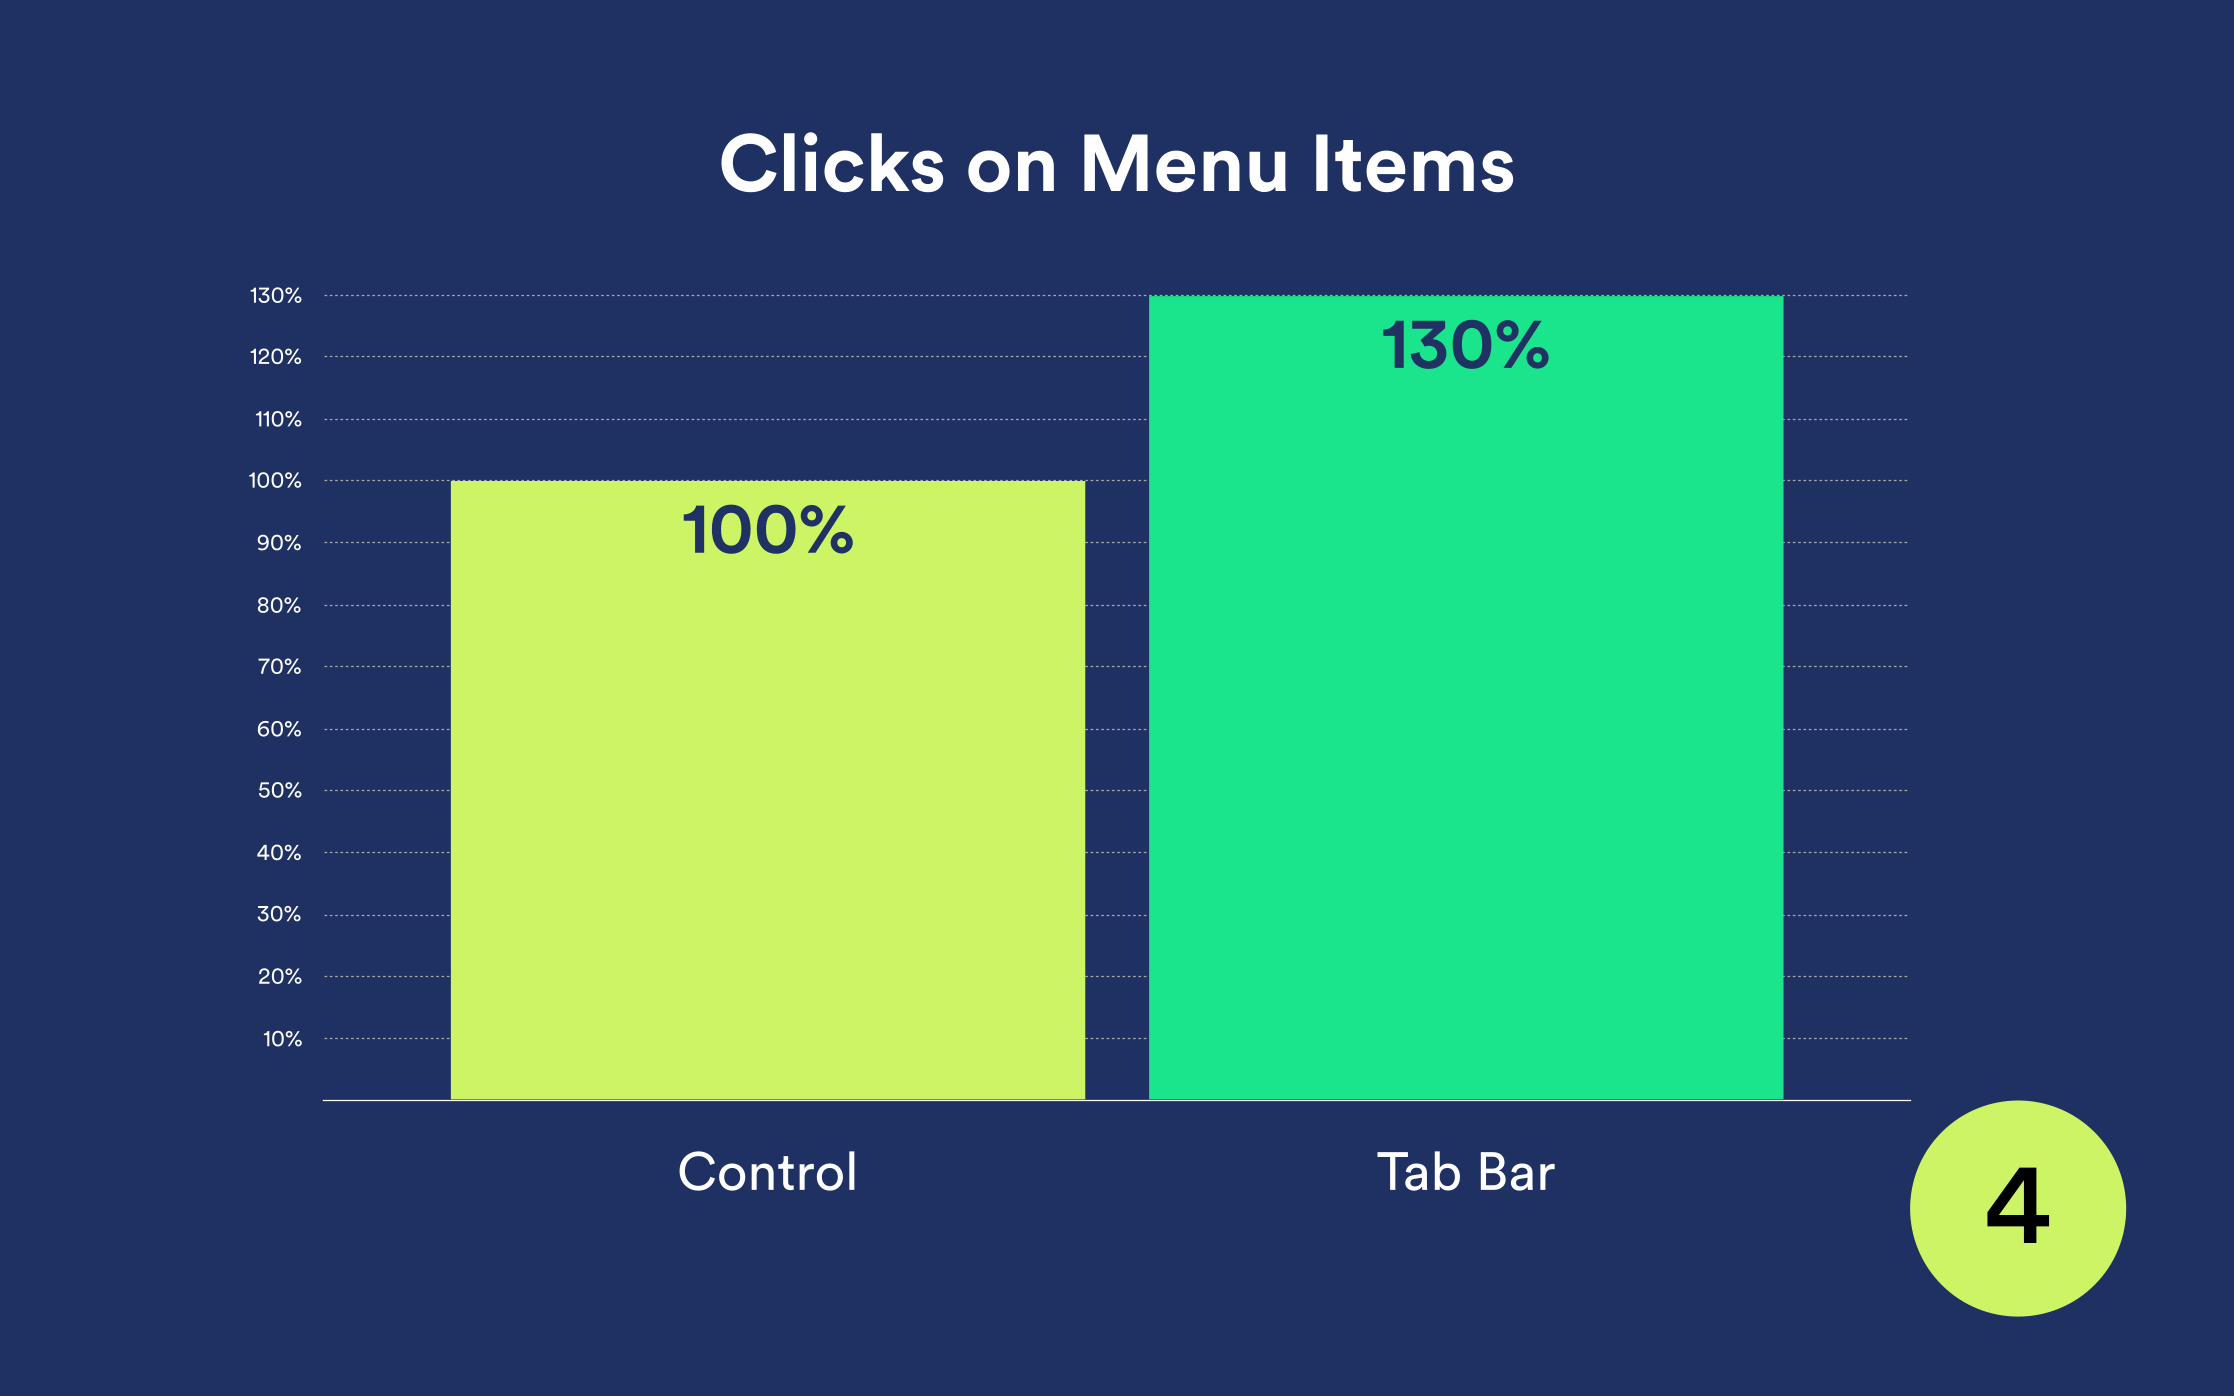
Test: Tab Bar Navigation
Hypothesis:
By switching to TBN, we
expect an increase in the
share of users who click
at least one menu item.
1

Test: Tab Bar Navigation
Hypothesis:
By switching to TBN, we
expect an increase in the
share of users who click
at least one menu item.
2.1
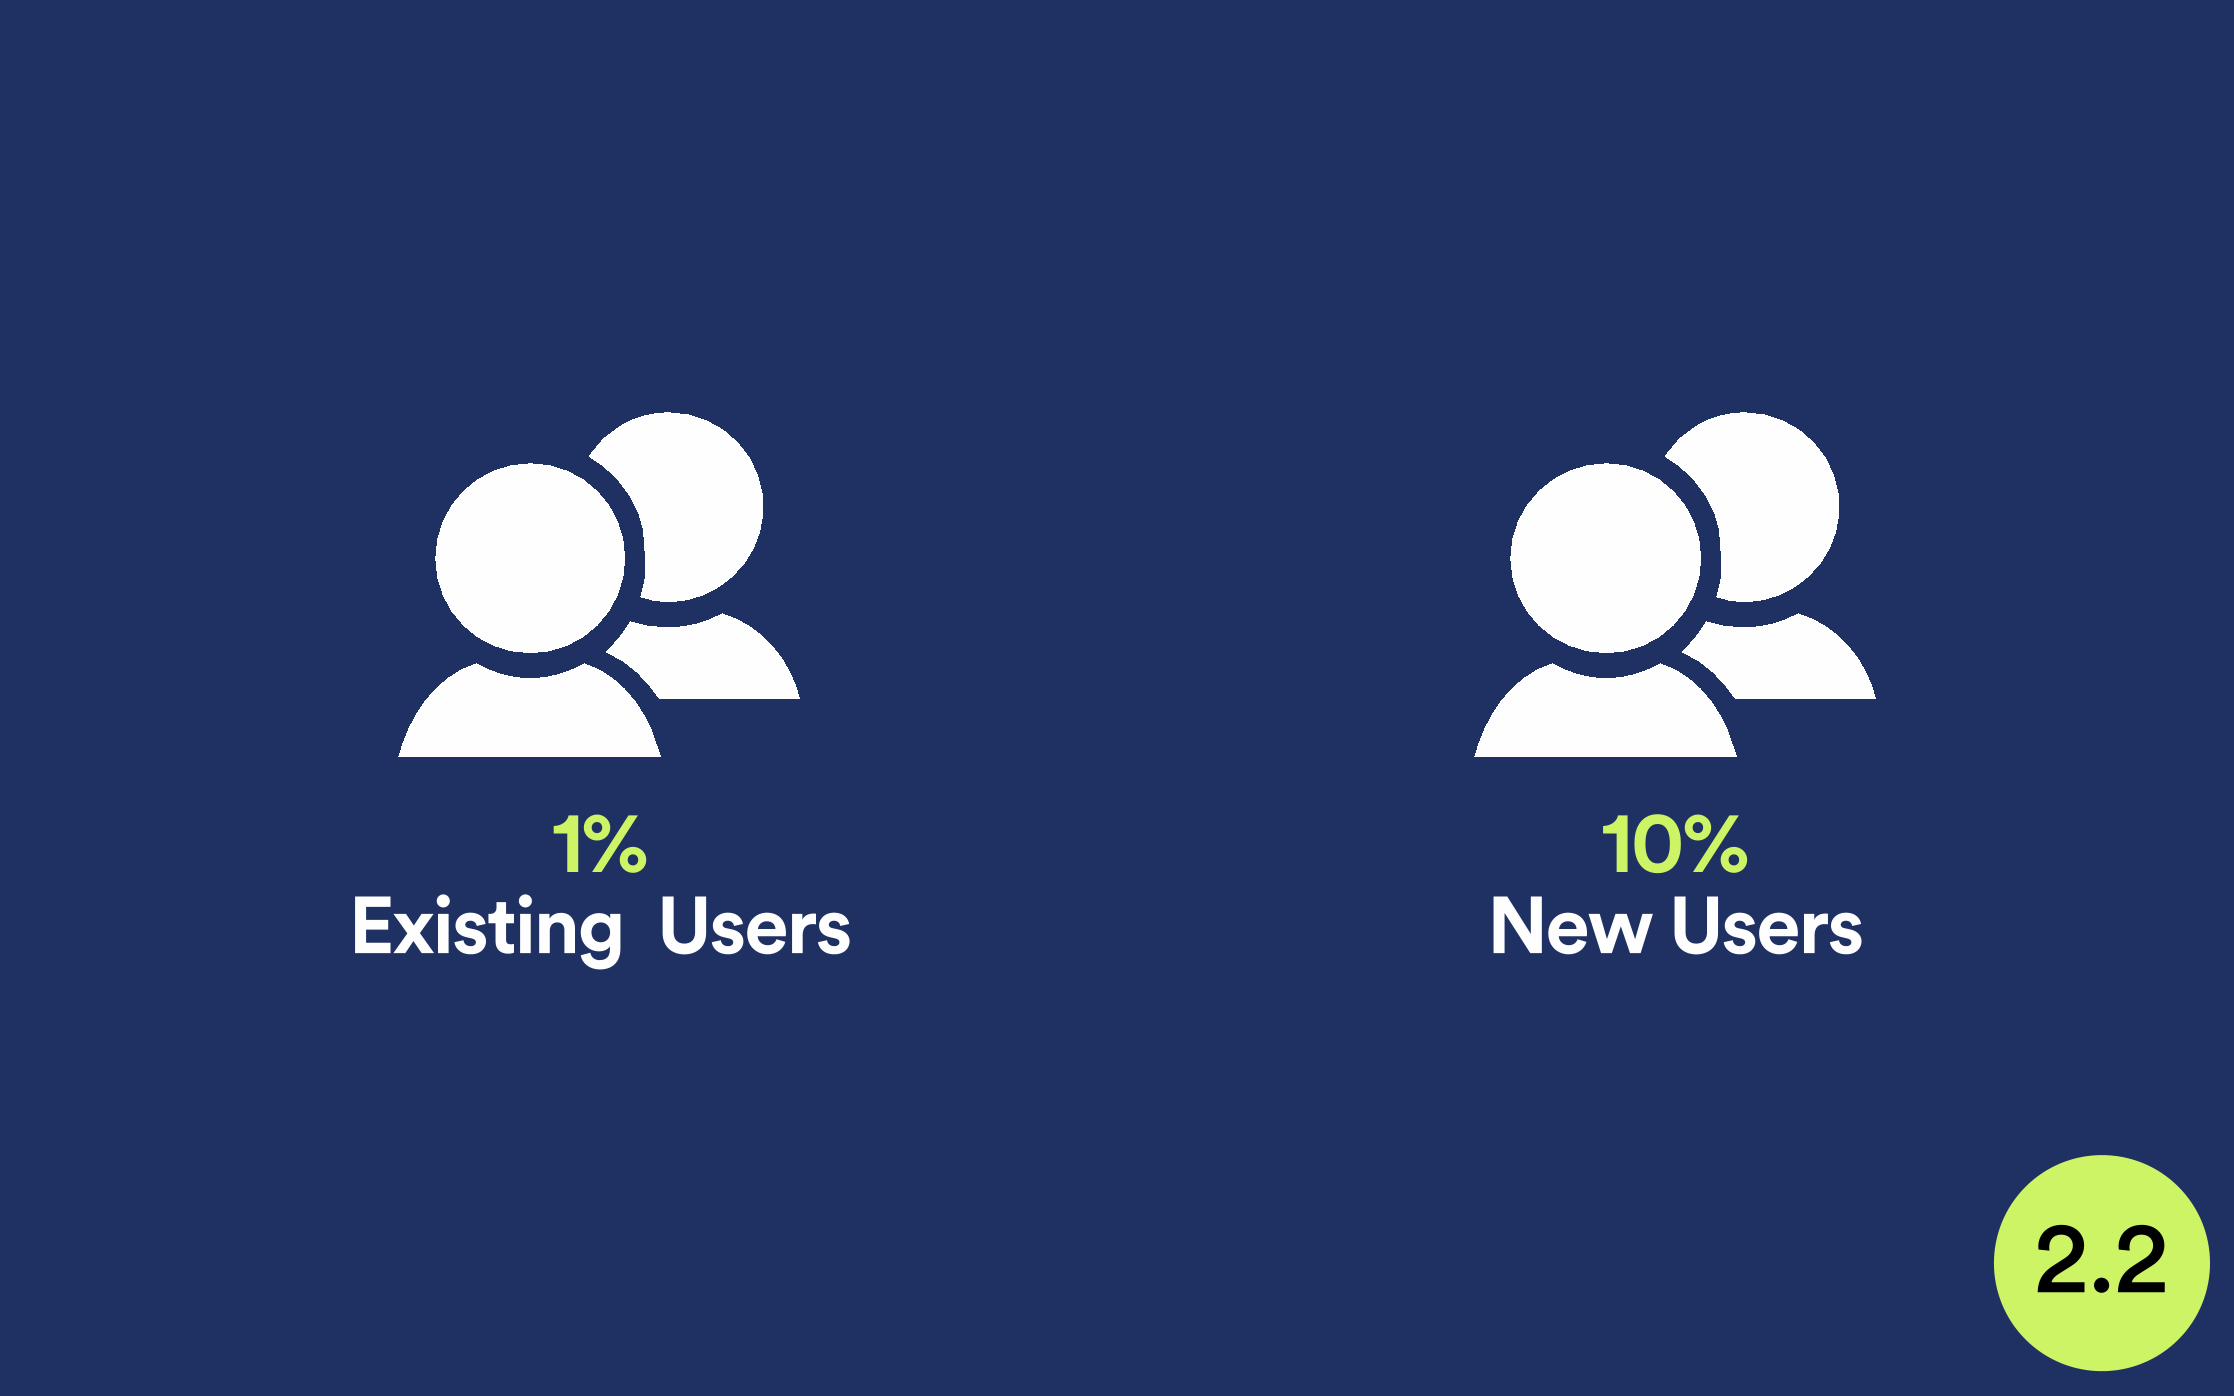
10% New Users
1% Existing Users
2.2

2.3
1 week period
4
Clicks on Menu Items
10%
20%
30%
40%
50%
60%
70%
80%
90%
100%
110%
120%
130%
Control Tab Bar
130%
100%
4
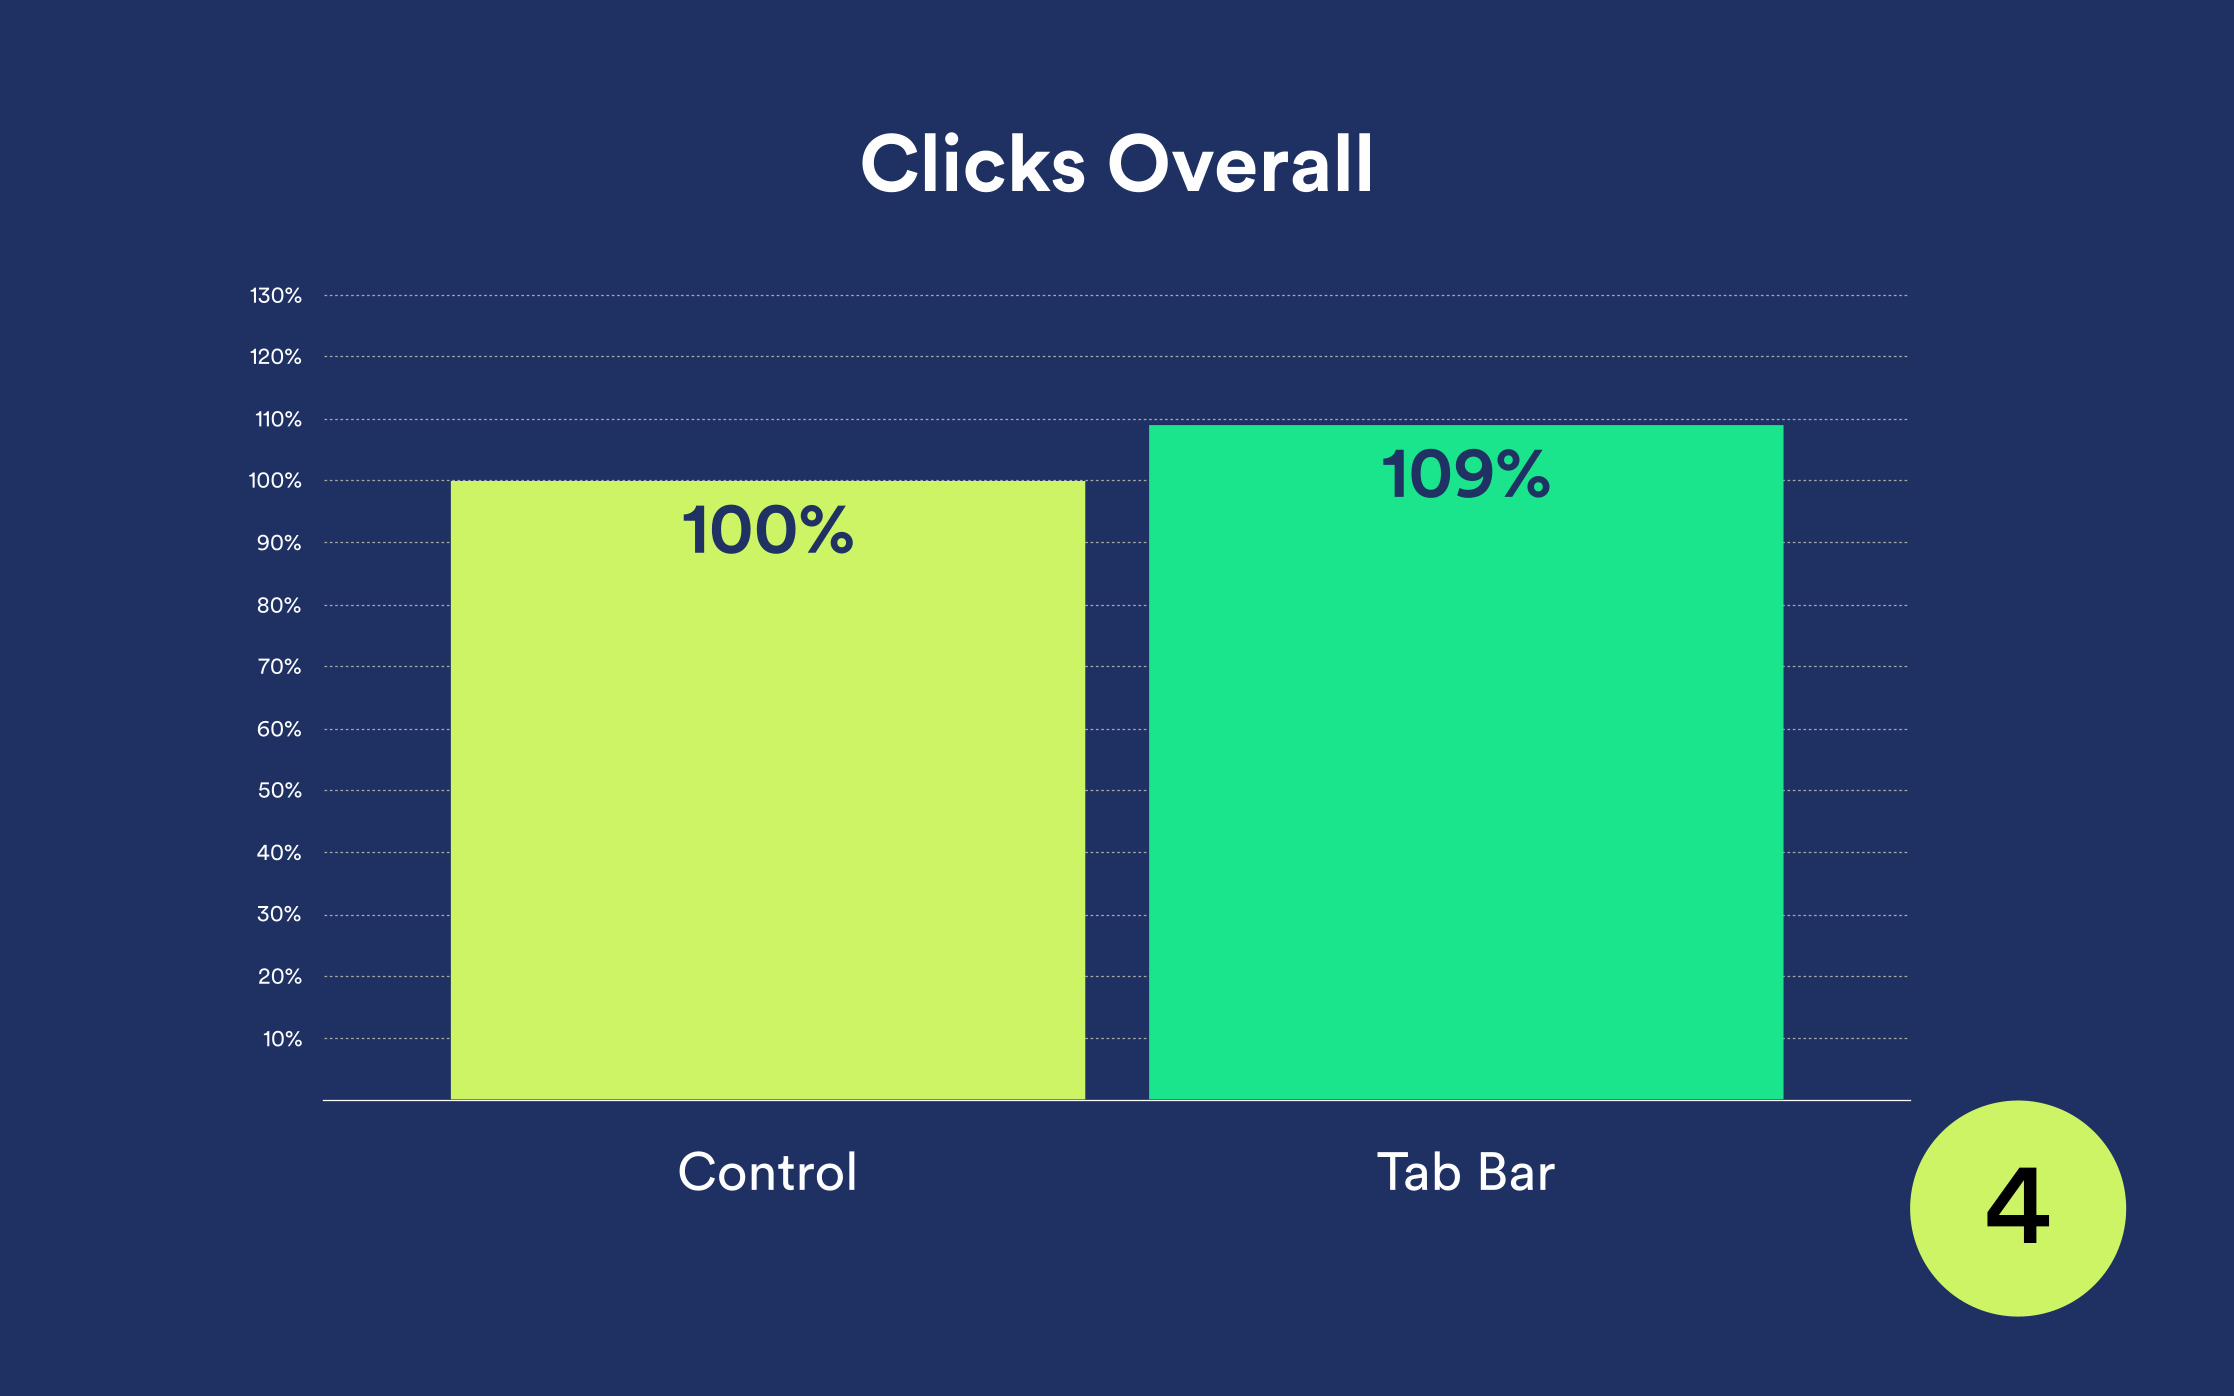
Clicks Overall
10%
20%
30%
40%
50%
60%
70%
80%
90%
100%
110%
120%
130%
Control Tab Bar
109%100%

4
1. Increased clicks in Tab Items
2. Decreased clicks in non-tab items.

WHY AB TEST?
QUANTIFY THE IMPACT OF A SPECIFIC CHANGE

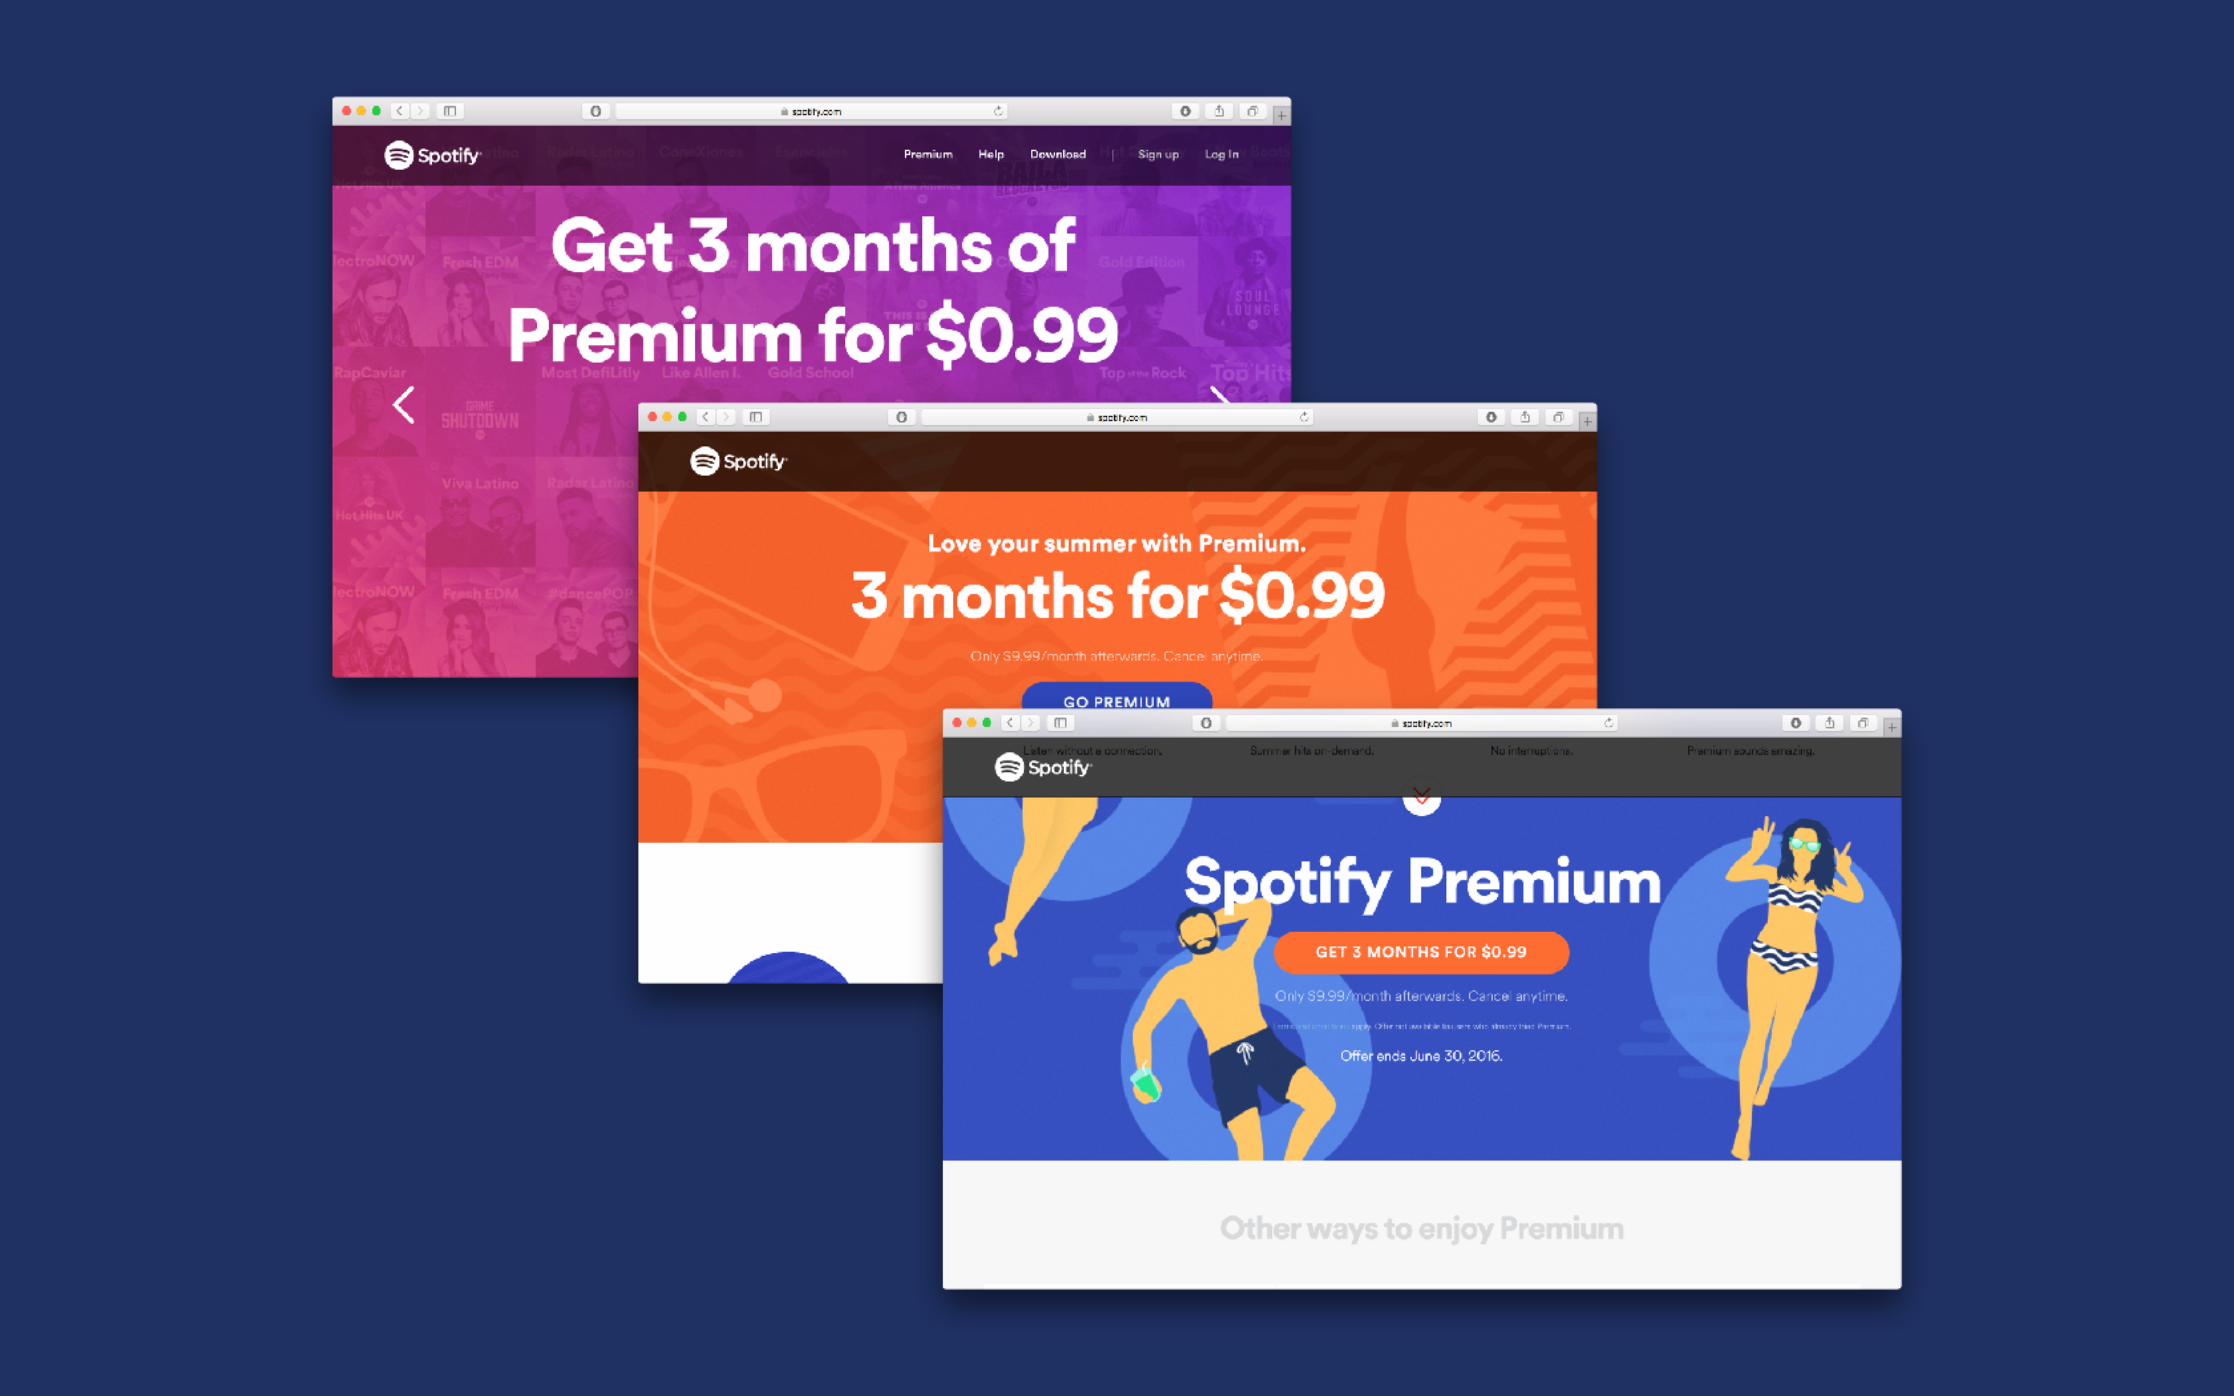
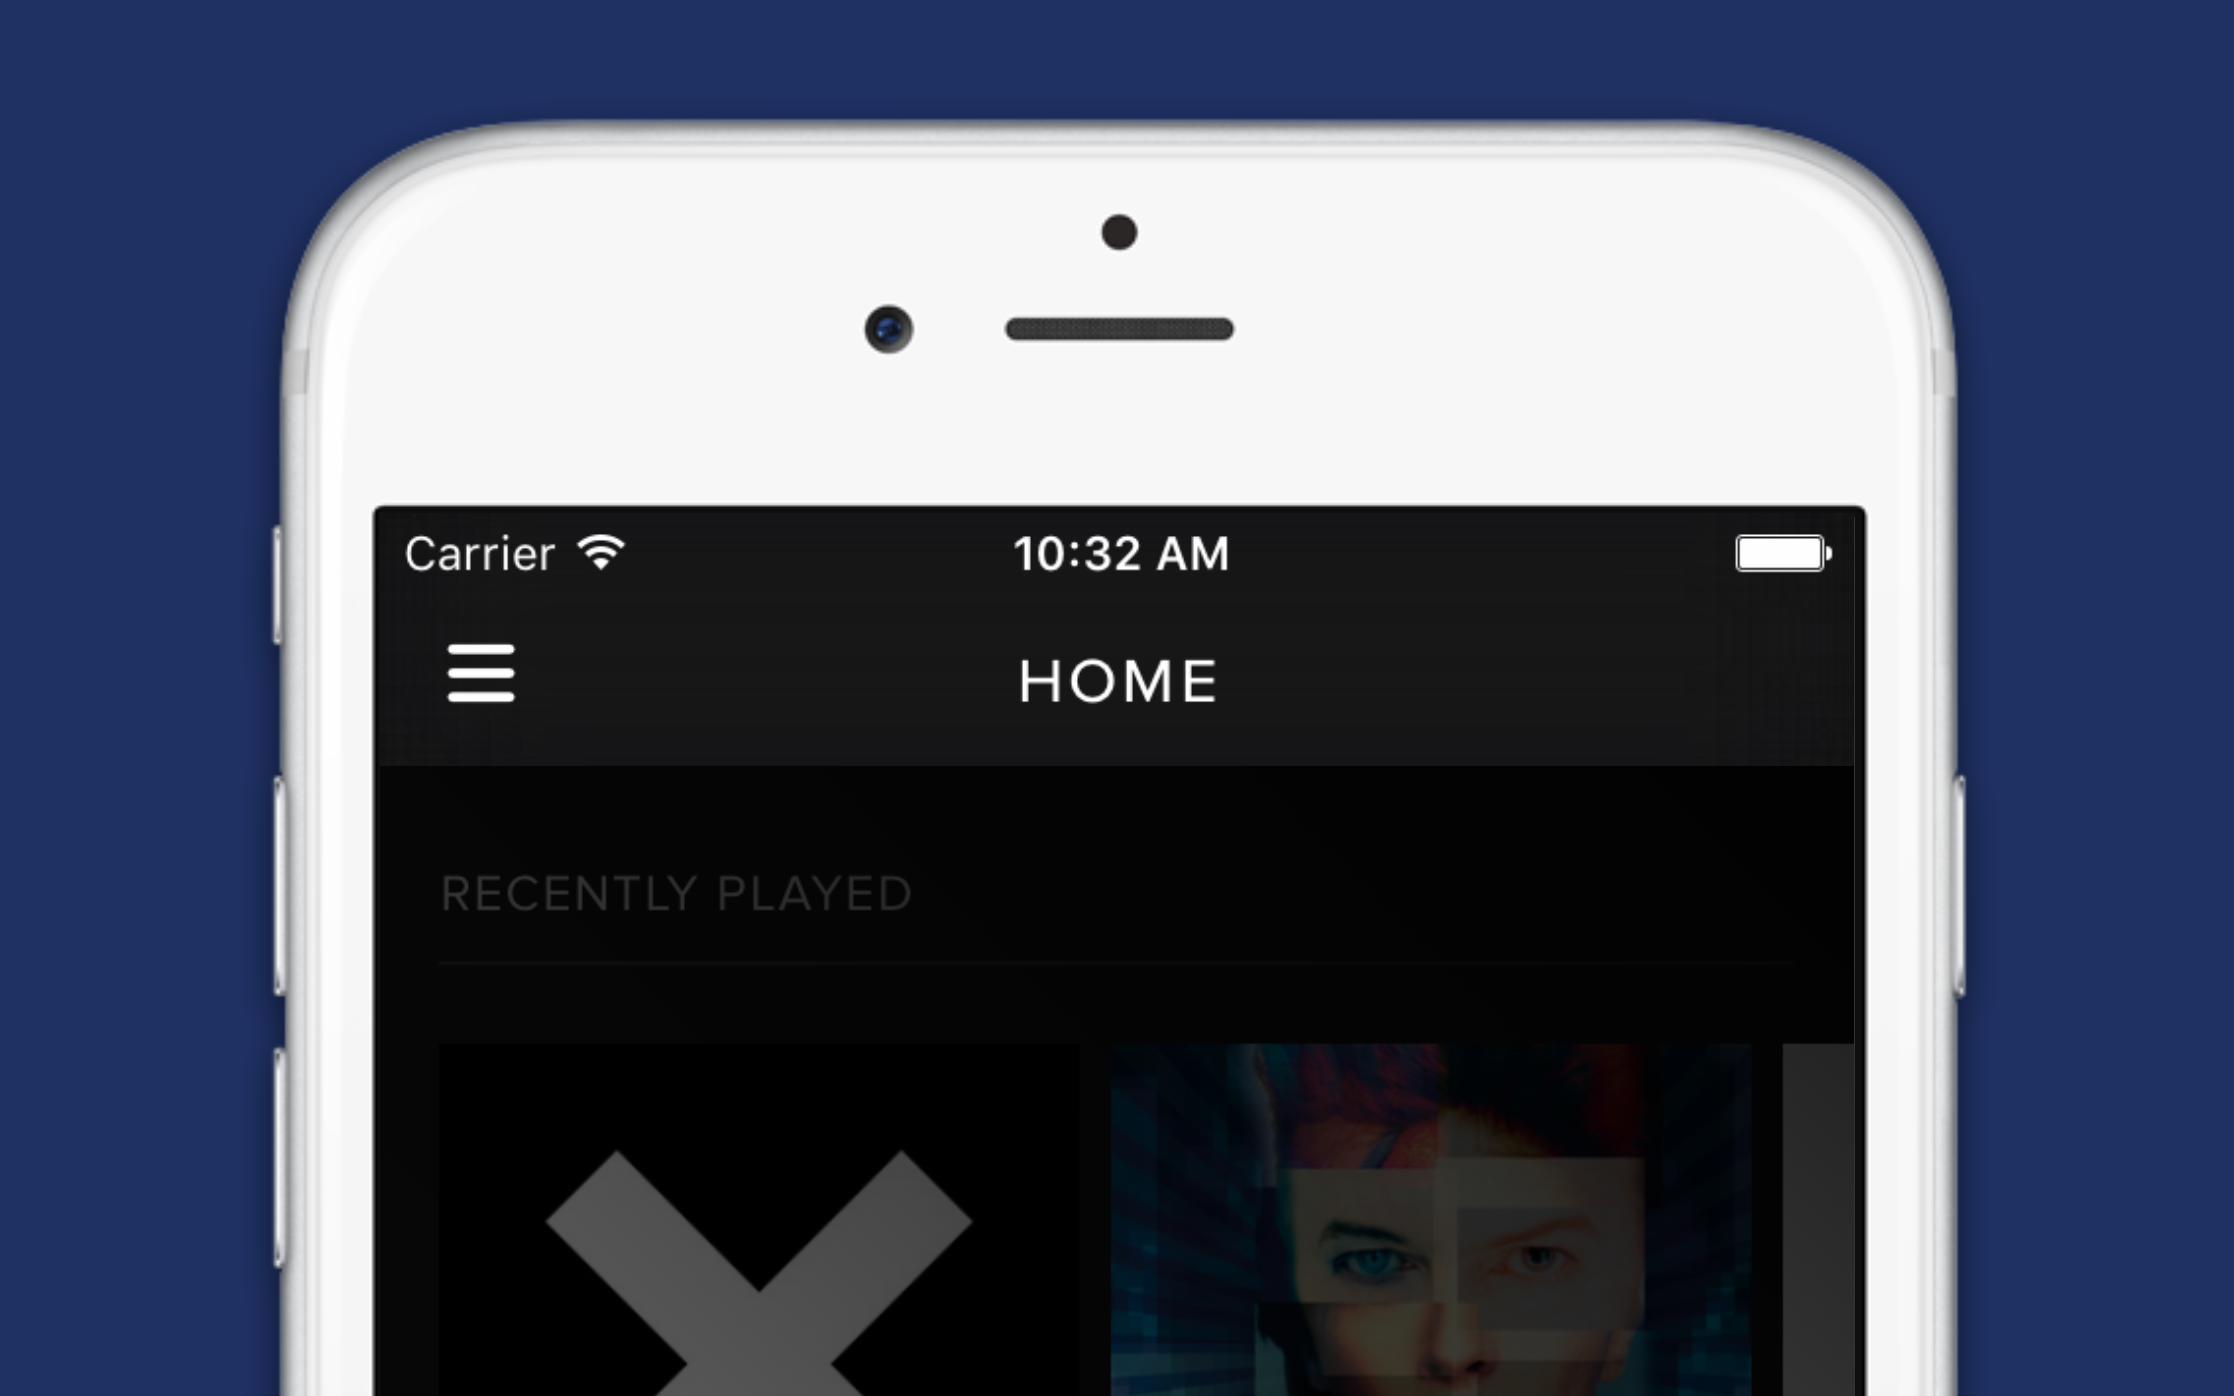
3.2. Home in Mexico

My Rock Your Rock

My Home Your Home
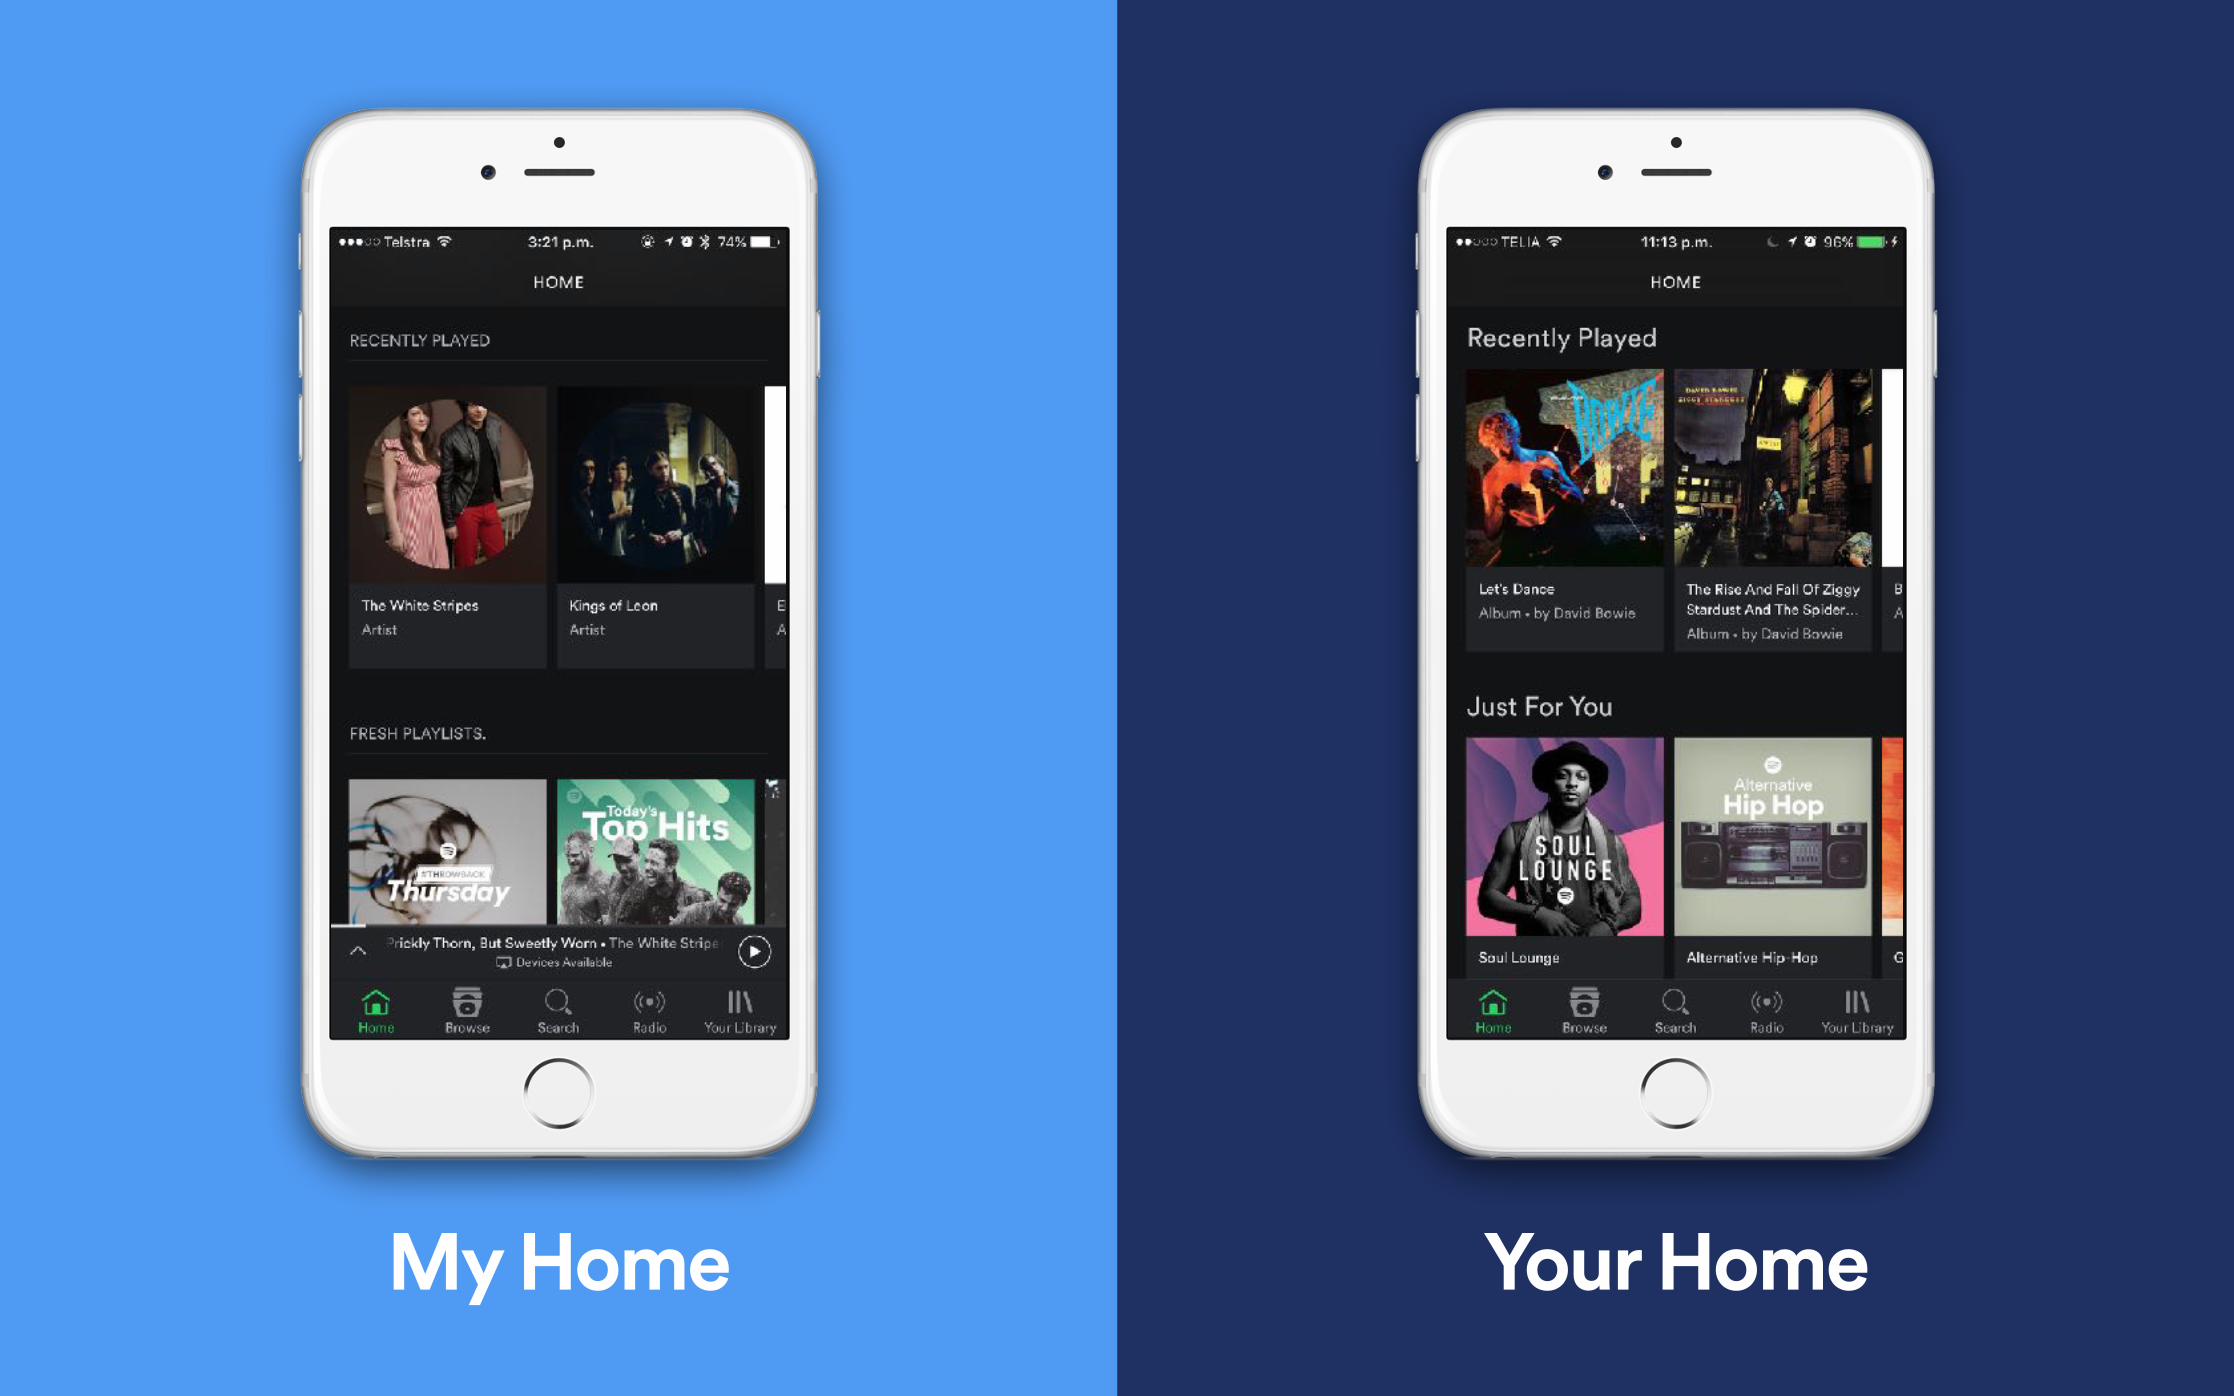
My Home Your Home

Test: Home
Hypothesis:
We will measure an
increased second week
retention by using the
new ‘Home’ as start
page. 1

Test: Home
Hypothesis:
We will measure an
increased second week
retention by using the
new ‘Home’ as start
page. 2.1

10% New Users
1% Existing Users
2.2
2.3
1 week period

US UK Germany Austria Mexico
4

1. Is the localization good? 2. Are recommendations relevant for
the market? 3. Technical restrictions we are not
aware of?
4

12.34 Mbps US
13.70 Mbps UK
13.42 Mbps Germany
15.48 Mbps Austria
7.4 Mbps Mexico* 3.7 Mb
4

1. Hypothesis 2. Design 3. Run 4. Analysis

Test: Home
Hypothesis:
By compressing the data
sent for Home, more
users will play on day
one, two and be active
during their second
week. 1

1. Is the localization good? 2. Are recommendations relevant for
the market? 3. Technical restrictions we are not
aware of?
4

1. Is the localization good? 2. Are recommendations relevant for
the market? 3. Technical restrictions we are not
aware of?
4

1. Is the localization good? 2. Are recommendations relevant for
the market? 3. Technical restrictions we are not
aware of?
4

4. Pitfalls

ANALYSIS PARALYSIS

NO DATA
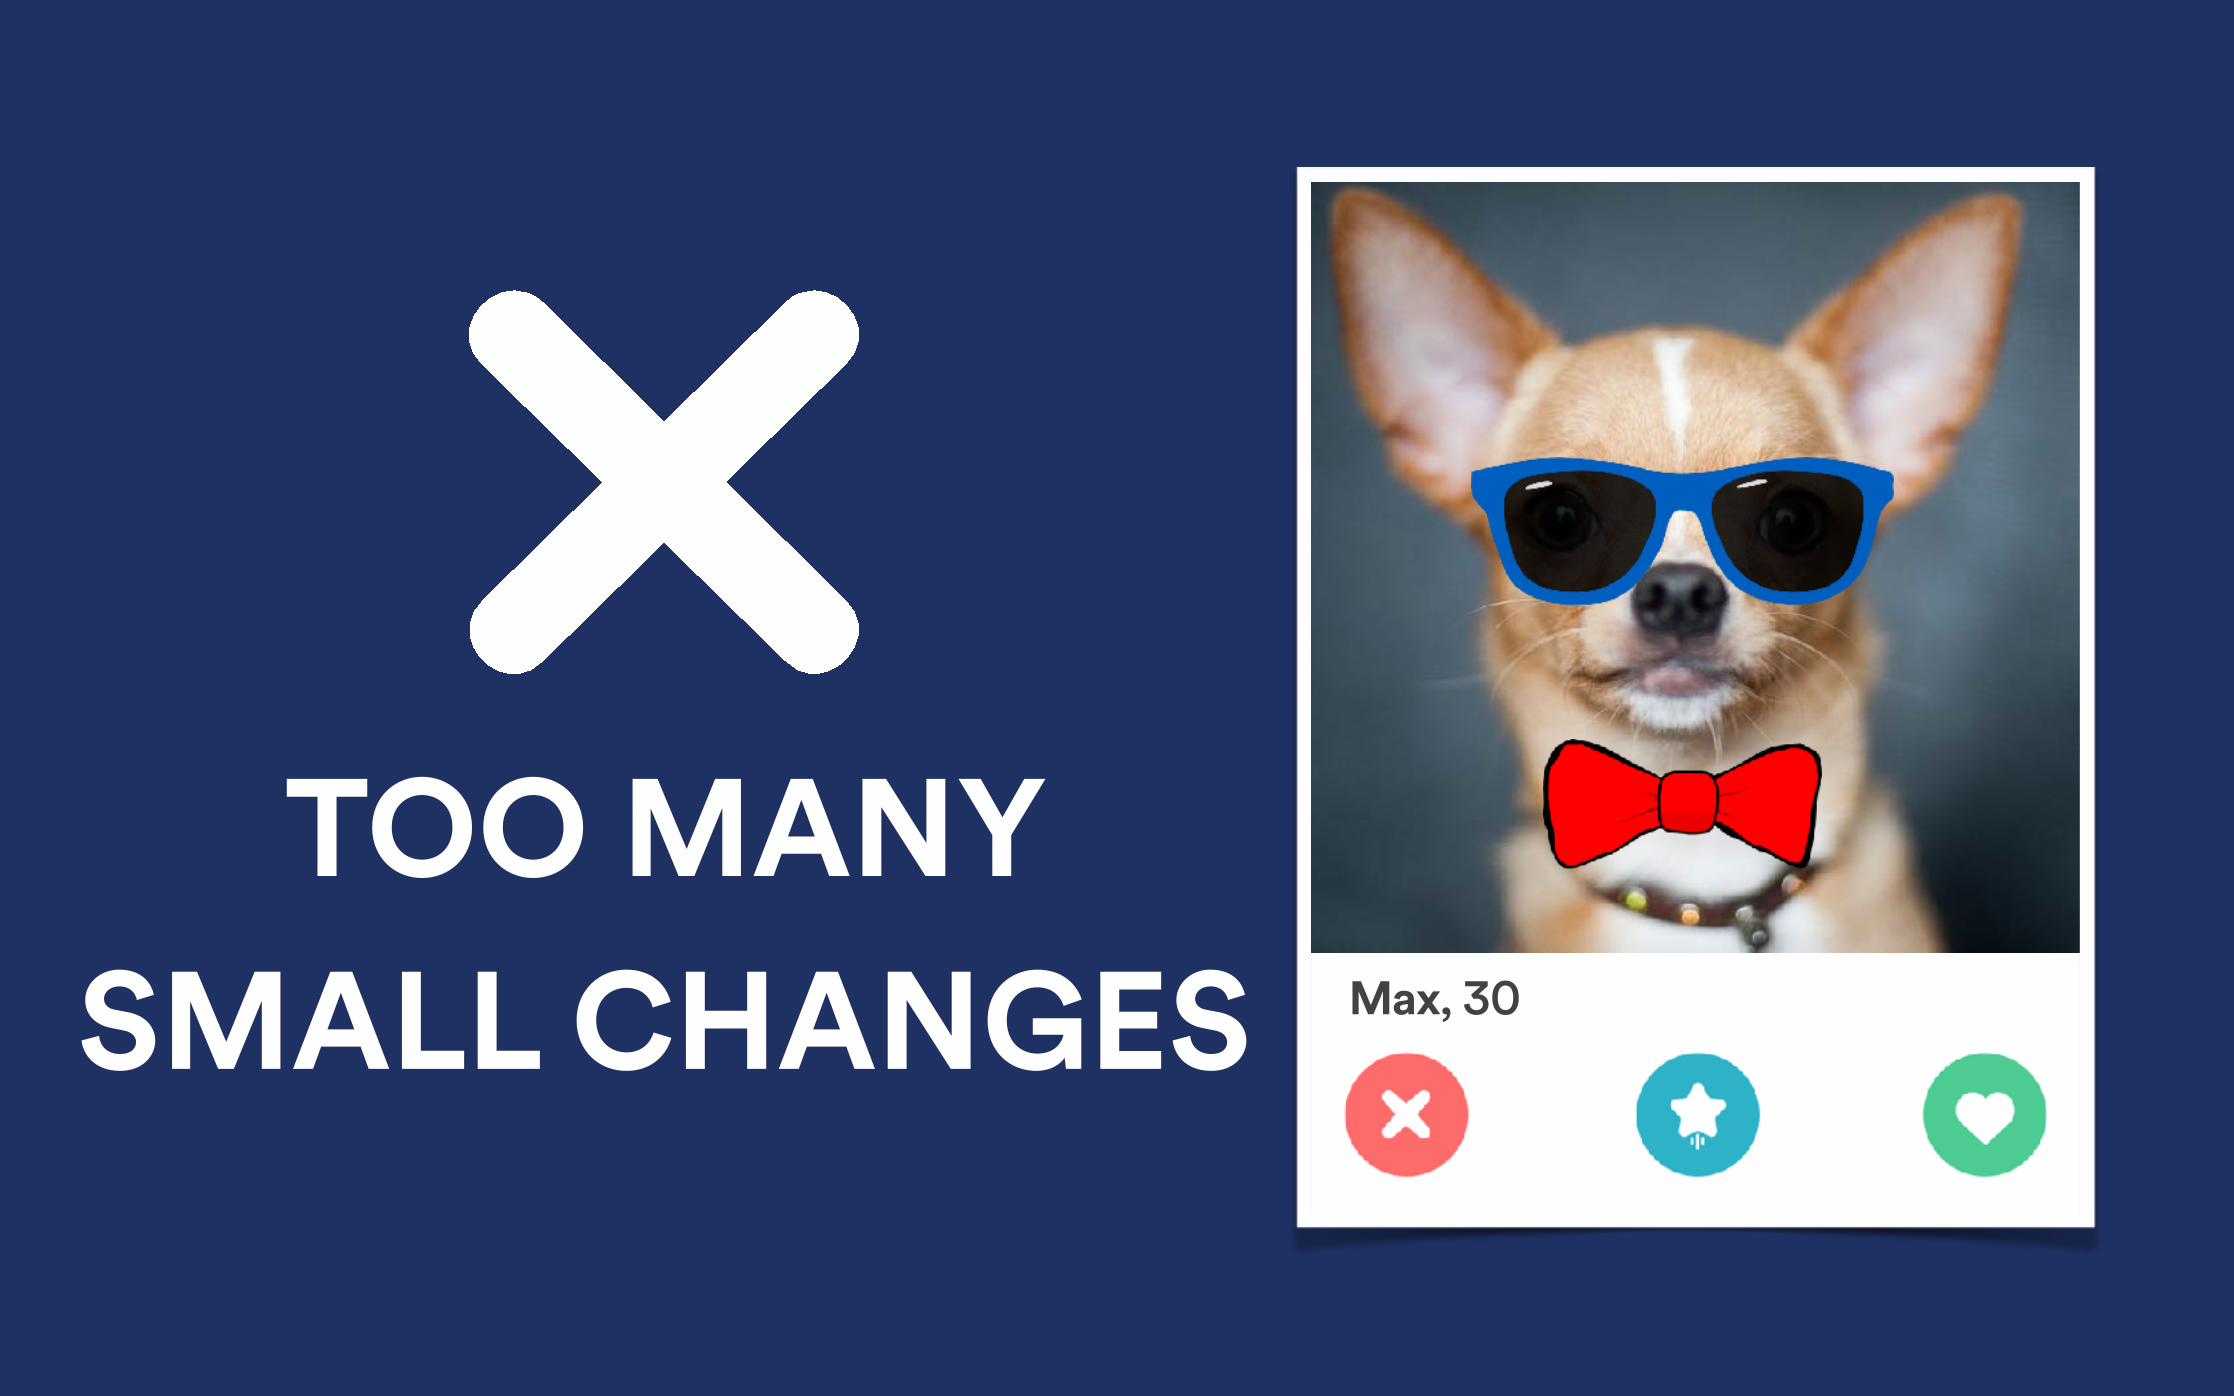
Max, 30
TOO MANY SMALL CHANGES

Max, WOLF AT WALL STREET
TOO MANY SMALL CHANGES

DONTLISTEN TO
YOUR HEART
(LISTEN TO THE DATA)

5. Wrap Up


KNOWLEDGE IS YOUR
ROI

A test is an investment
Design to maximize learning

NEGATIVE RESULTS ARE
STILL POSITIVE(DON’T GIVE UP!)

TRY AB TESTING