Embed Size (px)
Citation preview

Facilitating Student Success Across the P-20 Continuum
Todd Bloom, Ph.D.
September 14, 2012

Welcome & Overview
Hobsons and Insights into Student Choice
Three Macro Forces Influencing P-20
Individualized Learning Plans and States
2

Hobsons & Insights into Student Choice

Hobsons Solutions
4

Career
College
Course
Success
5

Access
Engagement
Consider
Connection
6

Orientate
Advise
Alert
Communicate
7

Naviance by the Numbers
Over 5,500 schools using Naviance today
About 800 middle schools
4.8 million active students
Over 200,000 educators with active accounts
8

College Statistics(Naviance specific)
1,055,000 students in class of 2012
3.4 million college applications tracked in Naviance for class of 2012 (average of 3.2 apps/student – slightly up)
Our public schools averaged 2.7 apps per student (slightly up)
Our private schools averaged 5.5 apps per student (unchanged)
9

Early Action/Decision (Naviance specific)
10

11
#11 to#8

12
Singer and chef have declined

Course Statistics(Naviance specific)
About 18 million course history records
Most common course subject failed is Algebra I (by a 50% margin over any other subject)
Geometry, Biology and English are the next most common
13
Macro Forces Influencing P-20 Education

Global Economic Competitiveness
“The goal for America’s educational system is clear: Every student should graduate from high school ready for college and a career by 2020. We must lead the world in college completion by 2020.” –President Obama
We’re in 16th place, and we’ve heard this before:
1983 – A Nation at Risk (standards)
1994 – Goals 2000 (performance targets)
2001 – No Child Left Behind (accountability)
2009 – ARRA /Race to the Top
15

Global Economic Competitiveness
16
http://chronicle.com/article/A-Crisis-of-Confidence/127530/

Global Economic Competitiveness
Supply & demand challenge:
“In 15 years, the U.S. will be 1,000,000 degreed students short in order to fill U.S. jobs – 1,000,000 good-paying, professional jobs will need to be ‘outsourced’”
–Bruce Vandal, Director, Postsecondary & Workforce Development Institute, Education Commission of the States, 2011
17

Global Economic Competitiveness
18

Cost of Education – Financial Crunch
19
Student Expectations
Accountability for Spend
Cost of College
State Revenue
ARRA State Fiscal Stabilization Funds
Median Family Income
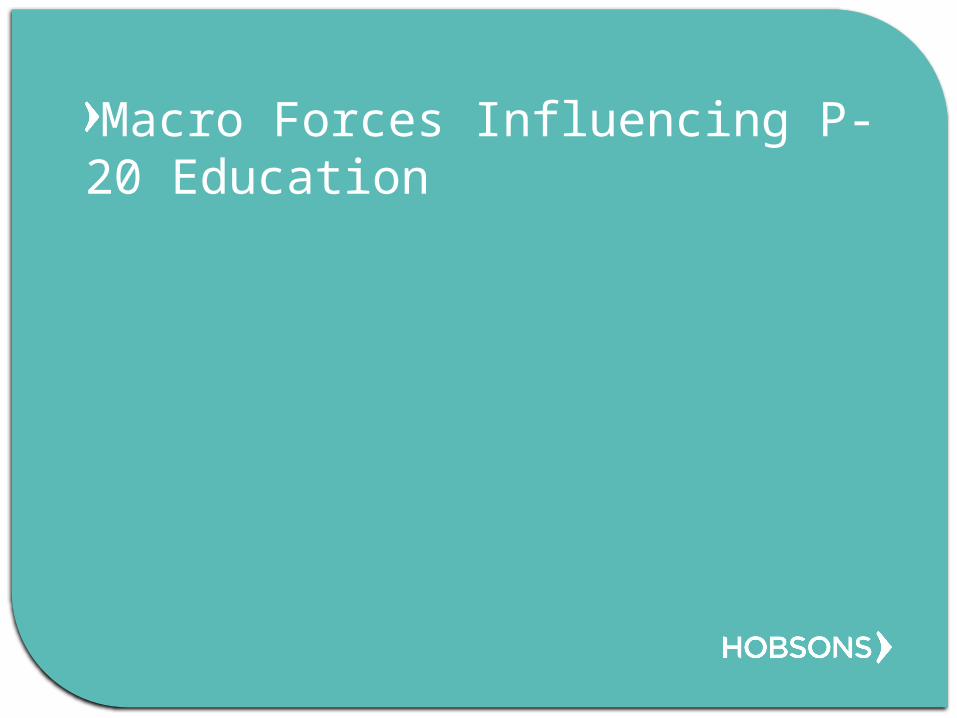
Cost of Education – K-12 Provider
20

Cost of Education – HE Provider
21

Consumer-Driven Education
22
What are these buyers’ preferences and requirements?
17.6 M undergrads in U.S. higher ed today:
32%
Work full-time
36%
Graduate in 4 yrs
37%
Enroll part-time

Consumer-Driven Education
And the customer will “look” different in the future:
K-12 student demographics (2010 to 2020)
flat for students who are White; Black;
increase 25% for students who are Hispanic;
increase 36% for students who are Asian/Pacific Islander
increase 17% for students who are American Indian/Alaska Native
HE student demographics (2010 to 2020)
flat for students who are White; American Indian/Alaska Native
increase 25% for students who are Black;
increase 46% for students who are Hispanic;
increase 25% for students who are Asian/Pacific Islander23

Consumer-Driven Education
Demand for anywhere, anytime learning:
24
10 Billion Mobile Devices
1 Billion Tweets/week
2 Billion Videos per day
on YouTube

Macro Forces and Policy
25
K-12 Postsecondary
• Common Core State Standards
• Common state assessments
• Student growth monitoring and engagement
• Teacher and principal effectiveness
• Statewide P-20 data systems
• Individualized Learning Plans
• Emphasis on college completion and “gainful employment”
• Shifting finance models in response to decreased state funding (Obama efficiency demand)
• SROI of remediation
• Instructor effectiveness
• Student “recovery”
RttT “carrot” … Waiver “carrot/stick” … ESEA “stick”

State policy & individualized student learning

Strong Message: Personalize Learning
27
Hobsons 2011 P-20 Summit
“No org has been able to successfully assemble data to facilitate the career-education trajectory”
“Too many students see $ as THE roadblock to postsecondary ed”
“TurboTax or Mint.com for ed decision-making”
“Consistent solution throughout P-20 – sticky”
“Enable students to start their HE path earlier, if ready…dual enrollment”
[Sample Board Members: Ron Huberman, JB Buxton, Margot Rogers, Larry Leverett, Eric Fingerhut, Bob Ptachik, Andy Rotherham, Barbara O’Brian]

Individualized Learning Plan
The ILP and state policy:
25 states & D.C. mandate ILPs
3 states mandate a guidance framework (no formal
planning document)
22 states do not have a mandate, but
9 provide ILP models
13 provide a guidance framework for districts to use
Hobsons ILP report: http://www.hobsons.com/education-trends/resource-center/industry-
reports/
28

Typical ILP Components
Academic PlanningCareer Planning (career exploration, goal setting, resume
builder)Regular ILP updates/sharing/review (annually is most
common)Personal reflectionsPersonality and learning style assessmentsService learning captureLink to learning support servicesPortfolio
29

Best Practices for ILP Implementation
ILPs that engage students:
Emphasize the individual in the ILP
Student learns about own learning strengths and needs
Student has tools to explore academic, career and personal
interests and to make goals
Student owns planning, learning and outcomes
Create a support team for each student
Parental/Guardian involvement
Involve all appropriate staff in planning process
Connect student to learning resources
Peer support
30
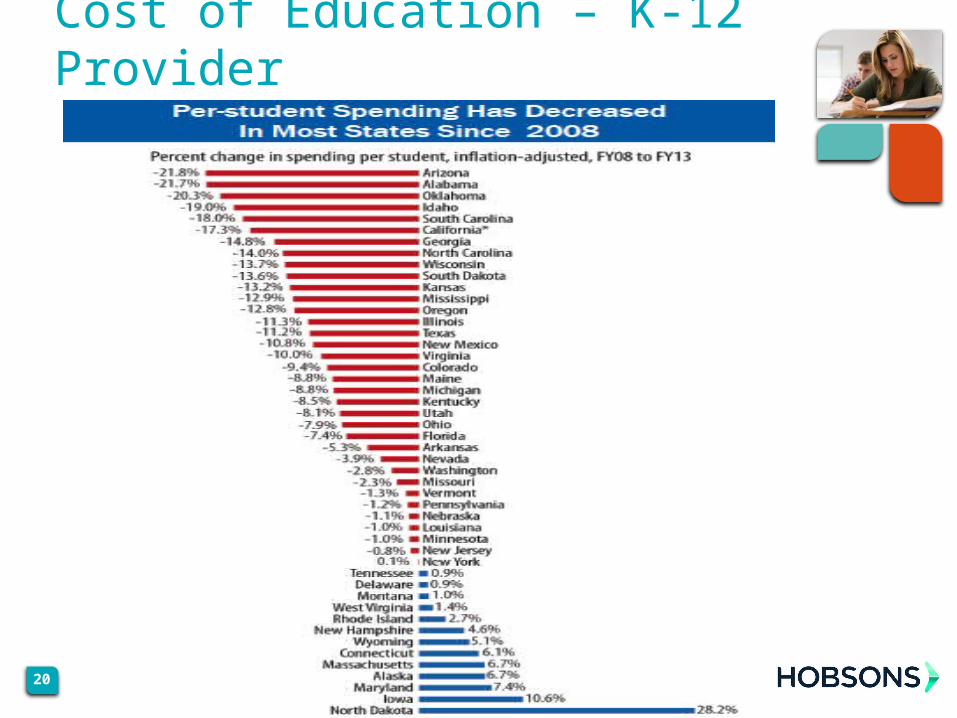
Future Trends
31
Closer connection with SIS >> data analysis
Beginning planning sooner >> 6th grade or earlier

Future Trends
32
Develop curriculum around ILP development
Planning process as tool for family engagement
Every student >> a comprehensive support network

Discussion

How Does Florida’s ePEP Compare with Other States?
Like other states, ePEP focuses on appropriate
courses for graduation & career interests.
Questions:
How do students gain ownership of their ePEP?
How are students encouraged to reach academically?
What are the mechanisms to promote parent/guardian
involvement in this process?
34