Embed Size (px)
DESCRIPTION
Coastal Geologic Hazards and Sea-Level Rise: Climate Change in Rhode Island This presentation was given at the Shoreline Change SAMP Stakeholder Meeting on April 4th, 2013 by Jon C. Boothroyd (Rhode Island Geological Survey and Department of Geosciences, University of Rhode Island) and Bryan A. Oakley (Environmental Earth Science Department, Eastern Connecticut State University).
Citation preview
COASTAL GEOLOGIC HAZARDS
AND SEA-LEVEL RISE:
CLIMATE CHANGE IN RHODE ISLAND
Shoreline Change SAMP Stakeholders Meeting 4 April 2013
Jon C. Boothroyd1,2and Bryan A. Oakley3
(1) Rhode Island Geological Survey
(2) Department of Geosciences, University of Rhode Island, Kingston RI 02881
(3) Environmental Earth Science Department, Eastern Connecticut State
University, Willimantic, CT 06226
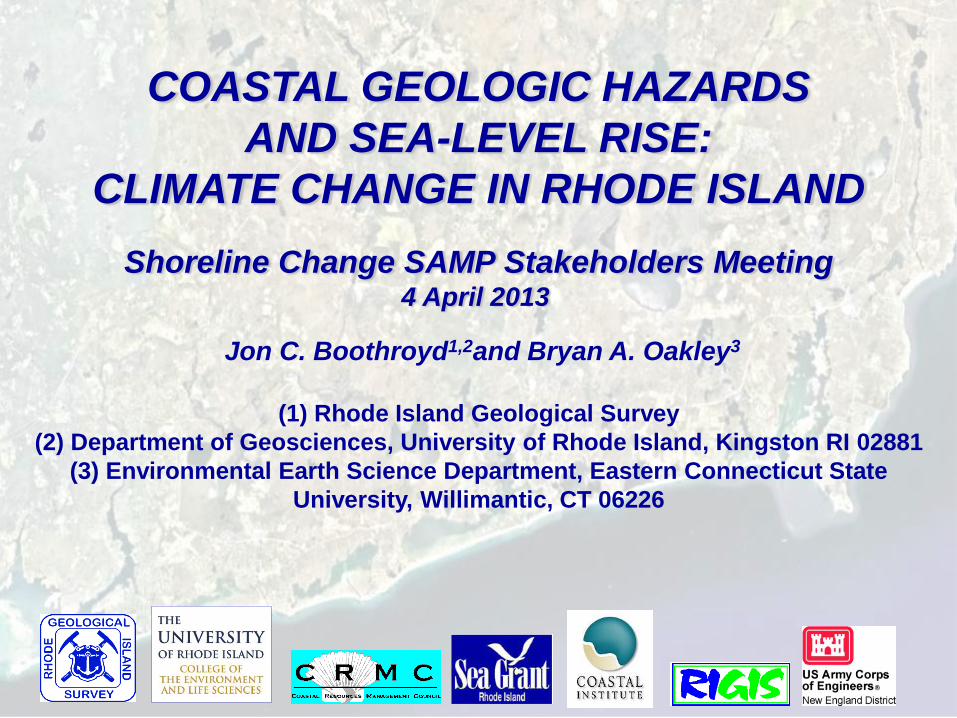
Summary for Rhode Island:
• Glacial Geology, Past and Present,
the Underlying Key to Understanding Processes and
Products
• Storms the Most Important Driver in Coastal Change
Sea-Level Rise a Secondary Effect
• Shoreface Sediment Transport Not Well Understood
at Present
• Future Major Storms Combined With Sea-Level Rise
a Very Large Problem
• Accelerated Sea-Level Rise Resulting in Inundation
also a Very Large Potential Problem
• RICRMC Planning for a 3-5 foot Rise by 2100 and a
1.5 foot Rise by 2050
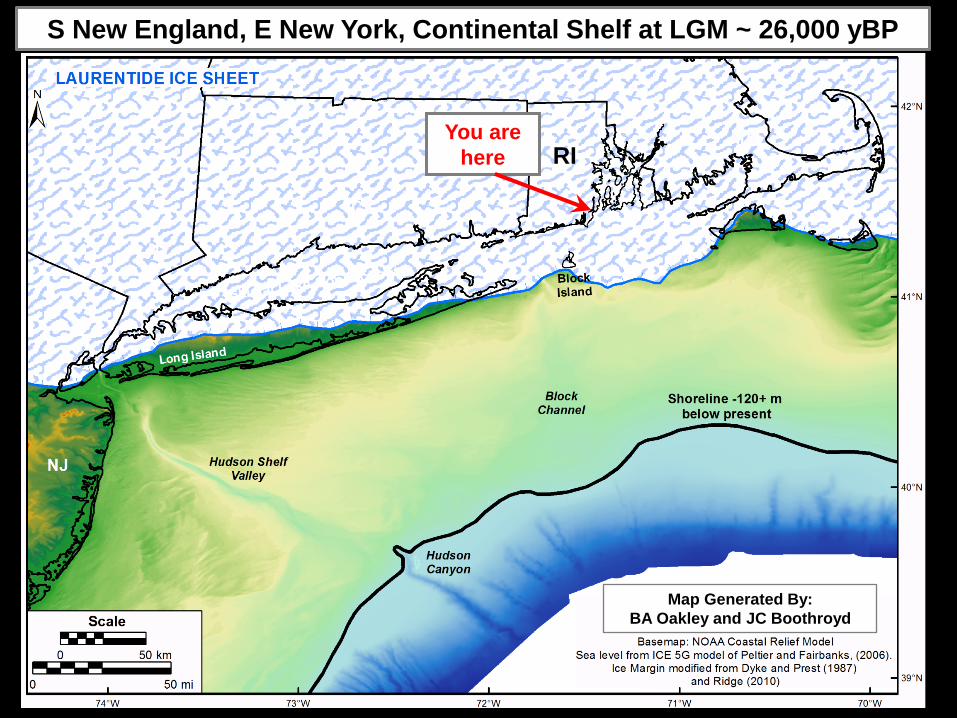
Map Generated By:
BA Oakley and JC Boothroyd
S New England, E New York, Continental Shelf at LGM ~ 26,000 yBP
You are
here RI
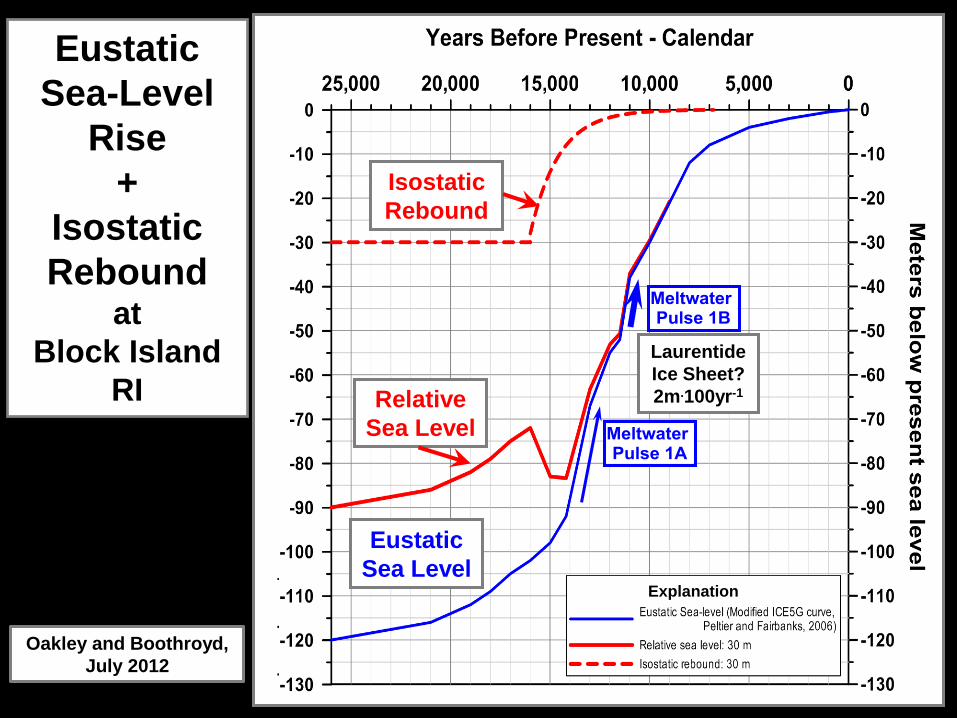
Eustatic
Sea-Level
Rise
+
Isostatic
Rebound at
Block Island
RI
Antarctic Ice
Sheet?
2-5m.100yr-1
Laurentide
Ice Sheet?
2m.100yr-1 Laurentide
Ice Sheet?
2m.100yr-1
Explanation
Oakley and Boothroyd,
July 2012
Isostatic
Rebound
Relative
Sea Level
Eustatic
Sea Level
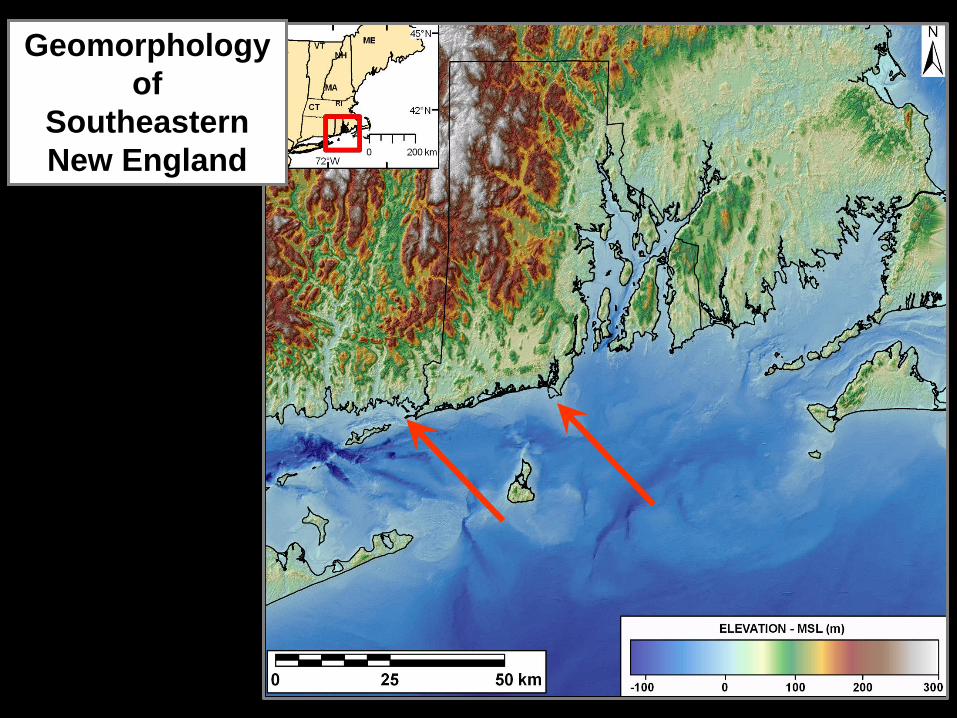
Geomorphology
of
Southeastern
New England
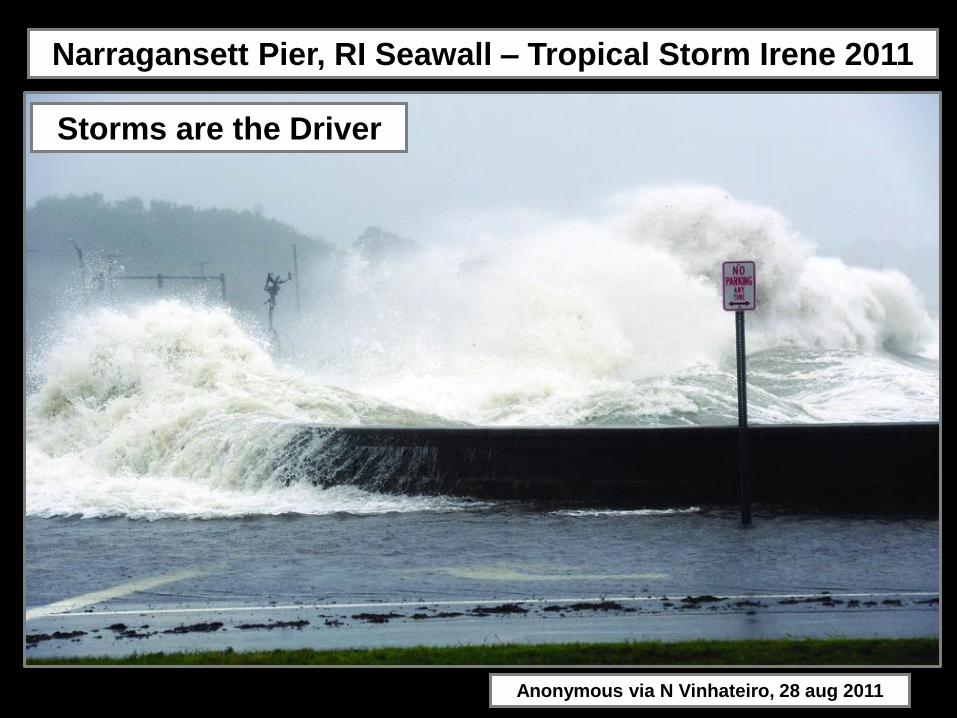
Narragansett Pier, RI Seawall – Tropical Storm Irene 2011
Anonymous via N Vinhateiro, 28 aug 2011
Storms are the Driver
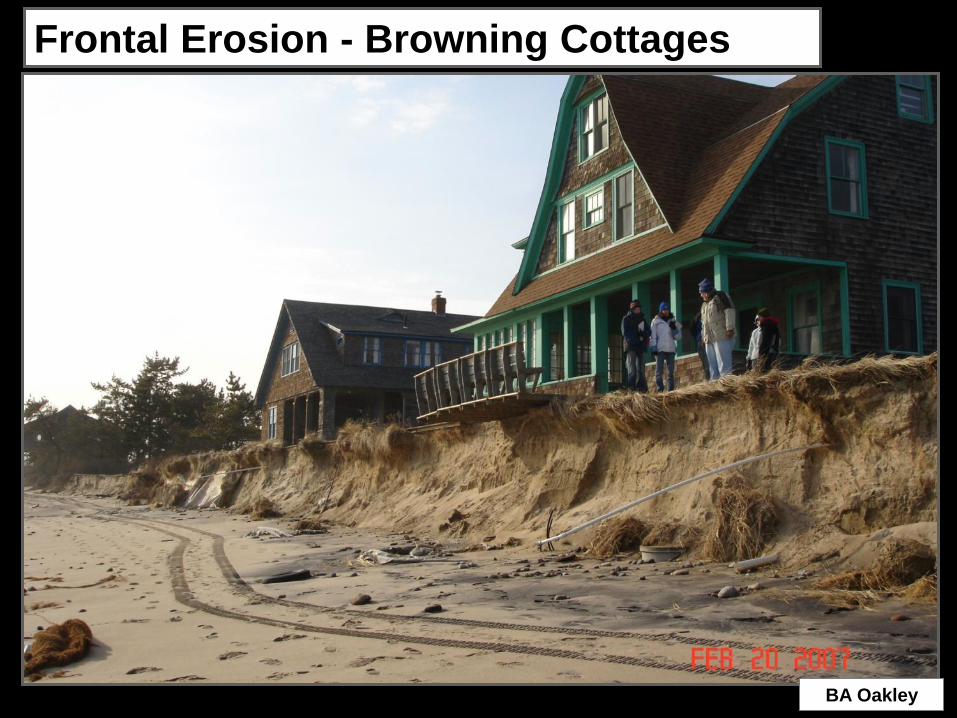
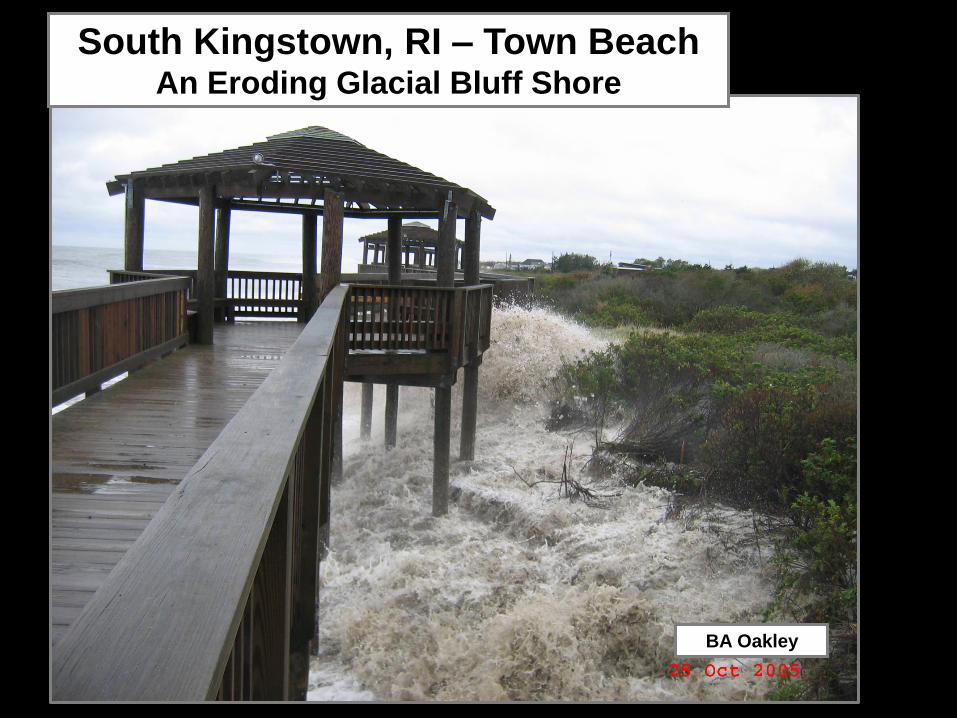
BA Oakley
Frontal Erosion - Browning Cottages
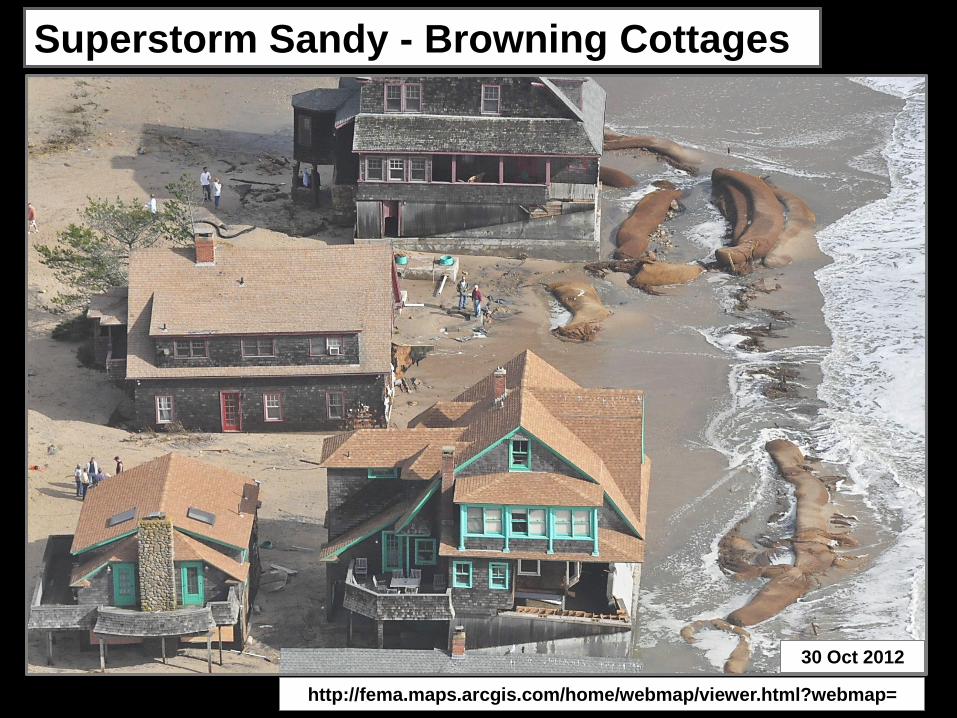
Superstorm Sandy - Browning Cottages
30 Oct 2012
http://fema.maps.arcgis.com/home/webmap/viewer.html?webmap=
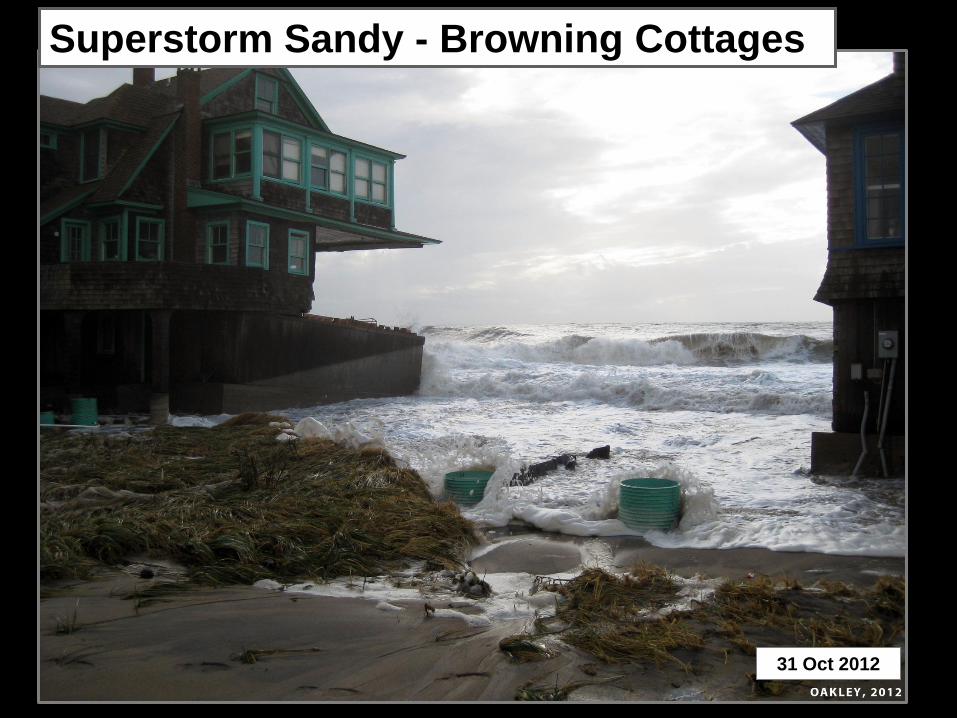
Superstorm Sandy - Browning Cottages
31 Oct 2012
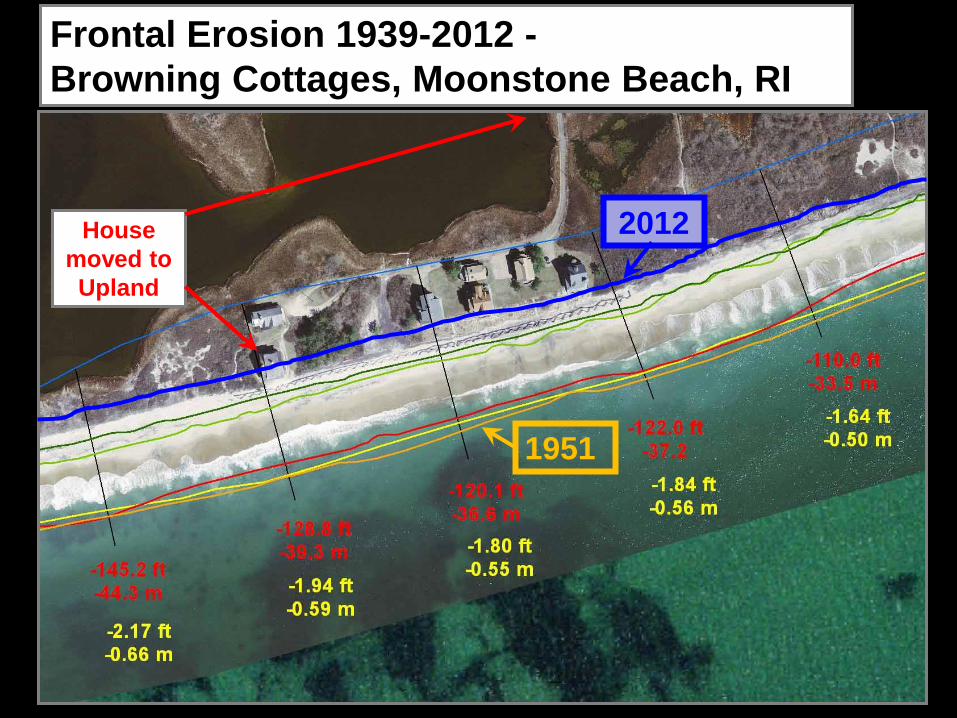
Frontal Erosion 1939-2012 -
Browning Cottages, Moonstone Beach, RI
1951
2012 House
moved to
Upland
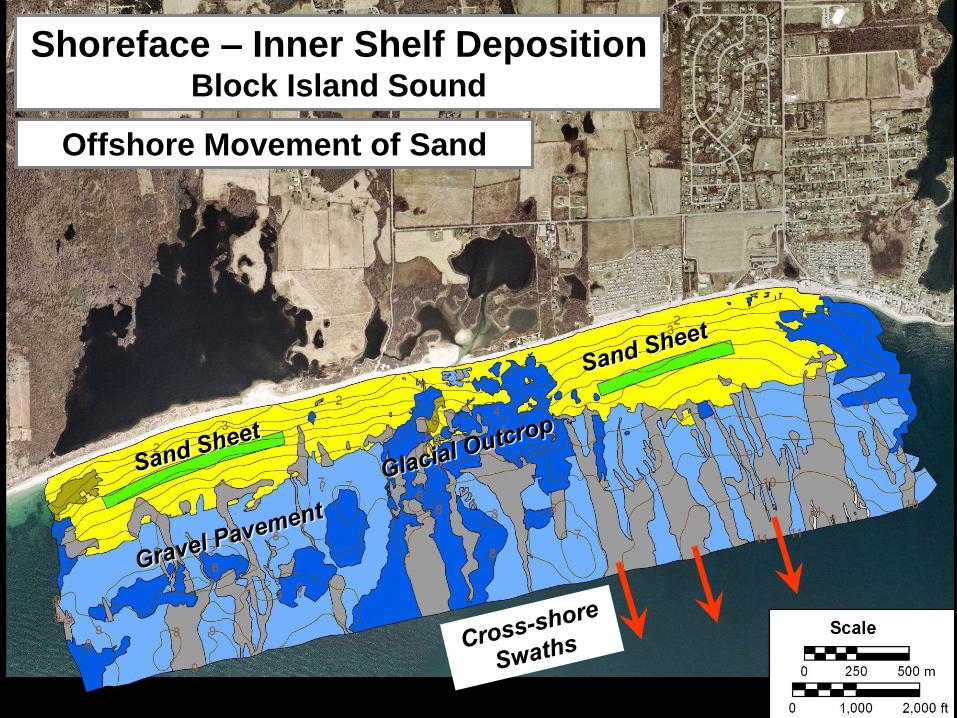
Offshore Movement of Sand
Shoreface – Inner Shelf Deposition Block Island Sound
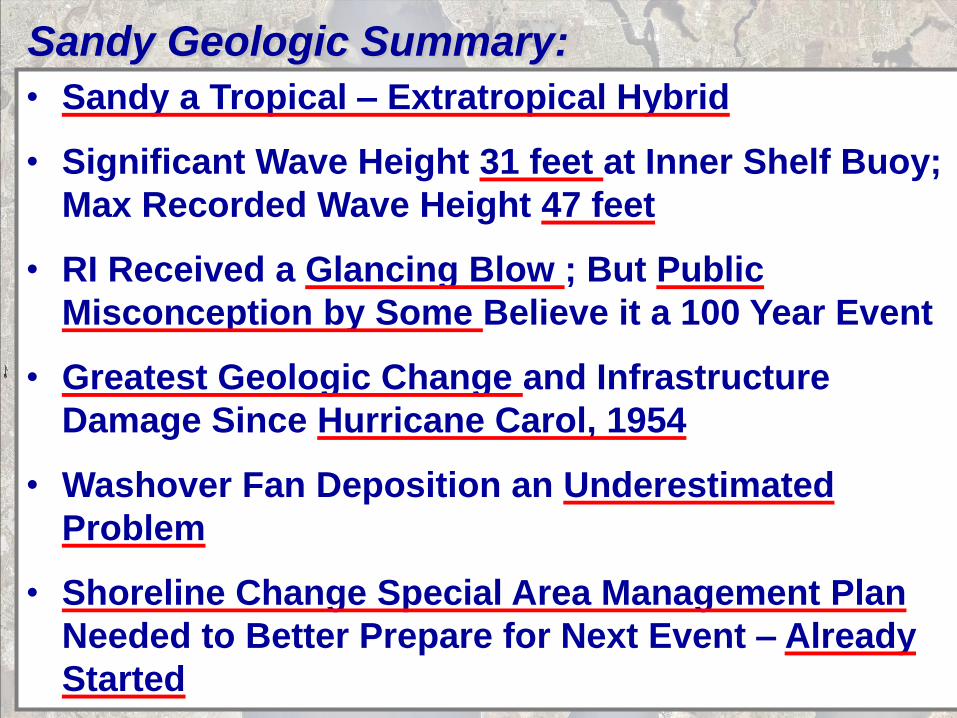
Sandy Geologic Summary:
• Sandy a Tropical – Extratropical Hybrid
• Significant Wave Height 31 feet at Inner Shelf Buoy;
Max Recorded Wave Height 47 feet
• RI Received a Glancing Blow ; But Public
Misconception by Some Believe it a 100 Year Event
• Greatest Geologic Change and Infrastructure
Damage Since Hurricane Carol, 1954
• Washover Fan Deposition an Underestimated
Problem
• Shoreline Change Special Area Management Plan
Needed to Better Prepare for Next Event – Already
Started
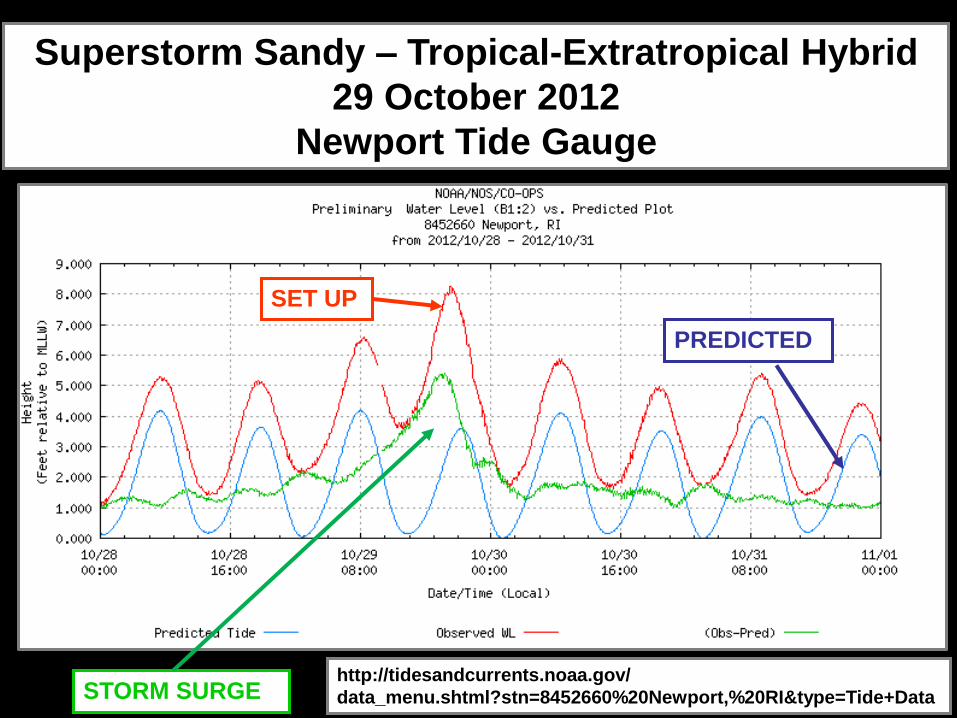
http://tidesandcurrents.noaa.gov/
data_menu.shtml?stn=8452660%20Newport,%20RI&type=Tide+Data STORM SURGE
PREDICTED
SET UP
Superstorm Sandy – Tropical-Extratropical Hybrid
29 October 2012
Newport Tide Gauge
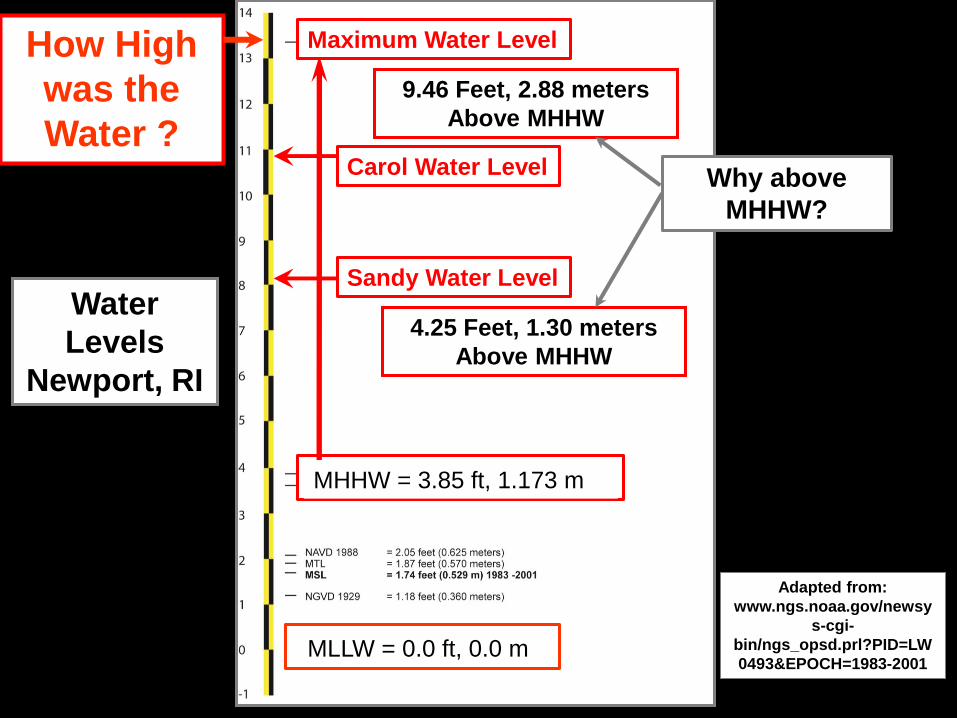
Water
Levels
Newport, RI
How High
was the
Water ? Boothroyd and
Hehre 2008
Adapted from:
www.ngs.noaa.gov/newsy
s-cgi-
bin/ngs_opsd.prl?PID=LW
0493&EPOCH=1983-2001
MHHW = 3.85 ft, 1.173 m
MLLW = 0.0 ft, 0.0 m
9.46 Feet, 2.88 meters
Above MHHW
Maximum Water Level
Why above
MHHW?
Sandy Water Level
4.25 Feet, 1.30 meters
Above MHHW
Carol Water Level
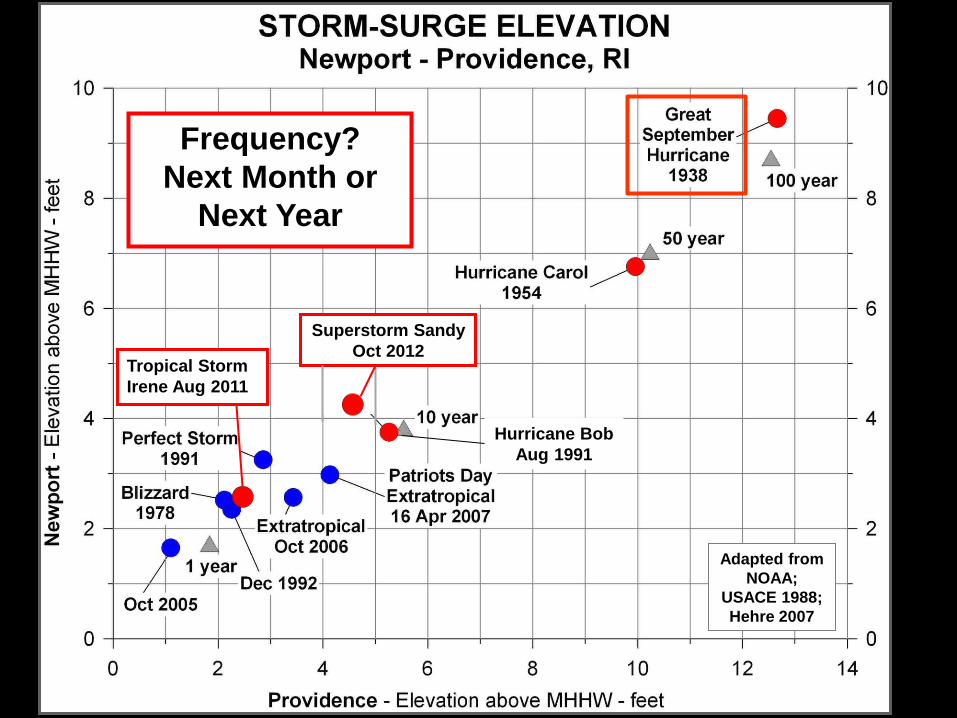
Frequency?
Next Month or
Next Year
Tropical Storm
Irene Aug 2011
Adapted from
NOAA;
USACE 1988;
Hehre 2007
Superstorm Sandy
Oct 2012
Hurricane Bob
Aug 1991
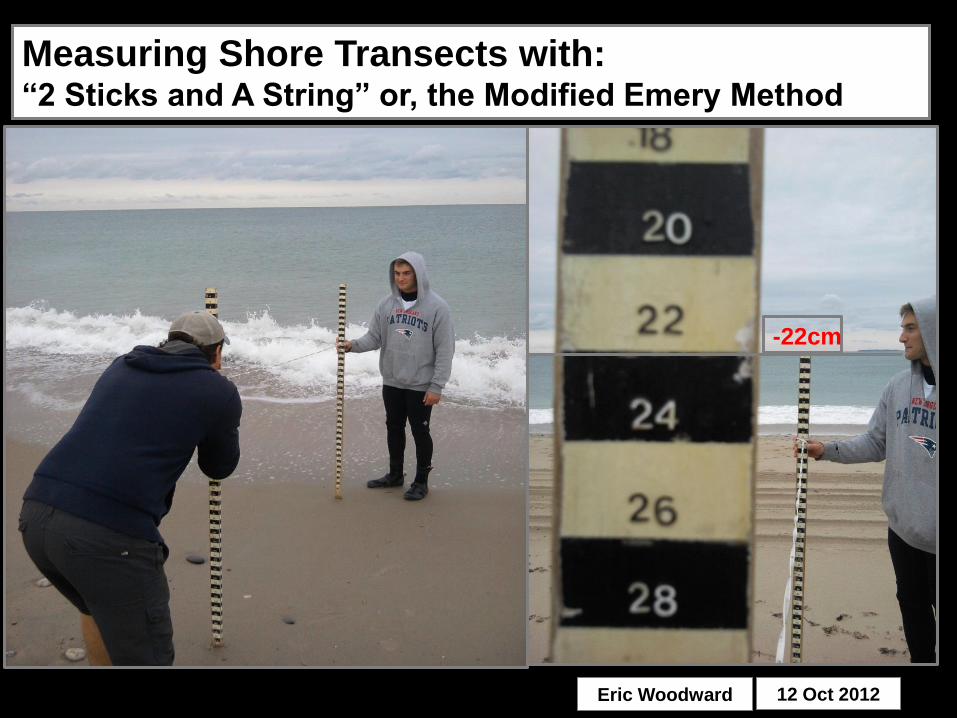
-22cm
Measuring Shore Transects with: “2 Sticks and A String” or, the Modified Emery Method
Eric Woodward 12 Oct 2012
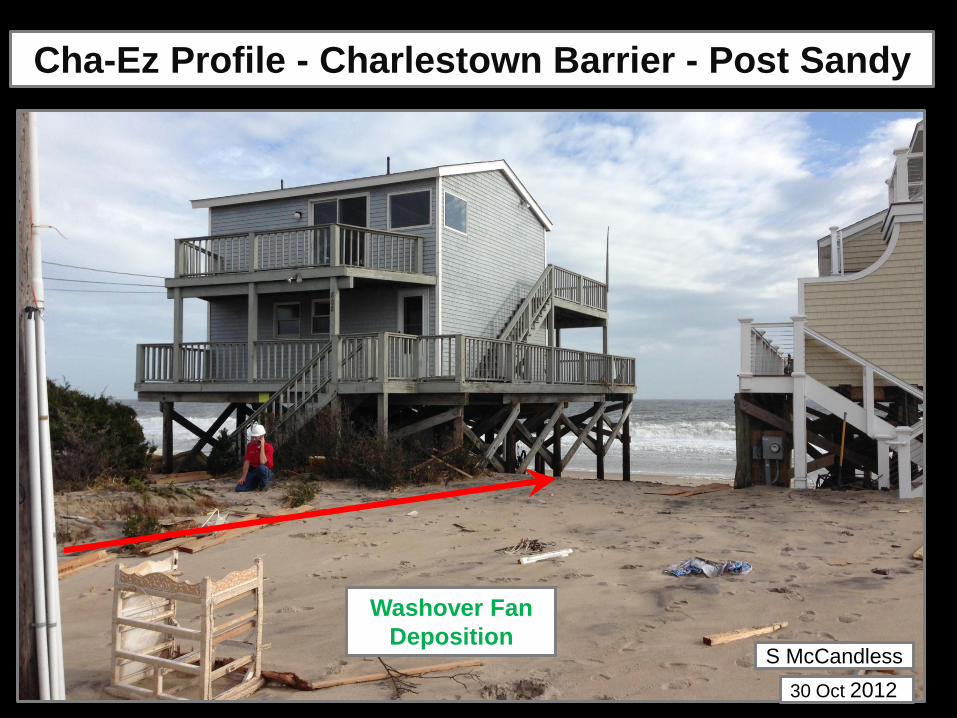
Cha-Ez Profile - Charlestown Barrier - Post Sandy
S McCandless
30 Oct 2012
Washover Fan
Deposition
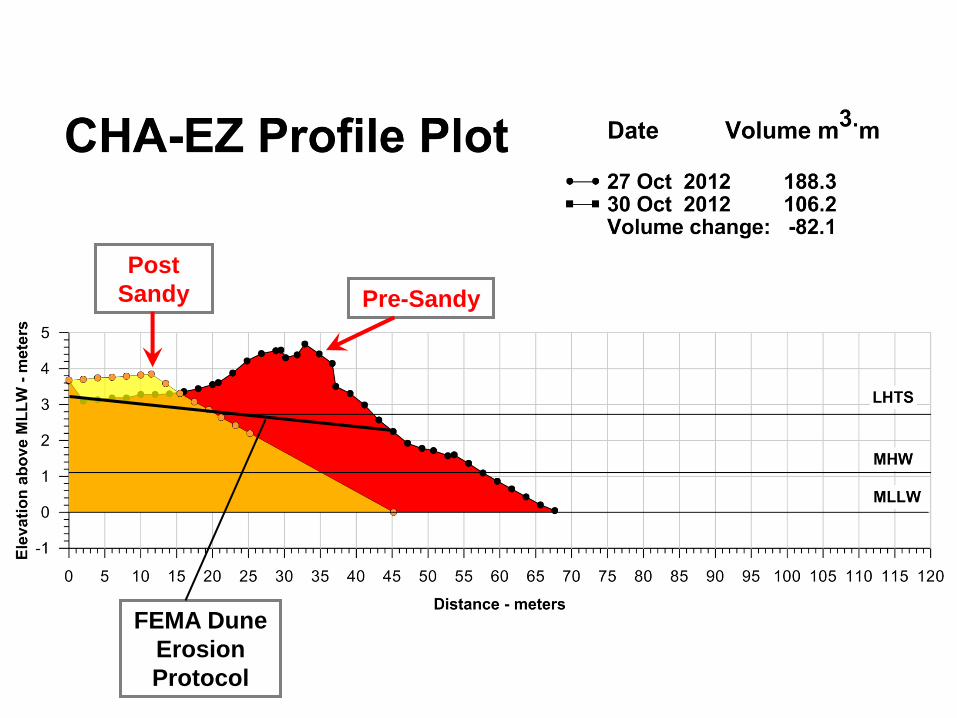
Post
Sandy Pre-Sandy
FEMA Dune
Erosion
Protocol
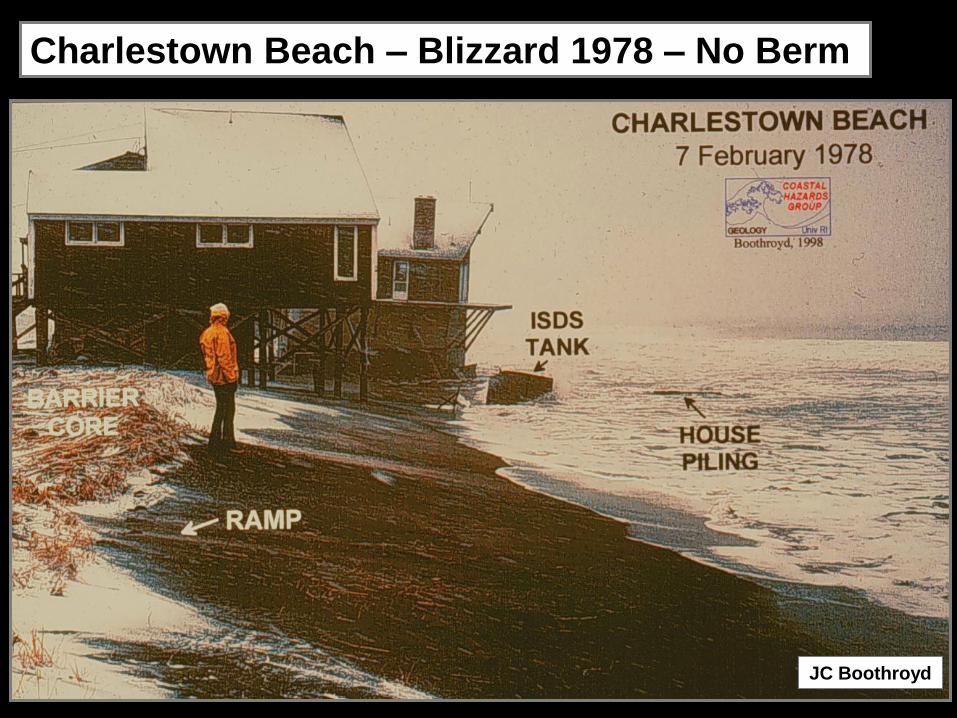
Charlestown Beach – Blizzard 1978 – No Berm
JC Boothroyd
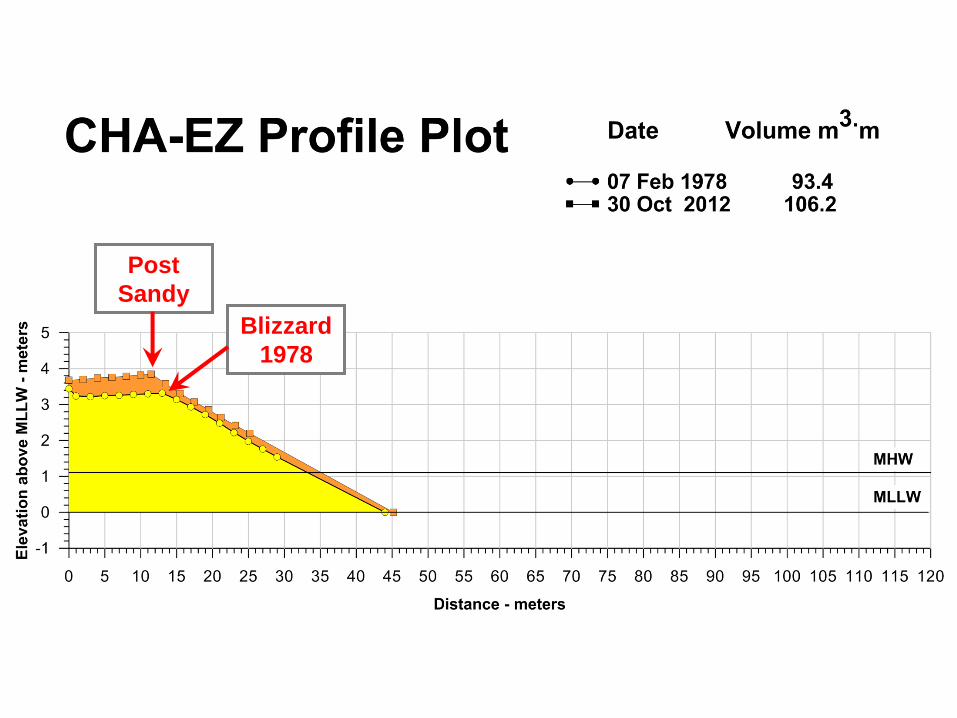
Post
Sandy
Blizzard
1978
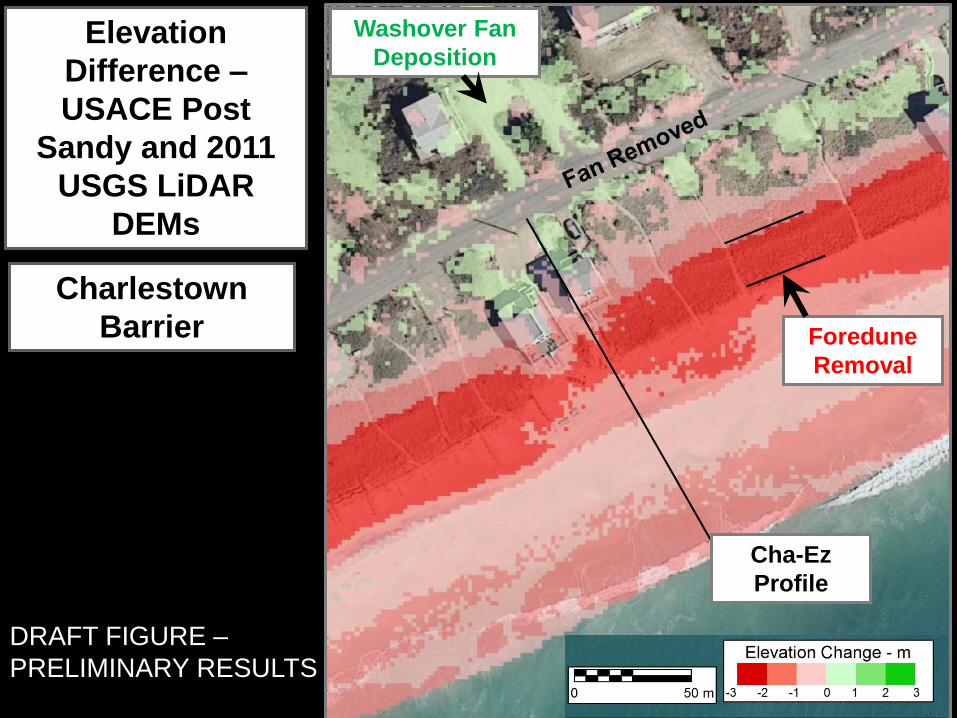
DRAFT FIGURE –
PRELIMINARY RESULTS
Elevation
Difference –
USACE Post
Sandy and 2011
USGS LiDAR
DEMs
Charlestown
Barrier
Cha-Ez
Profile
Foredune
Removal
Washover Fan
Deposition
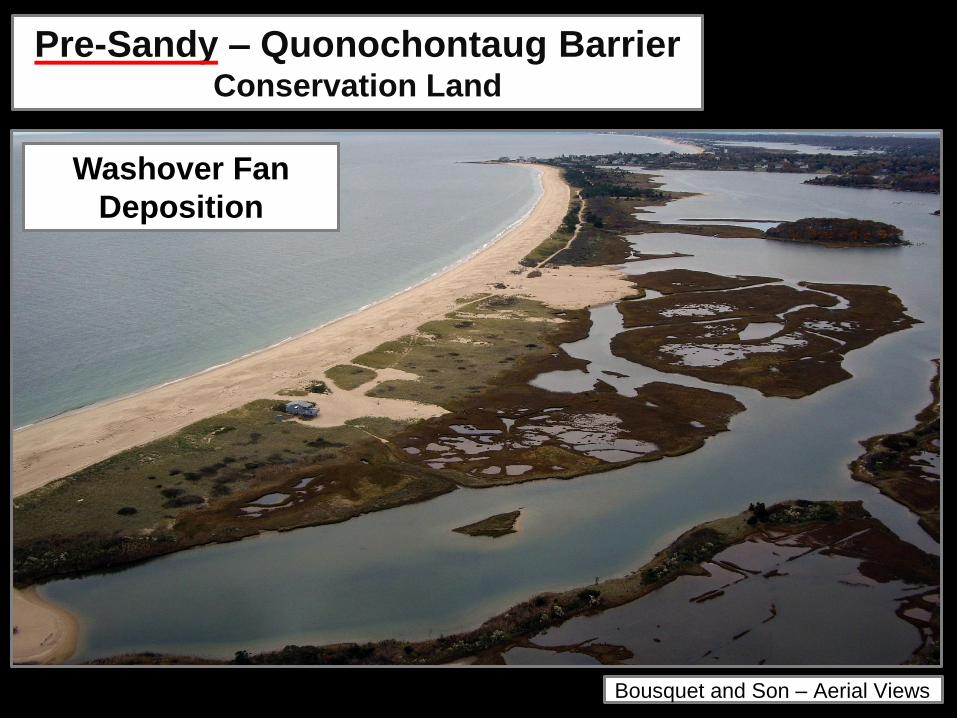
Pre-Sandy – Quonochontaug Barrier Conservation Land
Bousquet and Son – Aerial Views
Washover Fan
Deposition
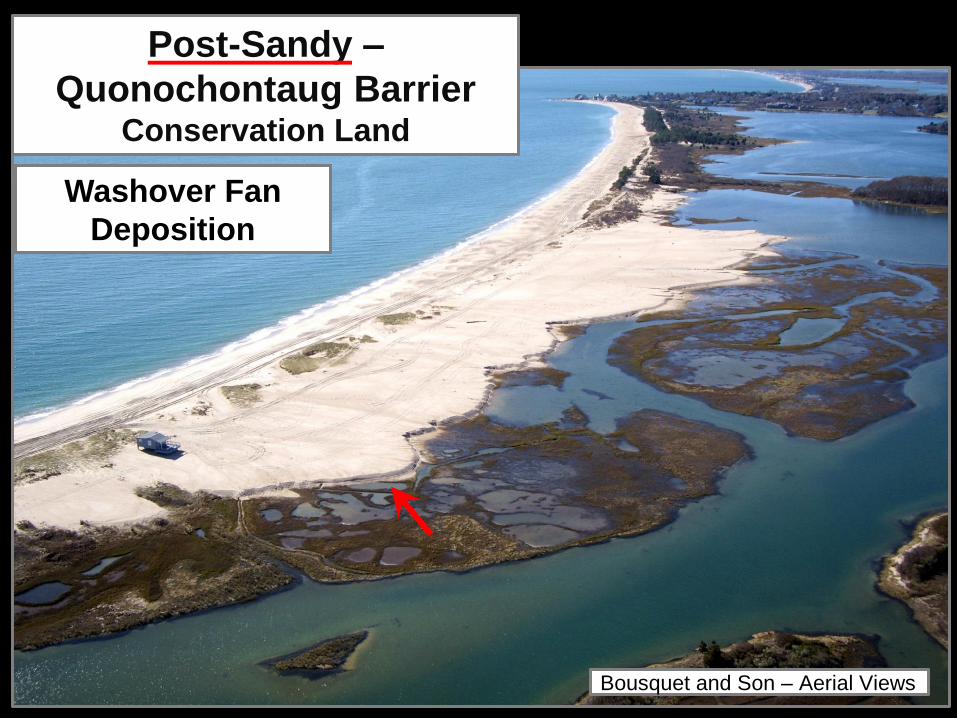
Bousquet and Son – Aerial Views
Post-Sandy –
Quonochontaug Barrier Conservation Land
Washover Fan
Deposition
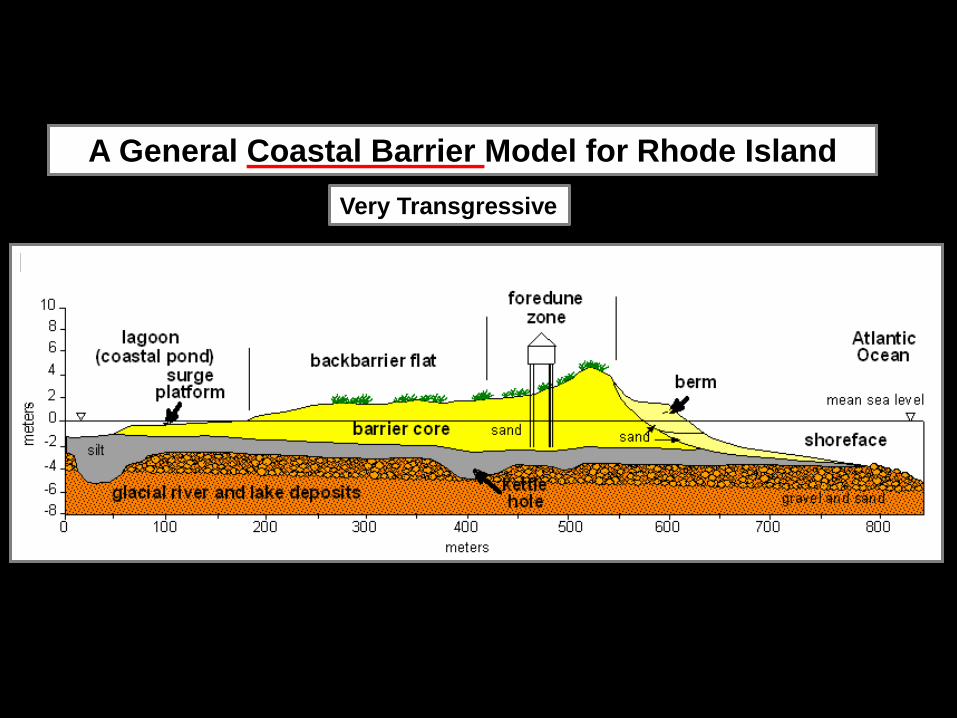
A General Coastal Barrier Model for Rhode Island
Very Transgressive
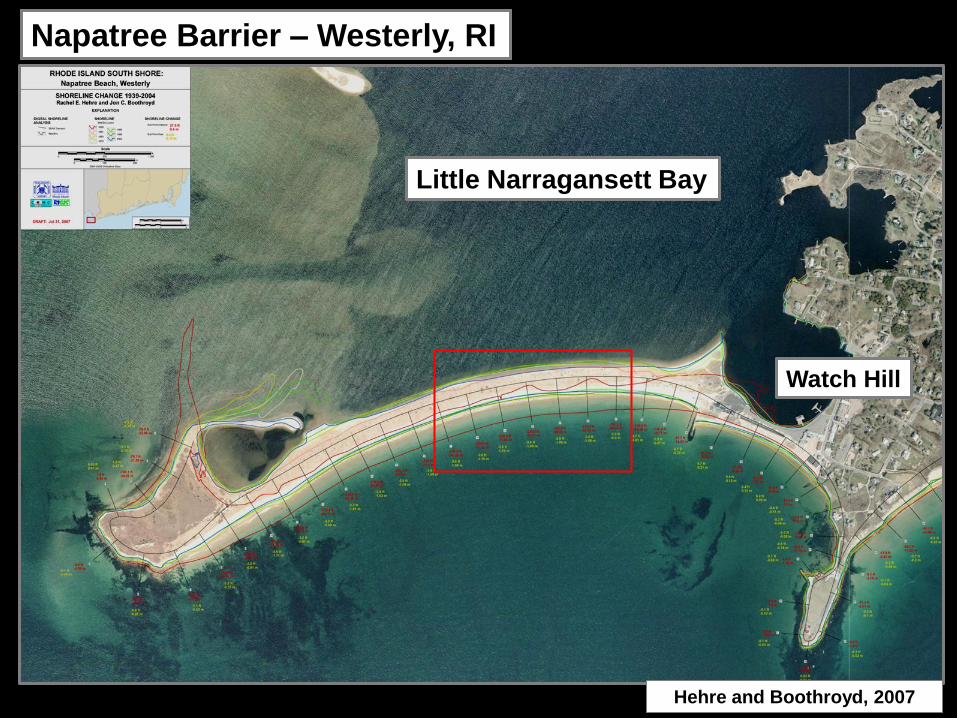
Napatree Barrier – Westerly, RI
Hehre and Boothroyd, 2007
Little Narragansett Bay
Watch Hill
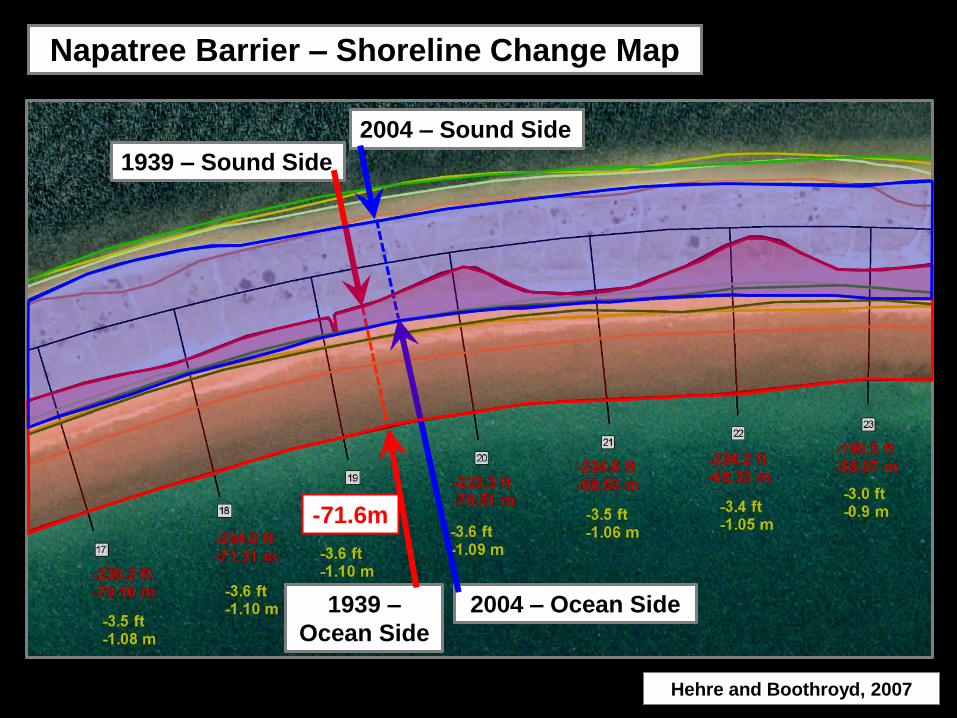
Napatree Barrier – Shoreline Change Map
1939 –
Ocean Side
1939 – Sound Side
2004 – Ocean Side
2004 – Sound Side
Hehre and Boothroyd, 2007
-71.6m
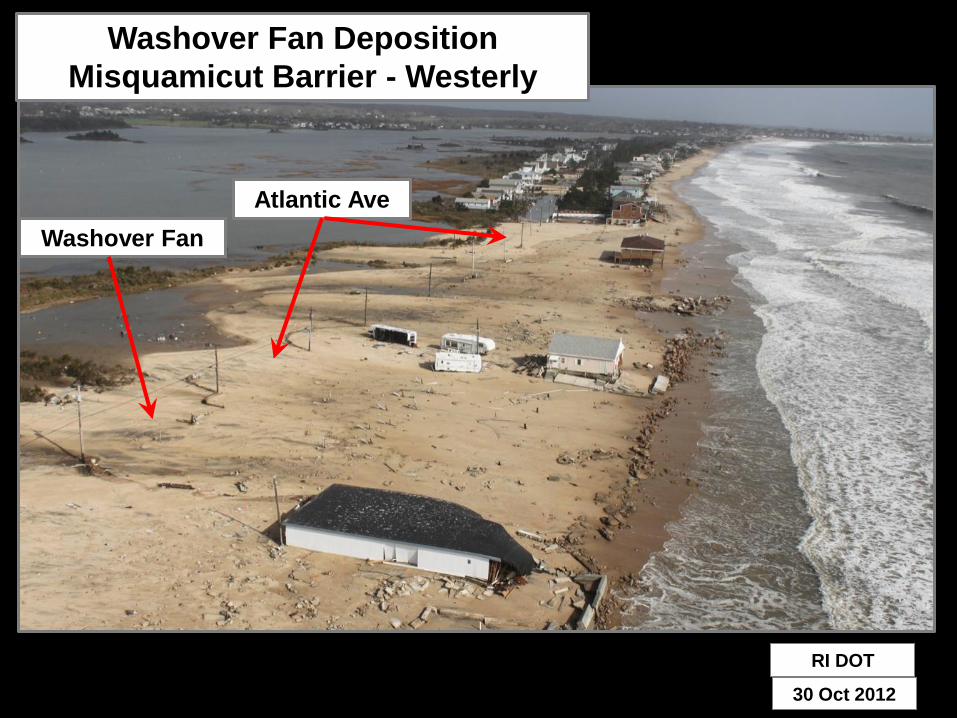
30 Oct 2012
RI DOT
Washover Fan Deposition
Misquamicut Barrier - Westerly
Washover Fan
Atlantic Ave
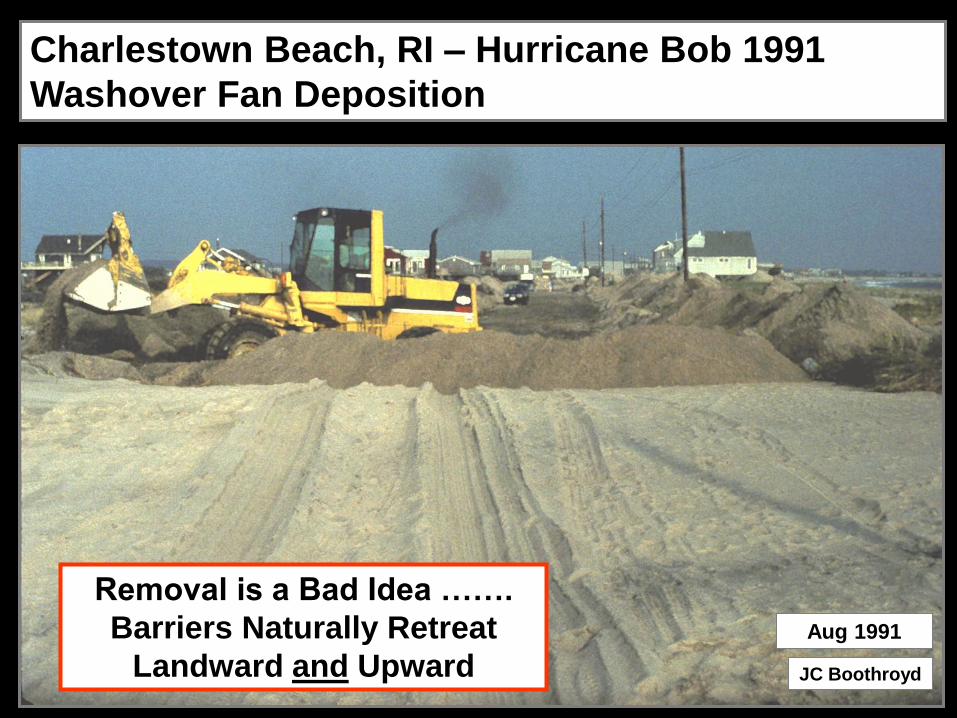
Aug 1991
Charlestown Beach, RI – Hurricane Bob 1991
Washover Fan Deposition
Removal is a Bad Idea …….
Barriers Naturally Retreat
Landward and Upward JC Boothroyd
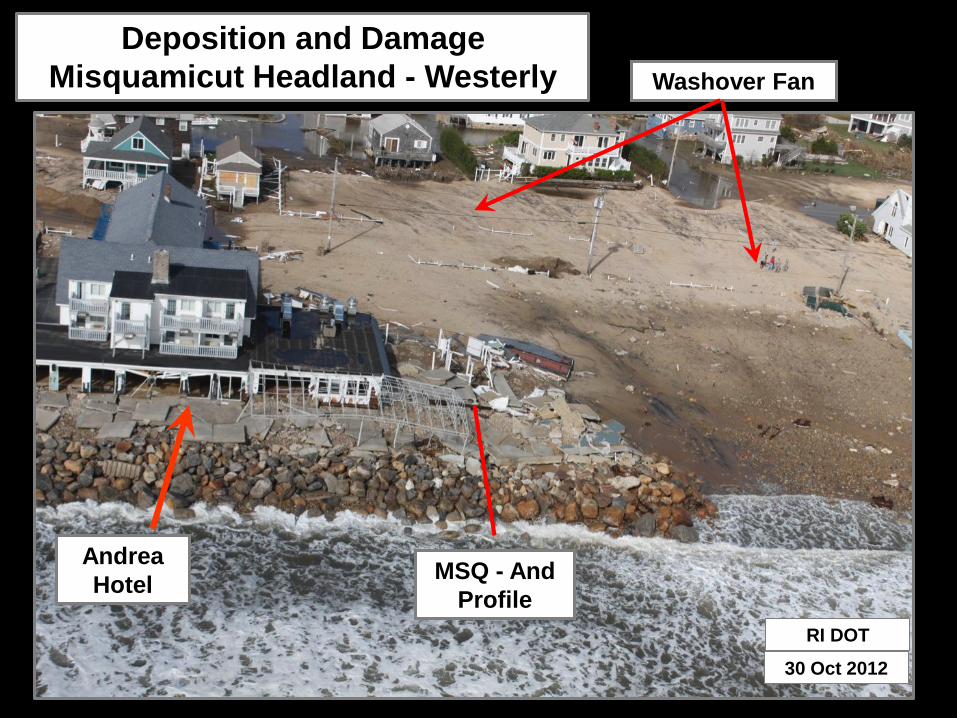
Deposition and Damage
Misquamicut Headland - Westerly
30 Oct 2012
RI DOT
Andrea
Hotel
Washover Fan
MSQ - And
Profile
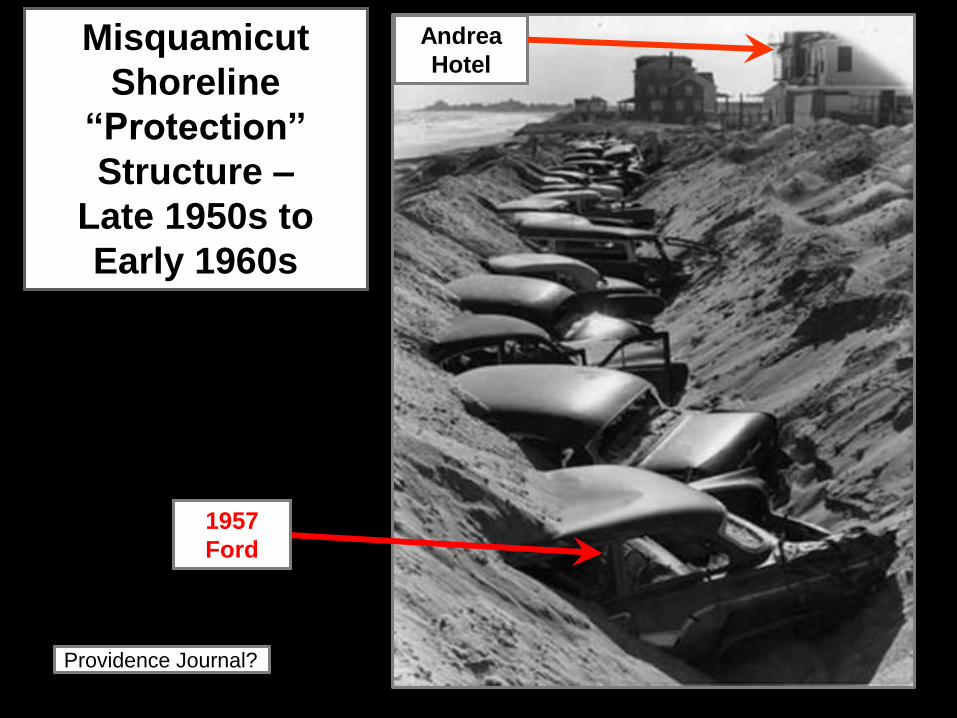
Misquamicut
Shoreline
“Protection”
Structure –
Late 1950s to
Early 1960s
1957
Ford
Providence Journal?
Andrea
Hotel

Frieda Squires, Providence Journal 10 mar 2013
Andrea Hotel - Misquamicut Headland - Westerly
The Managed Retreat Begins
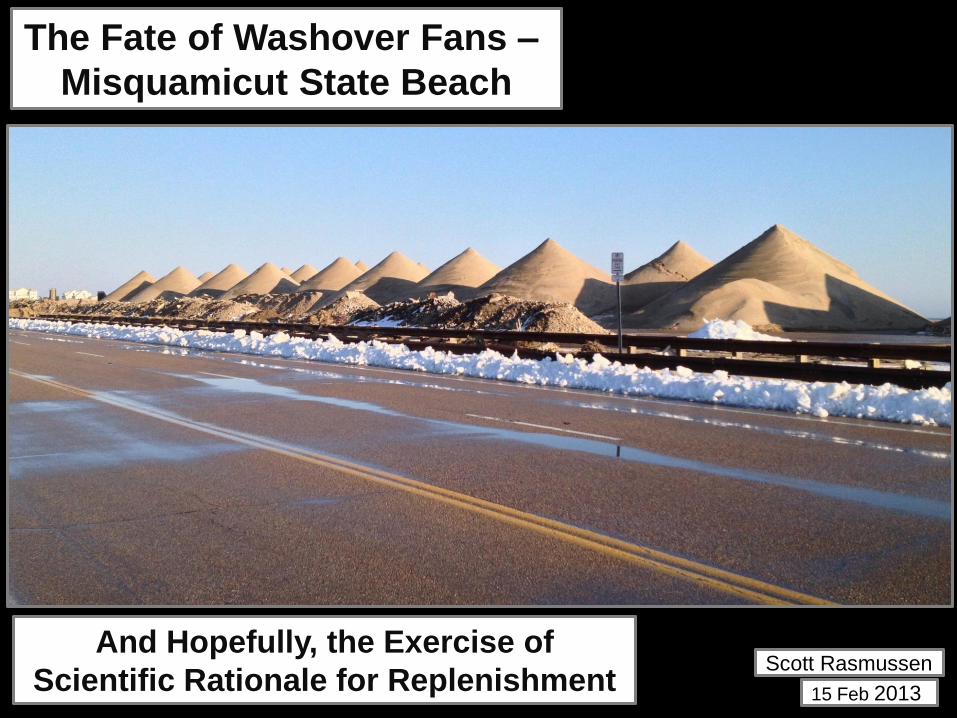
Scott Rasmussen
15 Feb 2013
The Fate of Washover Fans –
Misquamicut State Beach
And Hopefully, the Exercise of
Scientific Rationale for Replenishment
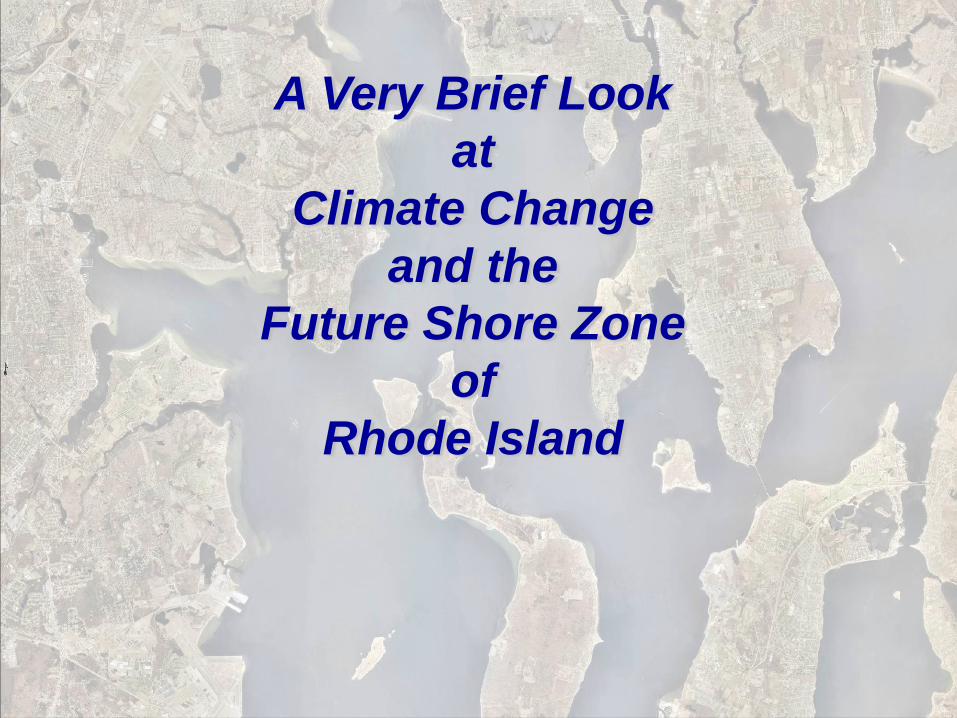
A Very Brief Look
at
Climate Change
and the
Future Shore Zone
of
Rhode Island
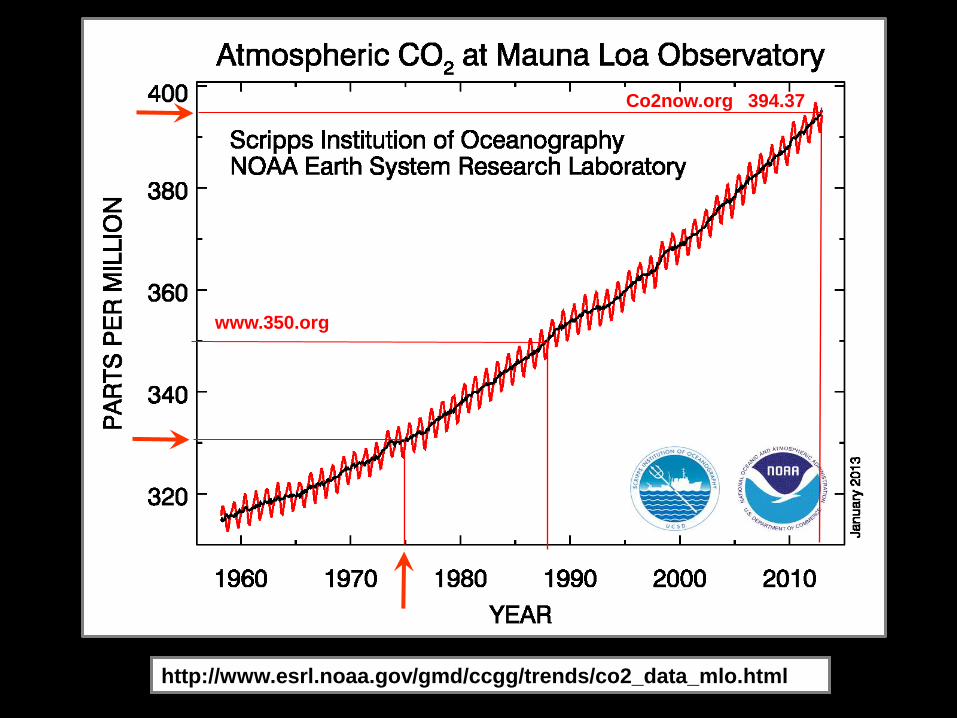
http://www.esrl.noaa.gov/gmd/ccgg/trends/co2_data_mlo.html
Co2now.org 394.37
www.350.org
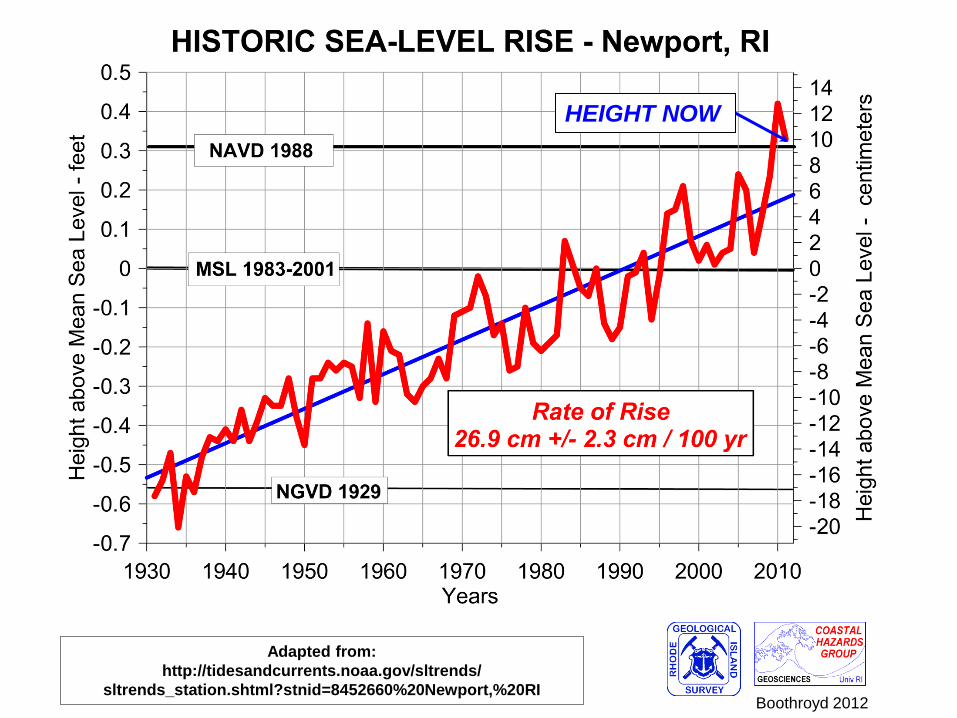
HEIGHT NOW
Adapted from:
http://tidesandcurrents.noaa.gov/sltrends/
sltrends_station.shtml?stnid=8452660%20Newport,%20RI Boothroyd 2012
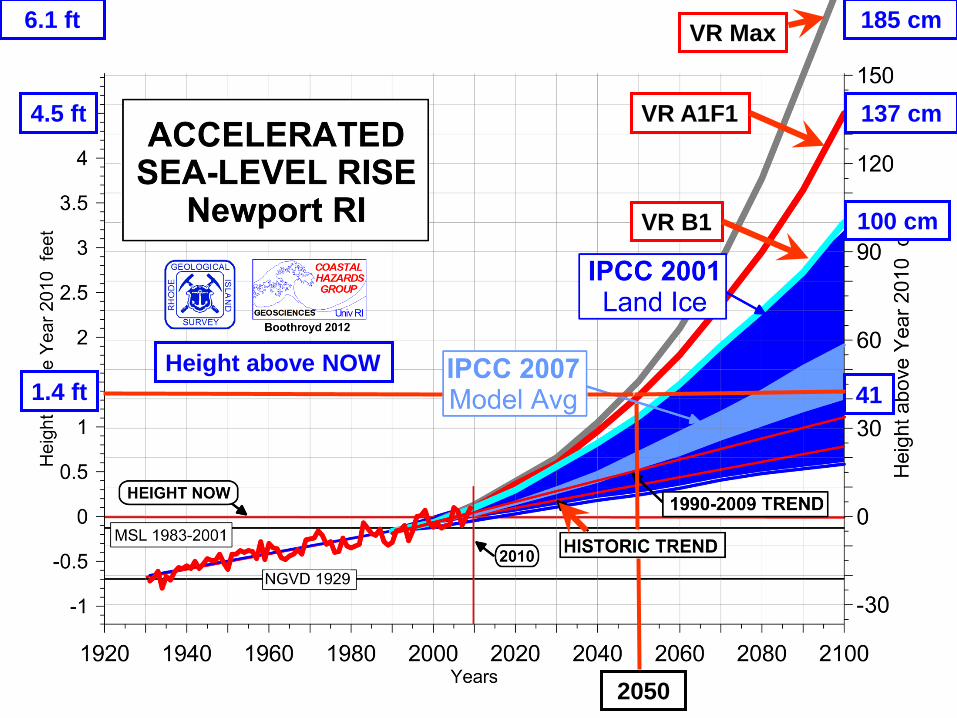
2050
137 cm
100 cm
185 cm
Height above NOW
VR Max
VR A1F1
VR B1
41
6.1 ft
4.5 ft
1.4 ft
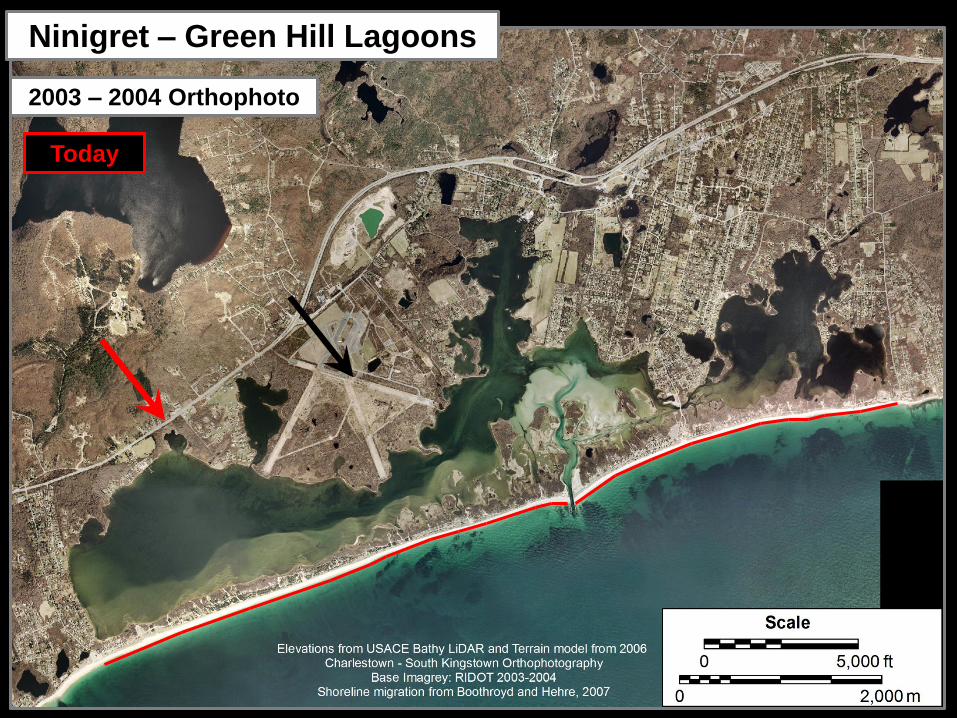
Ninigret – Green Hill Lagoons
2003 – 2004 Orthophoto
Today
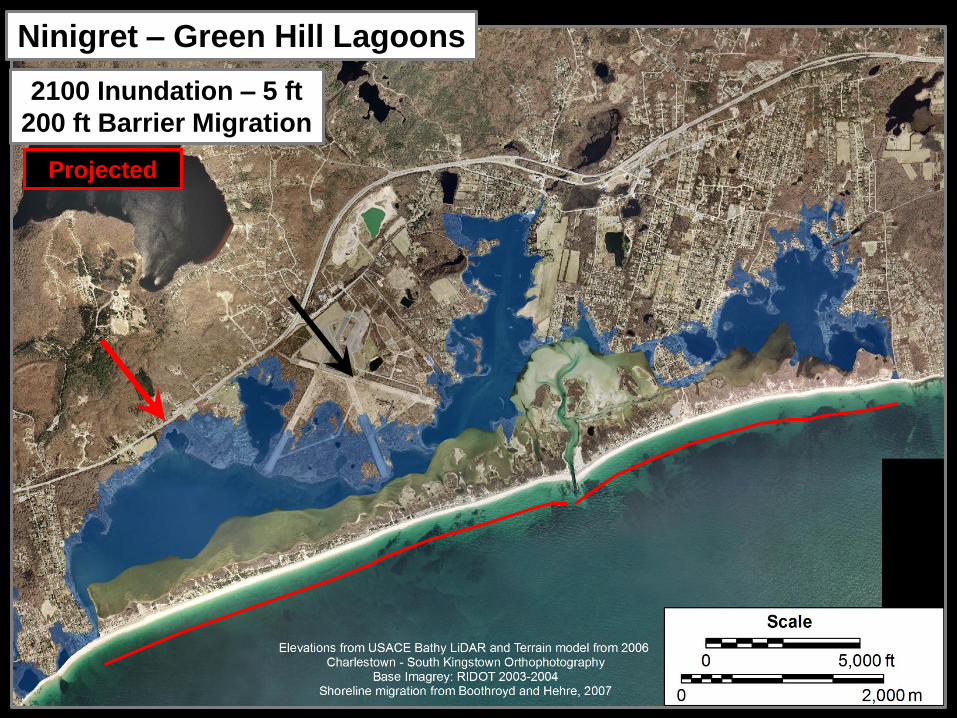
Ninigret – Green Hill Lagoons
2100 Inundation – 5 ft
200 ft Barrier Migration
Projected
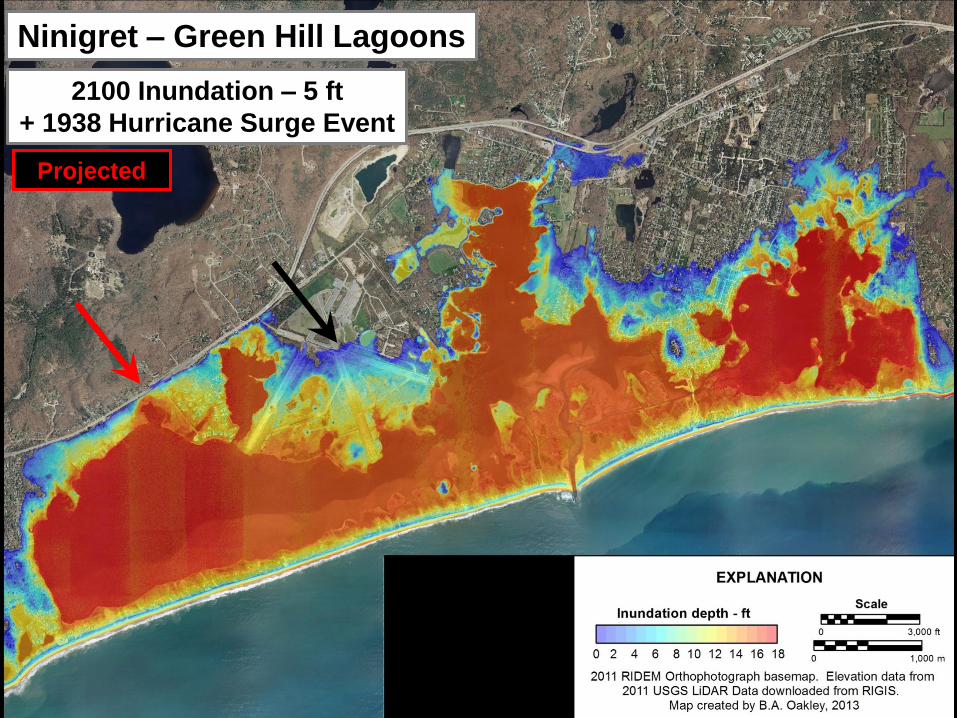
Ninigret – Green Hill Lagoons
2100 Inundation – 5 ft
+ 1938 Hurricane Surge Event
Projected
BA Oakley
South Kingstown, RI – Town Beach An Eroding Glacial Bluff Shore
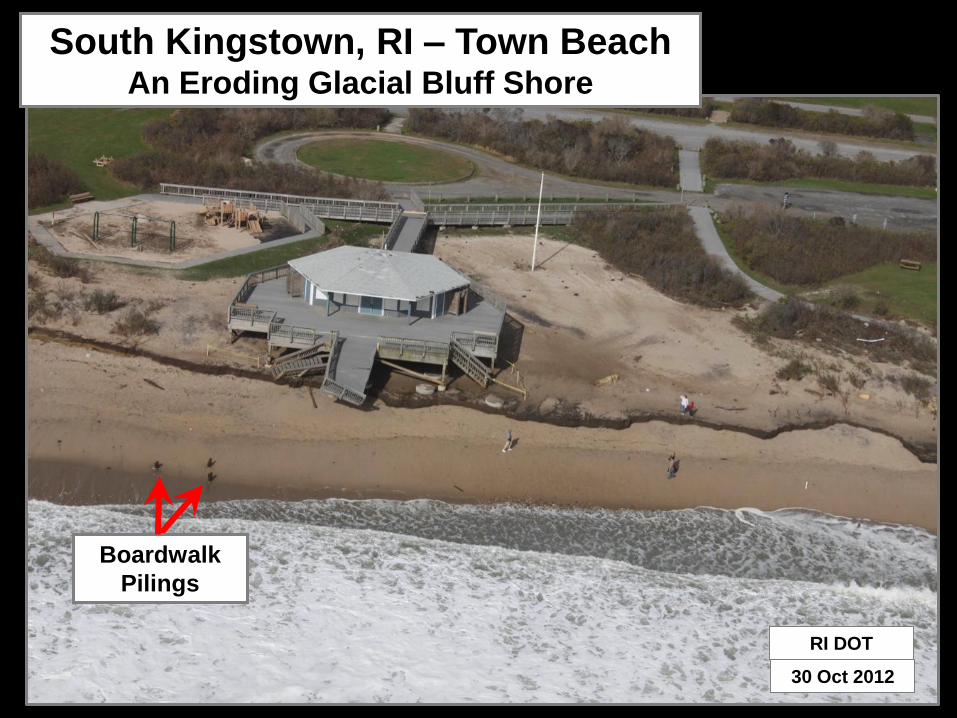
South Kingstown, RI – Town Beach An Eroding Glacial Bluff Shore
RI DOT
30 Oct 2012
Boardwalk
Pilings
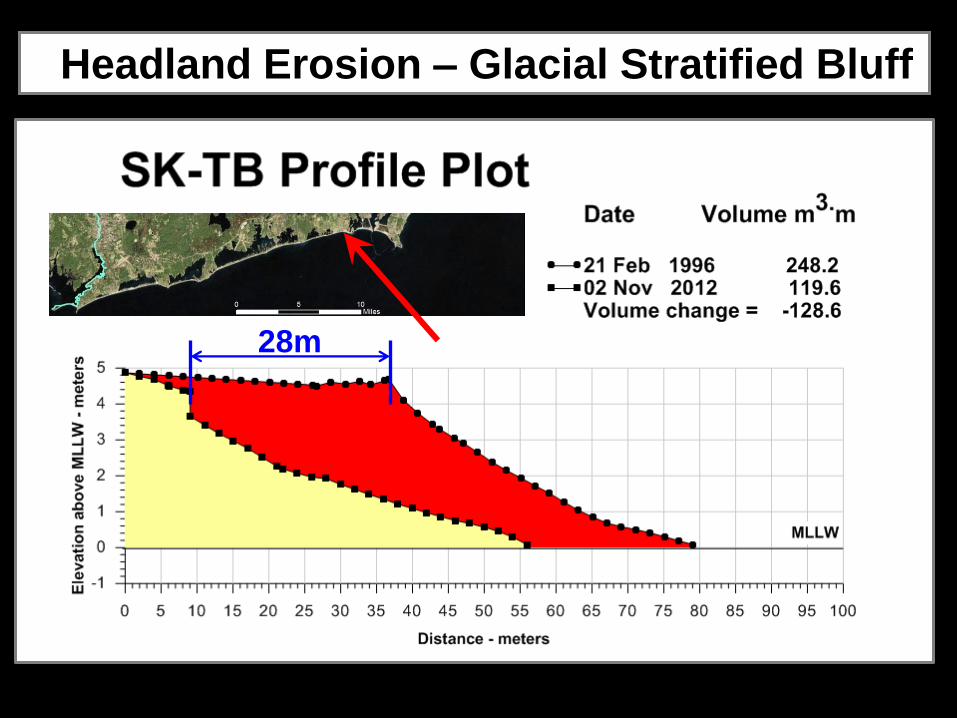
Headland Erosion – Glacial Stratified Bluff
28m
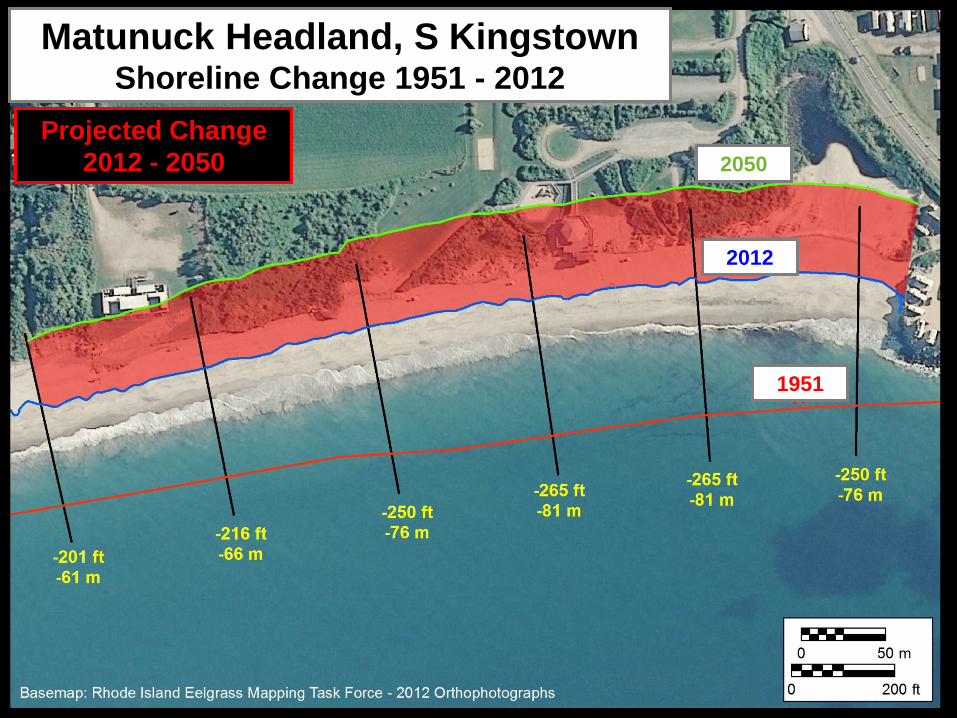
Matunuck Headland, S Kingstown Shoreline Change 1951 - 2012
Projected Change
2012 - 2050
1951
2012
2050

End of Presentation