Embed Size (px)
Citation preview
M. Rita Thissen
International Journal of Data Engineering (IJDE), Volume (7) : Issue (1) : 2017 1
Classification Scoring for Cleaning Inconsistent Survey Data
M. Rita Thissen [email protected] Senior Research Programmer/Analyst Research Computing Division RTI International PO Box 12194, Research Triangle Park 27709, USA
Abstract Data engineers are often asked to detect and resolve inconsistencies within data sets. For some data sources with problems, there is no option to ask for corrections or updates, and the processing steps must do their best with the values in hand. Such circumstances arise in processing survey data, in constructing knowledge bases or data warehouses [1] and in using some public or open data sets. The goal of data cleaning, sometimes called data editing or integrity checking, is to improve the accuracy of each data record and by extension the quality of the data set as a whole. Generally, this is accomplished through deterministic processes that recode specific data points according to static rules based entirely on data from within the individual record. This traditional method works well for many purposes. However, when high levels of inconsistency exist within an individual respondent's data, classification scoring may provide better results. Classification scoring is a two-stage process that makes use of information from more than the individual data record. In the first stage, population data is used to define a model, and in the second stage the model is applied to the individual record. The author and colleagues turned to a classification scoring method to resolve inconsistencies in a key value from a recent health survey. Drawing records from a pool of about 11,000 survey respondents for use in training, we defined a model and used it to classify the vital status of the survey subject, since in the case of proxy surveys, the subject of the study may be a different person from the respondent. The scoring model was tested on the next several months' receipts and then applied on a flow basis during the remainder of data collection to the scanned and interpreted forms for a total of 18,841 unique survey subjects. Classification results were confirmed through external means to further validate the approach. This paper provides methodology and algorithmic details and suggests when this type of cleaning process may be useful. Keywords: Data Cleaning, Classification Models, Data Editing, Classification Scoring, Survey Data, Data Integrity.
1. INTRODUCTION Data from paper survey instruments tend to need more cleaning than electronic surveys due to lack of control over the respondent's actions. Paper survey instruments rely on written instructions that the respondent may misunderstand, overlook or choose to disregard, while computerized survey instruments can incorporate and enforce validity checks within the logic of the website form, call center script or smartphone application. Regardless of presentation mode, surveys rely on skilled design in advance of data collection to optimize the quality of results, but in spite of best efforts, data inconsistencies and missing values may occur due to respondents' refusal, misunderstanding, lack of information, or errors [2]. On the one hand, built-in electronic controls produce clean, consistent data, but on the other hand, they may over-constrain responses and lead to greater levels of missing values, or even consistent but inaccurate data if respondents give answers simply to comply with the system's rules. With paper, allowing some
M. Rita Thissen
International Journal of Data Engineering (IJDE), Volume (7) : Issue (1) : 2017 2
inconsistent single values in the raw data set and employing "smart" cleaning techniques may produce more information overall for analysis. This paper looks at data cleaning methods for paper surveys, and the same methods could be employed with data from electronic instruments if built-in checks were found to be insufficient, or with any other types of data that require cleaning. In many survey research organizations, data cleaning follows on the heels of survey data collection as an automated daily process that acts on information received the previous day. Cleaning takes place on a record-by-record basis through deterministic algorithms, following pre-defined logical rules based on survey subject matter and design factors. Typically, the rules are programmed in the form of if-then-else statements, case/when statements or other precise logic that takes raw inputs from a single survey respondent's answers and generates recoded outputs for that respondent alone. Cleaned data points are written to new variables or to a new structure to preserve both the raw and cleaned values. Appropriate tasks for this form of cleaning include range checks for single numeric responses such as height, validity checks for combinations of related values such as birth date and current age, and other well-defined logical checks. Missing data may be addressed with simple logical fills, such as populating a gate (skip) field when the following response implies a single possible answer for it; for example, the gate "Did you ever smoke?" could be set to yes if subsequent responses indicated that the person was a smoker [3]. Among the benefits of deterministic cleaning is that it produces a precisely defined result and can be applied immediately upon receipt of a single respondent's information, whether or not other data records have been collected. Among the limitations is that those results may not be as complete or accurate as when population information augments the cleaning rules. Deterministic processing ameliorates many forms of item-level error and non-response, but it fails when a collection of values within a specific record are individually valid but collectively inconsistent. For example, if a respondent provides two answers "a" and "b" that are in direct conflict with each other, the deterministic method must trust one of them and recode the other, or else assign an inconsistency code to both. Yet there may be no basis for assuming that the respondent answered question "a" more accurately than "b" or vice versa. The Fellegi-Holt method [4], [5] addresses situations where multiple fields are inconsistent by algorithmically choosing the condition that requires the fewest changes in values. In such situations, deterministic scoring or the Fellegi-Holt method may favor one of the responses and possibly introduce bias, or leave inconsistencies in place, or increase the level of missing data by recoding both as inconsistent. The classification scoring technique described here improves on the Fellegi-Holt method as well as other deterministic approaches but requires an additional step of processing when an adequate number of data records are available for processing. It draws on the population of other respondents to the same survey to model patterns of consistency and inconsistency with respect to a specific set of data points in each record. Details of when and how to use classification scoring are provided below for the World Trade Center Registry's fourth health survey of enrollees. Classification scoring can be applied to more than just survey data. Other branches of data engineering use data cleaning processes in ways analogous to survey data management. For example, when data from heterogeneous sources are prepared for inclusion in a knowledge base or data warehouse, missing or inconsistent values may need to be cleaned. Missing or "dirty" values can impair the usefulness of the data, but often there is no option for requesting better data from the original source [6], [7]. In data mining, the collection of related values is called a data tuple, reflecting the presence of two or more associated fields, and various forms of logic or fuzzy logic may be applied to improve consistency within tuples [8]. In each of these applications, whenever a standard deterministic process encounters multi-field inconsistencies, an alternative cleaning method may be required for conflict resolution, just as in survey data processing.
M. Rita Thissen
International Journal of Data Engineering (IJDE), Volume (7) : Issue (1) : 2017 3
2. CLASSIFICATION SCORING Classification scoring takes additional effort but can help when deterministic cleaning fails, if enough relevant information can be obtained about the respondent population to give a basis for resolving the inconsistent values. For those who are familiar with imputation methods [9], the concepts are familiar; imputation typically works with data points that are missing, whereas classification scoring works with data that are at least partially present but inconsistent. Imputation may add information from external data sources based on standards or independent assessments of the subject population, while classification scoring typically works only within a single data source. Classification scoring for data cleaning would be implemented as a two-step process after a portion of the survey responses have been received, at whatever point it becomes apparent that deterministic cleaning cannot provide adequate results. The first step takes available data from some or all of the survey respondents and identifies associations or interdependencies. The fundamental assumption is that common factors or correlations exist among respondents' data, and by looking at a larger amount of data than the single response record, one can form general guidelines for classifying and recoding, expressed as a scoring model. For example, the full data set might show an association between a survey subject's disability and the need for use of a proxy in completing the form. That association might not be true for each and every respondent, but tends to be true for many within the population. In the classification model, each association is assigned a weight, or score, to indicate the strength of the association, reflecting the fact that it does not apply equally to all individuals. The second step for data cleaning retrieves the associated data from an individual record in which inconsistency has been detected or where data points are partially missing and then applies the scoring model's rules to classify (recode) the uncertain item for that individual. To give a more detailed example, if several items in the survey relate to age in some way and the respondent has not provided his or her age, or has given an age that appears inconsistent with other data, a classification model may draw on associations between age and years of work experience, date of receipt of educational degree, number of years of paid employment, and so on. Each of those related items can be weighted, or scored, according to the degree of association with respondent age. The associations themselves may depend on the respondent population, as when the survey sample is of teenagers versus senior citizens. None of the associated values may serve individually as a reliable basis for age classification and some of the related values may also be missing, but taken together they may prove adequate to produce a classification score. To build the classification scheme, the preliminary scoring model would be run against a training data set where ages were known, and the scoring rules could be adjusted until classifications reached an acceptable level of accuracy [10]. Testing takes place on a second data set to validate the model. The training data set differs from testing data in that the model may be revised more than once during training until it fits the data well, at which point it is tested against an independent data set for final validation. The development of data models, training sets and validation tests are not among standard practices for survey data processing though commonly used in other disciplines. A key feature of any scoring model is the "cut point." Consider a simple classification case, where an unknown value is expected to fall within two categories, such as true or false. For this, a classification model scores the individual's data record by combining the weighted values for data from the associations that were identified. One chooses a model that separates the data records into two groups, one of which is expected to have a true value and the other is expected to have a false value. Ideally, the distribution of scores do not overlap between the two groups, but in practice there might be some overlap resulting from genuine real-world ambiguities, missing values or errors in the data. For example, scores above 19 may be reliably considered true and scores below 12 may be considered false, but what of the scores from 13 to 20? In this case, 12 and 19 would be chosen as the cut points, to divide the scores into three regions: true, false and
M. Rita Thissen
International Journal of Data Engineering (IJDE), Volume (7) : Issue (1) : 2017 4
uncertain. In the first region, below the lower cut-point, 12, the variable would be classified as false, and above the higher cut-point, 19, the variable would be classified as true. Between the two, the cleaned data would be coded to indicate that it remained uncertain or unknown. Two types of classification scoring models are widely used in medicine, financial transactions and other domains. Predictive scoring models estimate values for situations that did not yet occur, such as weather forecasting, and descriptive scoring models classify data already on hand, such as laboratory results or payment records [11]. This paper addresses use of descriptive scoring. Descriptive classification scoring models aid survey data cleaning when all of the following are true:
Multiple questionnaire items are associated with the unknown or uncertain value(s). These survey questions are called indicators in the discussion below.
Values for the indicators are present but inconsistent, or are only partially missing, within a single respondent's data record. If indicators are completely missing, classification will fail for lack of information.
Enough data has been collected from the surveyed population to use as a training set for development of a scoring model.
Additional data records with consistent, complete values will be available by the end of data collection to form a test set.
When all of these conditions are met, classification scoring may be used to improve survey data quality. This paper describes use of classification scoring to determine the vital status of survey subjects. Data were collected from a paper-form health survey where some records gave ambiguous information as to the vital status of the survey subject. To classify each subject as alive or deceased, we developed a descriptive classification scoring model. The survey, data uncertainties, scoring model and results are described in the following sections.
3. THE DATA Survey subjects (sample members) were people who had been at or near the World Trade Center in New York City on September 11, 2001, and shortly afterward, and who enrolled in the World Trade Center Health Registry [12], [13]. Surveys every 3-4 years (waves) collect information about health status and health indicators of enrollees. Surveys are self-administered in multiple languages, with a respondent-selected option for an electronic questionnaire on the web or a paper instrument sent by mail. For this discussion, we only consider data from the paper form, since cleaning rules were built into the electronic form and did not need application later. Surveys were completed by the subject or by proxy for enrollees who were absent, in ill health or deceased. Data collection and processing began in March 2015 for this wave. Survey mailings ended in January 2016, and operations terminated in March 2016 for receipt and processing of paper forms, totaling 20,008 paper surveys. After removal of duplicate identification numbers, a total of 18,841 records remained from paper forms. Duplicate IDs may be encountered in paper surveys if both an original and a reminder form are submitted or if both the subject and a proxy complete forms; these may differ in response values and so not be true duplicate data records. Adjudication may be required, for example, to determine if one of the forms is more complete than the other. True duplicate records may also be introduced inadvertently during batch scanning; these are easier to identify and remove, as the entire data record is repeated. Because surveys might have been completed by proxy for a deceased subject, one requirement for data cleaning was to classify the vital status of the subject, that is, to code whether the enrollee was alive or deceased at the time of the survey. Knowing vital status was critical not only
M. Rita Thissen
International Journal of Data Engineering (IJDE), Volume (7) : Issue (1) : 2017 5
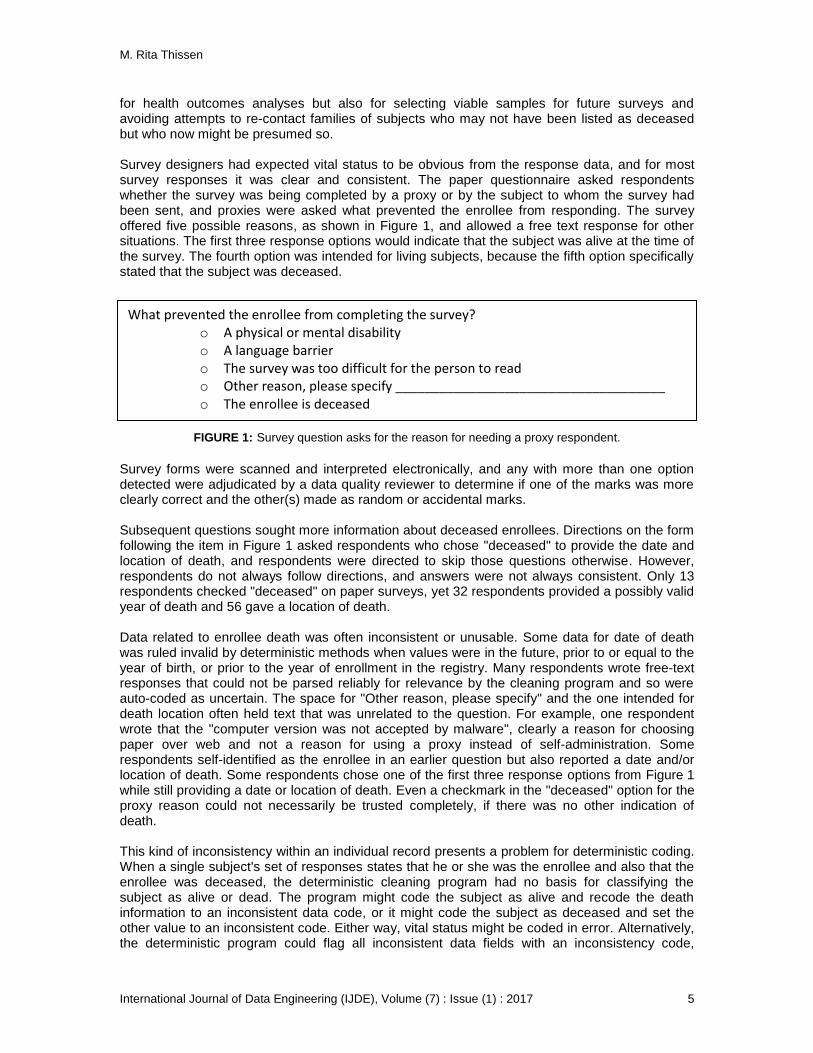
for health outcomes analyses but also for selecting viable samples for future surveys and avoiding attempts to re-contact families of subjects who may not have been listed as deceased but who now might be presumed so. Survey designers had expected vital status to be obvious from the response data, and for most survey responses it was clear and consistent. The paper questionnaire asked respondents whether the survey was being completed by a proxy or by the subject to whom the survey had been sent, and proxies were asked what prevented the enrollee from responding. The survey offered five possible reasons, as shown in Figure 1, and allowed a free text response for other situations. The first three response options would indicate that the subject was alive at the time of the survey. The fourth option was intended for living subjects, because the fifth option specifically stated that the subject was deceased.
Survey forms were scanned and interpreted electronically, and any with more than one option detected were adjudicated by a data quality reviewer to determine if one of the marks was more clearly correct and the other(s) made as random or accidental marks. Subsequent questions sought more information about deceased enrollees. Directions on the form following the item in Figure 1 asked respondents who chose "deceased" to provide the date and location of death, and respondents were directed to skip those questions otherwise. However, respondents do not always follow directions, and answers were not always consistent. Only 13 respondents checked "deceased" on paper surveys, yet 32 respondents provided a possibly valid year of death and 56 gave a location of death. Data related to enrollee death was often inconsistent or unusable. Some data for date of death was ruled invalid by deterministic methods when values were in the future, prior to or equal to the year of birth, or prior to the year of enrollment in the registry. Many respondents wrote free-text responses that could not be parsed reliably for relevance by the cleaning program and so were auto-coded as uncertain. The space for "Other reason, please specify" and the one intended for death location often held text that was unrelated to the question. For example, one respondent wrote that the "computer version was not accepted by malware", clearly a reason for choosing paper over web and not a reason for using a proxy instead of self-administration. Some respondents self-identified as the enrollee in an earlier question but also reported a date and/or location of death. Some respondents chose one of the first three response options from Figure 1 while still providing a date or location of death. Even a checkmark in the "deceased" option for the proxy reason could not necessarily be trusted completely, if there was no other indication of death. This kind of inconsistency within an individual record presents a problem for deterministic coding. When a single subject's set of responses states that he or she was the enrollee and also that the enrollee was deceased, the deterministic cleaning program had no basis for classifying the subject as alive or dead. The program might code the subject as alive and recode the death information to an inconsistent data code, or it might code the subject as deceased and set the other value to an inconsistent code. Either way, vital status might be coded in error. Alternatively, the deterministic program could flag all inconsistent data fields with an inconsistency code,
What prevented the enrollee from completing the survey? o A physical or mental disability o A language barrier o The survey was too difficult for the person to read o Other reason, please specify _____________________________________ o The enrollee is deceased
FIGURE 1: Survey question asks for the reason for needing a proxy respondent.
M. Rita Thissen
International Journal of Data Engineering (IJDE), Volume (7) : Issue (1) : 2017 6
resulting is a reduction of valuable information. No original data would be lost in these ways, as recoding would follow best practices to create new variables instead of over-writing the existing ones, preserving both raw and recoded values separately. However, analytic information might be biased or lost. Vital status of the enrollee was a key concern for this study. Incorrect categorization of a sample member as deceased would cause their removal from sampling for future waves of data collection and affect analytic results regarding health outcomes. On the other hand, incorrect categorization as living also could affect analyses and cause problems in later sampling. Because deterministic methods could not reliably resolve the inconsistencies of vital status when conflicting evidence was present, data reviewers felt that another cleaning approach was needed. We therefore developed a classification scoring algorithm that could be validated and used for this wave and potentially for future waves of data collection as well.
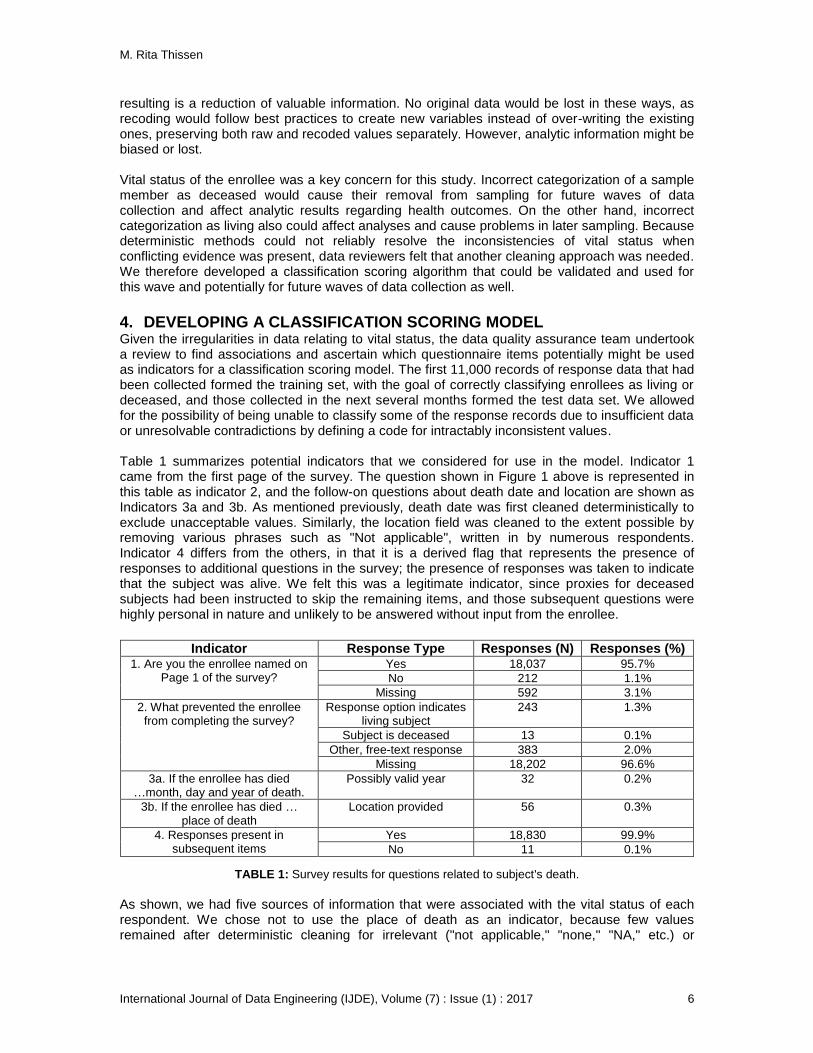
4. DEVELOPING A CLASSIFICATION SCORING MODEL Given the irregularities in data relating to vital status, the data quality assurance team undertook a review to find associations and ascertain which questionnaire items potentially might be used as indicators for a classification scoring model. The first 11,000 records of response data that had been collected formed the training set, with the goal of correctly classifying enrollees as living or deceased, and those collected in the next several months formed the test data set. We allowed for the possibility of being unable to classify some of the response records due to insufficient data or unresolvable contradictions by defining a code for intractably inconsistent values. Table 1 summarizes potential indicators that we considered for use in the model. Indicator 1 came from the first page of the survey. The question shown in Figure 1 above is represented in this table as indicator 2, and the follow-on questions about death date and location are shown as Indicators 3a and 3b. As mentioned previously, death date was first cleaned deterministically to exclude unacceptable values. Similarly, the location field was cleaned to the extent possible by removing various phrases such as "Not applicable", written in by numerous respondents. Indicator 4 differs from the others, in that it is a derived flag that represents the presence of responses to additional questions in the survey; the presence of responses was taken to indicate that the subject was alive. We felt this was a legitimate indicator, since proxies for deceased subjects had been instructed to skip the remaining items, and those subsequent questions were highly personal in nature and unlikely to be answered without input from the enrollee.
Indicator Response Type Responses (N) Responses (%)
1. Are you the enrollee named on Page 1 of the survey?
Yes 18,037 95.7%
No 212 1.1%
Missing 592 3.1%
2. What prevented the enrollee from completing the survey?
Response option indicates living subject
243 1.3%
Subject is deceased 13 0.1%
Other, free-text response 383 2.0%
Missing 18,202 96.6%
3a. If the enrollee has died …month, day and year of death.
Possibly valid year 32 0.2%
3b. If the enrollee has died … place of death
Location provided 56 0.3%
4. Responses present in subsequent items
Yes 18,830 99.9%
No 11 0.1%
TABLE 1: Survey results for questions related to subject's death.
As shown, we had five sources of information that were associated with the vital status of each respondent. We chose not to use the place of death as an indicator, because few values remained after deterministic cleaning for irrelevant ("not applicable," "none," "NA," etc.) or

M. Rita Thissen
International Journal of Data Engineering (IJDE), Volume (7) : Issue (1) : 2017 7
incomplete response text (such as a dash or one-letter response). Of the responses that provided a date of death, many lacked the month and/or day, but year was generally present. After deterministic cleaning to remove unusable values, year of death was acceptable as one of the scoring values. The remaining four indicators yielded 48 possible combinations of answers. The question about being the subject had three possible response types. Reason for proxy had four possibilities. Death year could be usable or not, and responses could be present for the remainder of the survey or not. At least one record was present for each of the 48 possible combinations of indicators. The prior deterministic method had set an uncertainty flag for vital status if any of the following were true in the raw data.
Indicator 1 was missing,
The response to indicator 1 was inconsistent with the response to indicator 2,
The respondent chose the 'deceased' category for indicator 2,
A text response to indicator 2 included a death-related term such as "died"
An apparently legitimate value was provided for death year
A value was provided for death location Using this set of criteria, 6.1% of the subjects with paper forms had uncertain vital status, a degree of uncertainty that was considered unacceptably high by the study team. Therefore we defined a classification scoring model based on the chosen indicators. Two scores were computed for each data record: a "living score" represented evidence that the subject was alive, and a "deceased score" represented evidence that the subject might be deceased. Indicators of living included the respondent stating that he or she was the subject, the respondent choosing a reason for acting as a proxy that indicated the subject was alive, and the presence of responses beyond the point in the survey at which proxies for deceased enrollees were instructed to stop. Indicators that the subject might not be alive included the choice of "deceased" as the proxy reason, providing a plausible year of death, and breaking off the survey where instructions directed the respondent to end if the enrollee was deceased. We were cautious about putting much faith in indicator 4, the presence of further answers, due to the possibility of false positives or false negatives. Because of that concern, we did not want it to have the same impact on scoring as other indicators. Though the paper form clearly stated that the respondent should skip the remainder of the survey if the subject was deceased, the absence of responses might not be meaningful since living subjects might choose to exit the survey at that or any other location. In the training data set, all of the respondents who self-identified as the subject continued with the survey past that point; however 793 of the 804 respondents who did not self-identify as the subject also did so. We did not know during model development whether it would be a common occurrence. Of 1,160 surveys in the final paper data set in which vital status was uncertain under deterministic rules, only 11 ended at that point and the remainder continued farther into the questionnaire. Therefore this indicator had a very minor impact on classification. A study with very large data sets could select weights in proportion to their presence in the training data set, but our sample of inconsistent records was limited. For larger data sources with numeric values, more elegant processes could be considered using statistical approaches [14]. We did not have a large enough pool for those techniques, but the model proved useful even with a manual approach to defining the scoring rules for each indicator. After some adjustment of weight values from the training data and based on the expertise of registry staff who were familiar with vital status patterns from earlier waves of data collection, we accorded scores on a scale of 0 to 2. For reasons mentioned above, the absence of responses (indicator 4) was given half the importance of other indicators in the scoring scheme.
M. Rita Thissen
International Journal of Data Engineering (IJDE), Volume (7) : Issue (1) : 2017 8
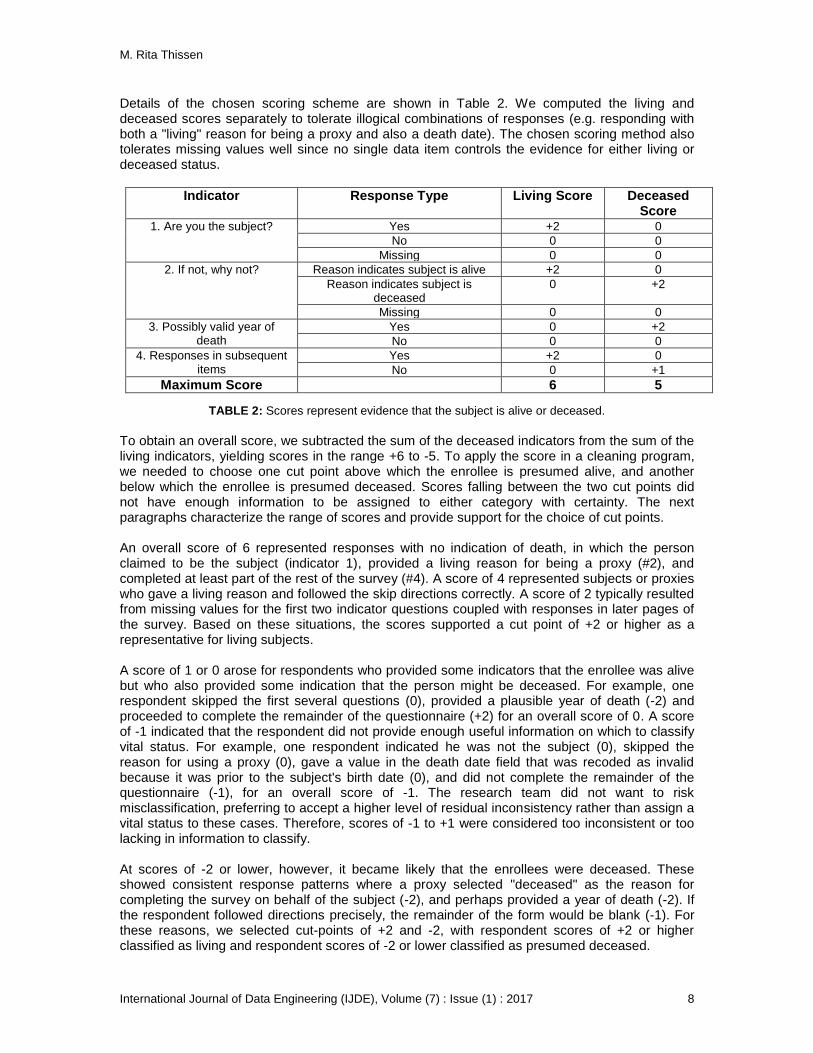
Details of the chosen scoring scheme are shown in Table 2. We computed the living and deceased scores separately to tolerate illogical combinations of responses (e.g. responding with both a "living" reason for being a proxy and also a death date). The chosen scoring method also tolerates missing values well since no single data item controls the evidence for either living or deceased status.
Indicator Response Type Living Score Deceased Score
1. Are you the subject? Yes +2 0
No 0 0
Missing 0 0
2. If not, why not? Reason indicates subject is alive +2 0
Reason indicates subject is deceased
0 +2
Missing 0 0
3. Possibly valid year of death
Yes 0 +2
No 0 0
4. Responses in subsequent items
Yes +2 0
No 0 +1
Maximum Score 6 5
TABLE 2: Scores represent evidence that the subject is alive or deceased.
To obtain an overall score, we subtracted the sum of the deceased indicators from the sum of the living indicators, yielding scores in the range +6 to -5. To apply the score in a cleaning program, we needed to choose one cut point above which the enrollee is presumed alive, and another below which the enrollee is presumed deceased. Scores falling between the two cut points did not have enough information to be assigned to either category with certainty. The next paragraphs characterize the range of scores and provide support for the choice of cut points. An overall score of 6 represented responses with no indication of death, in which the person claimed to be the subject (indicator 1), provided a living reason for being a proxy (#2), and completed at least part of the rest of the survey (#4). A score of 4 represented subjects or proxies who gave a living reason and followed the skip directions correctly. A score of 2 typically resulted from missing values for the first two indicator questions coupled with responses in later pages of the survey. Based on these situations, the scores supported a cut point of +2 or higher as a representative for living subjects. A score of 1 or 0 arose for respondents who provided some indicators that the enrollee was alive but who also provided some indication that the person might be deceased. For example, one respondent skipped the first several questions (0), provided a plausible year of death (-2) and proceeded to complete the remainder of the questionnaire (+2) for an overall score of 0. A score of -1 indicated that the respondent did not provide enough useful information on which to classify vital status. For example, one respondent indicated he was not the subject (0), skipped the reason for using a proxy (0), gave a value in the death date field that was recoded as invalid because it was prior to the subject's birth date (0), and did not complete the remainder of the questionnaire (-1), for an overall score of -1. The research team did not want to risk misclassification, preferring to accept a higher level of residual inconsistency rather than assign a vital status to these cases. Therefore, scores of -1 to +1 were considered too inconsistent or too lacking in information to classify. At scores of -2 or lower, however, it became likely that the enrollees were deceased. These showed consistent response patterns where a proxy selected "deceased" as the reason for completing the survey on behalf of the subject (-2), and perhaps provided a year of death (-2). If the respondent followed directions precisely, the remainder of the form would be blank (-1). For these reasons, we selected cut-points of +2 and -2, with respondent scores of +2 or higher classified as living and respondent scores of -2 or lower classified as presumed deceased.
M. Rita Thissen
International Journal of Data Engineering (IJDE), Volume (7) : Issue (1) : 2017 9
An example from one respondent's data illustrates the extent of inconsistencies that were able to be resolved by the scoring method, but which would have remained inconsistent under traditional deterministic methods.
Are you the subject? Yes
If not, why not? Other reason. Specify: "Repetitive and lengthy"
Year of death? 2015
Survey completion date: 6/20/2015
Location of death? Washington, DC
Other responses present in survey? Yes
Living score = 6
Deceased score = 2
Overall score = 4 The case was originally considered uncertain due to self-reporting as the subject (and therefore alive) while simultaneously providing a year and location of death. The scoring model classified the subject as living, a judgment later confirmed by manual investigation. Review of the original questionnaire forms for all those with any indicators of a deceased subject confirmed our classification scoring model. The model was constructed from the first 11,000 forms, approximately. The first validation exercise was conducted when approximately 5,000 additional paper forms had been received, and again when data collection ended with 20,008 scanned paper forms. As mentioned above, some of those data records were later discarded as duplicates, representing 18,841 distinct subjects. Since the classification method was a new approach for the survey and the process ran nightly, a less formal review was also conducted monthly or more often to watch for anomalies. During all types of review, paper survey scans were examined and classified manually for all enrollees whose vital status was identified as inconsistent or deceased and for a convenience sample of those classified as having consistent data and being alive. In each case the human opinions agreed with algorithmic classification. In addition, Registry staff attempted to confirm as many deceased classifications as possible by checking for deaths reported to the Registry by friends or family members of the enrollees, on file in mortality records, or listed on LexisNexis. All human-judgment and comparison results were consistent with the scored classification, as described in greater detail in Section 6.
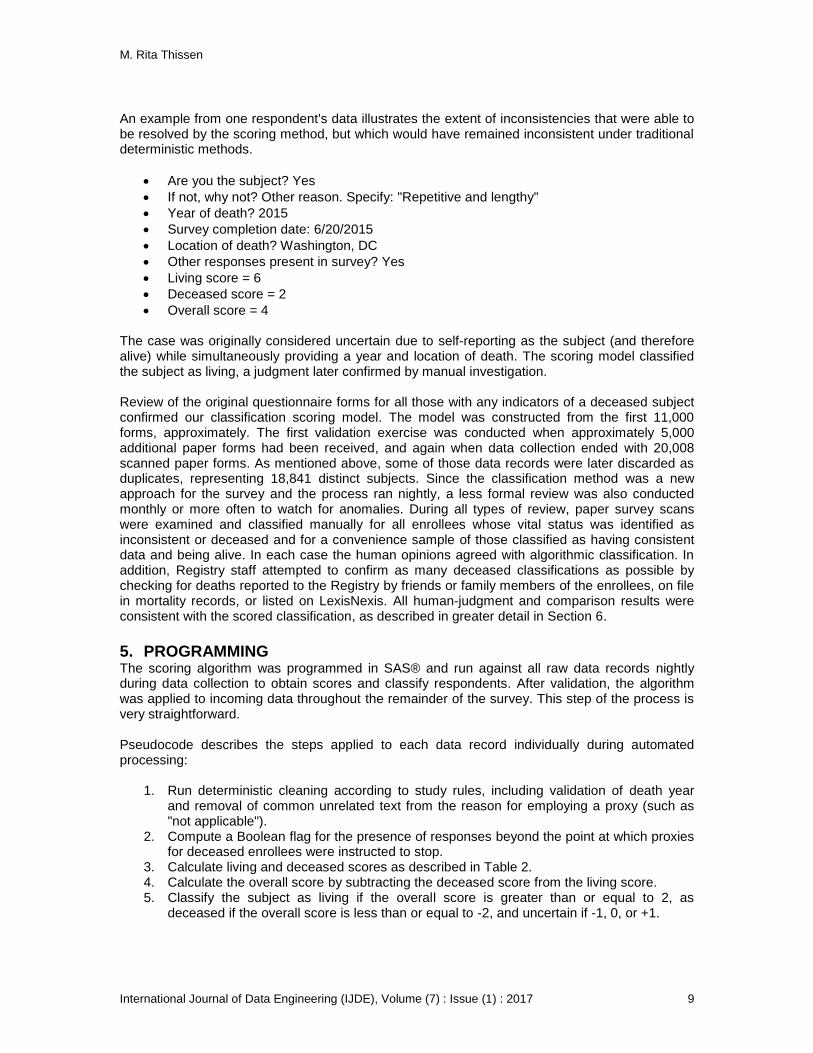
5. PROGRAMMING The scoring algorithm was programmed in SAS® and run against all raw data records nightly during data collection to obtain scores and classify respondents. After validation, the algorithm was applied to incoming data throughout the remainder of the survey. This step of the process is very straightforward. Pseudocode describes the steps applied to each data record individually during automated processing:
1. Run deterministic cleaning according to study rules, including validation of death year and removal of common unrelated text from the reason for employing a proxy (such as "not applicable").
2. Compute a Boolean flag for the presence of responses beyond the point at which proxies for deceased enrollees were instructed to stop.
3. Calculate living and deceased scores as described in Table 2. 4. Calculate the overall score by subtracting the deceased score from the living score. 5. Classify the subject as living if the overall score is greater than or equal to 2, as
deceased if the overall score is less than or equal to -2, and uncertain if -1, 0, or +1.
M. Rita Thissen
International Journal of Data Engineering (IJDE), Volume (7) : Issue (1) : 2017 10
A SAS program segment for the process is given in Figure 2. Values of -7 (inconsistent) and -9 (missing data) were employed to supplement the classification codes. Following best practices for traceability, recoded values were stored in separate variables, preserving the raw responses.
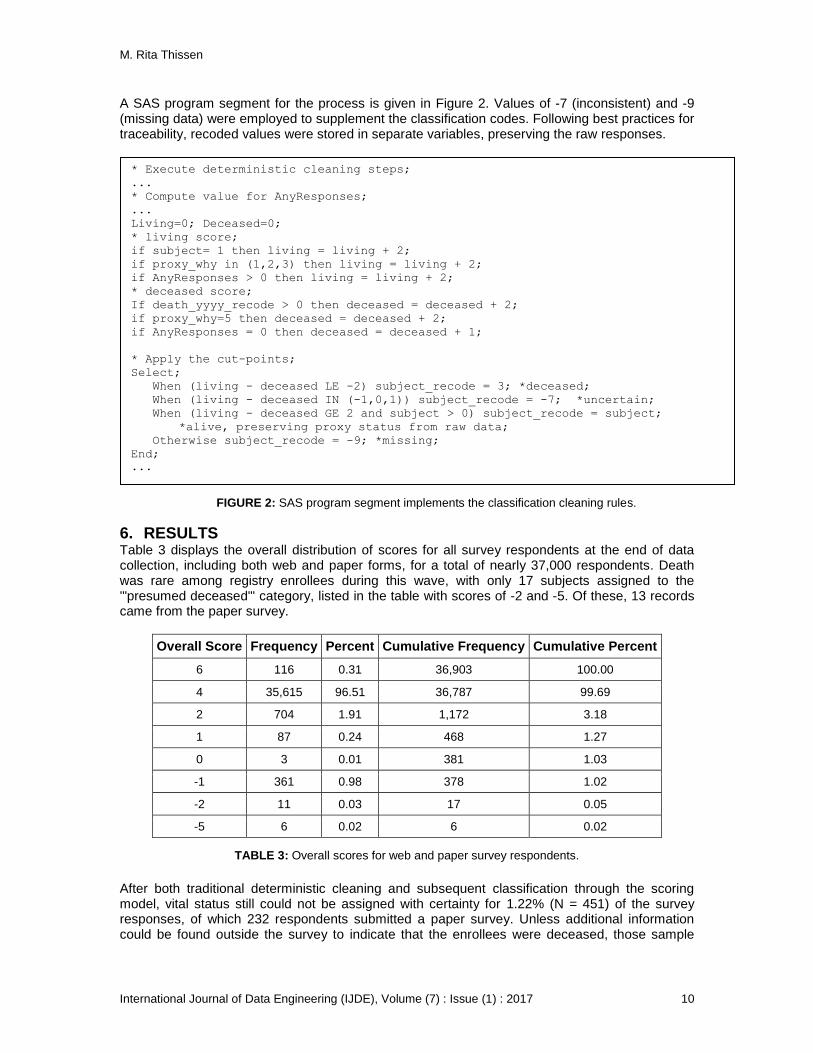
6. RESULTS Table 3 displays the overall distribution of scores for all survey respondents at the end of data collection, including both web and paper forms, for a total of nearly 37,000 respondents. Death was rare among registry enrollees during this wave, with only 17 subjects assigned to the '"presumed deceased"' category, listed in the table with scores of -2 and -5. Of these, 13 records came from the paper survey.
Overall Score Frequency Percent Cumulative Frequency Cumulative Percent
6 116 0.31 36,903 100.00
4 35,615 96.51 36,787 99.69
2 704 1.91 1,172 3.18
1 87 0.24 468 1.27
0 3 0.01 381 1.03
-1 361 0.98 378 1.02
-2 11 0.03 17 0.05
-5 6 0.02 6 0.02
TABLE 3: Overall scores for web and paper survey respondents.
After both traditional deterministic cleaning and subsequent classification through the scoring model, vital status still could not be assigned with certainty for 1.22% (N = 451) of the survey responses, of which 232 respondents submitted a paper survey. Unless additional information could be found outside the survey to indicate that the enrollees were deceased, those sample
* Execute deterministic cleaning steps;
...
* Compute value for AnyResponses;
...
Living=0; Deceased=0;
* living score;
if subject= 1 then living = living + 2;
if proxy_why in (1,2,3) then living = living + 2;
if AnyResponses > 0 then living = living + 2;
* deceased score;
If death_yyyy_recode > 0 then deceased = deceased + 2;
if proxy_why=5 then deceased = deceased + 2;
if AnyResponses = 0 then deceased = deceased + 1;
* Apply the cut-points;
Select;
When (living - deceased LE -2) subject_recode = 3; *deceased;
When (living - deceased IN (-1,0,1)) subject_recode = -7; *uncertain;
When (living - deceased GE 2 and subject > 0) subject_recode = subject;
*alive, preserving proxy status from raw data;
Otherwise subject_recode = -9; *missing;
End;
...
FIGURE 2: SAS program segment implements the classification cleaning rules.
M. Rita Thissen
International Journal of Data Engineering (IJDE), Volume (7) : Issue (1) : 2017 11
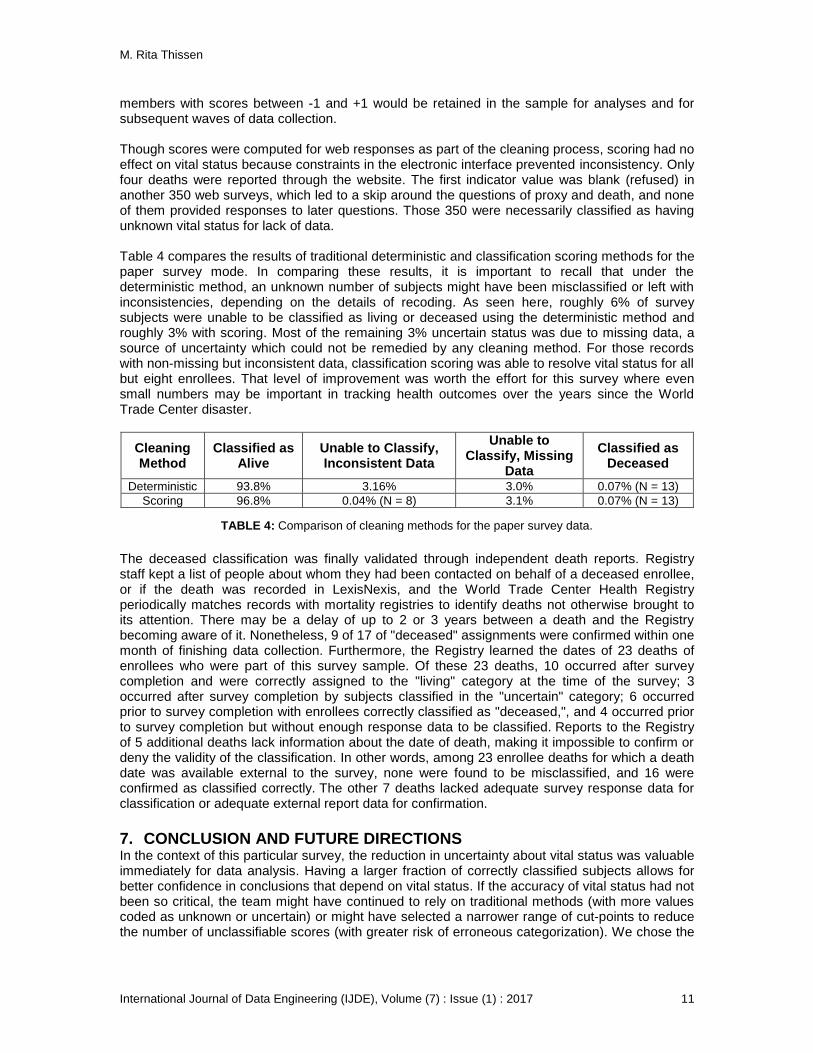
members with scores between -1 and +1 would be retained in the sample for analyses and for subsequent waves of data collection. Though scores were computed for web responses as part of the cleaning process, scoring had no effect on vital status because constraints in the electronic interface prevented inconsistency. Only four deaths were reported through the website. The first indicator value was blank (refused) in another 350 web surveys, which led to a skip around the questions of proxy and death, and none of them provided responses to later questions. Those 350 were necessarily classified as having unknown vital status for lack of data. Table 4 compares the results of traditional deterministic and classification scoring methods for the paper survey mode. In comparing these results, it is important to recall that under the deterministic method, an unknown number of subjects might have been misclassified or left with inconsistencies, depending on the details of recoding. As seen here, roughly 6% of survey subjects were unable to be classified as living or deceased using the deterministic method and roughly 3% with scoring. Most of the remaining 3% uncertain status was due to missing data, a source of uncertainty which could not be remedied by any cleaning method. For those records with non-missing but inconsistent data, classification scoring was able to resolve vital status for all but eight enrollees. That level of improvement was worth the effort for this survey where even small numbers may be important in tracking health outcomes over the years since the World Trade Center disaster.
Cleaning Method
Classified as Alive
Unable to Classify, Inconsistent Data
Unable to Classify, Missing
Data
Classified as Deceased
Deterministic 93.8% 3.16% 3.0% 0.07% (N = 13)
Scoring 96.8% 0.04% (N = 8) 3.1% 0.07% (N = 13)
TABLE 4: Comparison of cleaning methods for the paper survey data.
The deceased classification was finally validated through independent death reports. Registry staff kept a list of people about whom they had been contacted on behalf of a deceased enrollee, or if the death was recorded in LexisNexis, and the World Trade Center Health Registry periodically matches records with mortality registries to identify deaths not otherwise brought to its attention. There may be a delay of up to 2 or 3 years between a death and the Registry becoming aware of it. Nonetheless, 9 of 17 of "deceased" assignments were confirmed within one month of finishing data collection. Furthermore, the Registry learned the dates of 23 deaths of enrollees who were part of this survey sample. Of these 23 deaths, 10 occurred after survey completion and were correctly assigned to the "living" category at the time of the survey; 3 occurred after survey completion by subjects classified in the "uncertain" category; 6 occurred prior to survey completion with enrollees correctly classified as "deceased,", and 4 occurred prior to survey completion but without enough response data to be classified. Reports to the Registry of 5 additional deaths lack information about the date of death, making it impossible to confirm or deny the validity of the classification. In other words, among 23 enrollee deaths for which a death date was available external to the survey, none were found to be misclassified, and 16 were confirmed as classified correctly. The other 7 deaths lacked adequate survey response data for classification or adequate external report data for confirmation.
7. CONCLUSION AND FUTURE DIRECTIONS In the context of this particular survey, the reduction in uncertainty about vital status was valuable immediately for data analysis. Having a larger fraction of correctly classified subjects allows for better confidence in conclusions that depend on vital status. If the accuracy of vital status had not been so critical, the team might have continued to rely on traditional methods (with more values coded as unknown or uncertain) or might have selected a narrower range of cut-points to reduce the number of unclassifiable scores (with greater risk of erroneous categorization). We chose the

M. Rita Thissen
International Journal of Data Engineering (IJDE), Volume (7) : Issue (1) : 2017 12
middle ground, an approach that minimized the number of subjects with uncertain vital status while not assuming the risk of false categorization. In a broader context, the results of our exploration of classification scoring method may benefit data processing for other surveys. This method is rarely considered as a means to improve survey data processing or data quality. Several factors inhibit the use of descriptive classification scoring.
Traditional approaches work well for the majority of data cleaning operations.
Data processors who lack statistical backgrounds may not be familiar with descriptive scoring or modeling.
Descriptive techniques may be confused with simulation studies or with predictive modeling.
New methods take effort to develop and validate.
Survey research literature contains few examples of studies that use the technique.
Any of these points may be sufficient to deter data processors from adopting descriptive classification scoring. Yet survey research could overcome those barriers by following the lead of other disciplines. Descriptive scoring models have been used for years to estimate values that cannot be measured directly. The field of education relies on many levels of descriptive scores, from basic in-classroom grading systems to advanced assessments of competence [15]. Drug-trial evaluations commonly rely on descriptive quality-of-life scores to supplement and summarize a subject's data [16]. Descriptive scoring has been used in physiological studies to assess factors such as age at death [17]. Presently, in survey data processing [18] and in preparation of data bases for analytic mining [19], inconsistencies are most commonly resolved by suppression of or modification to one or more of the original data points, leading to loss or possibly erroneous information [18]. Classification scoring as used in other disciplines and as we have applied it offers survey researchers an alternative that does not cause data loss and is able to be validated for correctness. For other surveys that may be interested in employing this approach, the following guidelines may be useful for when to consider a classification scoring method. Although any decision will be influenced by many factors and specific studies will need to weigh the pros and cons, we recommend a scoring approach when all of the following conditions are met:
The specific data points are key for analytic or operational use.
A sizable bank of data is already on hand for use in defining and validating the model.
Deterministic cleaning does not produce acceptable results.
Multiple data fields provide indicators for classifying the key variable(s) under scrutiny.
Problems stem from inconsistency or partial omission, as opposed to a total lack of information.
Traditional deterministic methods will continue to be the standard practice for most data cleaning because of their practicality, familiarity, ease of formulation, and ability to be applied even when only a single data record has been collected. However, when deterministic rules fail to give satisfactory results, a scoring method may be considered as a supplement for classifying the uncertain variables. From an operational standpoint, the scoring method offers an improvement in process efficiency for key items that would otherwise require external checking or re-contacting to resolve discrepancies, reducing the labor needed for manual follow-up. For longitudinal studies, the method may better inform sampling for subsequent waves of data collection, especially when the key question is the vital status of the subject. The author hopes to apply and refine the technique
M. Rita Thissen
International Journal of Data Engineering (IJDE), Volume (7) : Issue (1) : 2017 13
of descriptive classification scoring in future data processing efforts for research surveys on any topic. The approach serves as a means to increase the quality, consistency and availability of data that might otherwise need to be coded as inconsistent or incomplete. In summary, we found the use of classification scoring to be helpful as an approach for resolving the key question of subjects' vital status. We were pleased that the algorithmic results matched well with human judgment and external death reports. If the survey design remains the same, future waves of data collection will provide an opportunity for additional validation of the algorithm's effectiveness, and we think that the improvement in cleaning for vital status will be even more valuable in the future as the sample population ages and more deaths are expected. In summary, we found the results to be worth the effort of defining and implementing the scoring approach, and confirmation of individual cases provides evidence of its validity.
8. ACKNOWLEDGMENTS The author acknowledges the very valuable contributions of the dedicated staff of the World Trade Center Health Registry, New York City Department of Health and Mental Hygiene (NYC DOHMH), who designed and managed this survey. The Registry is supported by the National Institute for Occupational Safety and Health (NIOSH) Cooperative Agreements 2U50/OH009737 and 5U50/OH009379, and by NYC DOHMH. Contents are solely the author's responsibility and do not necessarily represent official views of the Centers for Disease Control and Prevention, NIOSH or the U.S. Department of Health and Human Services. I would especially like to recognize Dr. Carey B. Maslow who worked closely with me on all aspects of data quality review and cleaning. In addition, I thank Kathleen Considine and the project team at RTI International who established data systems, conducted survey operations, and worked with me to ensure clean data. The study and a part of the expense of preparing this manuscript were funded by the Department of Health and Mental Hygiene.
9. REFERENCES [1] V. Raman and J.M. Hellerstein. "Potter's wheel: An interactive data cleaning system." The VLDB Journal, vol. 1, pp. 381-390, 2001. [2] P.P. Biemer and L.E. Lyberg. Introduction to Survey Quality. Hoboken, NJ: Wiley 2003, p. 41. [3] F. Kreuter, S. McCulloch, S. Presser, and R. Tourangeau. "The effects of asking filter questions in interleafed versus grouped format." Sociological Methods & Research, vol. 40(1), pp. 88-104, 2011. [4] W.E. Winkler. "State of statistical data editing and current research problems (No. 29)." U.S. Census Bureau, Working Paper. 1999. [5] W.E. Winkler and B.-C. Chen. "Extending the Fellegi-Holt model of statistical data editing," in ASA Proceedings of the Section on Survey Research Methods, 2001, pp. 1-21. [6] E. Rahm and H.H. Do. "Data cleaning: Problems and current approaches." IEEE Data Engineering Bulletin, vol. 23(4), pp. 3-13, 2000. [7] D. Shukla and R. Singhai. "Some imputation methods to treat missing values in knowledge discovery in data warehouse." International Journal of Data Engineering, vol. 1(2), pp. 1-13, 2010. [8] S. Chaudhuri, K. Ganjam, V. Ganti, and R. Motwani. "Robust and efficient fuzzy match for online data cleaning," in Proc. 2003 ACM SIGMOD International Conference on Management of Data, pp. 313-324, 2003.

M. Rita Thissen
International Journal of Data Engineering (IJDE), Volume (7) : Issue (1) : 2017 14
[9] D.B. Rubin. Multiple Imputation for Nonresponse in Surveys. Hoboken, NJ: Wiley, 2004, pp. 11-15. [10] J. Han, J. Pei, and M. Kamber. Data Mining: Concepts and Techniques. Amsterdam, Netherlands: Elsevier, 2011, p. 331. [11] P.N. Tan, M. Steinbach, and V. Kumar. Introduction to Data Mining. Boston: Addison- Wesley, 2005, pp.145-205. [12] R. Brackbill, D. Walker, S. Campolucci, J. Sapp, M. Dolan, J. Murphy, L. Thalji, and P. Pulliam. World Trade Center Health Registry. New York: New York City Department of Health and Mental Hygiene, 2006. [13] M. Farfel, L. DiGrande, R. Brackbill, A. Prann, J. Cone, S. Friedman, D.J. Walker, G. Pezeshki, P. Thomas, S. Galea, and D. Williamson. "An overview of 9/11 experiences and respiratory and mental health conditions among World Trade Center Health Registry enrollees." Journal of Urban Health, vol. 85(6), pp. 880-909, 2008. [14] H.J. Kim, L.H. Cox, A.F. Karr, J.P. Reiter, and Q. Wang. "Simultaneous edit-imputation for continuous microdata." Journal of the American Statistical Association, vol. 110(511), pp. 987-999, 2015. [15] A. Jonsson and G. Svingby. "The use of scoring rubrics: Reliability, validity and educational consequences." Educational Research Review, vol. 2(2), pp.130-144, 2007. [16] P.M. Fayers and D. Machin. Quality of Life: The Assessment, Analysis and Interpretation of Patient-Reported Outcomes. Hoboken, NJ: Wiley, 2013, p. 1958. [17] A.L. Brennaman. "Examination of osteoarthritis for age-at-death estimation in a modern population." Doctoral dissertation, Boston University, 2014. [18] E. Leahey. "Overseeing research practice: the case of data editing." Science, Technology & Human Values, vol. 33(5), pp. 605-630, 2008. [19] S. Tuffery. Data Mining et statistique décisionnelle: L'intelligence des données. Paris: Éditions Technip, 2012, p. 30.