Embed Size (px)
Citation preview
ANOVA:ANOVA:Analysis of VariationAnalysis of Variation

ANOVA:ANOVA:Learning ObjectivesLearning Objectives
• Underlying methodological principles of Underlying methodological principles of ANOVAANOVA
• Statistical principles: Partitioning of Statistical principles: Partitioning of variabilityvariability
• Summary table for one-way ANOVA Summary table for one-way ANOVA
tt-Test vs ANOVA:-Test vs ANOVA:The Case for Multiple GroupsThe Case for Multiple Groups
• tt-tests can be used to compare mean differences for two -tests can be used to compare mean differences for two groupsgroups
• Between Subject DesignsBetween Subject Designs
• Within Subject DesignsWithin Subject Designs
• Paired Samples DesignsPaired Samples Designs
• The test allows us to make a judgment concerning The test allows us to make a judgment concerning whether or not the observed differences are likely to have whether or not the observed differences are likely to have occurred by chance.occurred by chance.
• Although helpful the t-test has its problemsAlthough helpful the t-test has its problems
Multiple GroupsMultiple Groups
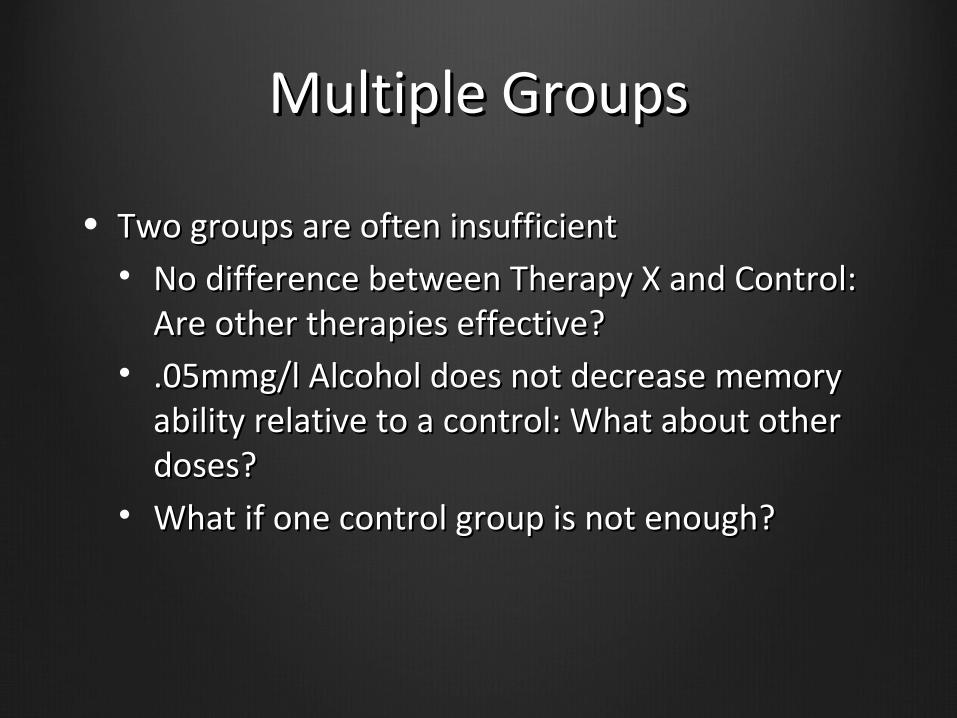
• Two groups are often insufficientTwo groups are often insufficient• No difference between Therapy X and Control: No difference between Therapy X and Control:
Are other therapies effective?Are other therapies effective?• .05mmg/l Alcohol does not decrease memory .05mmg/l Alcohol does not decrease memory
ability relative to a control: What about other ability relative to a control: What about other doses?doses?
• What if one control group is not enough?What if one control group is not enough?
Multiple Groups 2Multiple Groups 2
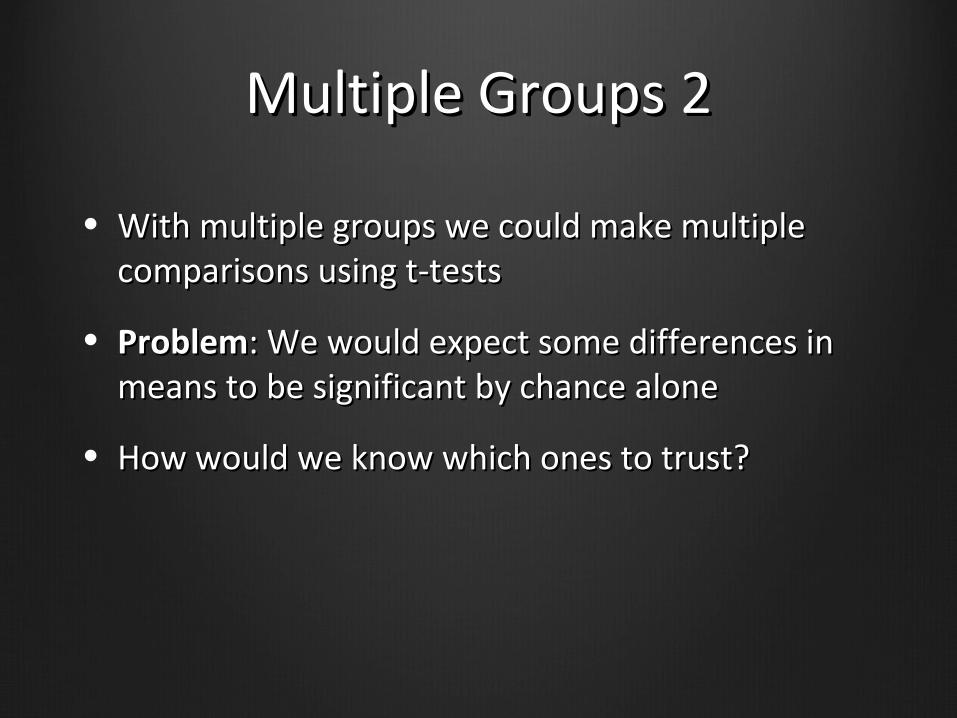
• With multiple groups we could make multiple With multiple groups we could make multiple comparisons using t-testscomparisons using t-tests
• ProblemProblem: We would expect some differences in : We would expect some differences in means to be significant by chance alonemeans to be significant by chance alone
• How would we know which ones to trust?How would we know which ones to trust?
Comparing Multiple Groups:Comparing Multiple Groups:
The The ““One-WayOne-Way”” Design Design
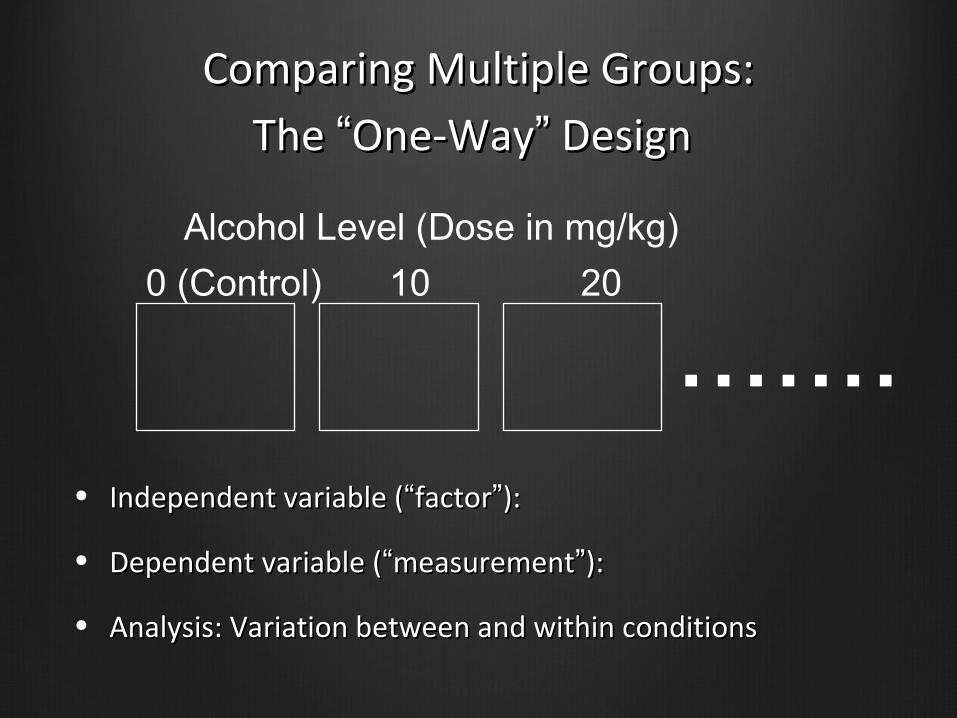
• Independent variable (Independent variable (““factorfactor””):):
• Dependent variable (Dependent variable (““measurementmeasurement””):):
• Analysis: Variation between and within conditionsAnalysis: Variation between and within conditions
.......Alcohol Level (Dose in mg/kg)
0 (Control) 10 20
Analysis of Variance (F test):Analysis of Variance (F test):AdvantagesAdvantages
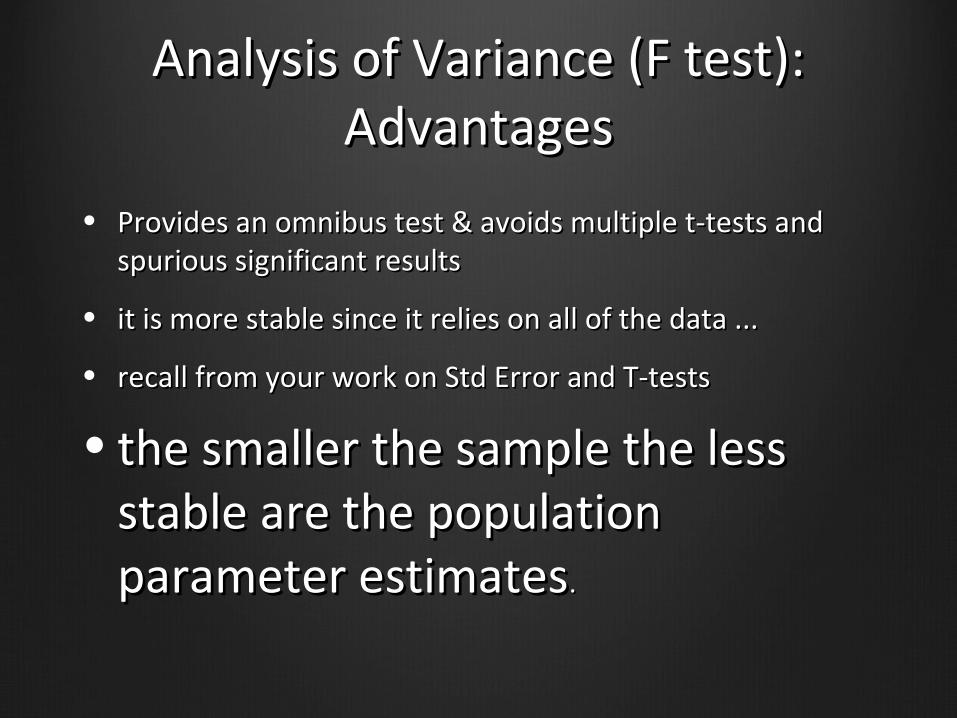
• Provides an omnibus test & avoids multiple t-tests and Provides an omnibus test & avoids multiple t-tests and spurious significant resultsspurious significant results
• it is more stable since it relies on all of the data ...it is more stable since it relies on all of the data ...
• recall from your work on Std Error and T-testsrecall from your work on Std Error and T-tests
• the smaller the sample the less the smaller the sample the less stable are the population stable are the population parameter estimatesparameter estimates..
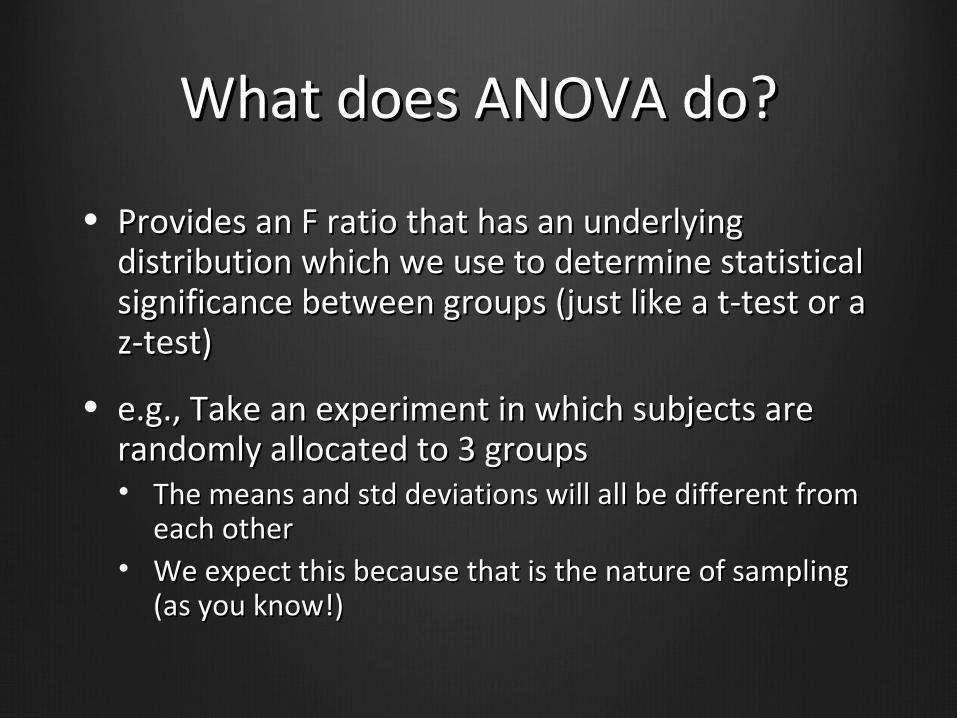
What does ANOVA do?What does ANOVA do?
• Provides an F ratio that has an underlying Provides an F ratio that has an underlying distribution which we use to determine statistical distribution which we use to determine statistical significance between groups (just like a t-test or a significance between groups (just like a t-test or a z-test)z-test)
• e.g., Take an experiment in which subjects are e.g., Take an experiment in which subjects are randomly allocated to 3 groupsrandomly allocated to 3 groups• The means and std deviations will all be different from The means and std deviations will all be different from
each othereach other• We expect this because that is the nature of sampling We expect this because that is the nature of sampling
(as you know!)(as you know!)

The question is …The question is …
are the groups more different than are the groups more different than we would expect by chance?we would expect by chance?
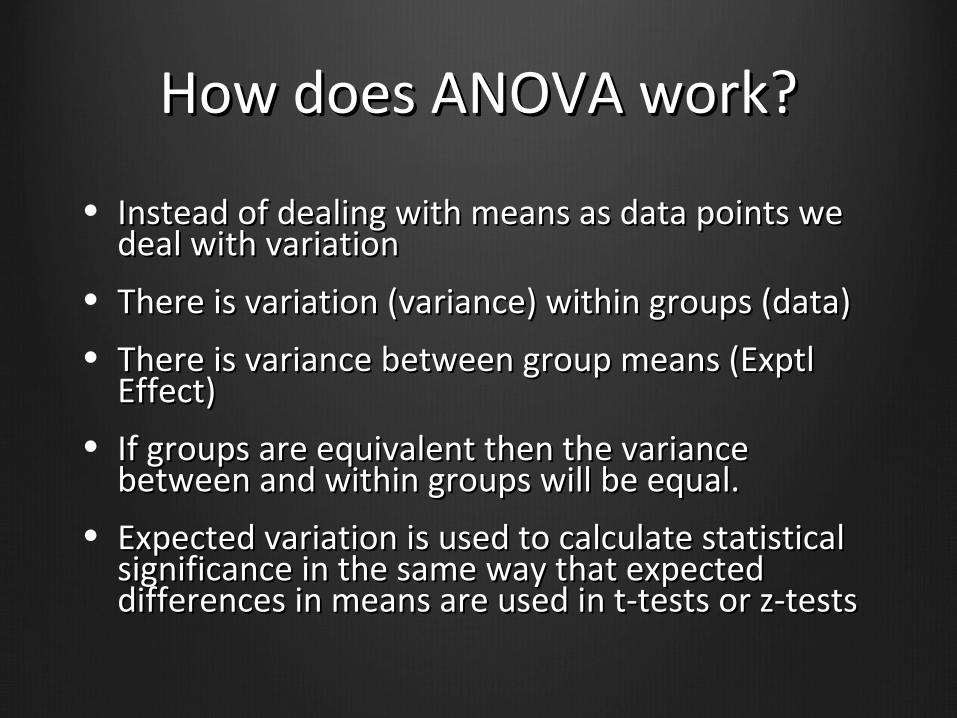
How does ANOVA work?How does ANOVA work?
• Instead of dealing with means as data points we Instead of dealing with means as data points we deal with variation deal with variation
• There is variation (variance) within groups (data)There is variation (variance) within groups (data)
• There is variance between group means (Exptl There is variance between group means (Exptl Effect)Effect)
• If groups are equivalent then the variance If groups are equivalent then the variance between and within groups will be equal.between and within groups will be equal.
• Expected variation is used to calculate statistical Expected variation is used to calculate statistical significance in the same way that expected significance in the same way that expected differences in means are used in t-tests or z-testsdifferences in means are used in t-tests or z-tests
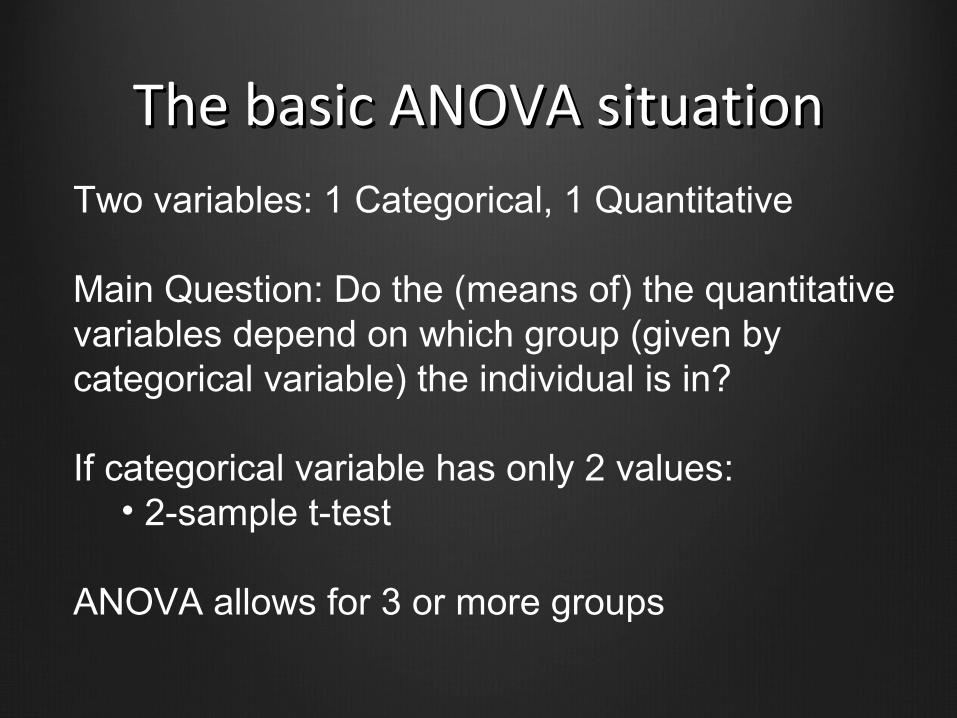
The basic ANOVA situationThe basic ANOVA situationTwo variables: 1 Categorical, 1 Quantitative
Main Question: Do the (means of) the quantitative variables depend on which group (given by categorical variable) the individual is in?
If categorical variable has only 2 values: • 2-sample t-test
ANOVA allows for 3 or more groups
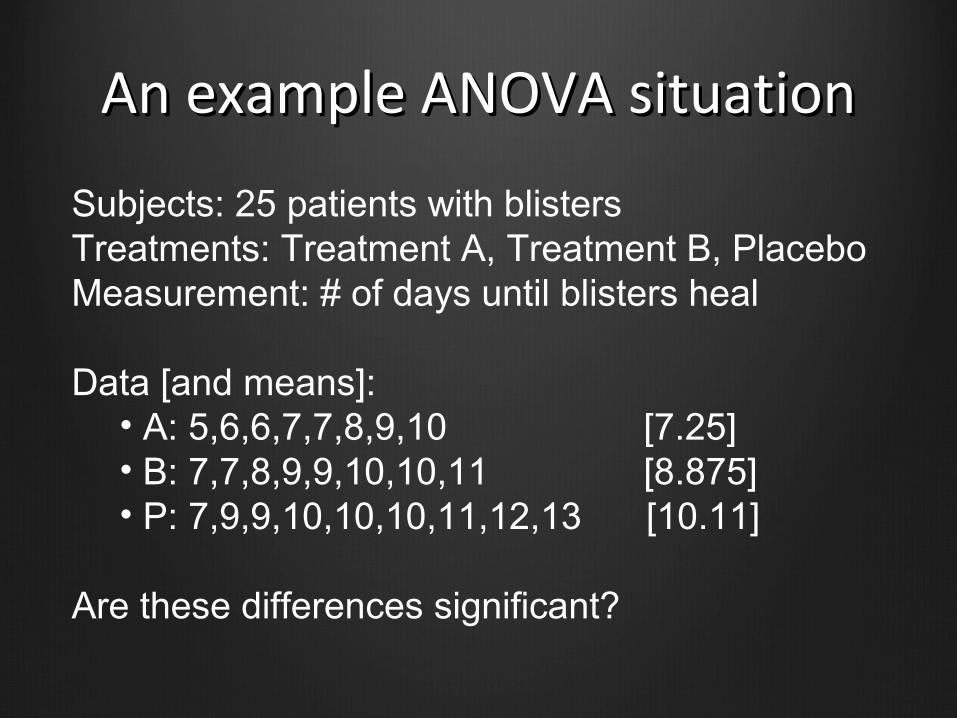
An example ANOVA situationAn example ANOVA situation
Subjects: 25 patients with blistersTreatments: Treatment A, Treatment B, PlaceboMeasurement: # of days until blisters heal
Data [and means]:• A: 5,6,6,7,7,8,9,10 [7.25]• B: 7,7,8,9,9,10,10,11 [8.875]• P: 7,9,9,10,10,10,11,12,13 [10.11]
Are these differences significant?
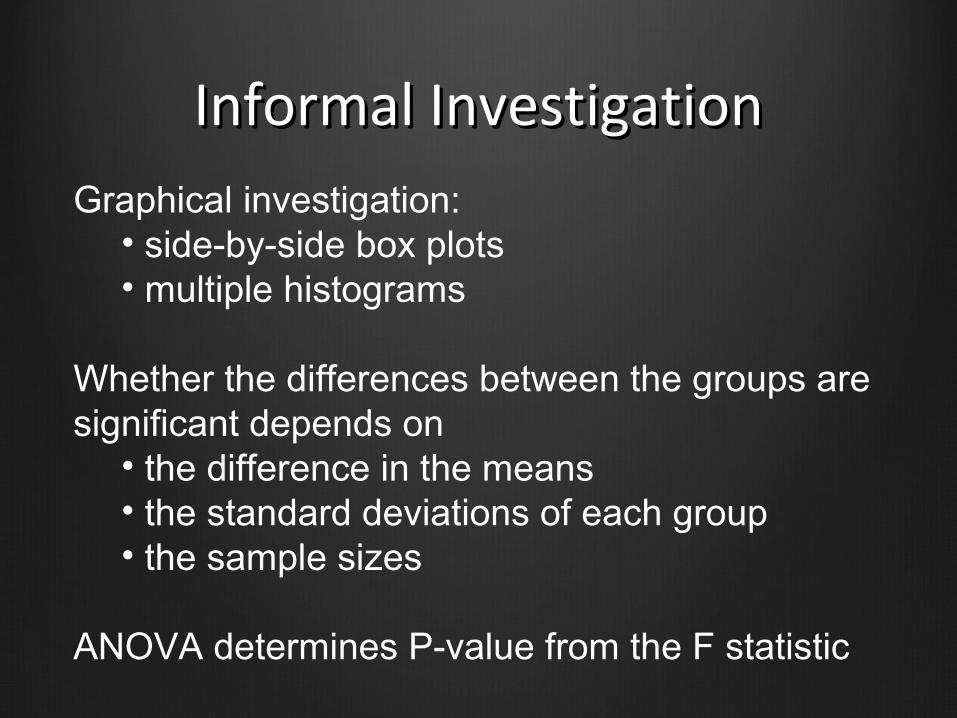
Informal InvestigationInformal InvestigationGraphical investigation:
• side-by-side box plots• multiple histograms
Whether the differences between the groups are significant depends on
• the difference in the means• the standard deviations of each group• the sample sizes
ANOVA determines P-value from the F statistic

Side by Side BoxplotsSide by Side Boxplots
PBA
13
12
11
10
9
8
7
6
5
treatment
days
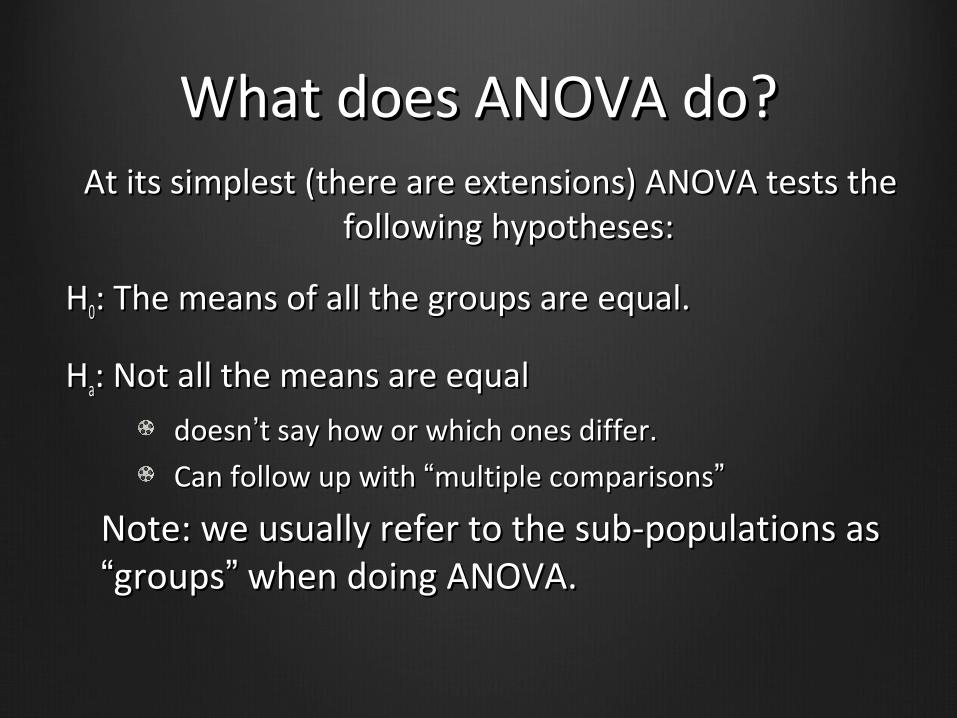
What does ANOVA do?What does ANOVA do?At its simplest (there are extensions) ANOVA tests the At its simplest (there are extensions) ANOVA tests the
following hypotheses:following hypotheses:
HH00: The means of all the groups are equal.: The means of all the groups are equal.
HHaa: Not all the means are equal: Not all the means are equal
doesndoesn’’t say how or which ones differ.t say how or which ones differ.
Can follow up with Can follow up with ““multiple comparisonsmultiple comparisons””
Note: we usually refer to the sub-populations as Note: we usually refer to the sub-populations as ““groupsgroups”” when doing ANOVA. when doing ANOVA.
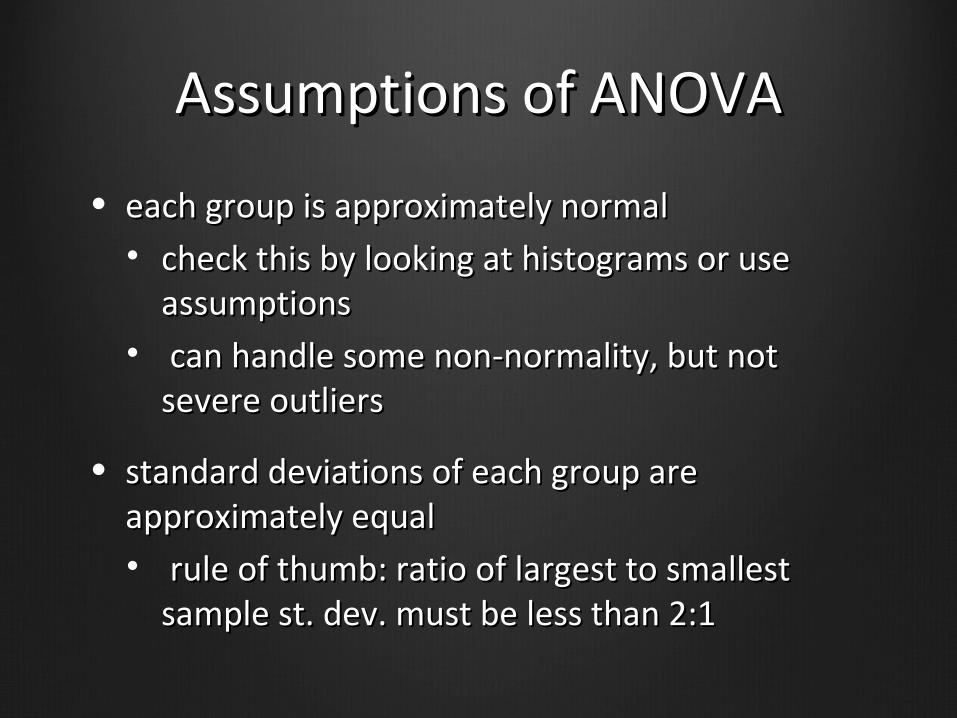
Assumptions of ANOVAAssumptions of ANOVA
• each group is approximately normaleach group is approximately normal• check this by looking at histograms or use check this by looking at histograms or use
assumptionsassumptions• can handle some non-normality, but not can handle some non-normality, but not
severe outlierssevere outliers
• standard deviations of each group are standard deviations of each group are approximately equalapproximately equal• rule of thumb: ratio of largest to smallest rule of thumb: ratio of largest to smallest
sample st. dev. must be less than 2:1sample st. dev. must be less than 2:1
Normality CheckNormality Check
We should check for normality using:• assumptions about population • histograms for each group
With such small data sets, there really isn’t a really good way to check normality from data, but we make the common assumption that physical measurements of people tend to be normally distributed.

Notation for ANOVANotation for ANOVA
• n = number of individuals all together• k = number of groups• = mean for entire data set is
Group i has• ni = # of individuals in group i• xij = value for individual j in group i• = mean for group i• si = standard deviation for group i
ix
x
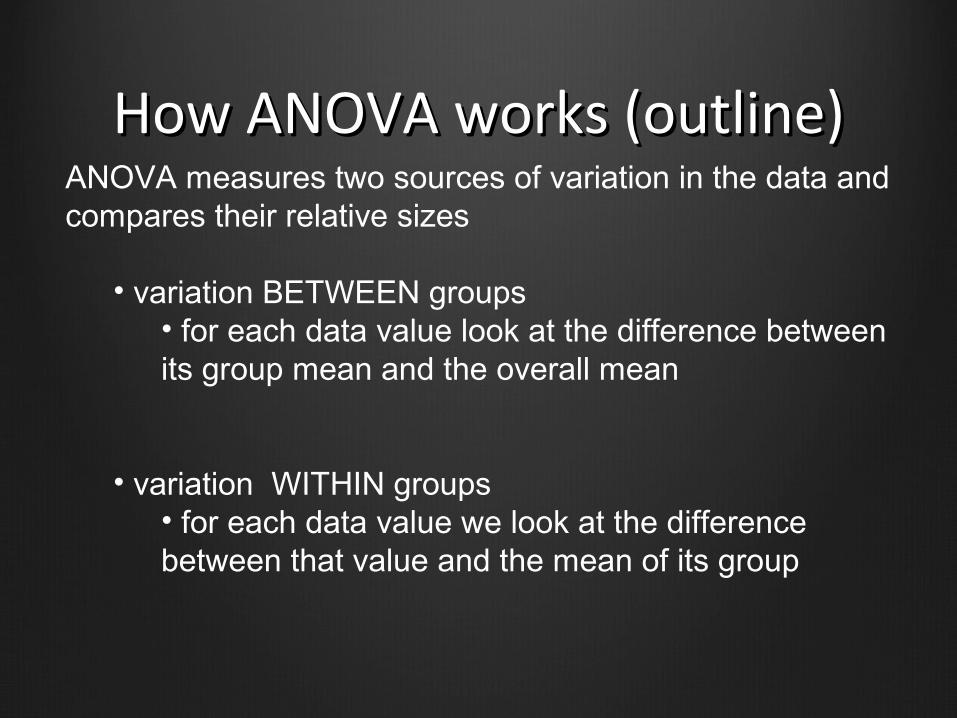
How ANOVA works (outline)How ANOVA works (outline)ANOVA measures two sources of variation in the data and compares their relative sizes
• variation BETWEEN groups• for each data value look at the difference between its group mean and the overall mean
• variation WITHIN groups • for each data value we look at the difference between that value and the mean of its group
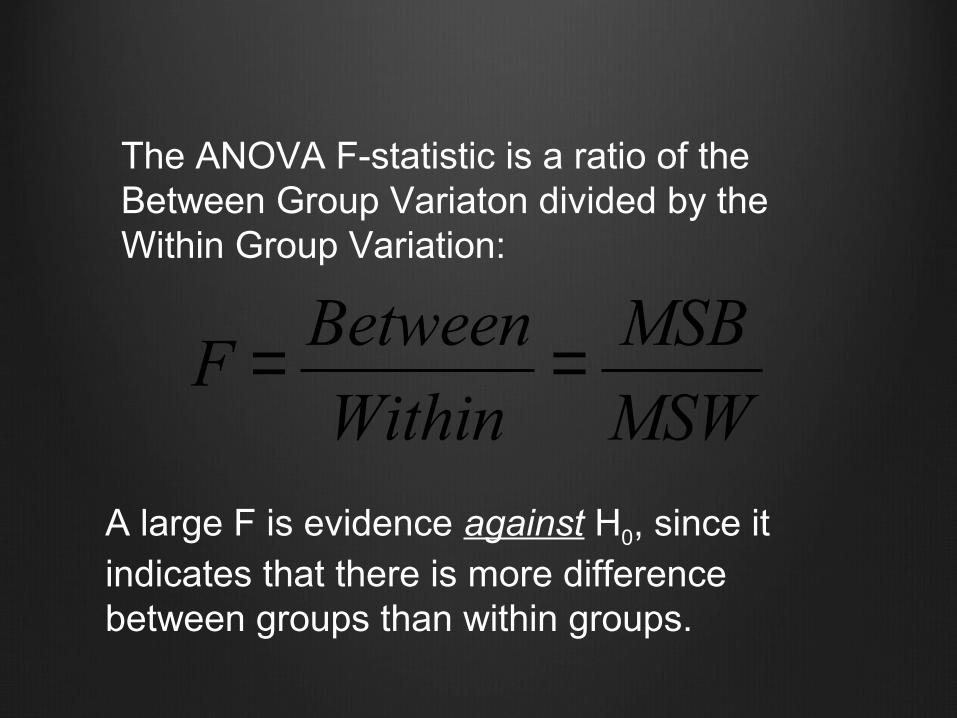
The ANOVA F-statistic is a ratio of the Between Group Variaton divided by the Within Group Variation:
F = Between
Within= MSB
MSW
A large F is evidence against H0, since it indicates that there is more difference between groups than within groups.
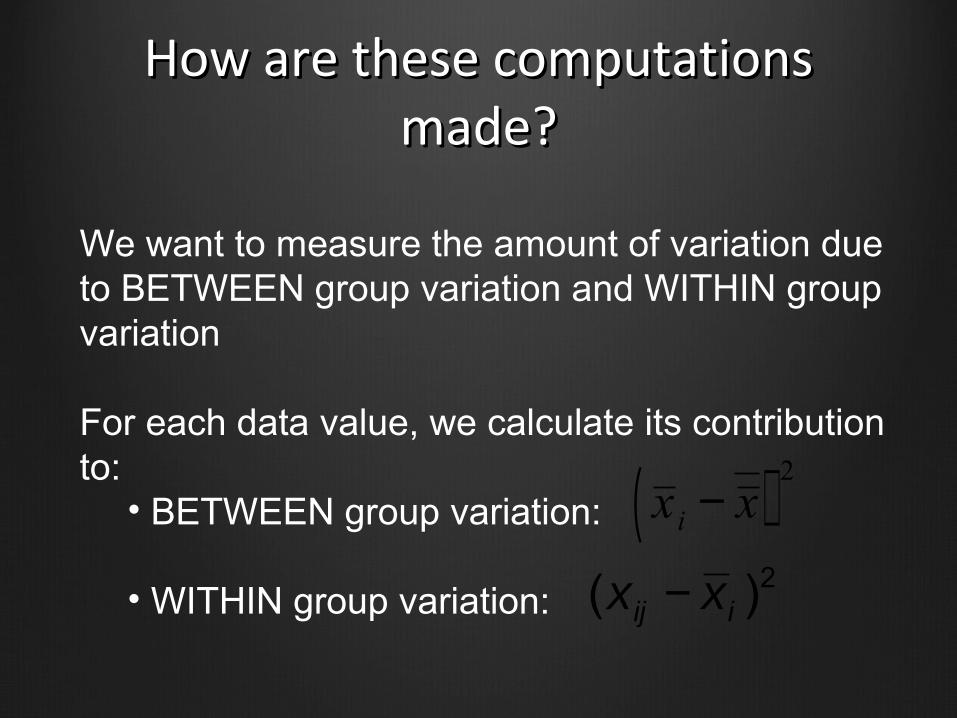
How are these computations How are these computations made?made?
We want to measure the amount of variation due to BETWEEN group variation and WITHIN group variation
For each data value, we calculate its contribution to:
• BETWEEN group variation:
• WITHIN group variation:
x i − x ( ) 22)( iij xx −
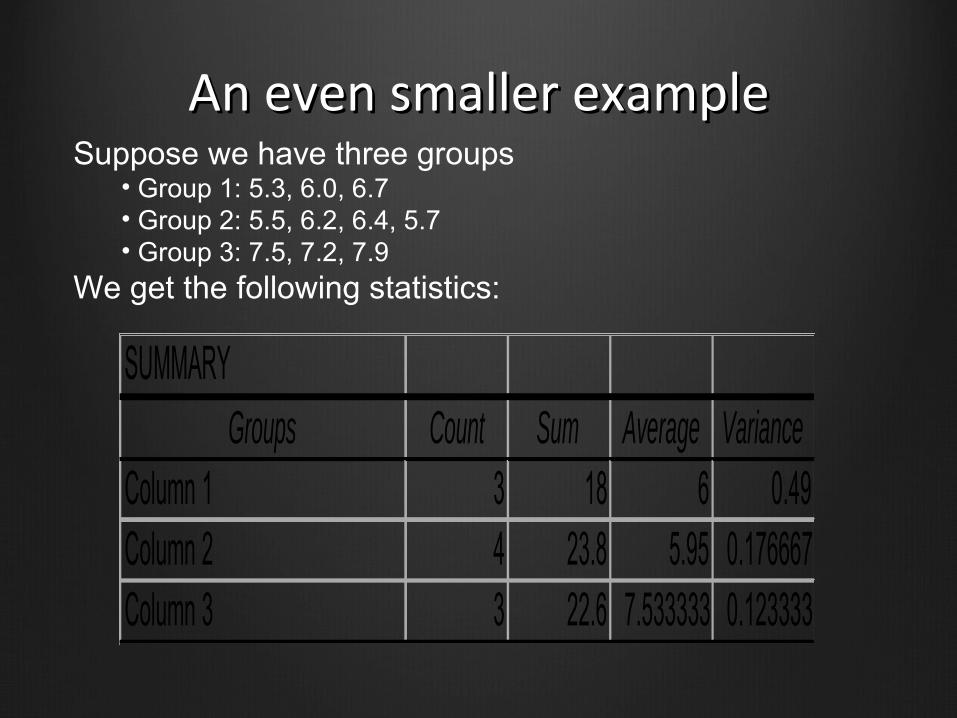
An even smaller exampleAn even smaller exampleSuppose we have three groups
• Group 1: 5.3, 6.0, 6.7• Group 2: 5.5, 6.2, 6.4, 5.7• Group 3: 7.5, 7.2, 7.9
We get the following statistics:
SUMMARYGroups Count Sum Average Variance
Column 1 3 18 6 0.49Column 2 4 23.8 5.95 0.176667Column 3 3 22.6 7.533333 0.123333
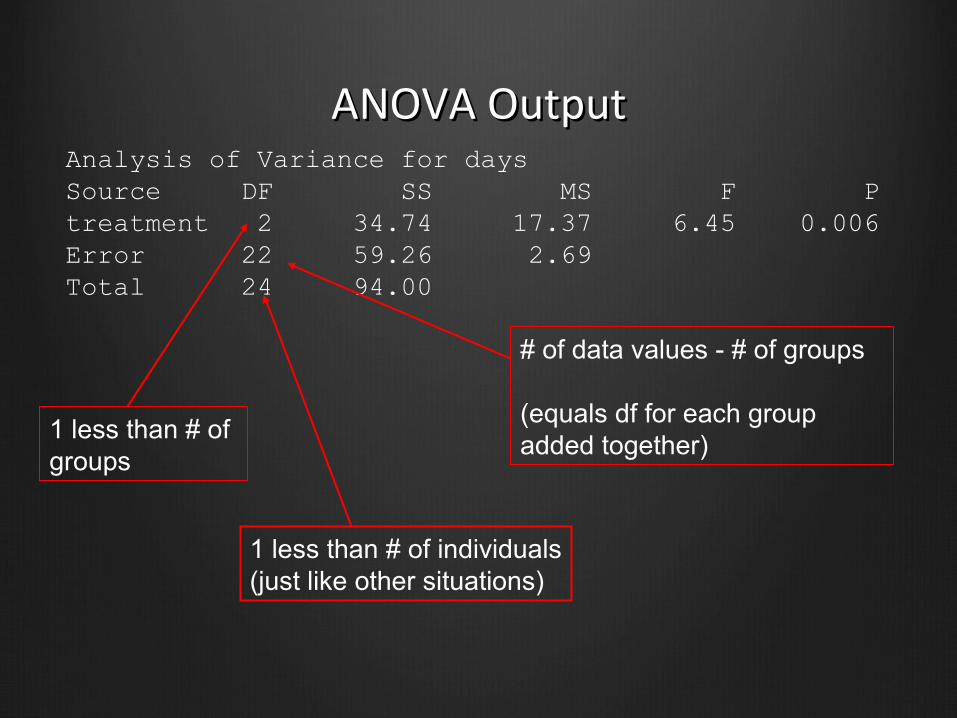
Analysis of Variance for days Source DF SS MS F Ptreatment 2 34.74 17.37 6.45 0.006Error 22 59.26 2.69Total 24 94.00
ANOVA OutputANOVA Output
1 less than # of groups
# of data values - # of groups
(equals df for each group added together)
1 less than # of individuals(just like other situations)
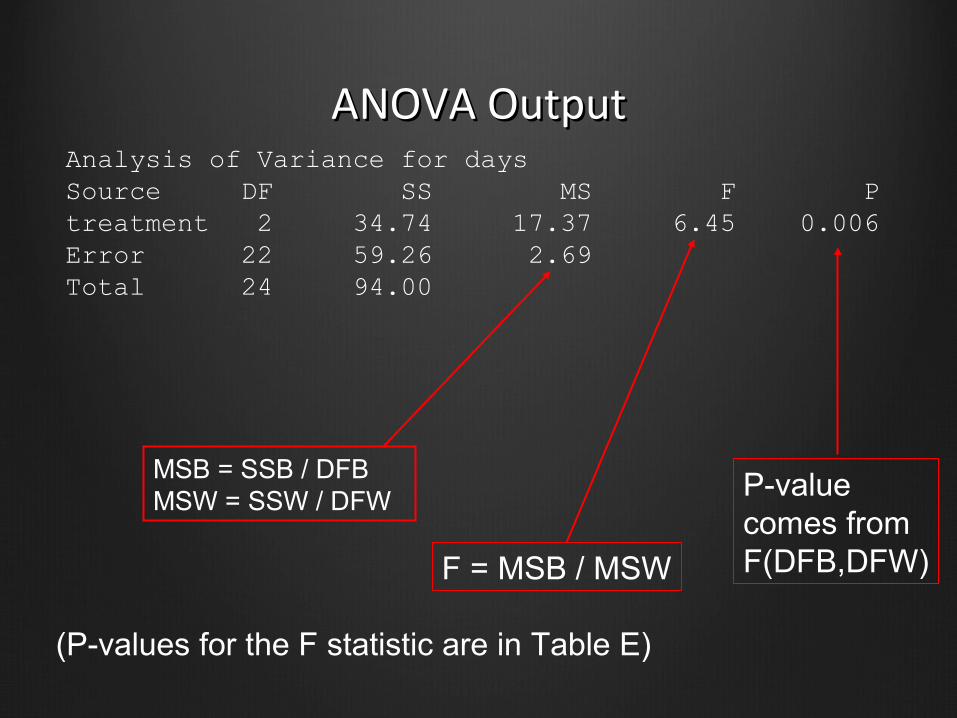
ANOVA OutputANOVA Output
MSB = SSB / DFBMSW = SSW / DFW
Analysis of Variance for days Source DF SS MS F Ptreatment 2 34.74 17.37 6.45 0.006Error 22 59.26 2.69Total 24 94.00
F = MSB / MSW
P-valuecomes fromF(DFB,DFW)
(P-values for the F statistic are in Table E)
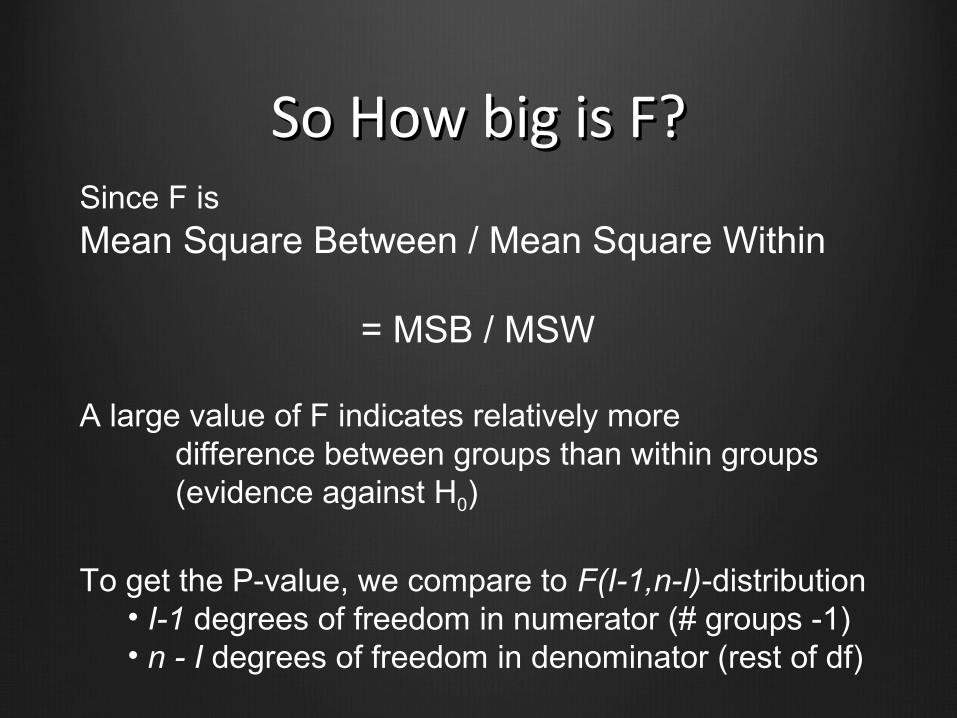
So How big is F?So How big is F?Since F is Mean Square Between / Mean Square Within
= MSB / MSW
A large value of F indicates relatively moredifference between groups than within groups (evidence against H0)
To get the P-value, we compare to F(I-1,n-I)-distribution• I-1 degrees of freedom in numerator (# groups -1)• n - I degrees of freedom in denominator (rest of df)
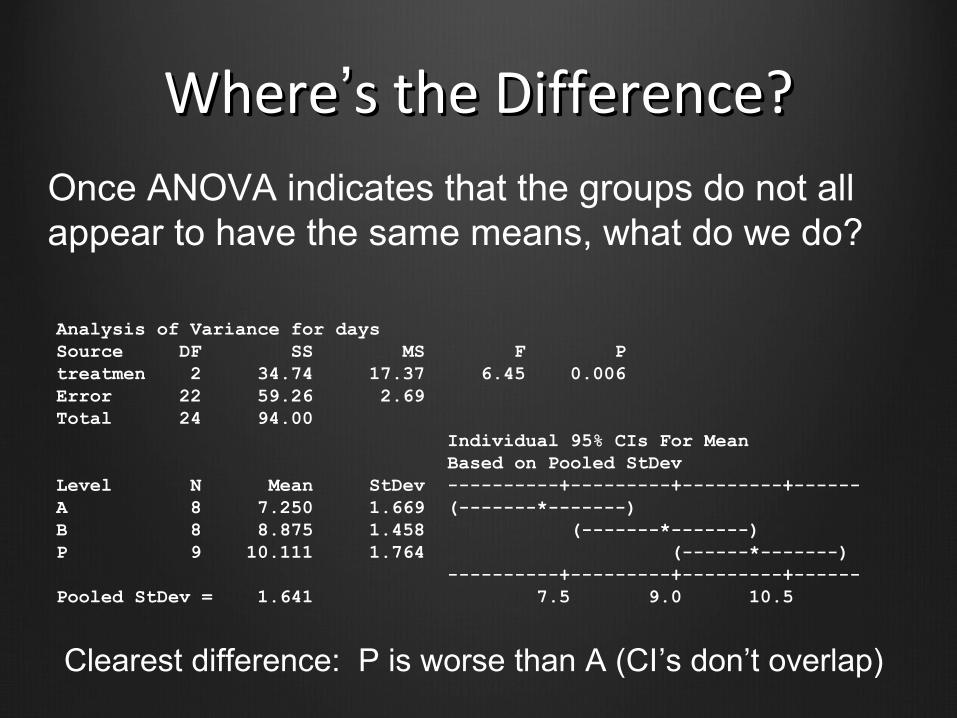
WhereWhere’’s the Difference?s the Difference?
Analysis of Variance for days Source DF SS MS F Ptreatmen 2 34.74 17.37 6.45 0.006Error 22 59.26 2.69Total 24 94.00 Individual 95% CIs For Mean Based on Pooled StDevLevel N Mean StDev ----------+---------+---------+------A 8 7.250 1.669 (-------*-------) B 8 8.875 1.458 (-------*-------) P 9 10.111 1.764 (------*-------) ----------+---------+---------+------Pooled StDev = 1.641 7.5 9.0 10.5
Once ANOVA indicates that the groups do not all appear to have the same means, what do we do?
Clearest difference: P is worse than A (CI’s don’t overlap)

![[PPT]PowerPoint Presentation - ANOVA: Analysis of Variationrpruim/courses/m243/F03/overheads... · Web viewANOVA: Analysis of Variation Math 243 Lecture R. Pruim The basic ANOVA situation](https://img.dokumen.tips/doc/110x75/5ae47dc57f8b9a495c8e9ed4/pptpowerpoint-presentation-anova-analysis-of-rpruimcoursesm243f03overheadsweb.jpg)