Embed Size (px)
Citation preview
Active Transportation Research at Northern Arizona University EDWARD J. SMAGLIK, PH.D., P.E.
13 FEBRUARY 2015

Academic Background Born and raised in Milwaukee, WI
Attended Marquette University BS Civil Engineering, 1999

Academic Background Purdue University MSCE Civil Engineering, 2001
(Construction Engineering and Management) Ph.D. Civil Engineering, 2005
(Transportation Engineering) Post-Doc (2005-2007) Northern Arizona University Assistant Professor (2007-2013) Associate Professor (2013+)

Professional Background Northern Arizona University Courses Taught: Traffic Signals and Studies Advanced Traffic Signal Systems Computer Aided Drafting Urban Transportation Planning
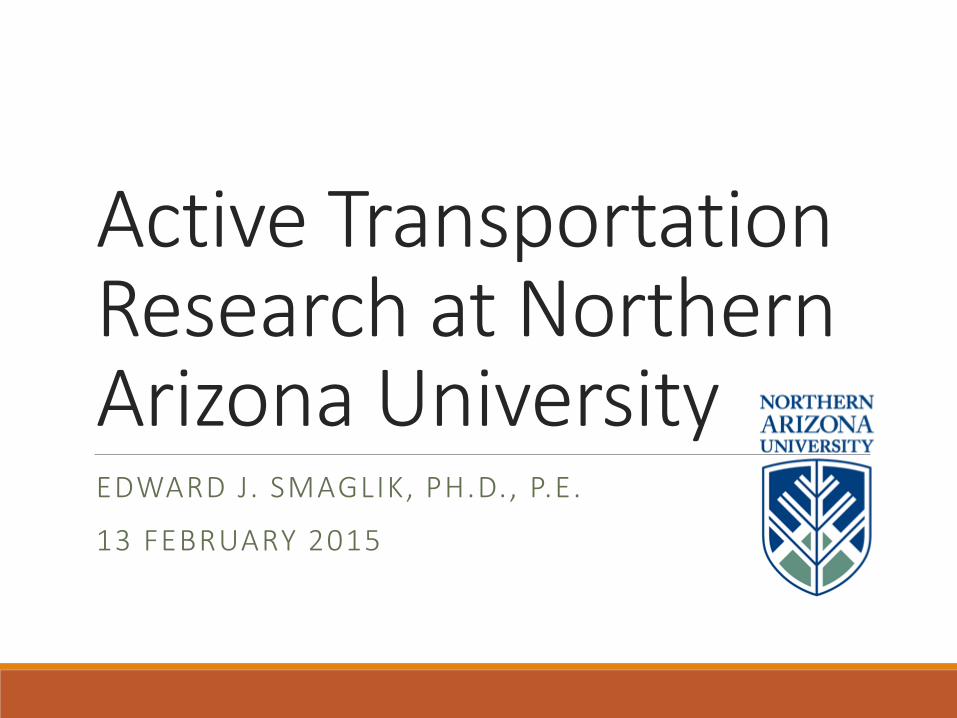
NAU Undergraduate Transportation Courses Required coursework No survey course Highway Design and Operations Complete design of highway section Traffic Signals and Studies
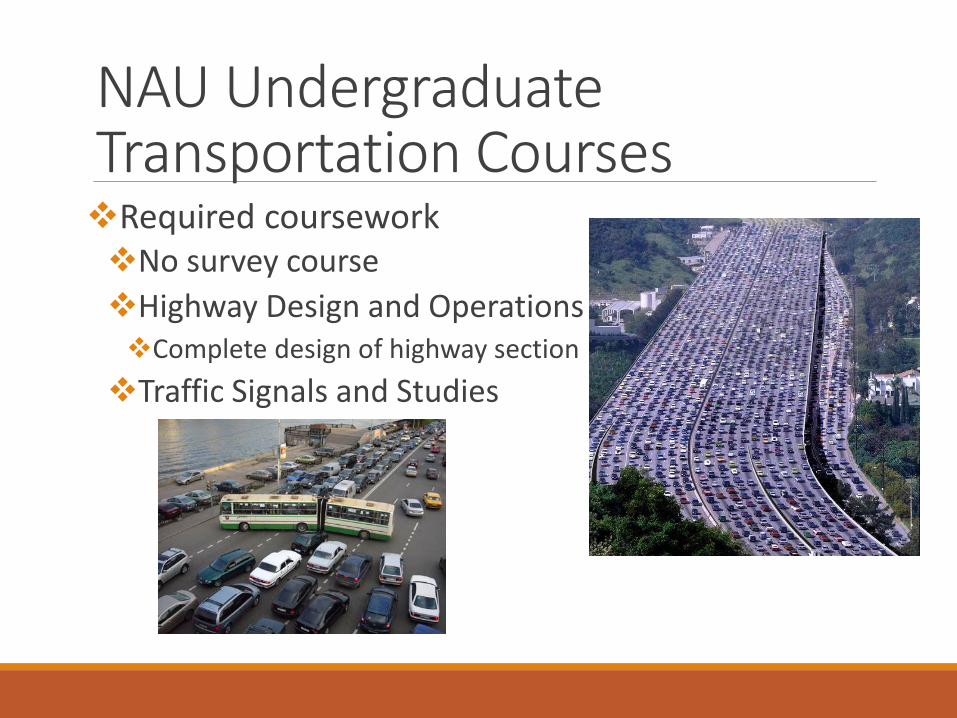
Select Past NAU Funded Research Work Development of Signalized Intersection Performance Measures –Phases 1 and 2
Snowplay Congestion Analysis
Impact of Penalty Feedback on Work Zone Speed Development of a Span Wire Specification For ADOT
Observational Sign Sheeting Study
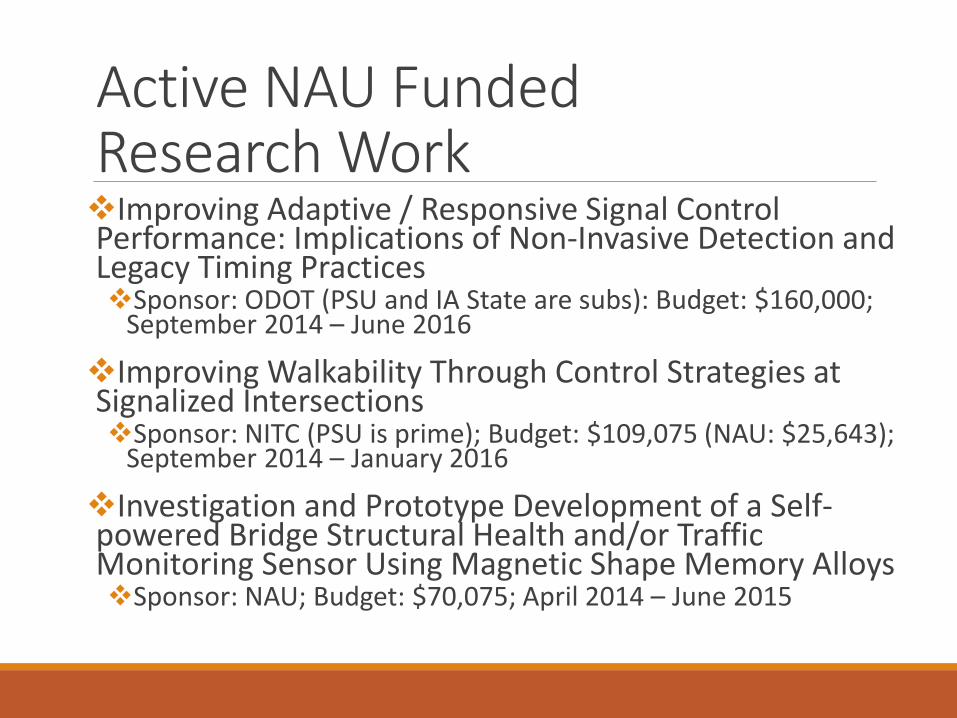
Active NAU Funded Research Work Improving Adaptive / Responsive Signal Control Performance: Implications of Non-Invasive Detection and Legacy Timing Practices Sponsor: ODOT (PSU and IA State are subs): Budget: $160,000;
September 2014 – June 2016
Improving Walkability Through Control Strategies at Signalized Intersections Sponsor: NITC (PSU is prime); Budget: $109,075 (NAU: $25,643);
September 2014 – January 2016
Investigation and Prototype Development of a Self-powered Bridge Structural Health and/or Traffic Monitoring Sensor Using Magnetic Shape Memory Alloys Sponsor: NAU; Budget: $70,075; April 2014 – June 2015
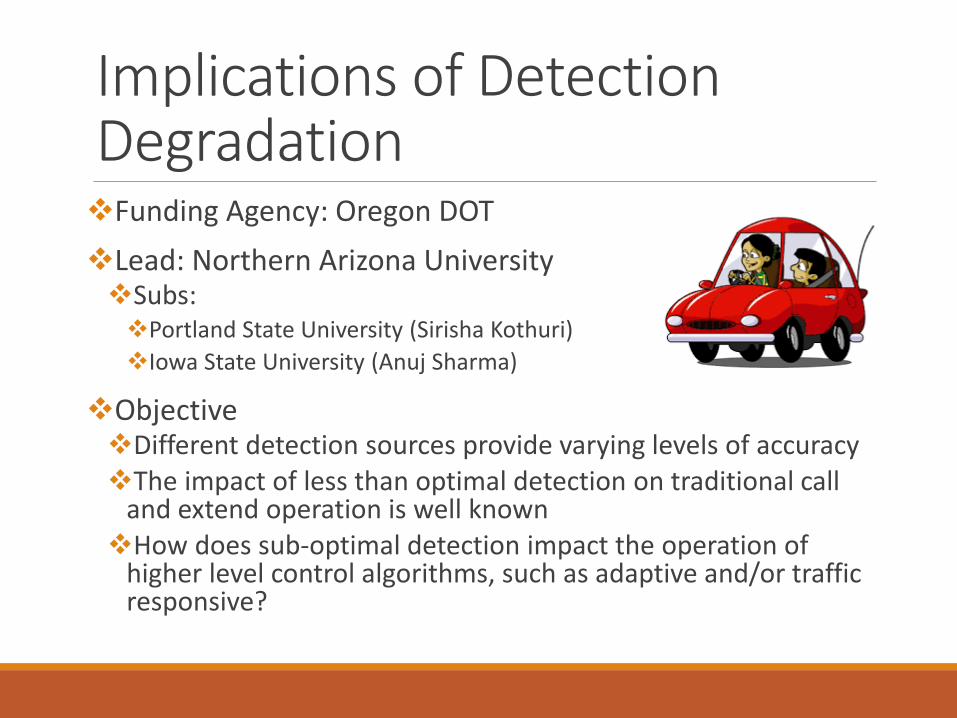
Implications of Detection Degradation Funding Agency: Oregon DOT Lead: Northern Arizona University Subs: Portland State University (Sirisha Kothuri) Iowa State University (Anuj Sharma)
Objective Different detection sources provide varying levels of accuracy The impact of less than optimal detection on traditional call
and extend operation is well known How does sub-optimal detection impact the operation of
higher level control algorithms, such as adaptive and/or traffic responsive?
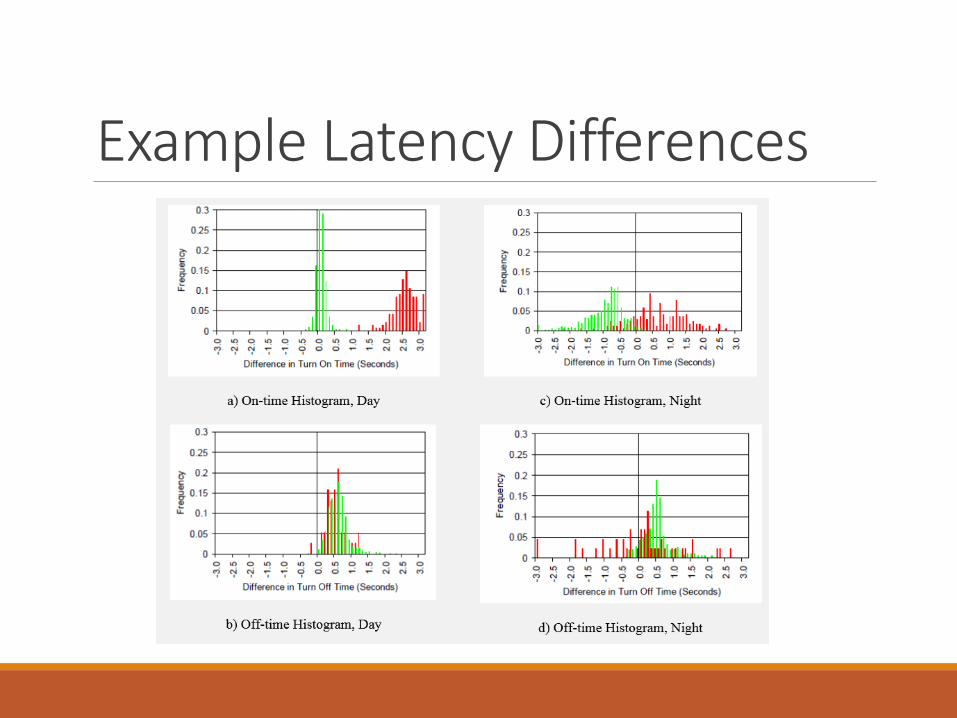
Example Latency Differences
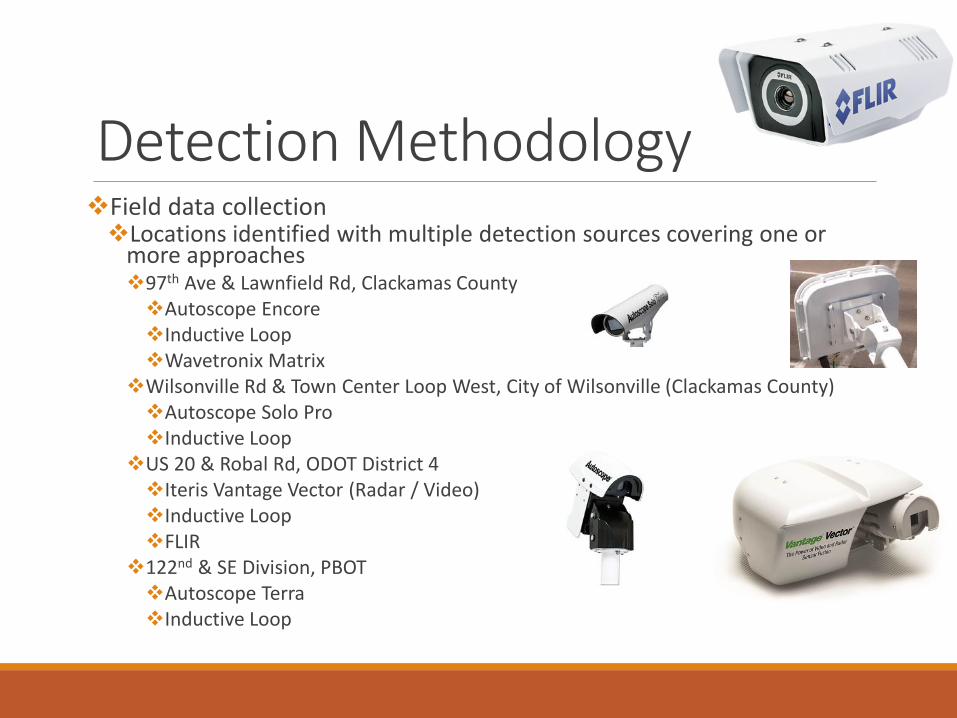
Detection Methodology Field data collection Locations identified with multiple detection sources covering one or
more approaches 97th Ave & Lawnfield Rd, Clackamas County Autoscope Encore Inductive Loop Wavetronix Matrix
Wilsonville Rd & Town Center Loop West, City of Wilsonville (Clackamas County) Autoscope Solo Pro Inductive Loop
US 20 & Robal Rd, ODOT District 4 Iteris Vantage Vector (Radar / Video) Inductive Loop FLIR
122nd & SE Division, PBOT Autoscope Terra Inductive Loop
Detection Methodology Field data collection Collect event based operational data (detector and
phase statuses) under varying traffic regimes
Error modeling and simulation Using collected field data, develop statistical error
models Missed Call model True call start- and end-time False call models False call duration Intra-false call duration
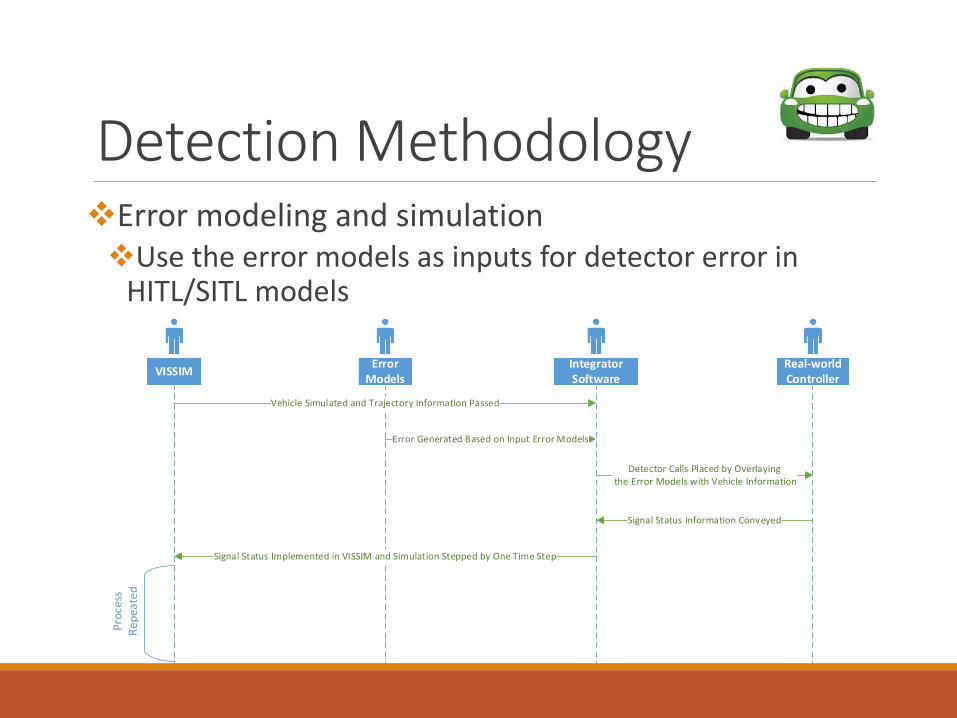
Detection Methodology Error modeling and simulation Use the error models as inputs for detector error in
HITL/SITL models
VISSIM Error Models
Real-world Controller
Vehicle Simulated and Trajectory Information Passed
Detector Calls Placed by Overlaying the Error Models with Vehicle Information
Signal Status Information Conveyed
Integrator Software
Error Generated Based on Input Error Models
Signal Status Implemented in VISSIM and Simulation Stepped by One Time Step
Proc
ess
Repe
ated
Detection Methodology Error modeling and simulation (continued) Evaluate simulation models under varying traffic and
operational scenarios
Comparison and cost analysis Corroborate level of detector error with impact on traffic
operations Perform cost/benefit analysis focusing on equipment and
installation costs as well as the cost of increased delay due to degradation of detection performance Provide guidance to sponsor on prototypical detection
configurations with the goal of reducing performance degradation due to vehicle detection
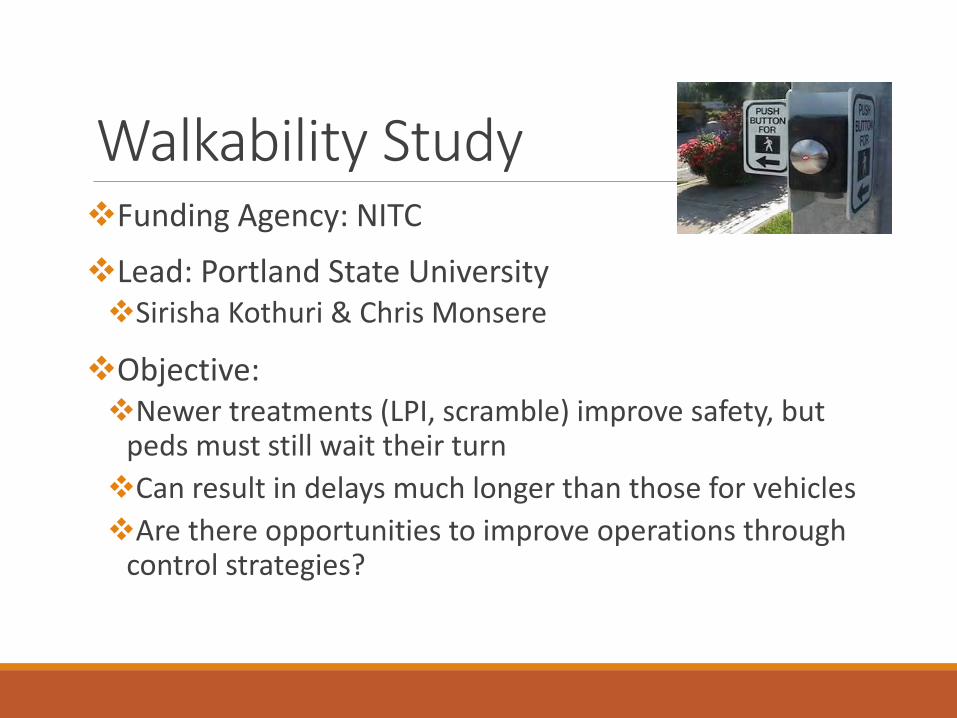
Walkability Study Funding Agency: NITC
Lead: Portland State University Sirisha Kothuri & Chris Monsere
Objective: Newer treatments (LPI, scramble) improve safety, but
peds must still wait their turn Can result in delays much longer than those for vehicles Are there opportunities to improve operations through
control strategies?
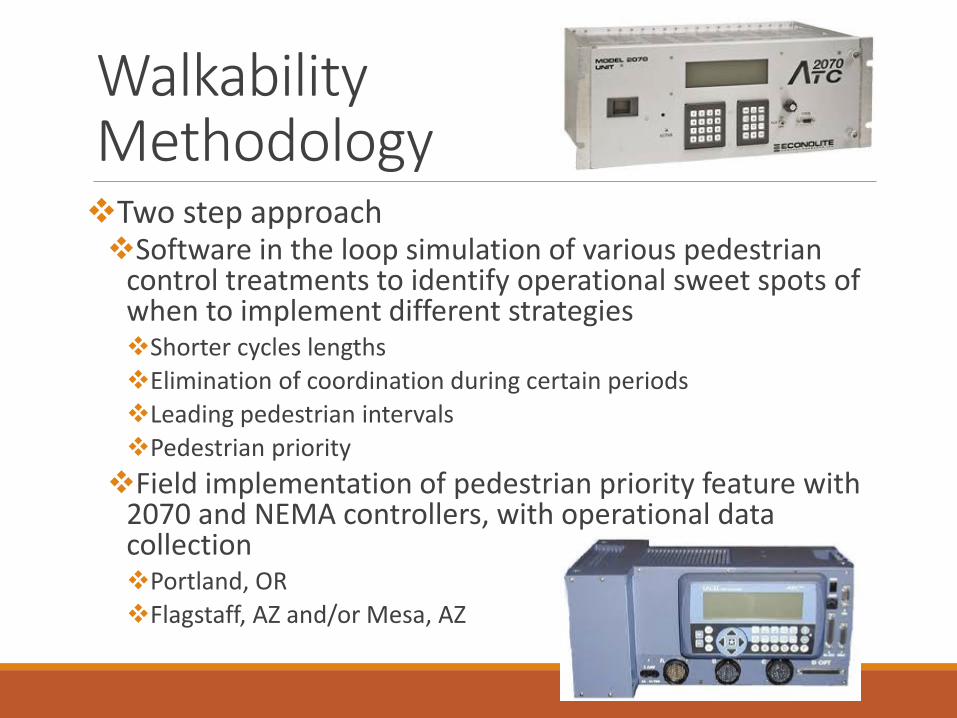
Walkability Methodology Two step approach Software in the loop simulation of various pedestrian
control treatments to identify operational sweet spots of when to implement different strategies Shorter cycles lengths Elimination of coordination during certain periods Leading pedestrian intervals Pedestrian priority Field implementation of pedestrian priority feature with
2070 and NEMA controllers, with operational data collection Portland, OR Flagstaff, AZ and/or Mesa, AZ
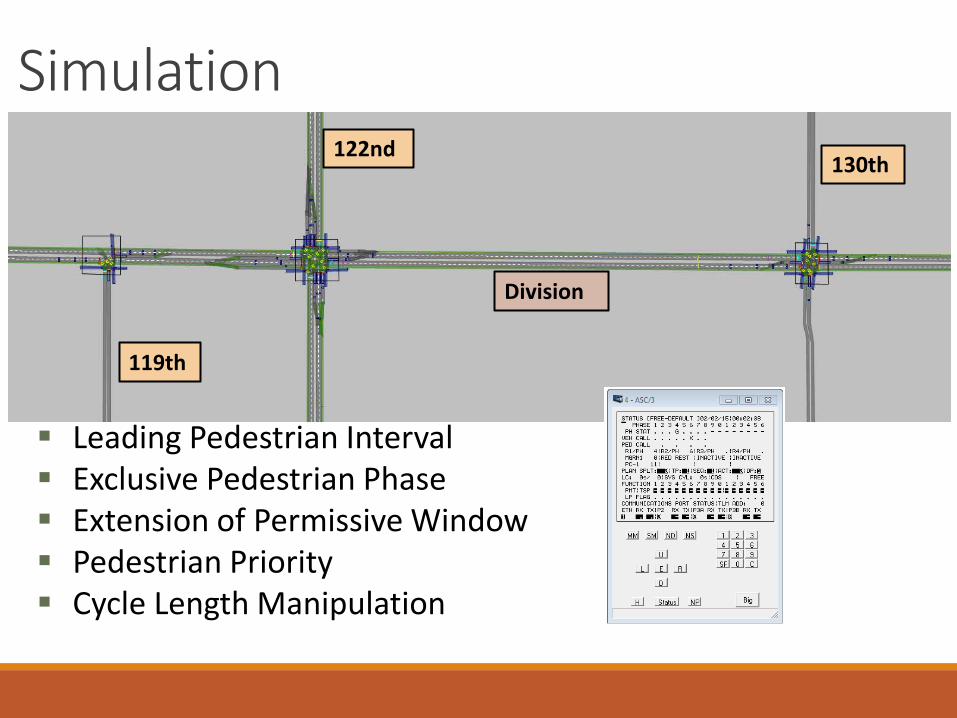
Simulation
119th
122nd 130th
Division
Leading Pedestrian Interval Exclusive Pedestrian Phase Extension of Permissive Window Pedestrian Priority Cycle Length Manipulation
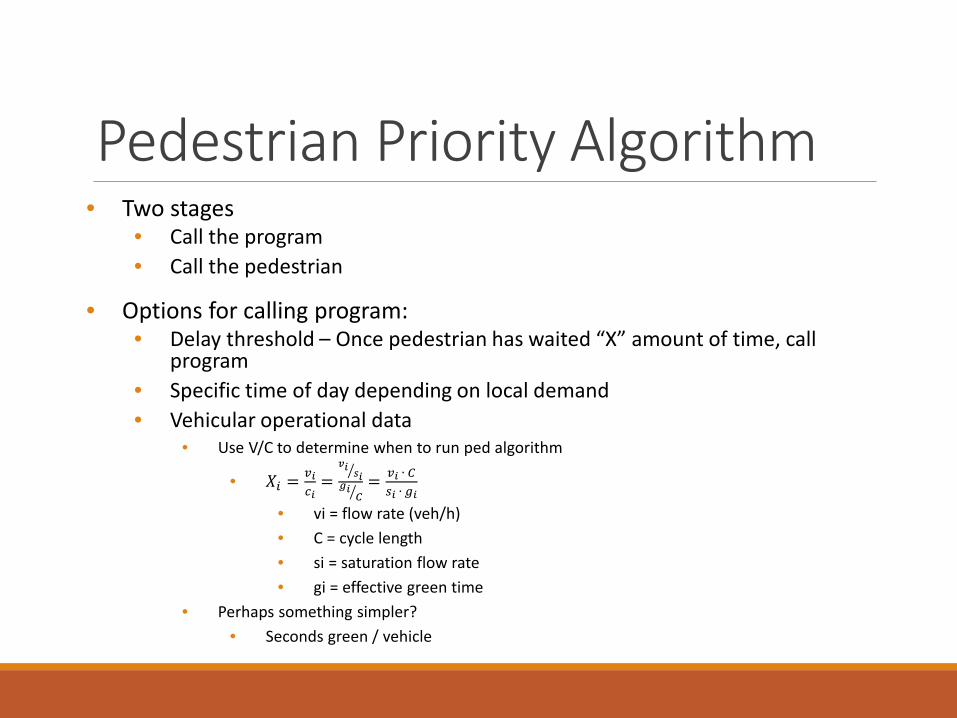
Pedestrian Priority Algorithm • Two stages
• Call the program • Call the pedestrian
• Options for calling program: • Delay threshold – Once pedestrian has waited “X” amount of time, call
program • Specific time of day depending on local demand • Vehicular operational data
• Use V/C to determine when to run ped algorithm
• 𝑋𝑋𝑖𝑖 = 𝑣𝑣𝑖𝑖𝑐𝑐𝑖𝑖
=𝑣𝑣𝑖𝑖 𝑠𝑠𝑖𝑖�𝑔𝑔𝑖𝑖
𝐶𝐶�= 𝑣𝑣𝑖𝑖 ∙ 𝐶𝐶
𝑠𝑠𝑖𝑖 ∙ 𝑔𝑔𝑖𝑖
• vi = flow rate (veh/h) • C = cycle length • si = saturation flow rate • gi = effective green time
• Perhaps something simpler? • Seconds green / vehicle
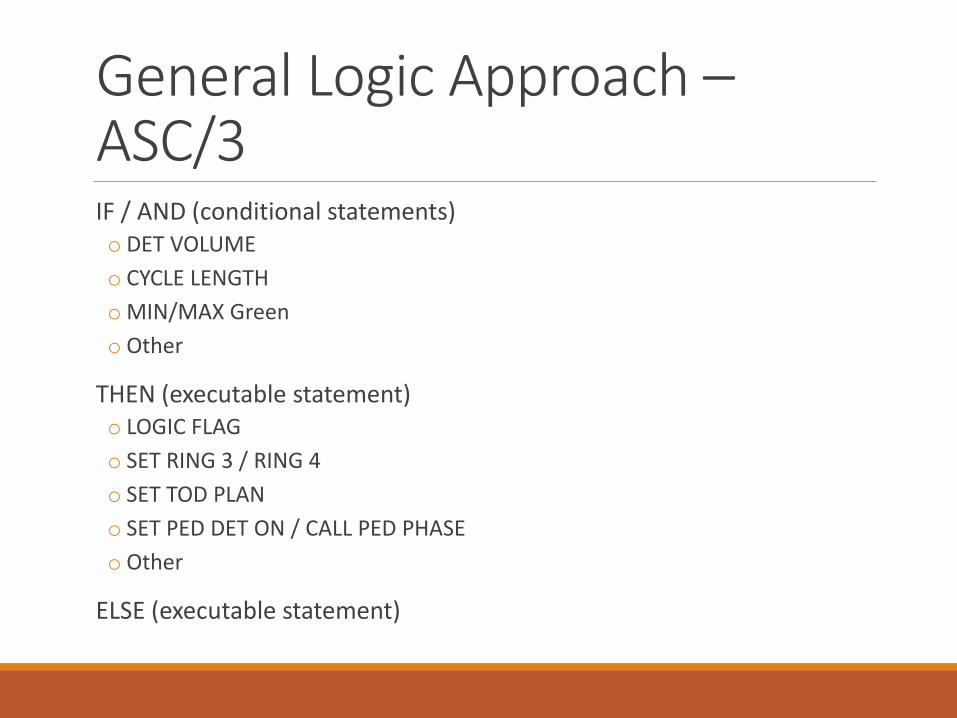
General Logic Approach – ASC/3
IF / AND (conditional statements) o DET VOLUME o CYCLE LENGTH oMIN/MAX Green o Other
THEN (executable statement) o LOGIC FLAG o SET RING 3 / RING 4 o SET TOD PLAN o SET PED DET ON / CALL PED PHASE o Other
ELSE (executable statement)
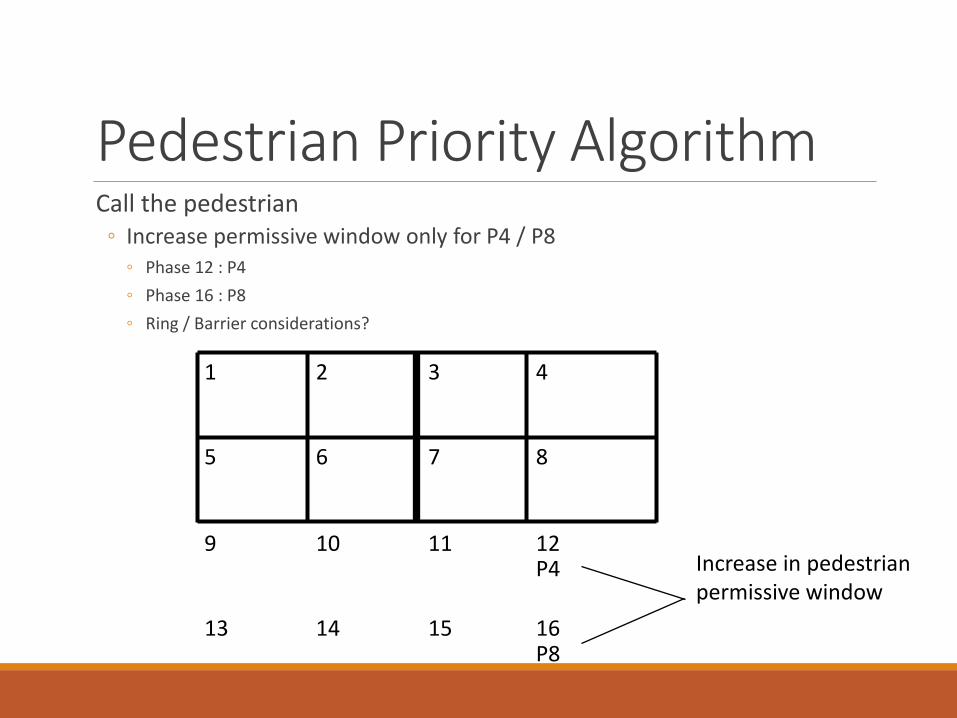
Pedestrian Priority Algorithm Call the pedestrian ◦ Increase permissive window only for P4 / P8
◦ Phase 12 : P4 ◦ Phase 16 : P8 ◦ Ring / Barrier considerations?
1 2 3 4
5 6 7 8
9 10 11 12
13 14 15 16
P4
P8
Increase in pedestrian permissive window
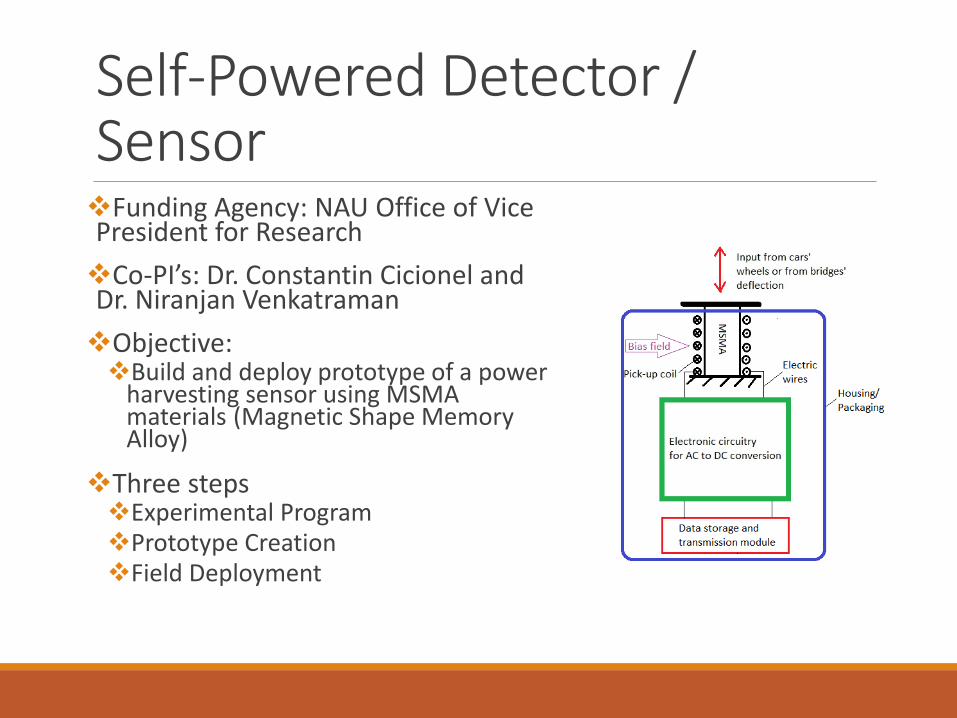
Self-Powered Detector / Sensor Funding Agency: NAU Office of Vice President for Research Co-PI’s: Dr. Constantin Cicionel and Dr. Niranjan Venkatraman Objective: Build and deploy prototype of a power
harvesting sensor using MSMA materials (Magnetic Shape Memory Alloy)
Three steps Experimental Program Prototype Creation Field Deployment
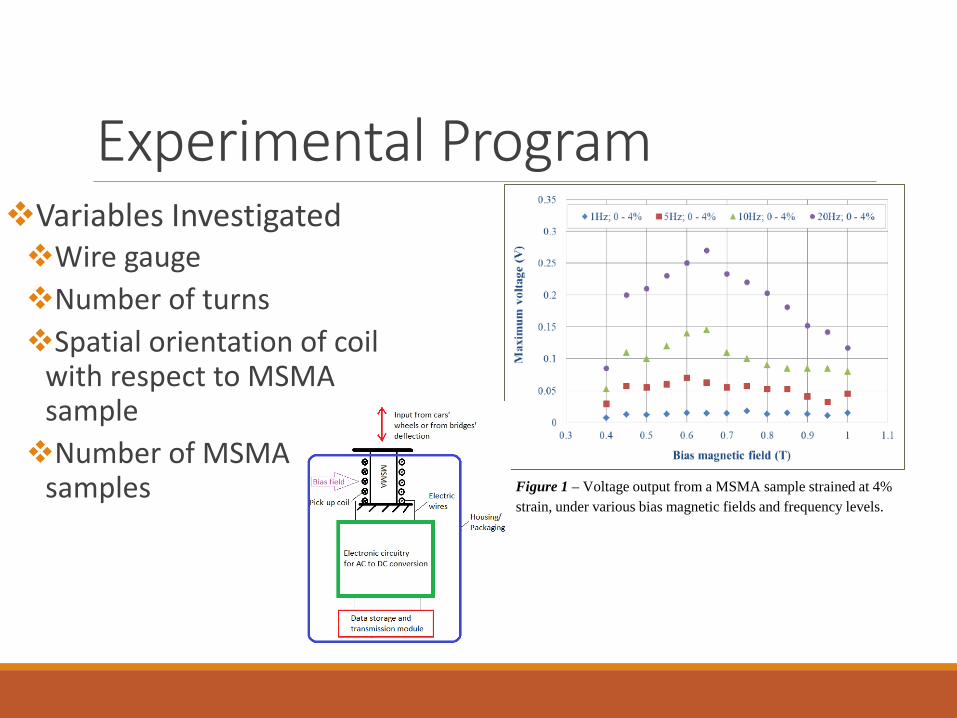
Experimental Program Variables Investigated Wire gauge Number of turns Spatial orientation of coil
with respect to MSMA sample Number of MSMA
samples Figure 1 – Voltage output from a MSMA sample strained at 4% strain, under various bias magnetic fields and frequency levels.
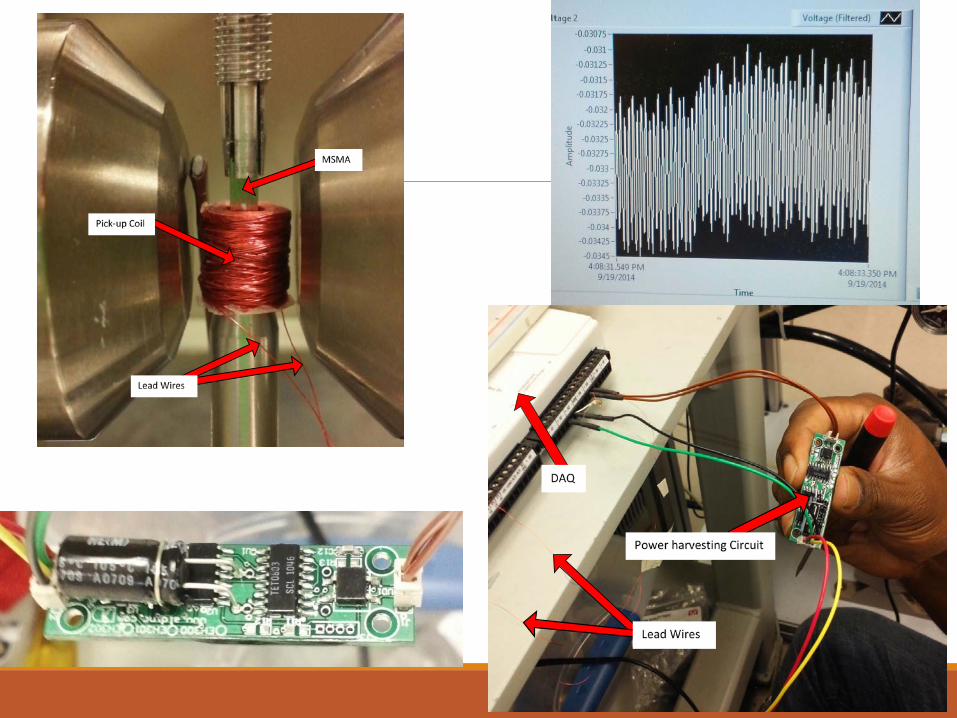
Prototype Creation and Field Deployment Prototype design in process
Likely some sort of canister type enclosure with dampening dependent upon application
NAU shop used for fabrication
Field Deployment to be undertaken upon fabrication completion
Will focus on one application, a roadway site
Sensor will be self-sustaining in deployment; likely need 24-48 hours to charge

[email protected] [email protected] Edward J. Smaglik, Ph.D., P.E. Associate Professor and Director AZTrans: The Arizona Laboratory for Applied Transportation Research Senior Intern Kittelson & Associates
Questions? Thoughts Suggestions?
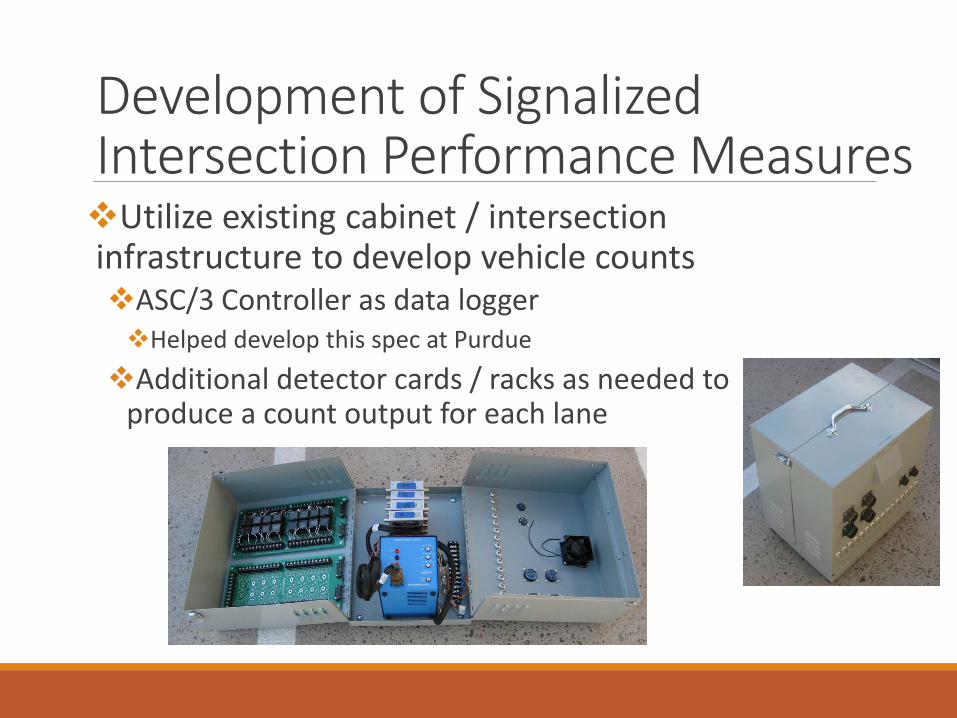
Development of Signalized Intersection Performance Measures Utilize existing cabinet / intersection infrastructure to develop vehicle counts ASC/3 Controller as data logger Helped develop this spec at Purdue Additional detector cards / racks as needed to
produce a count output for each lane
Snowplay Congestion Analysis Objective: Provide real time travel time information to road users during times of peak congestion. Using Bluetooth data collection devices, a net was cast
across the study area to attempt to develop travel times on alternate routes Ultimate determination was that there was not enough
data available to develop travel time solely based upon Bluetooth data
Impact of Penalty Feedback on Work Zone Speed Objective: Does showing road users possible fine impact vehicle speed? Using a stock ADOT VMS with radar, road users were
shown their current speed along with their possible fine. Speed data was collected prior to the VMS, with the
VMS only showing speed, VMS with speed and fine, and after with no VMS Both ‘Speed’ and ‘Speed and Fine’ reduced mean
speeds and very high speed vehicles, but ‘Speed and Fine’ performed better
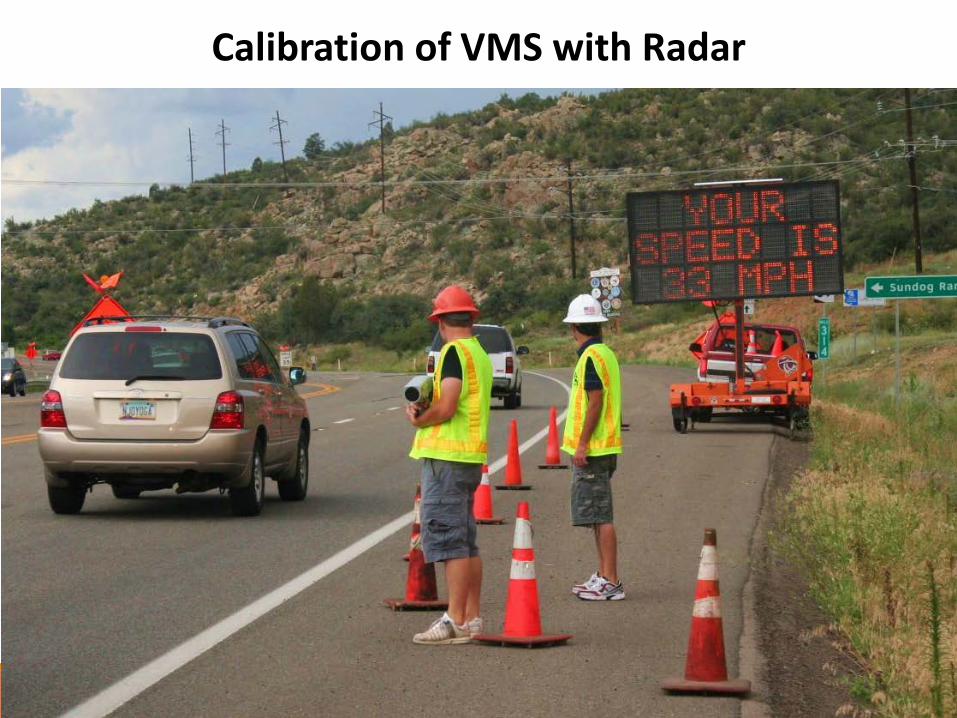
Calibration of VMS with Radar

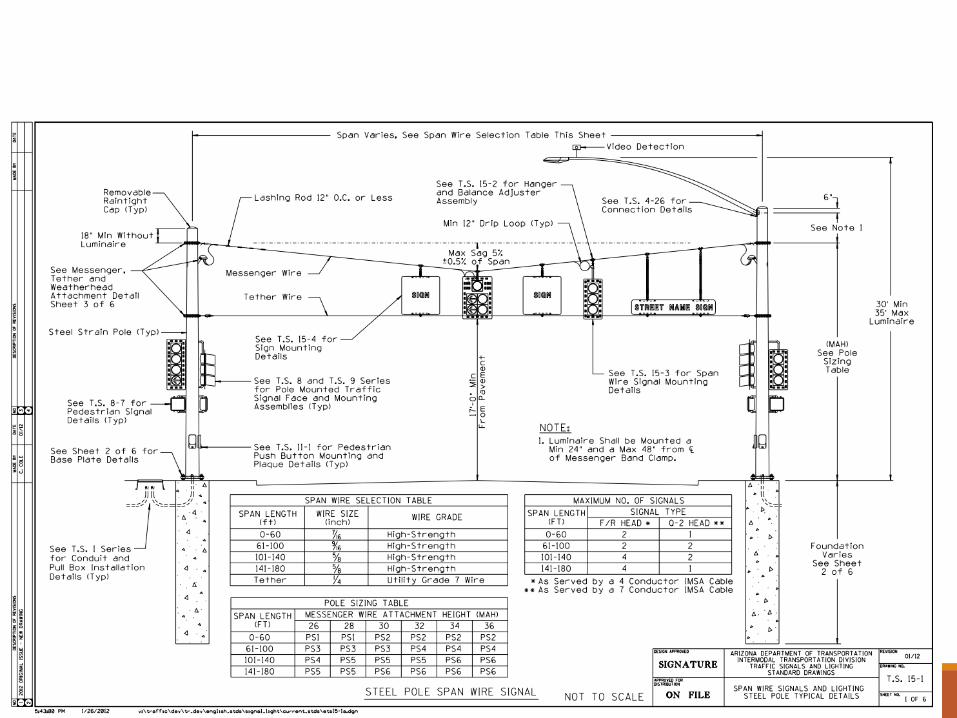
Development of Span Wire Specification for ADOT Objective: Develop a cookbook permanent and temporary span wire specification for ADOT Consulting other state specifications for hardware and
connections, NAU developed a span wire spec for ADOT where structural members are selected based span length and messenger wire height Specification is limited to specific type and amount of
items hung on the span wire, but it provides a good starting point, and much improves a virtually non-existent ADOT spec. http://www.azdot.gov/business/engineering-and-
construction/traffic/signals-and-lighting-standard-drawings (T.S. 15)

Observational Sign Sheeting Study Objective: Use observational data to compare three different sign sheetings (new “superior” sheeting vs. existing “superior”) Double blind test using three different sheetings on one
sign Test site allowed for both Static and Dynamic testing Existing material shown to be superior by both types of
tests Dynamic testing may be an acceptable surrogate for
static testing
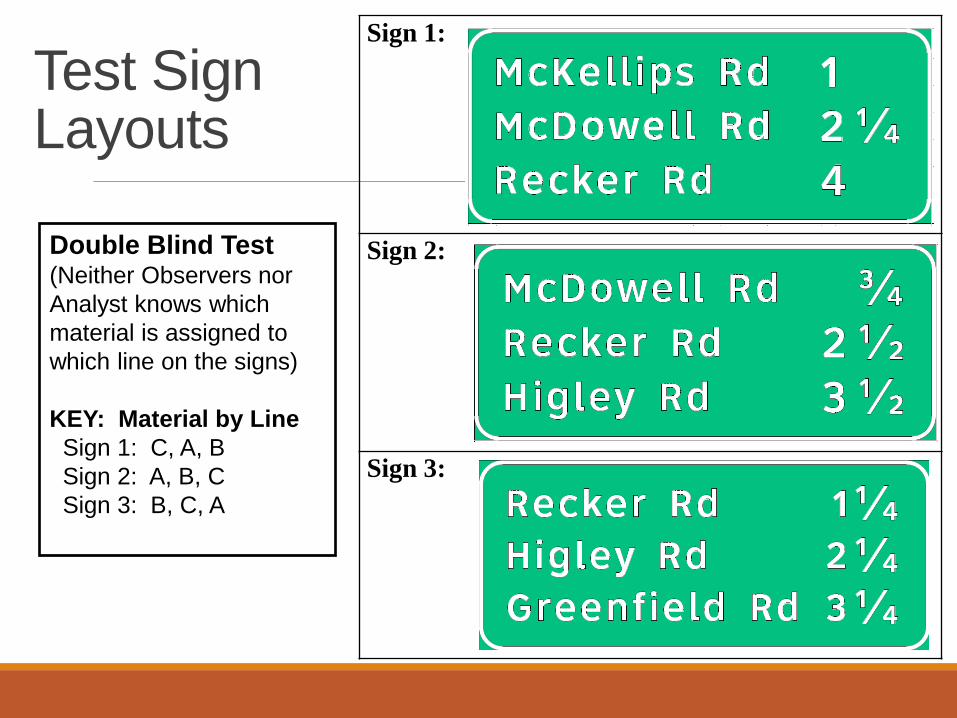
Test Sign Layouts
Sign 1:
Sign 2:
Sign 3:
Double Blind Test (Neither Observers nor Analyst knows which material is assigned to which line on the signs) KEY: Material by Line Sign 1: C, A, B Sign 2: A, B, C Sign 3: B, C, A
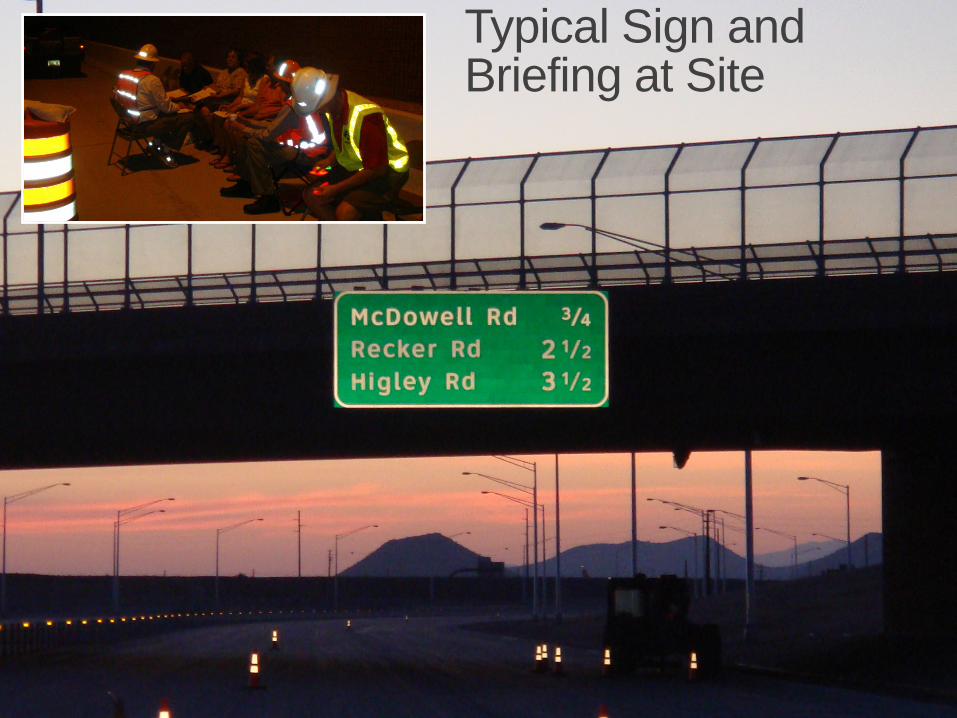
Typical Sign and Briefing at Site
Professional Background Other Involvement / Service Member of TRB Committee AHB 25: Traffic
Signal Systems Member of ASCE Street and Highway
Operations Committee NCHRP Project Oversight Panel Member: 03-97: Traffic Signal Analysis with Varying Demands
and Capacities (complete) 03-110: Estimating the Life-Cycle Cost of
Intersection Designs (in progress)
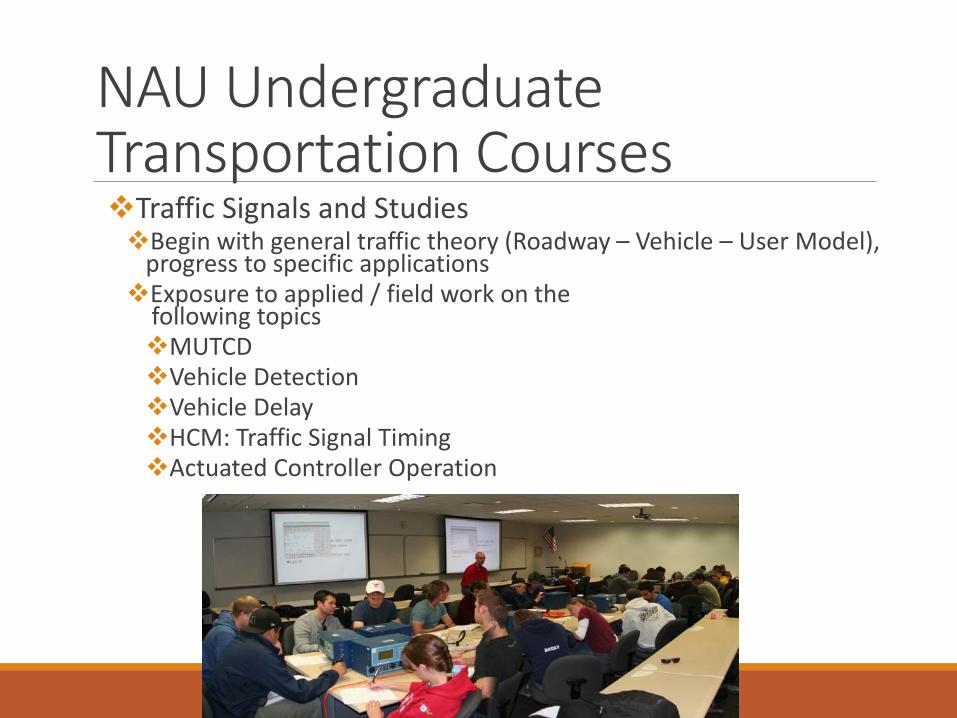
NAU Undergraduate Transportation Courses Traffic Signals and Studies Begin with general traffic theory (Roadway – Vehicle – User Model),
progress to specific applications Exposure to applied / field work on the
following topics MUTCD Vehicle Detection Vehicle Delay HCM: Traffic Signal Timing Actuated Controller Operation
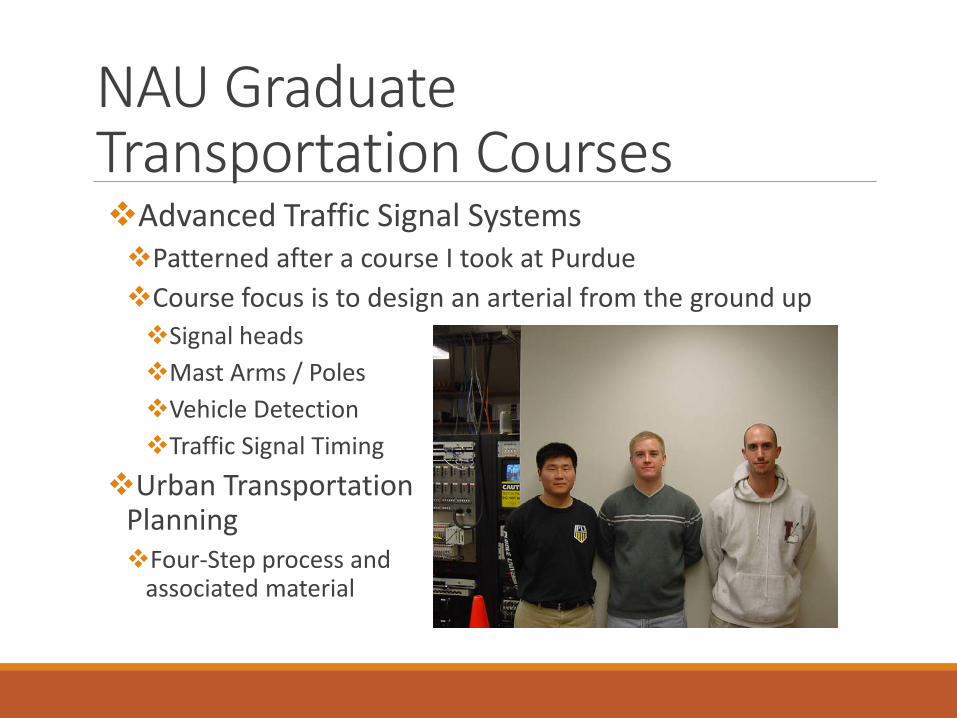
NAU Graduate Transportation Courses Advanced Traffic Signal Systems Patterned after a course I took at Purdue Course focus is to design an arterial from the ground up Signal heads Mast Arms / Poles Vehicle Detection Traffic Signal Timing
Urban Transportation Planning Four-Step process and
associated material