Embed Size (px)
Citation preview

ACC 291 The Latest Version A+ Study Guide
Entire Course
https://uopcourses.com/category/acc-291/
ACC 291 WileyPLUS Assignment: Week 1 Assignment
Resource: WileyPLUS
Click Assignment: Week 1 Assignment within WileyPLUS to complete the following exercises:
Exercise 8-4
Exercise 8-11
BYP 8-1
BYP 8-2
Exercise 8-4
Answer
The ledger of Wainwright Company at the end of the current year shows Accounts Receivable $87,000;
Credit Sales $820,000; and Sales Returns and Allowances $52,600. (Credit account titles are
automatically indented when amount is entered. Do not indent manually.)
(a)
If Wainwright uses the direct write-off method to account for uncollectible accounts, journalize the
adjusting entry at December 31, assuming Wainwright determines that Hiller’s $1,100 balance is
uncollectible.
(b)
If Allowance for Doubtful Accounts has a credit balance of $850 in the trial balance, journalize the adjusting
entry at December 31, assuming bad debts are expected to be 10% of accounts receivable.
Exercise 8-11
Suppose the following information was taken from the 2014 financial statements of FedEx Corporation,
a major global transportation/delivery company.
(in millions)
2014
2013
Accounts receivable (gross)
$ 3,490
$ 4,420

Accounts receivable (net)
3,335
4,296
Allowance for doubtful accounts
155
124
Sales revenue
35,898
38,861
Total current assets
7,011
7,189
Answer each of the following questions.
Broadening Your Perspective 8-1
Your answer is correct.
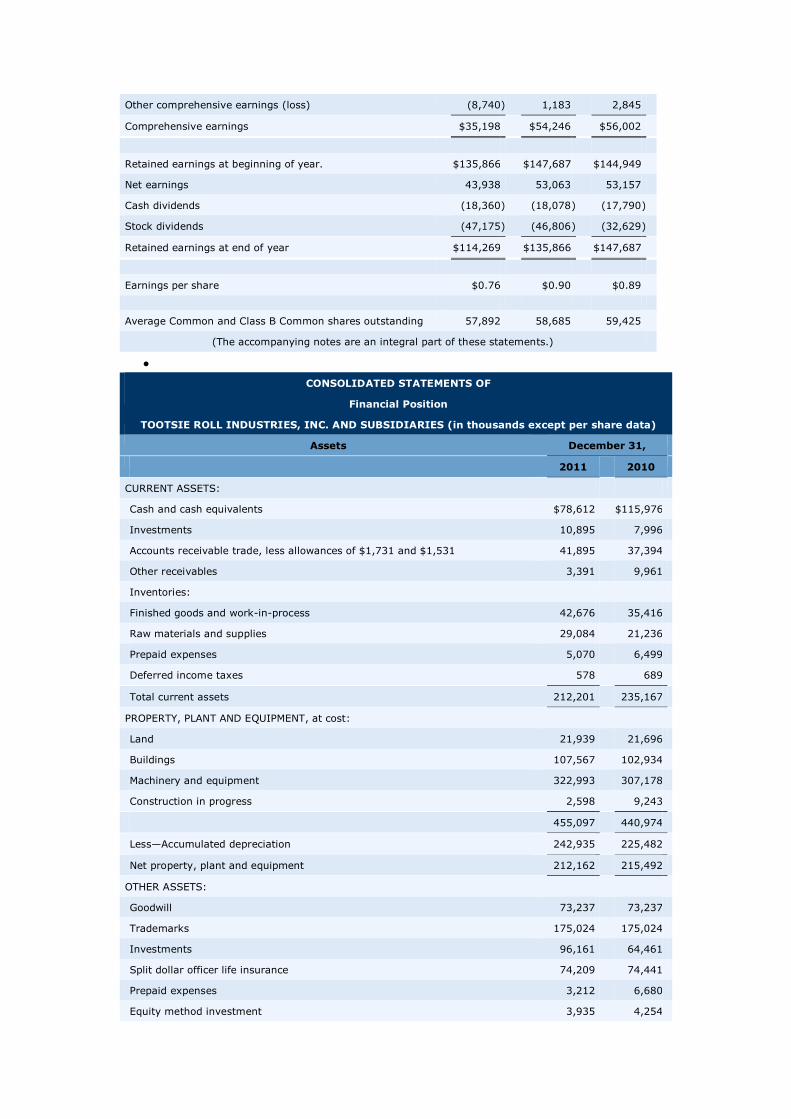
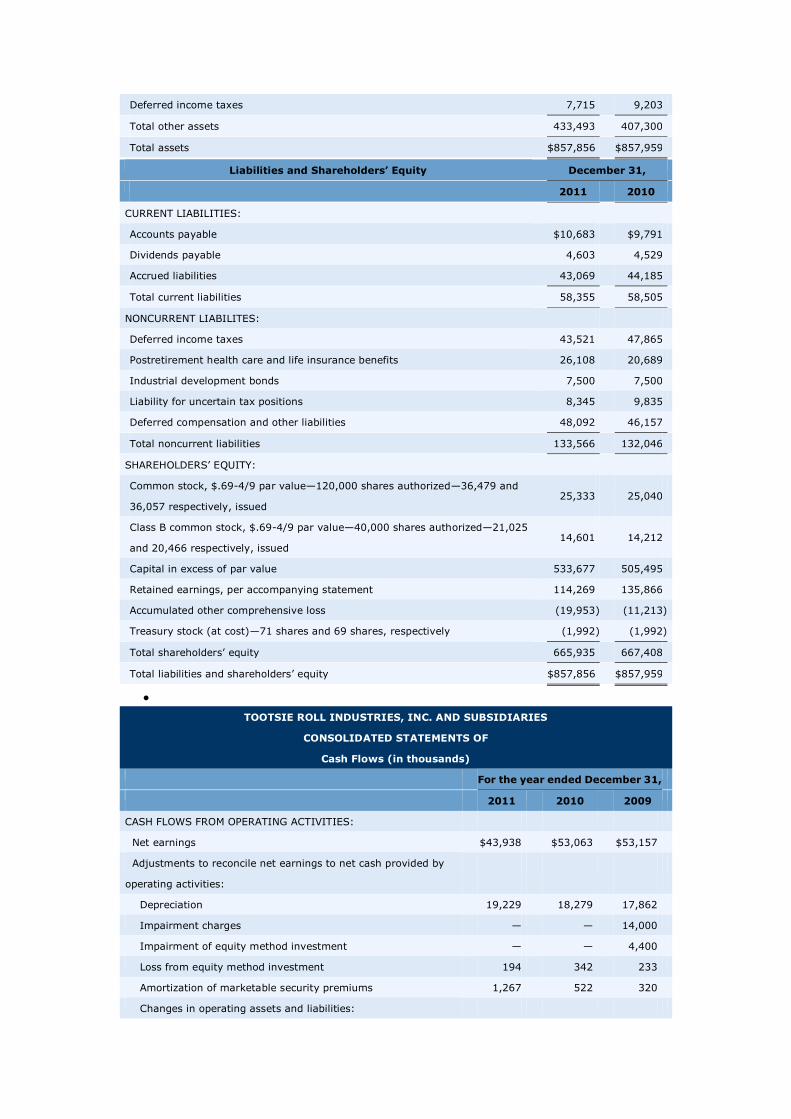
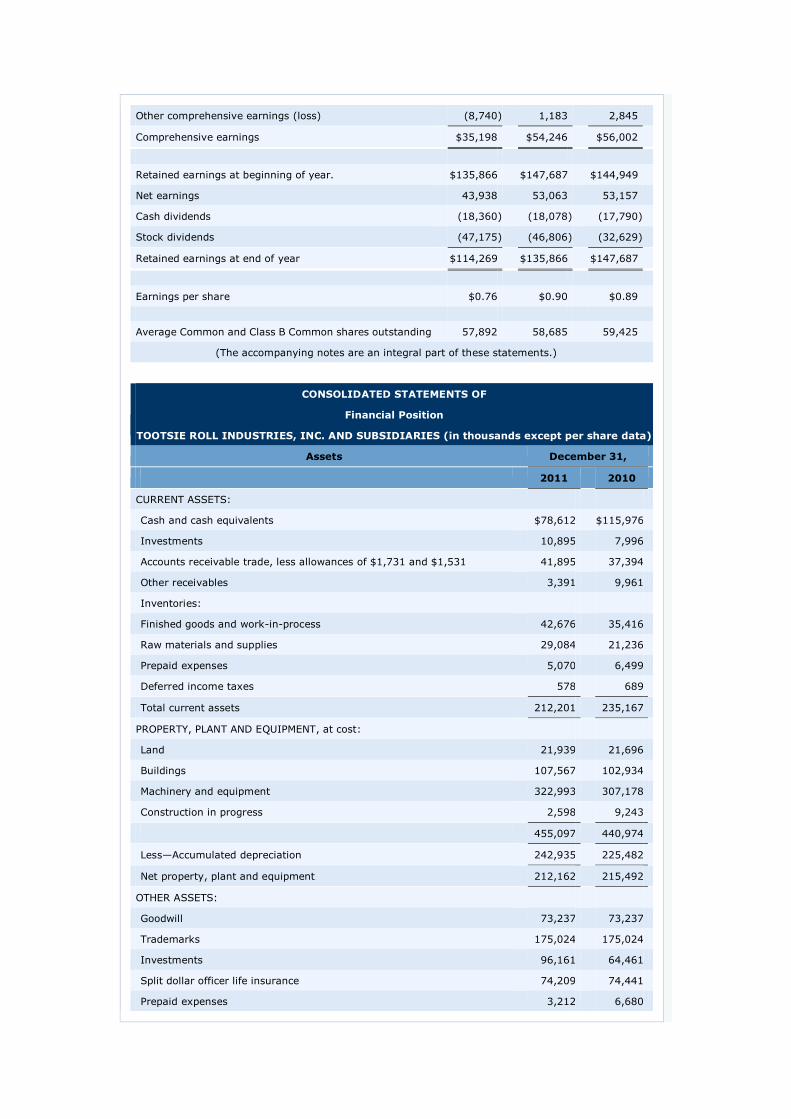
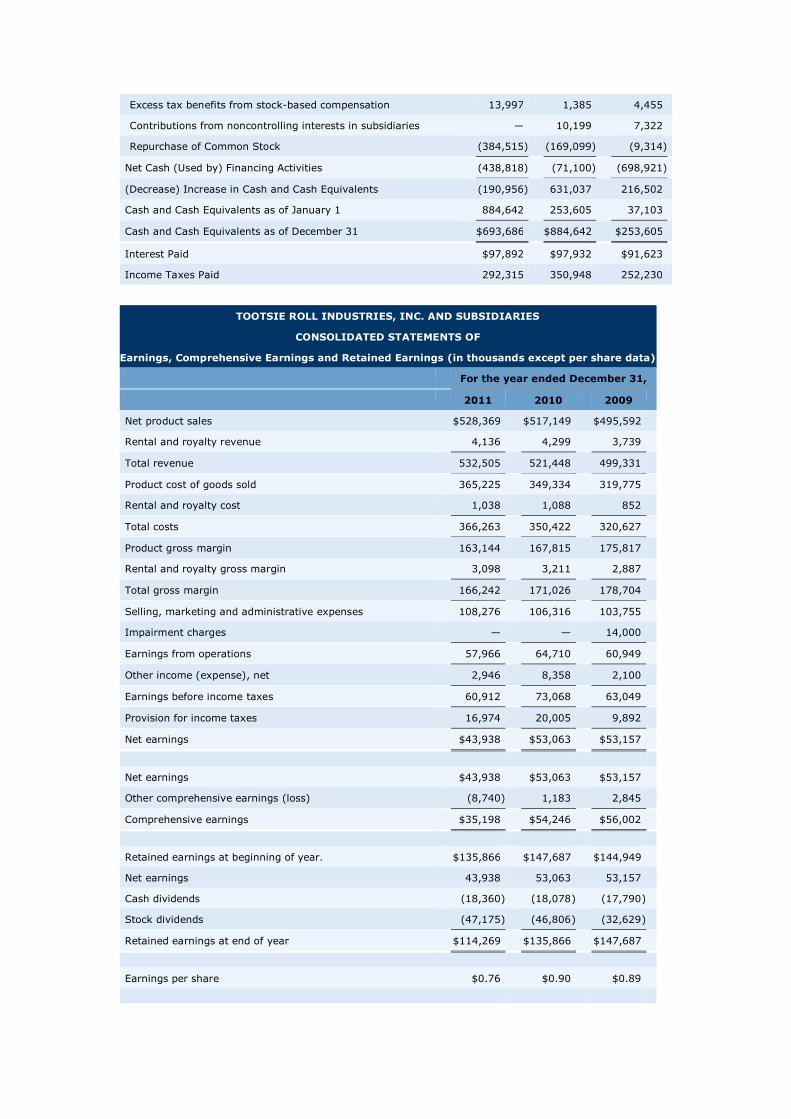
The financial statements of Tootsie Roll are presented below.
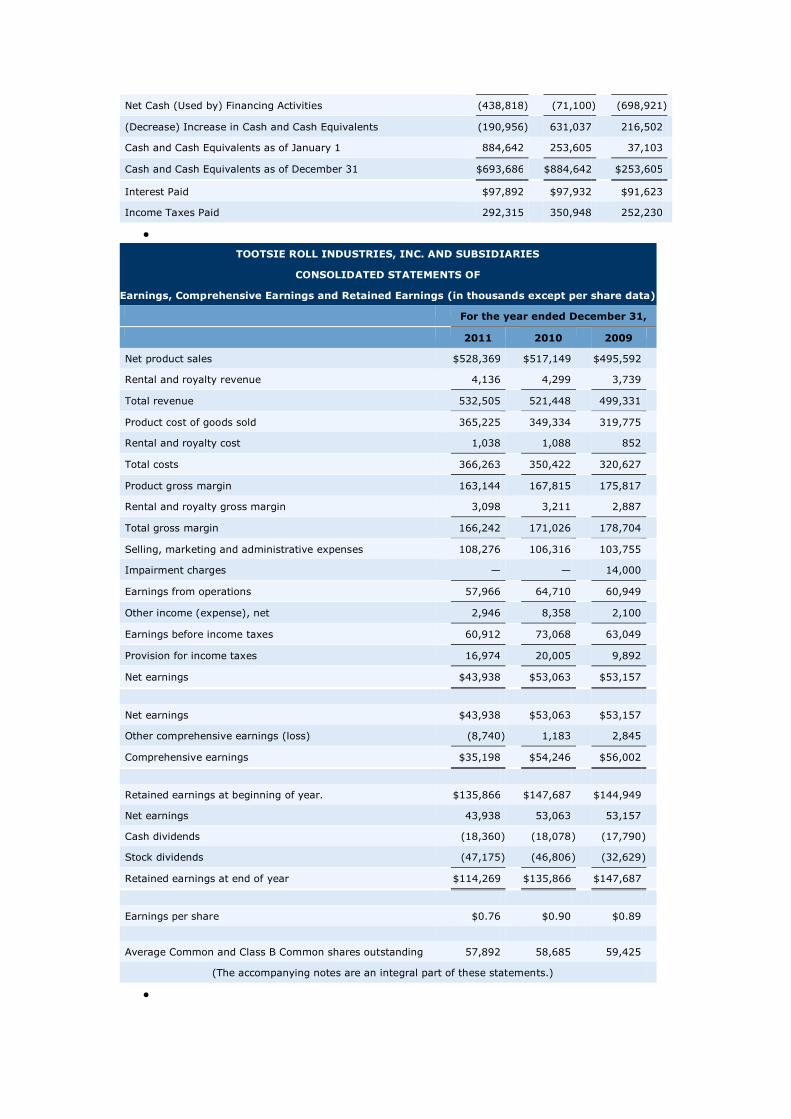
TOOTSIE ROLL INDUSTRIES, INC. AND SUBSIDIARIES
CONSOLIDATED STATEMENTS OF
Earnings, Comprehensive Earnings and Retained Earnings (in thousands except per share data)
For the year ended December 31,
2011
2010
2009
Net product sales
$528,369
$517,149
$495,592
Rental and royalty revenue
4,136
4,299
3,739
Total revenue
532,505
521,448
499,331
Product cost of goods sold
365,225
349,334
319,775
Rental and royalty cost
1,038
1,088
852
Total costs
366,263
350,422
320,627
Product gross margin
163,144
167,815
175,817
Rental and royalty gross margin
3,098
3,211
2,887
Total gross margin
166,242
171,026
178,704
Selling, marketing and administrative expenses
108,276
106,316
103,755
Impairment charges
—
—
14,000
Earnings from operations
57,966
64,710
60,949
Other income (expense), net
2,946
8,358
2,100
Earnings before income taxes
60,912
73,068
63,049
Provision for income taxes
16,974
20,005
9,892
Net earnings
$43,938
$53,063
$53,157
Net earnings
$43,938
$53,063
$53,157
Other comprehensive earnings (loss)
(8,740 )
1,183
2,845
Comprehensive earnings
$35,198
$54,246
$56,002
Retained earnings at beginning of year.
$135,866
$147,687
$144,949
Net earnings
43,938
53,063
53,157
Cash dividends
(18,360 )
(18,078 )
(17,790 )
Stock dividends
(47,175 )
(46,806 )
(32,629 )
Retained earnings at end of year
$114,269
$135,866
$147,687
Earnings per share
$0.76
$0.90
$0.89
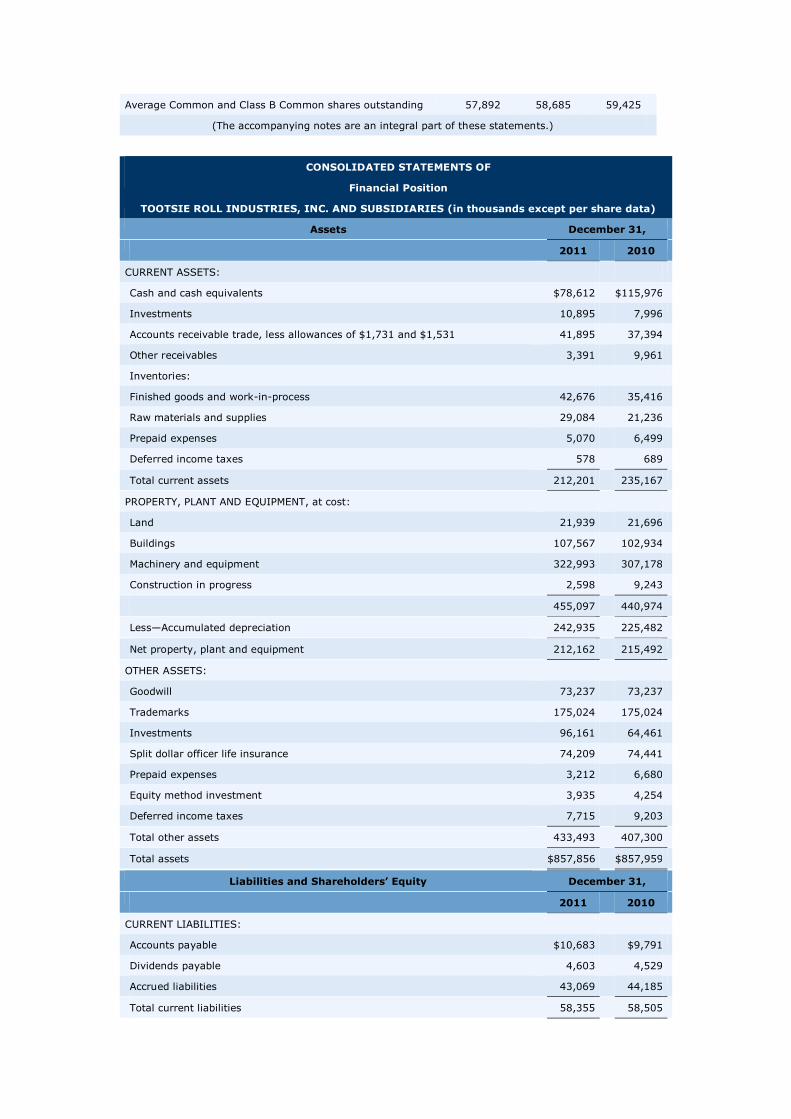
Average Common and Class B Common shares outstanding
57,892
58,685
59,425
(The accompanying notes are an integral part of these statements.)
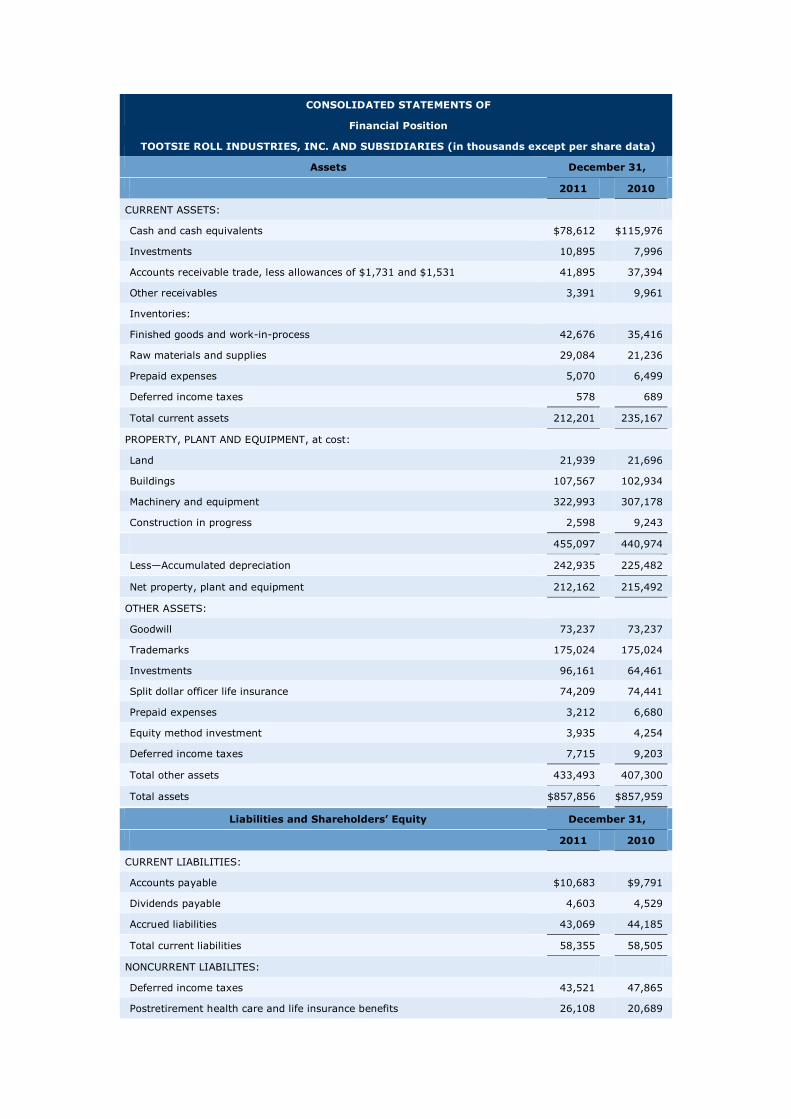
CONSOLIDATED STATEMENTS OF
Financial Position
TOOTSIE ROLL INDUSTRIES, INC. AND SUBSIDIARIES (in thousands except per share data)
Assets
December 31,
2011
2010
CURRENT ASSETS:
Cash and cash equivalents
$78,612
$115,976
Investments
10,895
7,996
Accounts receivable trade, less allowances of $1,731 and $1,531
41,895
37,394
Other receivables
3,391
9,961
Inventories:
Finished goods and work-in-process
42,676
35,416
Raw materials and supplies
29,084
21,236
Prepaid expenses
5,070
6,499
Deferred income taxes
578
689
Total current assets
212,201
235,167
PROPERTY, PLANT AND EQUIPMENT, at cost:
Land
21,939
21,696
Buildings
107,567
102,934
Machinery and equipment
322,993
307,178
Construction in progress
2,598
9,243
455,097
440,974
Less—Accumulated depreciation
242,935
225,482
Net property, plant and equipment
212,162
215,492
OTHER ASSETS:
Goodwill
73,237
73,237
Trademarks
175,024
175,024
Investments
96,161
64,461
Split dollar officer life insurance
74,209
74,441
Prepaid expenses
3,212
6,680
Equity method investment
3,935
4,254
Deferred income taxes
7,715
9,203
Total other assets
433,493
407,300
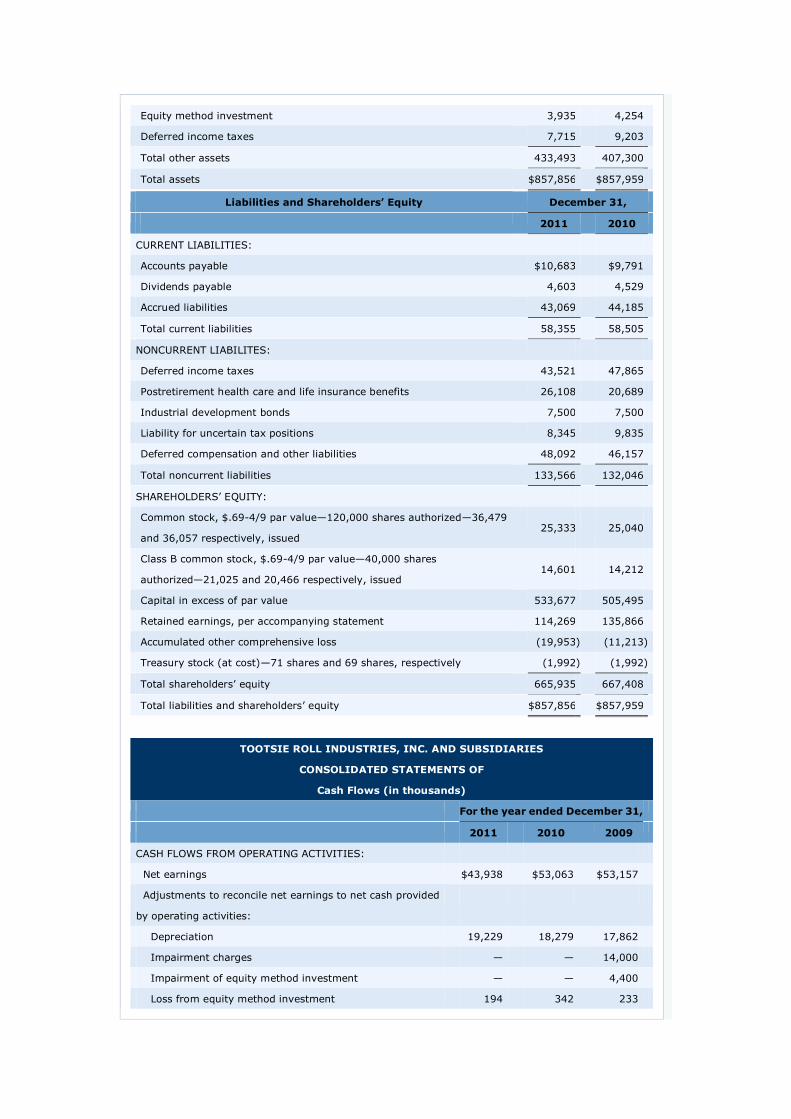
Total assets
$857,856
$857,959
Liabilities and Shareholders’ Equity
December 31,
2011
2010
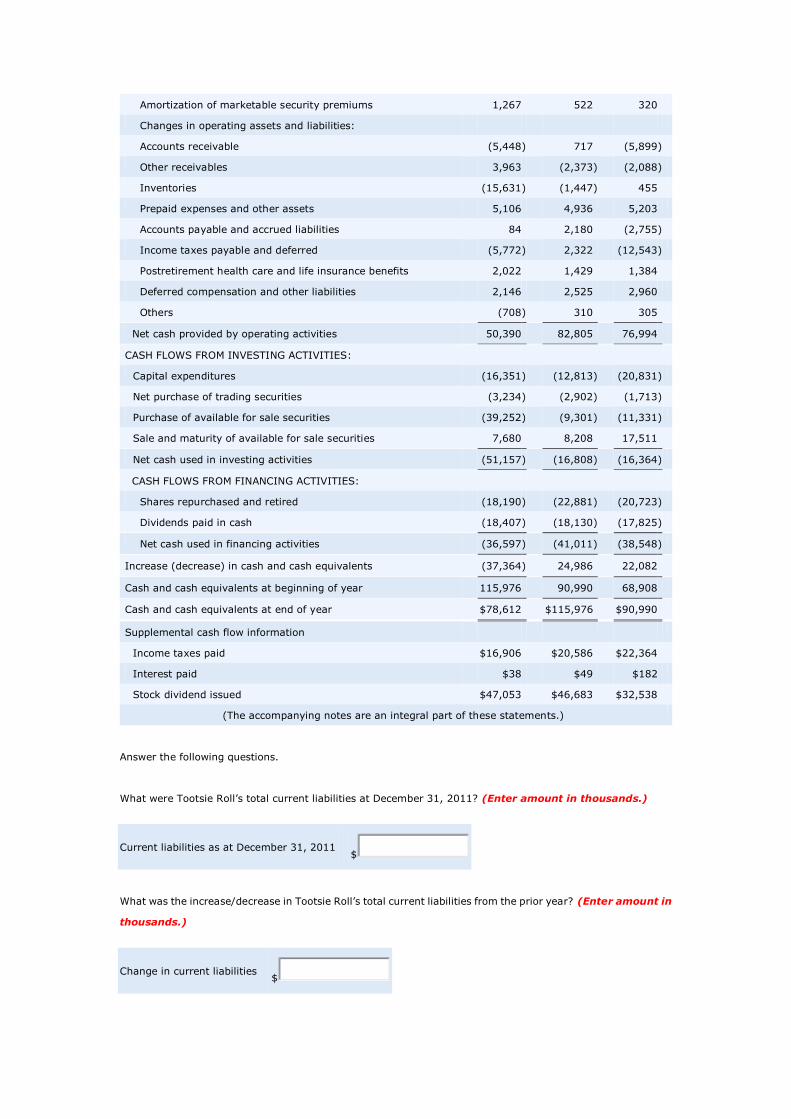
CURRENT LIABILITIES:
Accounts payable
$10,683
$9,791
Dividends payable
4,603
4,529
Accrued liabilities
43,069
44,185
Total current liabilities
58,355
58,505
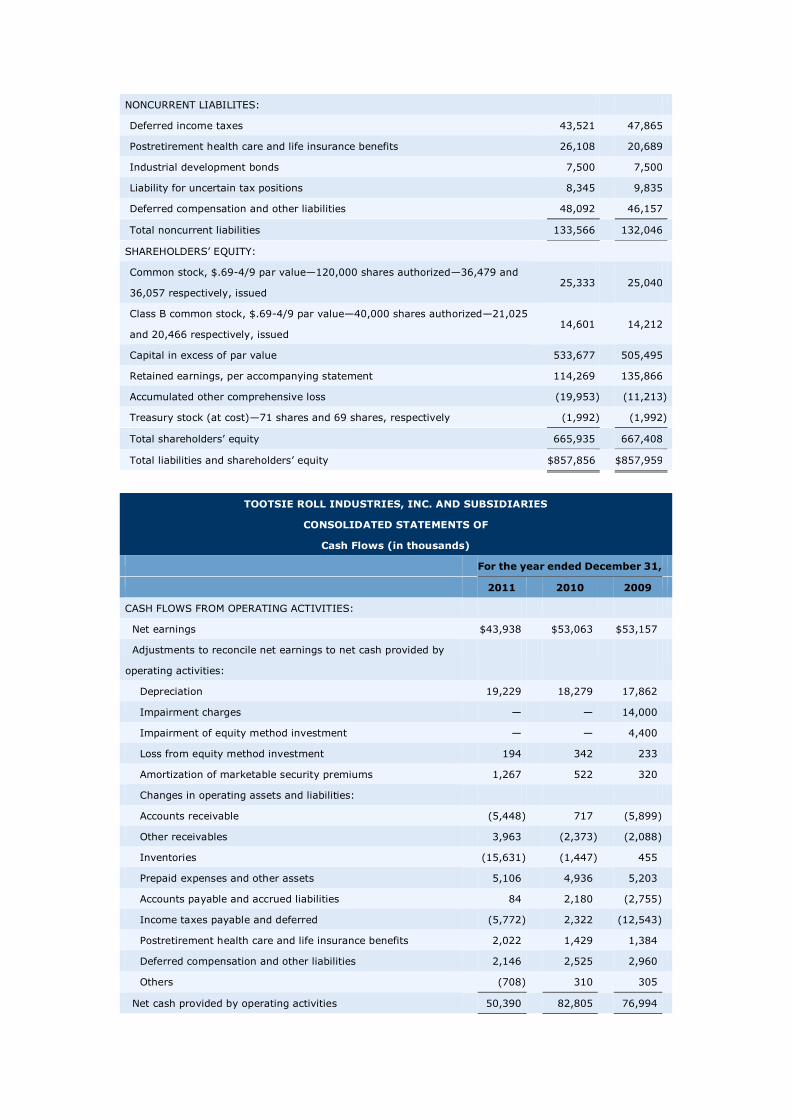
NONCURRENT LIABILITES:
Deferred income taxes
43,521
47,865
Postretirement health care and life insurance benefits
26,108
20,689
Industrial development bonds
7,500
7,500
Liability for uncertain tax positions
8,345
9,835
Deferred compensation and other liabilities
48,092
46,157
Total noncurrent liabilities
133,566
132,046
SHAREHOLDERS’ EQUITY:
Common stock, $.69-4/9 par value—120,000 shares authorized—36,479 and
36,057 respectively, issued 25,333
25,040
Class B common stock, $.69-4/9 par value—40,000 shares authorized—21,025
and 20,466 respectively, issued 14,601
14,212
Capital in excess of par value
533,677
505,495
Retained earnings, per accompanying statement
114,269
135,866
Accumulated other comprehensive loss
(19,953 )
(11,213 )
Treasury stock (at cost)—71 shares and 69 shares, respectively
(1,992 )
(1,992 )
Total shareholders’ equity
665,935
667,408
Total liabilities and shareholders’ equity
$857,856
$857,959
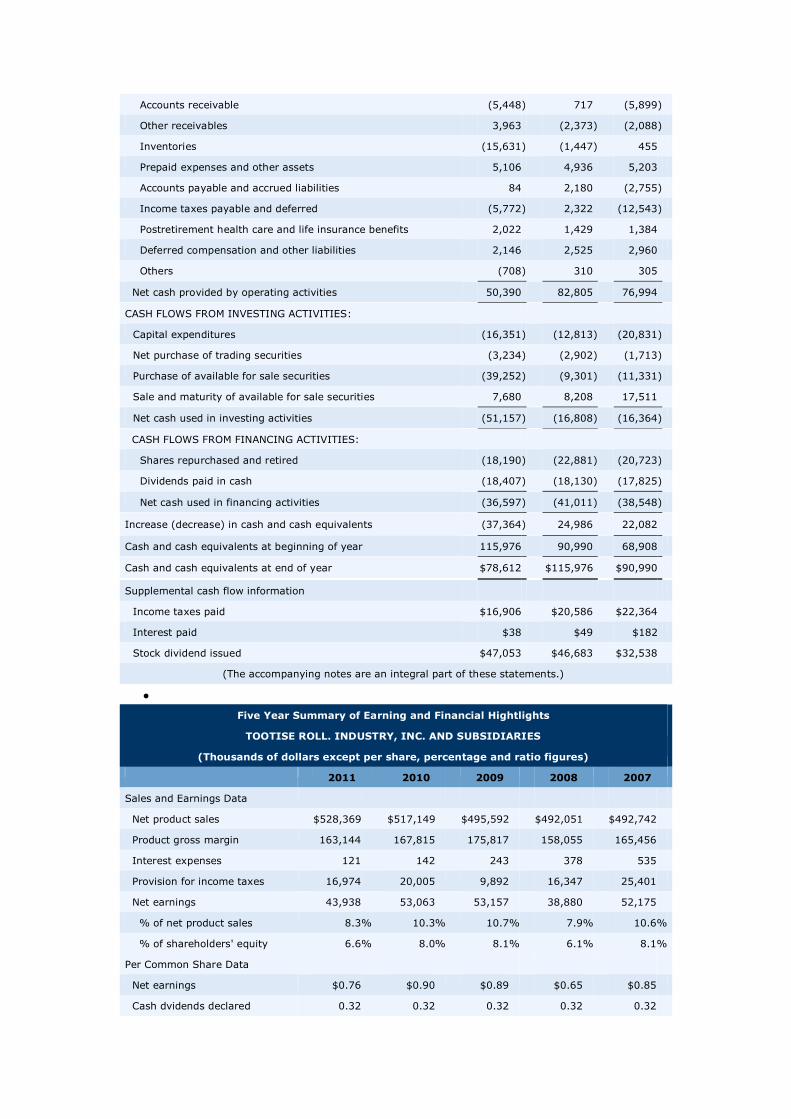
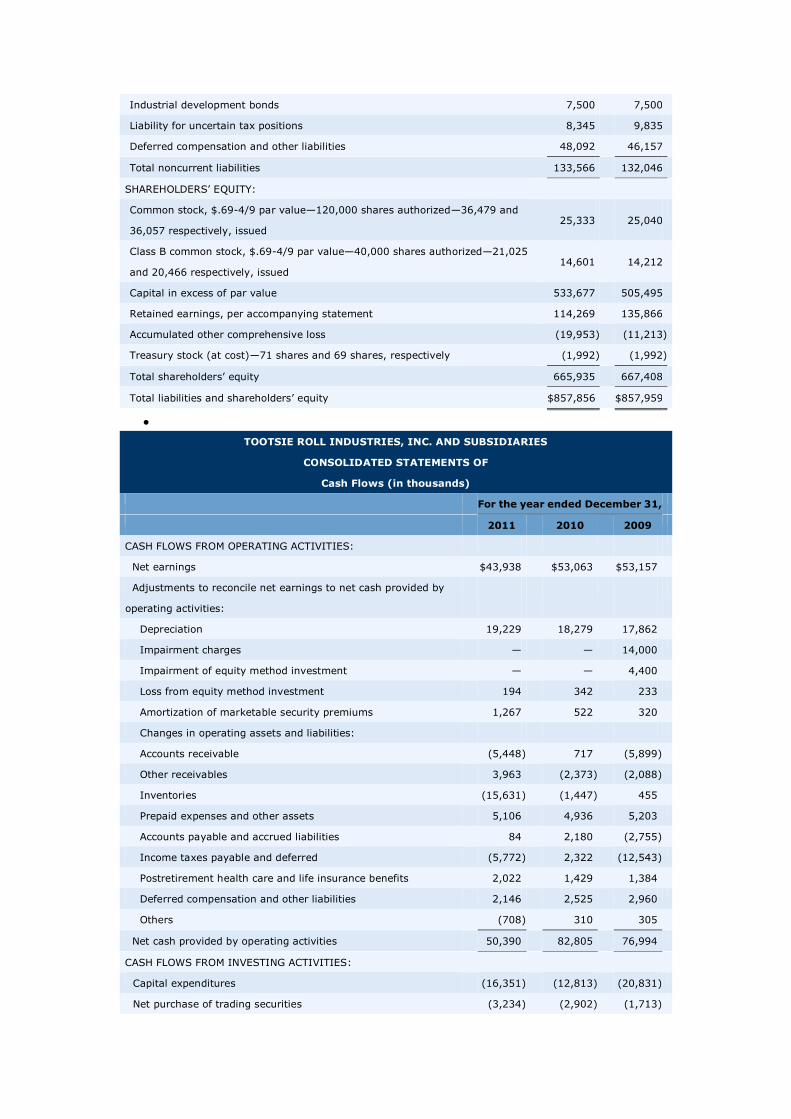
TOOTSIE ROLL INDUSTRIES, INC. AND SUBSIDIARIES
CONSOLIDATED STATEMENTS OF
Cash Flows (in thousands)
For the year ended December 31,
2011
2010
2009
CASH FLOWS FROM OPERATING ACTIVITIES:
Net earnings
$43,938
$53,063
$53,157
Adjustments to reconcile net earnings to net cash provided by
operating activities:
Depreciation
19,229
18,279
17,862
Impairment charges
—
—
14,000
Impairment of equity method investment
—
—
4,400
Loss from equity method investment
194
342
233
Amortization of marketable security premiums
1,267
522
320
Changes in operating assets and liabilities:
Accounts receivable
(5,448 )
717
(5,899 )
Other receivables
3,963
(2,373 )
(2,088 )
Inventories
(15,631 )
(1,447 )
455
Prepaid expenses and other assets
5,106
4,936
5,203
Accounts payable and accrued liabilities
84
2,180
(2,755 )
Income taxes payable and deferred
(5,772 )
2,322
(12,543 )
Postretirement health care and life insurance benefits
2,022
1,429
1,384
Deferred compensation and other liabilities
2,146
2,525
2,960
Others
(708 )
310
305
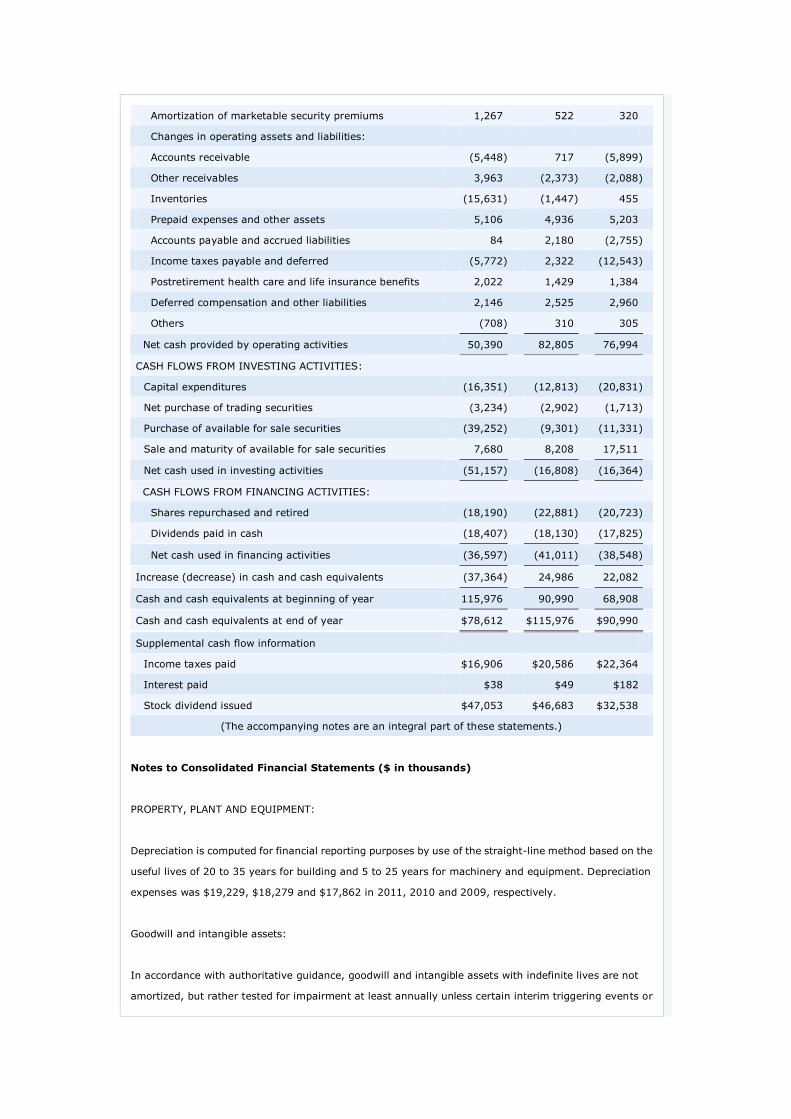
Net cash provided by operating activities
50,390
82,805
76,994
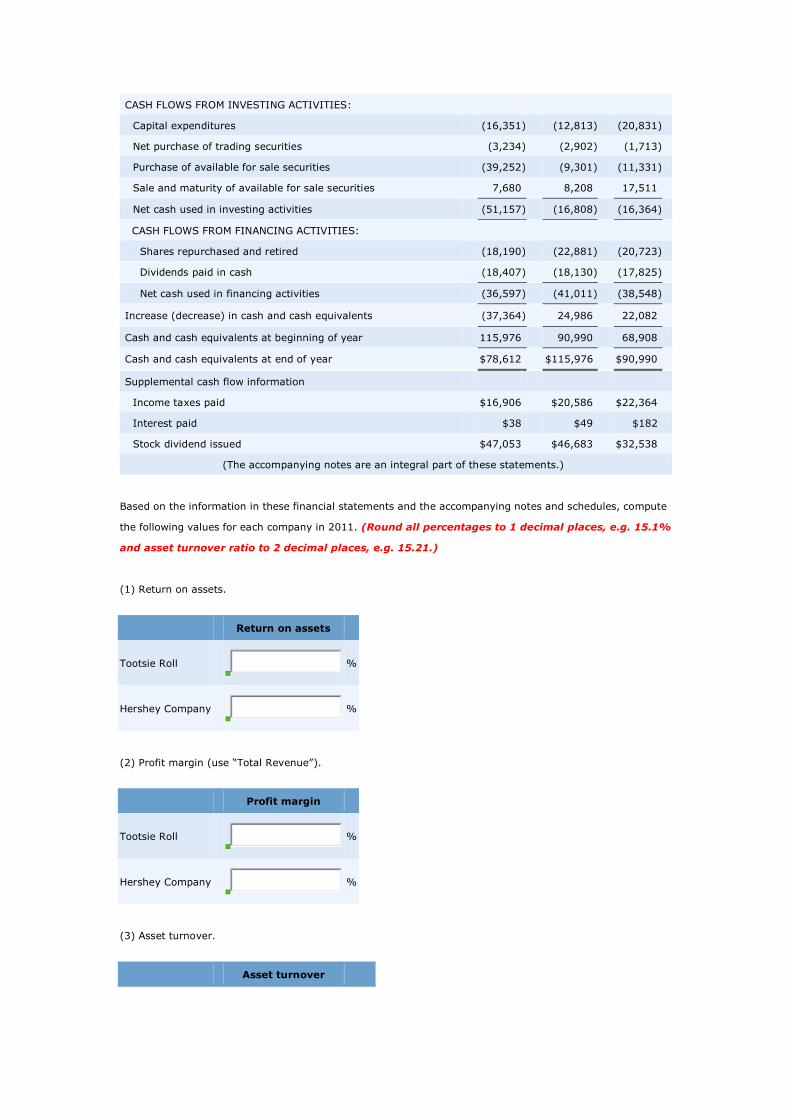
CASH FLOWS FROM INVESTING ACTIVITIES:
Capital expenditures
(16,351 )
(12,813 )
(20,831 )
Net purchase of trading securities
(3,234 )
(2,902 )
(1,713 )
Purchase of available for sale securities
(39,252 )
(9,301 )
(11,331 )
Sale and maturity of available for sale securities
7,680
8,208
17,511
Net cash used in investing activities
(51,157 )
(16,808 )
(16,364 )
CASH FLOWS FROM FINANCING ACTIVITIES:
Shares repurchased and retired
(18,190 )
(22,881 )
(20,723 )
Dividends paid in cash
(18,407 )
(18,130 )
(17,825 )
Net cash used in financing activities
(36,597 )
(41,011 )
(38,548 )
Increase (decrease) in cash and cash equivalents
(37,364 )
24,986
22,082
Cash and cash equivalents at beginning of year
115,976
90,990
68,908
Cash and cash equivalents at end of year
$78,612
$115,976
$90,990
Supplemental cash flow information
Income taxes paid
$16,906
$20,586
$22,364
Interest paid
$38
$49
$182
Stock dividend issued
$47,053
$46,683
$32,538
(The accompanying notes are an integral part of these statements.)
Five Year Summary of Earning and Financial Hightlights
TOOTISE ROLL. INDUSTRY, INC. AND SUBSIDIARIES
(Thousands of dollars except per share, percentage and ratio figures)
2011
2010
2009
2008
2007
Sales and Earnings Data
Net product sales
$528,369
$517,149
$495,592
$492,051
$492,742
Product gross margin
163,144
167,815
175,817
158,055
165,456
Interest expenses
121
142
243
378
535
Provision for income taxes
16,974
20,005
9,892
16,347
25,401
Net earnings
43,938
53,063
53,157
38,880
52,175
% of net product sales
8.3 %
10.3 %
10.7 %
7.9 %
10.6 %
% of shareholders' equity
6.6 %
8.0 %
8.1 %
6.1 %
8.1 %
Per Common Share Data
Net earnings
$0.76
$0.90
$0.89
$0.65
$0.85
Cash dvidends declared
0.32
0.32
0.32
0.32
0.32

Stock dividends
3 %
3 %
3 %
3 %
3 %
Additional Financial Data
Working capital
$153,846
$176,662
$154,409
$129,694
$142,163
Net cash provided by opreating
activities 50,390
82,805
76,994
57,333
90,148
Net cash provided by (used by)
investing activities (51,157 )
(16,808 )
(16,364 )
(7,565 )
(43,429 )
Net cash used in financing
activities (36,597 )
(41,011 )
(38,548 )
(38,666 )
(44,842 )
Property, plant & equipment
additions 16,351
12,813
20,831
34,355
14,767
Net property, plant & equipment
212,162
215,492
220,721
217,628
201,401
Total assets
857,856
857,959
836,844
813,252
813,134
Long-term debt
7,500
7,500
7,500
7,500
7,500
Shareholders' equity
665,935
667,408
654,244
636,847
640,204
Average shares outstanding
57,892
58,685
59,425
60,152
61,580
Notes to Consolidated Financial Statements ($ in thousands)
Revenue recognition:
Products are sold to customers based on accepted purchase orders which include quantity, sales price
and other relevant terms of sale. Revenue, net of applicable provisions for discounts, returns,
allowances and certain advertising and promotional costs, is recognized when products are delivered
to customers and collectability is reasonably assured. Shipping and handling costs of $45,850,
$43,034, and $38,628 in 2011, 2010 and 2009, respectively, are included in selling, marketing and
administrative expenses. Accounts receivable are unsecured. Revenues from a major customer
aggregated approximately 23.3%, 21.4% and 22.9% of net product sales during the years ended
December 31, 2011, 2010 and 2009, respectively.
SEGMENT AND GEOGRAPHIC INFORMATION:
The Company operates as a single reportable segments encompassing the manufacturing and sale of
confectionery products. Its principal manufacturing operations are located in the United States and Canada, and
its principal market is in the United States. The Company also manufactures and sells confectionery products in
Mexico, and exports products to Canada and countries worldwide.
The following geographic data includes net product sales summarized on the basis of the customer location and
long-lived assets based on their location:
2011
2010
2009
Net product sales:
United states
$487,185
$471,714
$455,517
Foreign
41,184
45,435
40,075
$528,369
$517,149
$495,592
Long-lived assets:
United states
$170,173
$172,087
$176,044
Foreign
41,989
43,405
44,677
$212,162
$215,492
$220,721
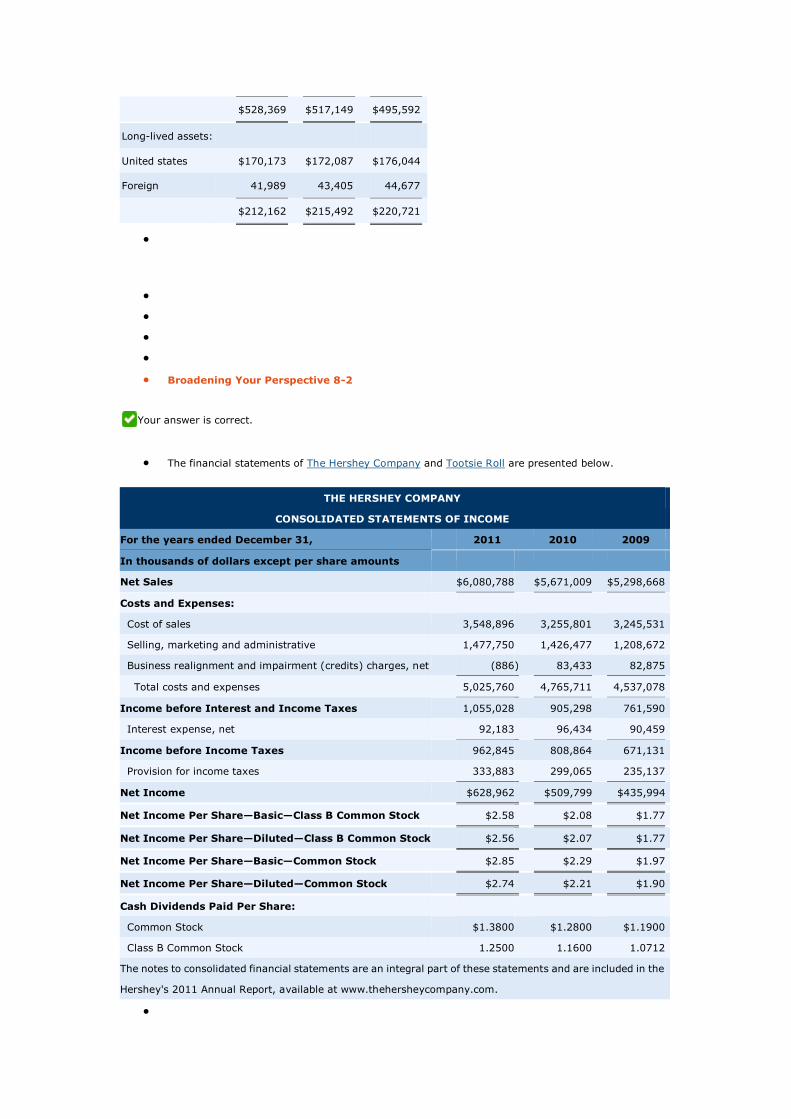
Broadening Your Perspective 8-2
Your answer is correct.
The financial statements of The Hershey Company and Tootsie Roll are presented below.
THE HERSHEY COMPANY
CONSOLIDATED STATEMENTS OF INCOME
For the years ended December 31,
2011
2010
2009
In thousands of dollars except per share amounts
Net Sales
$6,080,788
$5,671,009
$5,298,668
Costs and Expenses:
Cost of sales
3,548,896
3,255,801
3,245,531
Selling, marketing and administrative
1,477,750
1,426,477
1,208,672
Business realignment and impairment (credits) charges, net
(886 )
83,433
82,875
Total costs and expenses
5,025,760
4,765,711
4,537,078
Income before Interest and Income Taxes
1,055,028
905,298
761,590
Interest expense, net
92,183
96,434
90,459
Income before Income Taxes
962,845
808,864
671,131
Provision for income taxes
333,883
299,065
235,137
Net Income
$628,962
$509,799
$435,994
Net Income Per Share—Basic—Class B Common Stock
$2.58
$2.08
$1.77
Net Income Per Share—Diluted—Class B Common Stock
$2.56
$2.07
$1.77
Net Income Per Share—Basic—Common Stock
$2.85
$2.29
$1.97
Net Income Per Share—Diluted—Common Stock
$2.74
$2.21
$1.90
Cash Dividends Paid Per Share:
Common Stock
$1.3800
$1.2800
$1.1900
Class B Common Stock
1.2500
1.1600
1.0712
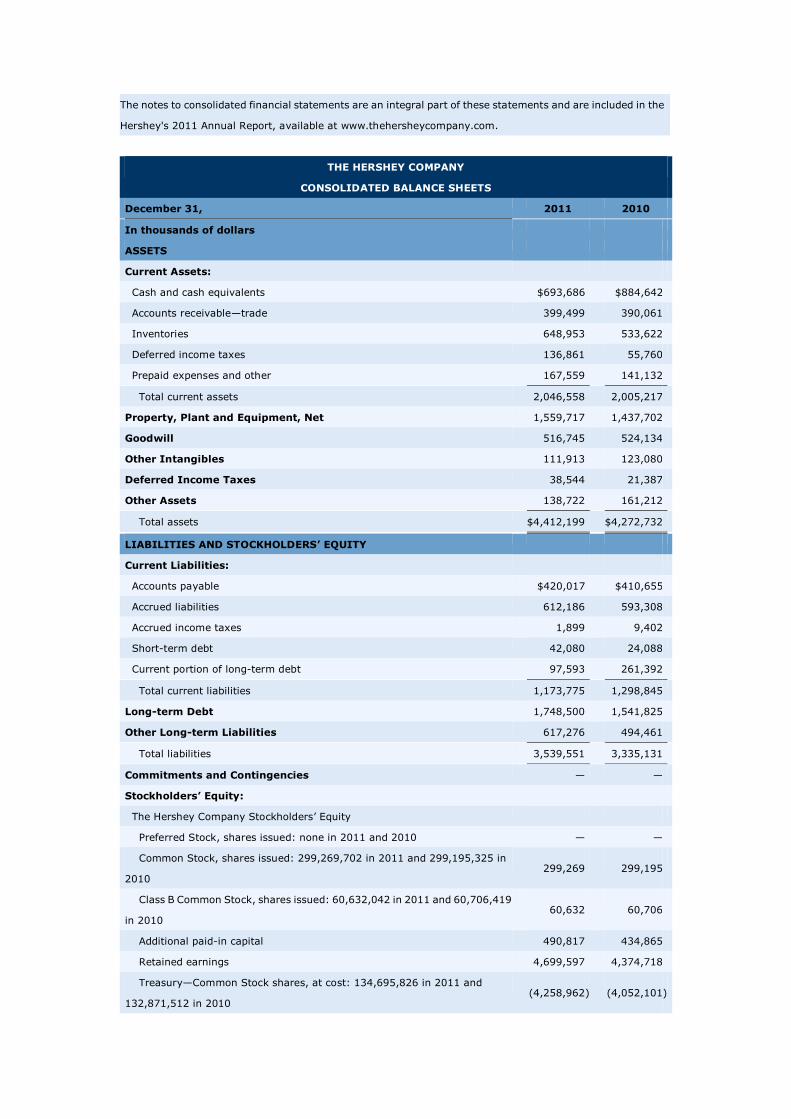
The notes to consolidated financial statements are an integral part of these statements and are included in the
Hershey's 2011 Annual Report, available at www.thehersheycompany.com.
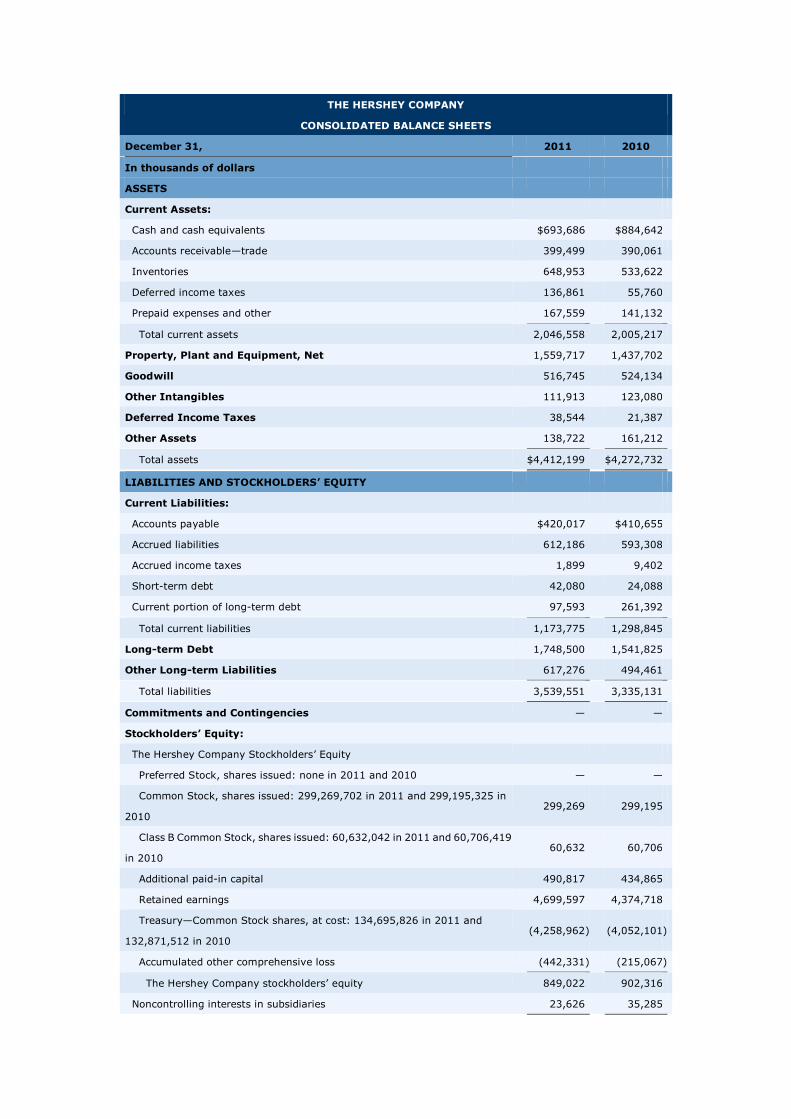
THE HERSHEY COMPANY
CONSOLIDATED BALANCE SHEETS
December 31,
2011
2010
In thousands of dollars
ASSETS
Current Assets:
Cash and cash equivalents
$693,686
$884,642
Accounts receivable—trade
399,499
390,061
Inventories
648,953
533,622
Deferred income taxes
136,861
55,760
Prepaid expenses and other
167,559
141,132
Total current assets
2,046,558
2,005,217
Property, Plant and Equipment, Net
1,559,717
1,437,702
Goodwill
516,745
524,134
Other Intangibles
111,913
123,080
Deferred Income Taxes
38,544
21,387
Other Assets
138,722
161,212
Total assets
$4,412,199
$4,272,732
LIABILITIES AND STOCKHOLDERS’ EQUITY
Current Liabilities:
Accounts payable
$420,017
$410,655
Accrued liabilities
612,186
593,308
Accrued income taxes
1,899
9,402
Short-term debt
42,080
24,088
Current portion of long-term debt
97,593
261,392
Total current liabilities
1,173,775
1,298,845
Long-term Debt
1,748,500
1,541,825
Other Long-term Liabilities
617,276
494,461
Total liabilities
3,539,551
3,335,131
Commitments and Contingencies
—
—
Stockholders’ Equity:
The Hershey Company Stockholders’ Equity
Preferred Stock, shares issued: none in 2011 and 2010
—
—
Common Stock, shares issued: 299,269,702 in 2011 and 299,195,325 in
2010 299,269
299,195
Class B Common Stock, shares issued: 60,632,042 in 2011 and 60,706,419
in 2010 60,632
60,706
Additional paid-in capital
490,817
434,865
Retained earnings
4,699,597
4,374,718
Treasury—Common Stock shares, at cost: 134,695,826 in 2011 and
132,871,512 in 2010 (4,258,962 )
(4,052,101 )
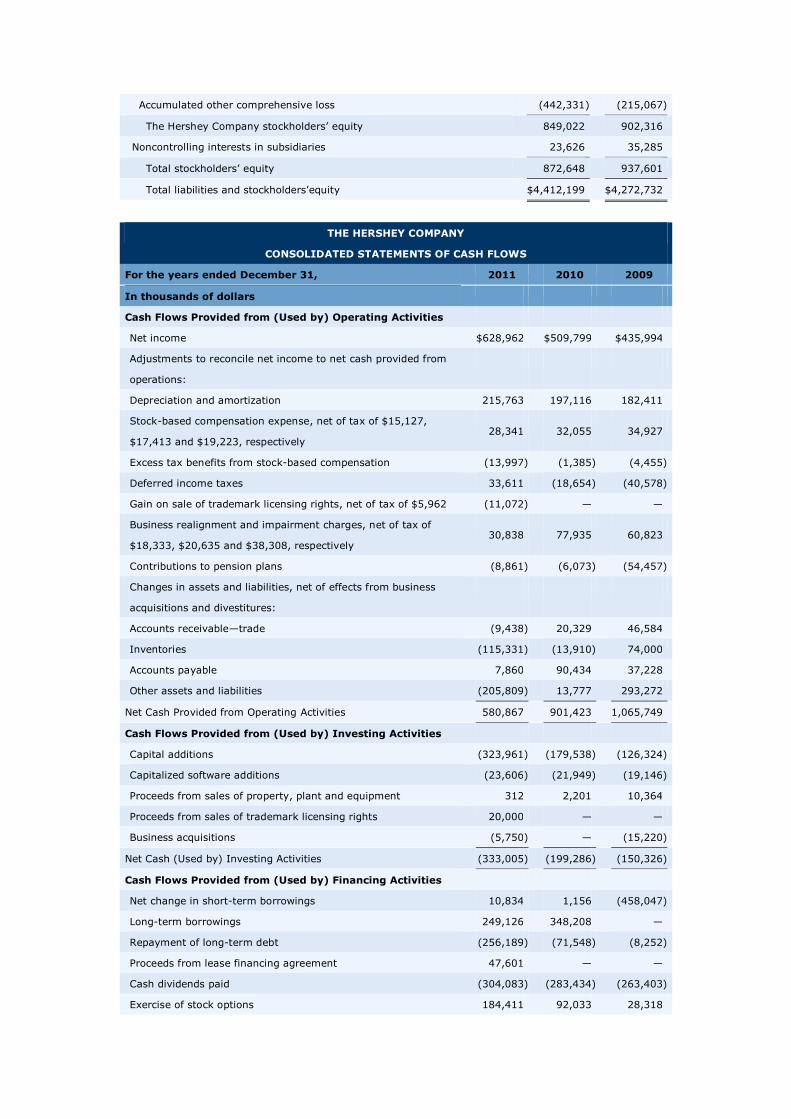
Accumulated other comprehensive loss
(442,331 )
(215,067 )
The Hershey Company stockholders’ equity
849,022
902,316
Noncontrolling interests in subsidiaries
23,626
35,285
Total stockholders’ equity
872,648
937,601
Total liabilities and stockholders’equity
$4,412,199
$4,272,732
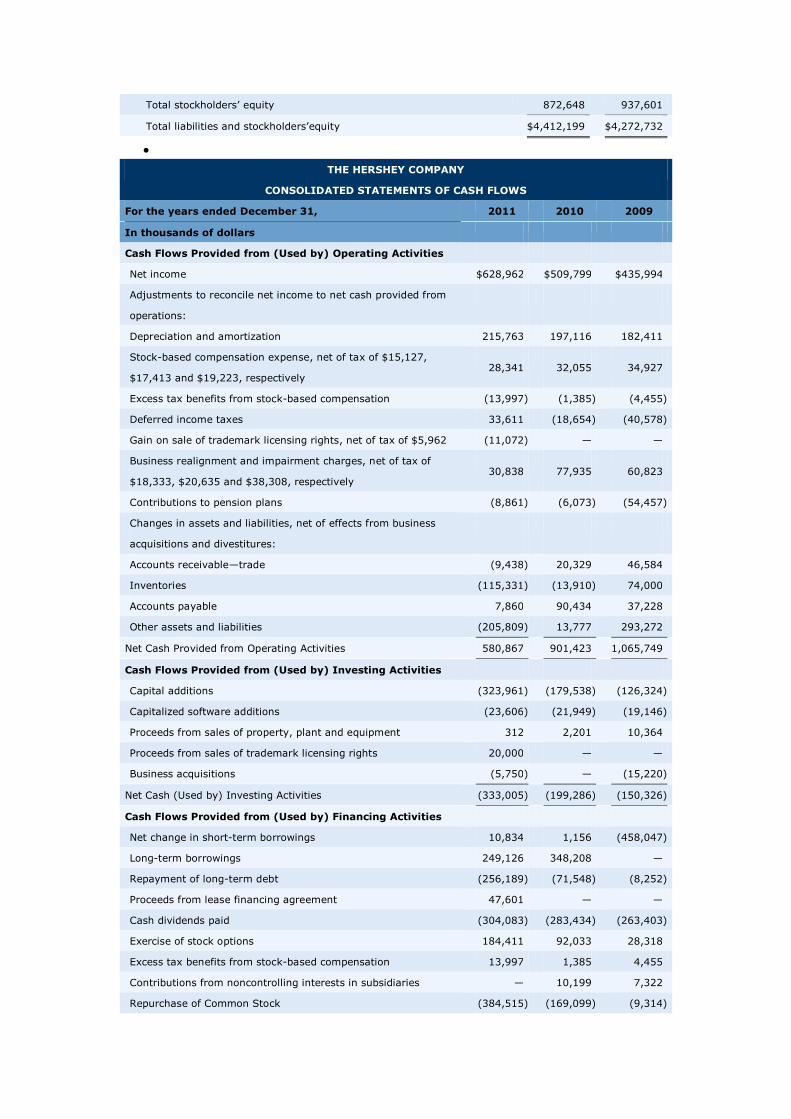
THE HERSHEY COMPANY
CONSOLIDATED STATEMENTS OF CASH FLOWS
For the years ended December 31,
2011
2010
2009
In thousands of dollars
Cash Flows Provided from (Used by) Operating Activities
Net income
$628,962
$509,799
$435,994
Adjustments to reconcile net income to net cash provided from
operations:
Depreciation and amortization
215,763
197,116
182,411
Stock-based compensation expense, net of tax of $15,127,
$17,413 and $19,223, respectively 28,341
32,055
34,927
Excess tax benefits from stock-based compensation
(13,997 )
(1,385 )
(4,455 )
Deferred income taxes
33,611
(18,654 )
(40,578 )
Gain on sale of trademark licensing rights, net of tax of $5,962
(11,072 )
—
—
Business realignment and impairment charges, net of tax of
$18,333, $20,635 and $38,308, respectively 30,838
77,935
60,823
Contributions to pension plans
(8,861 )
(6,073 )
(54,457 )
Changes in assets and liabilities, net of effects from business
acquisitions and divestitures:
Accounts receivable—trade
(9,438 )
20,329
46,584
Inventories
(115,331 )
(13,910 )
74,000
Accounts payable
7,860
90,434
37,228
Other assets and liabilities
(205,809 )
13,777
293,272
Net Cash Provided from Operating Activities
580,867
901,423
1,065,749
Cash Flows Provided from (Used by) Investing Activities
Capital additions
(323,961 )
(179,538 )
(126,324 )
Capitalized software additions
(23,606 )
(21,949 )
(19,146 )
Proceeds from sales of property, plant and equipment
312
2,201
10,364
Proceeds from sales of trademark licensing rights
20,000
—
—
Business acquisitions
(5,750 )
—
(15,220 )
Net Cash (Used by) Investing Activities
(333,005 )
(199,286 )
(150,326 )
Cash Flows Provided from (Used by) Financing Activities
Net change in short-term borrowings
10,834
1,156
(458,047 )
Long-term borrowings
249,126
348,208
—
Repayment of long-term debt
(256,189 )
(71,548 )
(8,252 )
Proceeds from lease financing agreement
47,601
—
—
Cash dividends paid
(304,083 )
(283,434 )
(263,403 )
Exercise of stock options
184,411
92,033
28,318
Excess tax benefits from stock-based compensation
13,997
1,385
4,455
Contributions from noncontrolling interests in subsidiaries
—
10,199
7,322
Repurchase of Common Stock
(384,515 )
(169,099 )
(9,314 )
Net Cash (Used by) Financing Activities
(438,818 )
(71,100 )
(698,921 )
(Decrease) Increase in Cash and Cash Equivalents
(190,956 )
631,037
216,502
Cash and Cash Equivalents as of January 1
884,642
253,605
37,103
Cash and Cash Equivalents as of December 31
$693,686
$884,642
$253,605
Interest Paid
$97,892
$97,932
$91,623
Income Taxes Paid
292,315
350,948
252,230
TOOTSIE ROLL INDUSTRIES, INC. AND SUBSIDIARIES
CONSOLIDATED STATEMENTS OF
Earnings, Comprehensive Earnings and Retained Earnings (in thousands except per share data)
For the year ended December 31,
2011
2010
2009
Net product sales
$528,369
$517,149
$495,592
Rental and royalty revenue
4,136
4,299
3,739
Total revenue
532,505
521,448
499,331
Product cost of goods sold
365,225
349,334
319,775
Rental and royalty cost
1,038
1,088
852
Total costs
366,263
350,422
320,627
Product gross margin
163,144
167,815
175,817
Rental and royalty gross margin
3,098
3,211
2,887
Total gross margin
166,242
171,026
178,704
Selling, marketing and administrative expenses
108,276
106,316
103,755
Impairment charges
—
—
14,000
Earnings from operations
57,966
64,710
60,949
Other income (expense), net
2,946
8,358
2,100
Earnings before income taxes
60,912
73,068
63,049
Provision for income taxes
16,974
20,005
9,892
Net earnings
$43,938
$53,063
$53,157
Net earnings
$43,938
$53,063
$53,157
Other comprehensive earnings (loss)
(8,740 )
1,183
2,845
Comprehensive earnings
$35,198
$54,246
$56,002
Retained earnings at beginning of year.
$135,866
$147,687
$144,949
Net earnings
43,938
53,063
53,157
Cash dividends
(18,360 )
(18,078 )
(17,790 )
Stock dividends
(47,175 )
(46,806 )
(32,629 )
Retained earnings at end of year
$114,269
$135,866
$147,687
Earnings per share
$0.76
$0.90
$0.89
Average Common and Class B Common shares outstanding
57,892
58,685
59,425
(The accompanying notes are an integral part of these statements.)
CONSOLIDATED STATEMENTS OF
Financial Position
TOOTSIE ROLL INDUSTRIES, INC. AND SUBSIDIARIES (in thousands except per share data)
Assets
December 31,
2011
2010
CURRENT ASSETS:
Cash and cash equivalents
$78,612
$115,976
Investments
10,895
7,996
Accounts receivable trade, less allowances of $1,731 and $1,531
41,895
37,394
Other receivables
3,391
9,961
Inventories:
Finished goods and work-in-process
42,676
35,416
Raw materials and supplies
29,084
21,236
Prepaid expenses
5,070
6,499
Deferred income taxes
578
689
Total current assets
212,201
235,167
PROPERTY, PLANT AND EQUIPMENT, at cost:
Land
21,939
21,696
Buildings
107,567
102,934
Machinery and equipment
322,993
307,178
Construction in progress
2,598
9,243
455,097
440,974
Less—Accumulated depreciation
242,935
225,482
Net property, plant and equipment
212,162
215,492
OTHER ASSETS:
Goodwill
73,237
73,237
Trademarks
175,024
175,024
Investments
96,161
64,461
Split dollar officer life insurance
74,209
74,441
Prepaid expenses
3,212
6,680
Equity method investment
3,935
4,254
Deferred income taxes
7,715
9,203
Total other assets
433,493
407,300
Total assets
$857,856
$857,959
Liabilities and Shareholders’ Equity
December 31,
2011
2010
CURRENT LIABILITIES:
Accounts payable
$10,683
$9,791
Dividends payable
4,603
4,529
Accrued liabilities
43,069
44,185
Total current liabilities
58,355
58,505
NONCURRENT LIABILITES:
Deferred income taxes
43,521
47,865
Postretirement health care and life insurance benefits
26,108
20,689
Industrial development bonds
7,500
7,500
Liability for uncertain tax positions
8,345
9,835
Deferred compensation and other liabilities
48,092
46,157
Total noncurrent liabilities
133,566
132,046
SHAREHOLDERS’ EQUITY:
Common stock, $.69-4/9 par value—120,000 shares authorized—36,479 and
36,057 respectively, issued 25,333
25,040
Class B common stock, $.69-4/9 par value—40,000 shares authorized—21,025
and 20,466 respectively, issued 14,601
14,212
Capital in excess of par value
533,677
505,495
Retained earnings, per accompanying statement
114,269
135,866
Accumulated other comprehensive loss
(19,953 )
(11,213 )
Treasury stock (at cost)—71 shares and 69 shares, respectively
(1,992 )
(1,992 )
Total shareholders’ equity
665,935
667,408
Total liabilities and shareholders’ equity
$857,856
$857,959
TOOTSIE ROLL INDUSTRIES, INC. AND SUBSIDIARIES
CONSOLIDATED STATEMENTS OF
Cash Flows (in thousands)
For the year ended December 31,
2011
2010
2009
CASH FLOWS FROM OPERATING ACTIVITIES:
Net earnings
$43,938
$53,063
$53,157
Adjustments to reconcile net earnings to net cash provided by
operating activities:
Depreciation
19,229
18,279
17,862
Impairment charges
—
—
14,000
Impairment of equity method investment
—
—
4,400
Loss from equity method investment
194
342
233
Amortization of marketable security premiums
1,267
522
320
Changes in operating assets and liabilities:
Accounts receivable
(5,448 )
717
(5,899 )
Other receivables
3,963
(2,373 )
(2,088 )
Inventories
(15,631 )
(1,447 )
455
Prepaid expenses and other assets
5,106
4,936
5,203
Accounts payable and accrued liabilities
84
2,180
(2,755 )
Income taxes payable and deferred
(5,772 )
2,322
(12,543 )
Postretirement health care and life insurance benefits
2,022
1,429
1,384
Deferred compensation and other liabilities
2,146
2,525
2,960
Others
(708 )
310
305
Net cash provided by operating activities
50,390
82,805
76,994
CASH FLOWS FROM INVESTING ACTIVITIES:
Capital expenditures
(16,351 )
(12,813 )
(20,831 )
Net purchase of trading securities
(3,234 )
(2,902 )
(1,713 )
Purchase of available for sale securities
(39,252 )
(9,301 )
(11,331 )
Sale and maturity of available for sale securities
7,680
8,208
17,511
Net cash used in investing activities
(51,157 )
(16,808 )
(16,364 )
CASH FLOWS FROM FINANCING ACTIVITIES:
Shares repurchased and retired
(18,190 )
(22,881 )
(20,723 )
Dividends paid in cash
(18,407 )
(18,130 )
(17,825 )
Net cash used in financing activities
(36,597 )
(41,011 )
(38,548 )
Increase (decrease) in cash and cash equivalents
(37,364 )
24,986
22,082
Cash and cash equivalents at beginning of year
115,976
90,990
68,908
Cash and cash equivalents at end of year
$78,612
$115,976
$90,990
Supplemental cash flow information
Income taxes paid
$16,906
$20,586
$22,364
Interest paid
$38
$49
$182
Stock dividend issued
$47,053
$46,683
$32,538
(The accompanying notes are an integral part of these statements.)
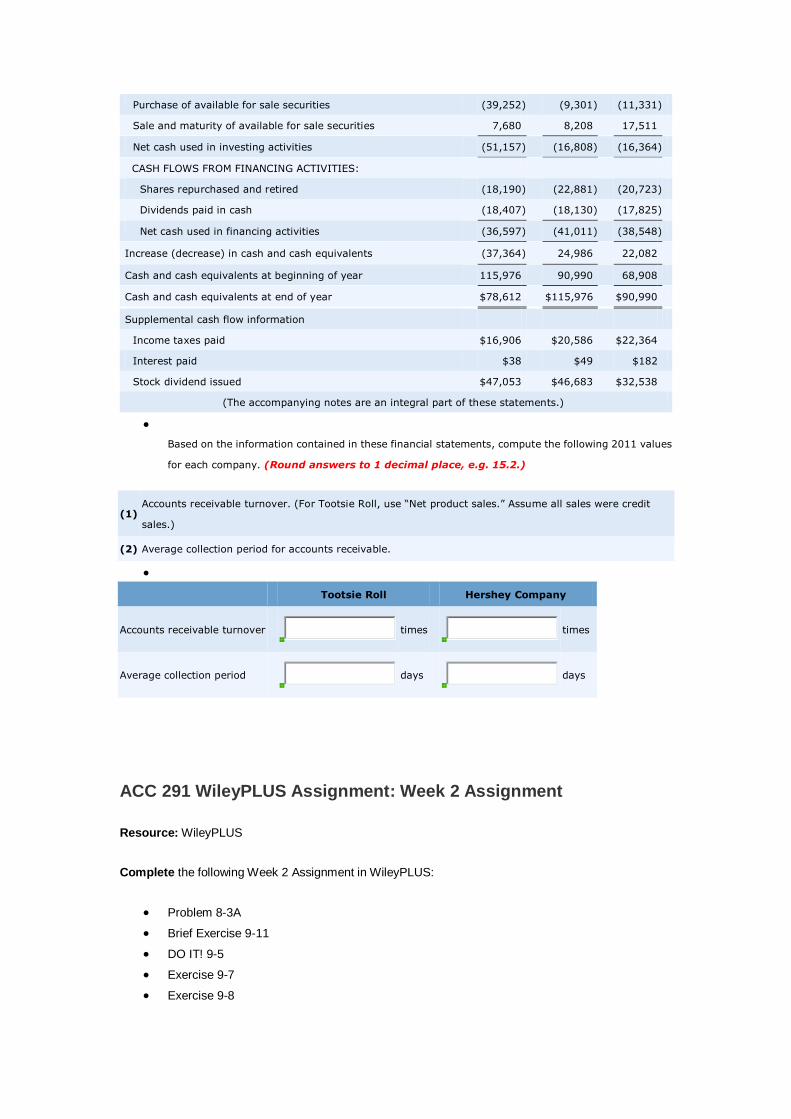
Based on the information contained in these financial statements, compute the following 2011 values
for each company. (Round answers to 1 decimal place, e.g. 15.2.)
(1) Accounts receivable turnover. (For Tootsie Roll, use “Net product sales.” Assume all sales were credit
sales.)
(2) Average collection period for accounts receivable.
Tootsie Roll
Hershey Company
Accounts receivable turnover
times
times
Average collection period
days
days
ACC 291 WileyPLUS Assignment: Week 2 Assignment
Resource: WileyPLUS
Complete the following Week 2 Assignment in WileyPLUS:
Problem 8-3A
Brief Exercise 9-11
DO IT! 9-5
Exercise 9-7
Exercise 9-8

BYP 9-1
BYP 9.2
Problem 9-2A
Brief Exercise 9-11
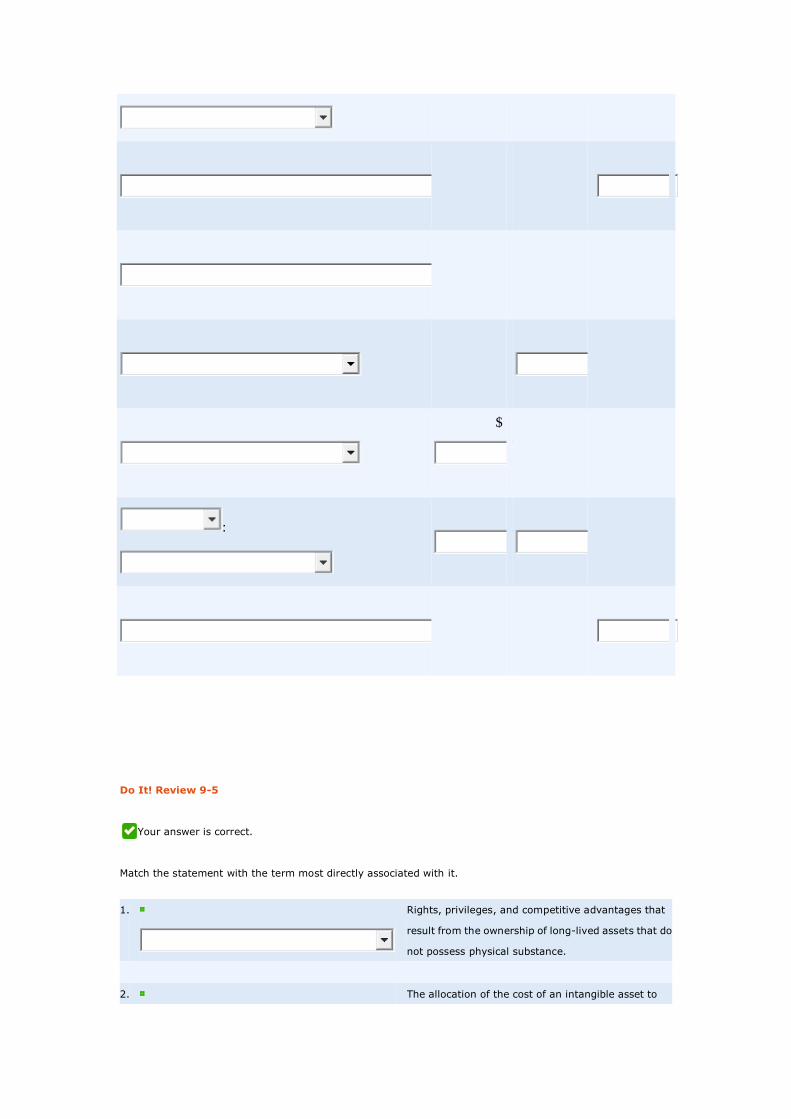
Suppose Nike, Inc. reported the following plant assets and intangible assets for the year ended
May 31, 2014 (in millions): other plant assets $937.7; land $241.9; patents and trademarks (at cost)
$537.8; machinery and equipment $2,185.8; buildings $958; goodwill (at cost) $175.6;
accumulated amortization $53.2; and accumulated depreciation $2,195.
Prepare a partial balance sheet for Nike for these items. (List Property, Plant and Equipment in
order of Land, Buildings and Equipment.)
NIKE, INC.
Partial Balance Sheet
As of May 31, 2014
(in millions)
$
$
:
$
:
Do It! Review 9-5
Your answer is correct.
Match the statement with the term most directly associated with it.
1.
Rights, privileges, and competitive advantages that
result from the ownership of long-lived assets that do
not possess physical substance.
2. The allocation of the cost of an intangible asset to
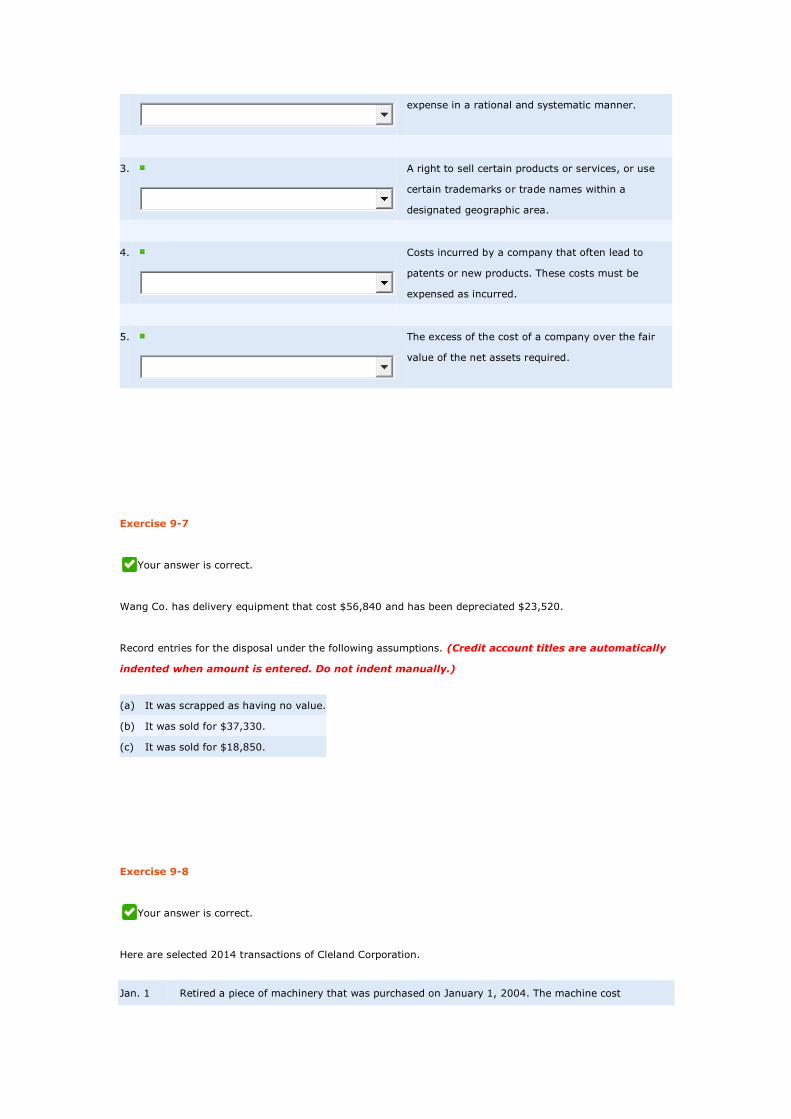
expense in a rational and systematic manner.
3.
A right to sell certain products or services, or use
certain trademarks or trade names within a
designated geographic area.
4.
Costs incurred by a company that often lead to
patents or new products. These costs must be
expensed as incurred.
5.
The excess of the cost of a company over the fair
value of the net assets required.
Exercise 9-7
Your answer is correct.
Wang Co. has delivery equipment that cost $56,840 and has been depreciated $23,520.
Record entries for the disposal under the following assumptions. (Credit account titles are automatically
indented when amount is entered. Do not indent manually.)
(a)
It was scrapped as having no value.
(b)
It was sold for $37,330.
(c)
It was sold for $18,850.
Exercise 9-8
Your answer is correct.
Here are selected 2014 transactions of Cleland Corporation.
Jan. 1 Retired a piece of machinery that was purchased on January 1, 2004. The machine cost
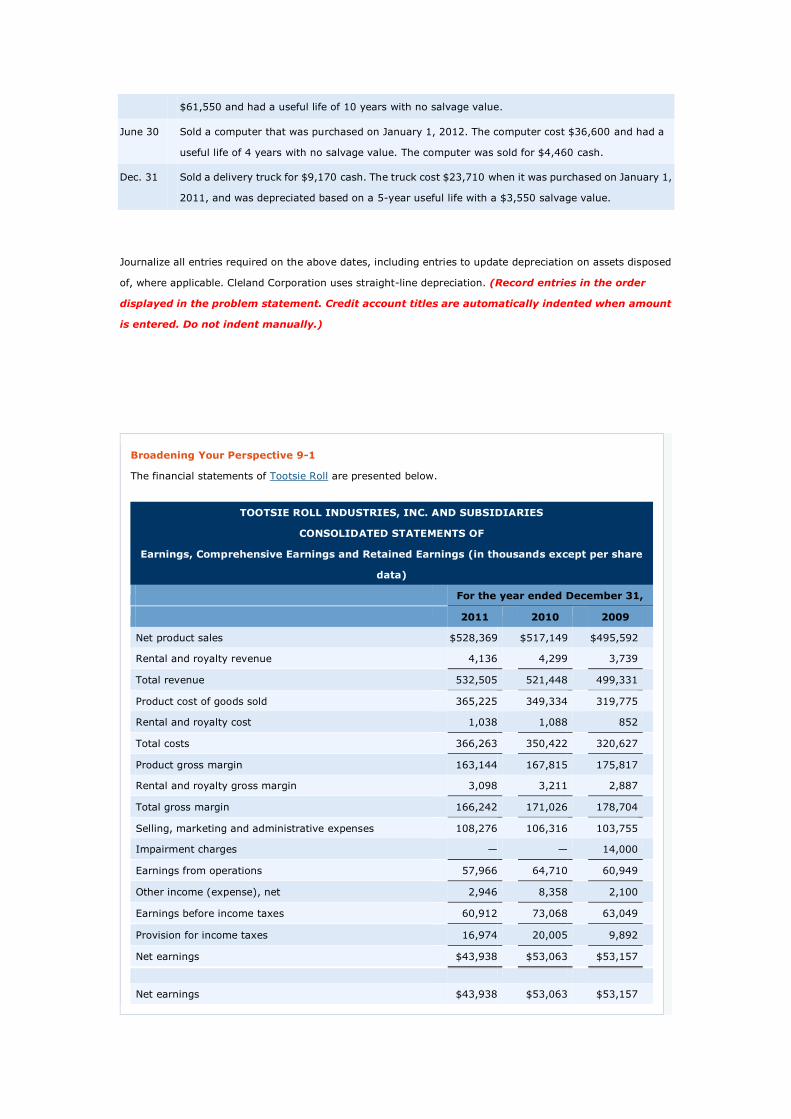
$61,550 and had a useful life of 10 years with no salvage value.
June 30 Sold a computer that was purchased on January 1, 2012. The computer cost $36,600 and had a
useful life of 4 years with no salvage value. The computer was sold for $4,460 cash.
Dec. 31 Sold a delivery truck for $9,170 cash. The truck cost $23,710 when it was purchased on January 1,
2011, and was depreciated based on a 5-year useful life with a $3,550 salvage value.
Journalize all entries required on the above dates, including entries to update depreciation on assets disposed
of, where applicable. Cleland Corporation uses straight-line depreciation. (Record entries in the order
displayed in the problem statement. Credit account titles are automatically indented when amount
is entered. Do not indent manually.)
Broadening Your Perspective 9-1
The financial statements of Tootsie Roll are presented below.
TOOTSIE ROLL INDUSTRIES, INC. AND SUBSIDIARIES
CONSOLIDATED STATEMENTS OF
Earnings, Comprehensive Earnings and Retained Earnings (in thousands except per share
data)
For the year ended December 31,
2011
2010
2009
Net product sales
$528,369
$517,149
$495,592
Rental and royalty revenue
4,136
4,299
3,739
Total revenue
532,505
521,448
499,331
Product cost of goods sold
365,225
349,334
319,775
Rental and royalty cost
1,038
1,088
852
Total costs
366,263
350,422
320,627
Product gross margin
163,144
167,815
175,817
Rental and royalty gross margin
3,098
3,211
2,887
Total gross margin
166,242
171,026
178,704
Selling, marketing and administrative expenses
108,276
106,316
103,755
Impairment charges
—
—
14,000
Earnings from operations
57,966
64,710
60,949
Other income (expense), net
2,946
8,358
2,100
Earnings before income taxes
60,912
73,068
63,049
Provision for income taxes
16,974
20,005
9,892
Net earnings
$43,938
$53,063
$53,157
Net earnings
$43,938
$53,063
$53,157
Other comprehensive earnings (loss)
(8,740 )
1,183
2,845
Comprehensive earnings
$35,198
$54,246
$56,002
Retained earnings at beginning of year.
$135,866
$147,687
$144,949
Net earnings
43,938
53,063
53,157
Cash dividends
(18,360 )
(18,078 )
(17,790 )
Stock dividends
(47,175 )
(46,806 )
(32,629 )
Retained earnings at end of year
$114,269
$135,866
$147,687
Earnings per share
$0.76
$0.90
$0.89
Average Common and Class B Common shares outstanding
57,892
58,685
59,425
(The accompanying notes are an integral part of these statements.)
CONSOLIDATED STATEMENTS OF
Financial Position
TOOTSIE ROLL INDUSTRIES, INC. AND SUBSIDIARIES (in thousands except per share data)
Assets
December 31,
2011
2010
CURRENT ASSETS:
Cash and cash equivalents
$78,612
$115,976
Investments
10,895
7,996
Accounts receivable trade, less allowances of $1,731 and $1,531
41,895
37,394
Other receivables
3,391
9,961
Inventories:
Finished goods and work-in-process
42,676
35,416
Raw materials and supplies
29,084
21,236
Prepaid expenses
5,070
6,499
Deferred income taxes
578
689
Total current assets
212,201
235,167
PROPERTY, PLANT AND EQUIPMENT, at cost:
Land
21,939
21,696
Buildings
107,567
102,934
Machinery and equipment
322,993
307,178
Construction in progress
2,598
9,243
455,097
440,974
Less—Accumulated depreciation
242,935
225,482
Net property, plant and equipment
212,162
215,492
OTHER ASSETS:
Goodwill
73,237
73,237
Trademarks
175,024
175,024
Investments
96,161
64,461
Split dollar officer life insurance
74,209
74,441
Prepaid expenses
3,212
6,680
Equity method investment
3,935
4,254
Deferred income taxes
7,715
9,203
Total other assets
433,493
407,300
Total assets
$857,856
$857,959
Liabilities and Shareholders’ Equity
December 31,
2011
2010
CURRENT LIABILITIES:
Accounts payable
$10,683
$9,791
Dividends payable
4,603
4,529
Accrued liabilities
43,069
44,185
Total current liabilities
58,355
58,505
NONCURRENT LIABILITES:
Deferred income taxes
43,521
47,865
Postretirement health care and life insurance benefits
26,108
20,689
Industrial development bonds
7,500
7,500
Liability for uncertain tax positions
8,345
9,835
Deferred compensation and other liabilities
48,092
46,157
Total noncurrent liabilities
133,566
132,046
SHAREHOLDERS’ EQUITY:
Common stock, $.69-4/9 par value—120,000 shares authorized—36,479
and 36,057 respectively, issued 25,333
25,040
Class B common stock, $.69-4/9 par value—40,000 shares
authorized—21,025 and 20,466 respectively, issued 14,601
14,212
Capital in excess of par value
533,677
505,495
Retained earnings, per accompanying statement
114,269
135,866
Accumulated other comprehensive loss
(19,953 )
(11,213 )
Treasury stock (at cost)—71 shares and 69 shares, respectively
(1,992 )
(1,992 )
Total shareholders’ equity
665,935
667,408
Total liabilities and shareholders’ equity
$857,856
$857,959
TOOTSIE ROLL INDUSTRIES, INC. AND SUBSIDIARIES
CONSOLIDATED STATEMENTS OF
Cash Flows (in thousands)
For the year ended December 31,
2011
2010
2009
CASH FLOWS FROM OPERATING ACTIVITIES:
Net earnings
$43,938
$53,063
$53,157
Adjustments to reconcile net earnings to net cash provided
by operating activities:
Depreciation
19,229
18,279
17,862
Impairment charges
—
—
14,000
Impairment of equity method investment
—
—
4,400
Loss from equity method investment
194
342
233
Amortization of marketable security premiums
1,267
522
320
Changes in operating assets and liabilities:
Accounts receivable
(5,448 )
717
(5,899 )
Other receivables
3,963
(2,373 )
(2,088 )
Inventories
(15,631 )
(1,447 )
455
Prepaid expenses and other assets
5,106
4,936
5,203
Accounts payable and accrued liabilities
84
2,180
(2,755 )
Income taxes payable and deferred
(5,772 )
2,322
(12,543 )
Postretirement health care and life insurance benefits
2,022
1,429
1,384
Deferred compensation and other liabilities
2,146
2,525
2,960
Others
(708 )
310
305
Net cash provided by operating activities
50,390
82,805
76,994
CASH FLOWS FROM INVESTING ACTIVITIES:
Capital expenditures
(16,351 )
(12,813 )
(20,831 )
Net purchase of trading securities
(3,234 )
(2,902 )
(1,713 )
Purchase of available for sale securities
(39,252 )
(9,301 )
(11,331 )
Sale and maturity of available for sale securities
7,680
8,208
17,511
Net cash used in investing activities
(51,157 )
(16,808 )
(16,364 )
CASH FLOWS FROM FINANCING ACTIVITIES:
Shares repurchased and retired
(18,190 )
(22,881 )
(20,723 )
Dividends paid in cash
(18,407 )
(18,130 )
(17,825 )
Net cash used in financing activities
(36,597 )
(41,011 )
(38,548 )
Increase (decrease) in cash and cash equivalents
(37,364 )
24,986
22,082
Cash and cash equivalents at beginning of year
115,976
90,990
68,908
Cash and cash equivalents at end of year
$78,612
$115,976
$90,990
Supplemental cash flow information
Income taxes paid
$16,906
$20,586
$22,364
Interest paid
$38
$49
$182
Stock dividend issued
$47,053
$46,683
$32,538
(The accompanying notes are an integral part of these statements.)
Notes to Consolidated Financial Statements ($ in thousands)
PROPERTY, PLANT AND EQUIPMENT:
Depreciation is computed for financial reporting purposes by use of the straight-line method based on the
useful lives of 20 to 35 years for building and 5 to 25 years for machinery and equipment. Depreciation
expenses was $19,229, $18,279 and $17,862 in 2011, 2010 and 2009, respectively.
Goodwill and intangible assets:
In accordance with authoritative guidance, goodwill and intangible assets with indefinite lives are not
amortized, but rather tested for impairment at least annually unless certain interim triggering events or
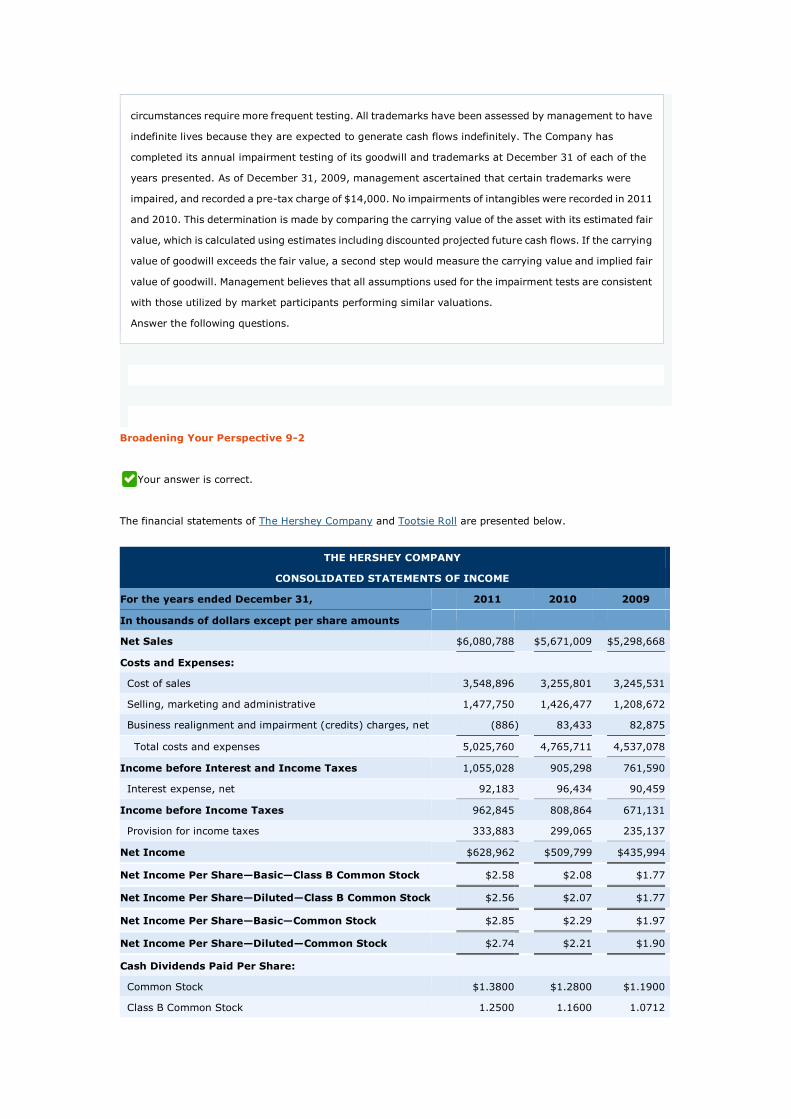
circumstances require more frequent testing. All trademarks have been assessed by management to have
indefinite lives because they are expected to generate cash flows indefinitely. The Company has
completed its annual impairment testing of its goodwill and trademarks at December 31 of each of the
years presented. As of December 31, 2009, management ascertained that certain trademarks were
impaired, and recorded a pre-tax charge of $14,000. No impairments of intangibles were recorded in 2011
and 2010. This determination is made by comparing the carrying value of the asset with its estimated fair
value, which is calculated using estimates including discounted projected future cash flows. If the carrying
value of goodwill exceeds the fair value, a second step would measure the carrying value and implied fair
value of goodwill. Management believes that all assumptions used for the impairment tests are consistent
with those utilized by market participants performing similar valuations.
Answer the following questions.
Broadening Your Perspective 9-2
Your answer is correct.
The financial statements of The Hershey Company and Tootsie Roll are presented below.
THE HERSHEY COMPANY
CONSOLIDATED STATEMENTS OF INCOME
For the years ended December 31,
2011
2010
2009
In thousands of dollars except per share amounts
Net Sales
$6,080,788
$5,671,009
$5,298,668
Costs and Expenses:
Cost of sales
3,548,896
3,255,801
3,245,531
Selling, marketing and administrative
1,477,750
1,426,477
1,208,672
Business realignment and impairment (credits) charges, net
(886 )
83,433
82,875
Total costs and expenses
5,025,760
4,765,711
4,537,078
Income before Interest and Income Taxes
1,055,028
905,298
761,590
Interest expense, net
92,183
96,434
90,459
Income before Income Taxes
962,845
808,864
671,131
Provision for income taxes
333,883
299,065
235,137
Net Income
$628,962
$509,799
$435,994
Net Income Per Share—Basic—Class B Common Stock
$2.58
$2.08
$1.77
Net Income Per Share—Diluted—Class B Common Stock
$2.56
$2.07
$1.77
Net Income Per Share—Basic—Common Stock
$2.85
$2.29
$1.97
Net Income Per Share—Diluted—Common Stock
$2.74
$2.21
$1.90
Cash Dividends Paid Per Share:
Common Stock
$1.3800
$1.2800
$1.1900
Class B Common Stock
1.2500
1.1600
1.0712
The notes to consolidated financial statements are an integral part of these statements and are included in the
Hershey's 2011 Annual Report, available at www.thehersheycompany.com.
THE HERSHEY COMPANY
CONSOLIDATED BALANCE SHEETS
December 31,
2011
2010
In thousands of dollars
ASSETS
Current Assets:
Cash and cash equivalents
$693,686
$884,642
Accounts receivable—trade
399,499
390,061
Inventories
648,953
533,622
Deferred income taxes
136,861
55,760
Prepaid expenses and other
167,559
141,132
Total current assets
2,046,558
2,005,217
Property, Plant and Equipment, Net
1,559,717
1,437,702
Goodwill
516,745
524,134
Other Intangibles
111,913
123,080
Deferred Income Taxes
38,544
21,387
Other Assets
138,722
161,212
Total assets
$4,412,199
$4,272,732
LIABILITIES AND STOCKHOLDERS’ EQUITY
Current Liabilities:
Accounts payable
$420,017
$410,655
Accrued liabilities
612,186
593,308
Accrued income taxes
1,899
9,402
Short-term debt
42,080
24,088
Current portion of long-term debt
97,593
261,392
Total current liabilities
1,173,775
1,298,845
Long-term Debt
1,748,500
1,541,825
Other Long-term Liabilities
617,276
494,461
Total liabilities
3,539,551
3,335,131
Commitments and Contingencies
—
—
Stockholders’ Equity:
The Hershey Company Stockholders’ Equity
Preferred Stock, shares issued: none in 2011 and 2010
—
—
Common Stock, shares issued: 299,269,702 in 2011 and 299,195,325 in
2010 299,269
299,195
Class B Common Stock, shares issued: 60,632,042 in 2011 and 60,706,419
in 2010 60,632
60,706
Additional paid-in capital
490,817
434,865
Retained earnings
4,699,597
4,374,718
Treasury—Common Stock shares, at cost: 134,695,826 in 2011 and
132,871,512 in 2010 (4,258,962 )
(4,052,101 )
Accumulated other comprehensive loss
(442,331 )
(215,067 )
The Hershey Company stockholders’ equity
849,022
902,316
Noncontrolling interests in subsidiaries
23,626
35,285
Total stockholders’ equity
872,648
937,601
Total liabilities and stockholders’equity
$4,412,199
$4,272,732
THE HERSHEY COMPANY
CONSOLIDATED STATEMENTS OF CASH FLOWS
For the years ended December 31,
2011
2010
2009
In thousands of dollars
Cash Flows Provided from (Used by) Operating Activities
Net income
$628,962
$509,799
$435,994
Adjustments to reconcile net income to net cash provided from
operations:
Depreciation and amortization
215,763
197,116
182,411
Stock-based compensation expense, net of tax of $15,127,
$17,413 and $19,223, respectively 28,341
32,055
34,927
Excess tax benefits from stock-based compensation
(13,997 )
(1,385 )
(4,455 )
Deferred income taxes
33,611
(18,654 )
(40,578 )
Gain on sale of trademark licensing rights, net of tax of $5,962
(11,072 )
—
—
Business realignment and impairment charges, net of tax of
$18,333, $20,635 and $38,308, respectively 30,838
77,935
60,823
Contributions to pension plans
(8,861 )
(6,073 )
(54,457 )
Changes in assets and liabilities, net of effects from business
acquisitions and divestitures:
Accounts receivable—trade
(9,438 )
20,329
46,584
Inventories
(115,331 )
(13,910 )
74,000
Accounts payable
7,860
90,434
37,228
Other assets and liabilities
(205,809 )
13,777
293,272
Net Cash Provided from Operating Activities
580,867
901,423
1,065,749
Cash Flows Provided from (Used by) Investing Activities
Capital additions
(323,961 )
(179,538 )
(126,324 )
Capitalized software additions
(23,606 )
(21,949 )
(19,146 )
Proceeds from sales of property, plant and equipment
312
2,201
10,364
Proceeds from sales of trademark licensing rights
20,000
—
—
Business acquisitions
(5,750 )
—
(15,220 )
Net Cash (Used by) Investing Activities
(333,005 )
(199,286 )
(150,326 )
Cash Flows Provided from (Used by) Financing Activities
Net change in short-term borrowings
10,834
1,156
(458,047 )
Long-term borrowings
249,126
348,208
—
Repayment of long-term debt
(256,189 )
(71,548 )
(8,252 )
Proceeds from lease financing agreement
47,601
—
—
Cash dividends paid
(304,083 )
(283,434 )
(263,403 )
Exercise of stock options
184,411
92,033
28,318
Excess tax benefits from stock-based compensation
13,997
1,385
4,455
Contributions from noncontrolling interests in subsidiaries
—
10,199
7,322
Repurchase of Common Stock
(384,515 )
(169,099 )
(9,314 )
Net Cash (Used by) Financing Activities
(438,818 )
(71,100 )
(698,921 )
(Decrease) Increase in Cash and Cash Equivalents
(190,956 )
631,037
216,502
Cash and Cash Equivalents as of January 1
884,642
253,605
37,103
Cash and Cash Equivalents as of December 31
$693,686
$884,642
$253,605
Interest Paid
$97,892
$97,932
$91,623
Income Taxes Paid
292,315
350,948
252,230
TOOTSIE ROLL INDUSTRIES, INC. AND SUBSIDIARIES
CONSOLIDATED STATEMENTS OF
Earnings, Comprehensive Earnings and Retained Earnings (in thousands except per share data)
For the year ended December 31,
2011
2010
2009
Net product sales
$528,369
$517,149
$495,592
Rental and royalty revenue
4,136
4,299
3,739
Total revenue
532,505
521,448
499,331
Product cost of goods sold
365,225
349,334
319,775
Rental and royalty cost
1,038
1,088
852
Total costs
366,263
350,422
320,627
Product gross margin
163,144
167,815
175,817
Rental and royalty gross margin
3,098
3,211
2,887
Total gross margin
166,242
171,026
178,704
Selling, marketing and administrative expenses
108,276
106,316
103,755
Impairment charges
—
—
14,000
Earnings from operations
57,966
64,710
60,949
Other income (expense), net
2,946
8,358
2,100
Earnings before income taxes
60,912
73,068
63,049
Provision for income taxes
16,974
20,005
9,892
Net earnings
$43,938
$53,063
$53,157
Net earnings
$43,938
$53,063
$53,157
Other comprehensive earnings (loss)
(8,740 )
1,183
2,845
Comprehensive earnings
$35,198
$54,246
$56,002
Retained earnings at beginning of year.
$135,866
$147,687
$144,949
Net earnings
43,938
53,063
53,157
Cash dividends
(18,360 )
(18,078 )
(17,790 )
Stock dividends
(47,175 )
(46,806 )
(32,629 )
Retained earnings at end of year
$114,269
$135,866
$147,687
Earnings per share
$0.76
$0.90
$0.89
Average Common and Class B Common shares outstanding
57,892
58,685
59,425
(The accompanying notes are an integral part of these statements.)
CONSOLIDATED STATEMENTS OF
Financial Position
TOOTSIE ROLL INDUSTRIES, INC. AND SUBSIDIARIES (in thousands except per share data)
Assets
December 31,
2011
2010
CURRENT ASSETS:
Cash and cash equivalents
$78,612
$115,976
Investments
10,895
7,996
Accounts receivable trade, less allowances of $1,731 and $1,531
41,895
37,394
Other receivables
3,391
9,961
Inventories:
Finished goods and work-in-process
42,676
35,416
Raw materials and supplies
29,084
21,236
Prepaid expenses
5,070
6,499
Deferred income taxes
578
689
Total current assets
212,201
235,167
PROPERTY, PLANT AND EQUIPMENT, at cost:
Land
21,939
21,696
Buildings
107,567
102,934
Machinery and equipment
322,993
307,178
Construction in progress
2,598
9,243
455,097
440,974
Less—Accumulated depreciation
242,935
225,482
Net property, plant and equipment
212,162
215,492
OTHER ASSETS:
Goodwill
73,237
73,237
Trademarks
175,024
175,024
Investments
96,161
64,461
Split dollar officer life insurance
74,209
74,441
Prepaid expenses
3,212
6,680
Equity method investment
3,935
4,254
Deferred income taxes
7,715
9,203
Total other assets
433,493
407,300
Total assets
$857,856
$857,959
Liabilities and Shareholders’ Equity
December 31,
2011
2010
CURRENT LIABILITIES:
Accounts payable
$10,683
$9,791
Dividends payable
4,603
4,529
Accrued liabilities
43,069
44,185
Total current liabilities
58,355
58,505
NONCURRENT LIABILITES:
Deferred income taxes
43,521
47,865
Postretirement health care and life insurance benefits
26,108
20,689
Industrial development bonds
7,500
7,500
Liability for uncertain tax positions
8,345
9,835
Deferred compensation and other liabilities
48,092
46,157
Total noncurrent liabilities
133,566
132,046
SHAREHOLDERS’ EQUITY:
Common stock, $.69-4/9 par value—120,000 shares authorized—36,479 and
36,057 respectively, issued 25,333
25,040
Class B common stock, $.69-4/9 par value—40,000 shares authorized—21,025
and 20,466 respectively, issued 14,601
14,212
Capital in excess of par value
533,677
505,495
Retained earnings, per accompanying statement
114,269
135,866
Accumulated other comprehensive loss
(19,953 )
(11,213 )
Treasury stock (at cost)—71 shares and 69 shares, respectively
(1,992 )
(1,992 )
Total shareholders’ equity
665,935
667,408
Total liabilities and shareholders’ equity
$857,856
$857,959
TOOTSIE ROLL INDUSTRIES, INC. AND SUBSIDIARIES
CONSOLIDATED STATEMENTS OF
Cash Flows (in thousands)
For the year ended December 31,
2011
2010
2009
CASH FLOWS FROM OPERATING ACTIVITIES:
Net earnings
$43,938
$53,063
$53,157
Adjustments to reconcile net earnings to net cash provided by
operating activities:
Depreciation
19,229
18,279
17,862
Impairment charges
—
—
14,000
Impairment of equity method investment
—
—
4,400
Loss from equity method investment
194
342
233
Amortization of marketable security premiums
1,267
522
320
Changes in operating assets and liabilities:
Accounts receivable
(5,448 )
717
(5,899 )
Other receivables
3,963
(2,373 )
(2,088 )
Inventories
(15,631 )
(1,447 )
455
Prepaid expenses and other assets
5,106
4,936
5,203
Accounts payable and accrued liabilities
84
2,180
(2,755 )
Income taxes payable and deferred
(5,772 )
2,322
(12,543 )
Postretirement health care and life insurance benefits
2,022
1,429
1,384
Deferred compensation and other liabilities
2,146
2,525
2,960
Others
(708 )
310
305
Net cash provided by operating activities
50,390
82,805
76,994
CASH FLOWS FROM INVESTING ACTIVITIES:
Capital expenditures
(16,351 )
(12,813 )
(20,831 )
Net purchase of trading securities
(3,234 )
(2,902 )
(1,713 )
Purchase of available for sale securities
(39,252 )
(9,301 )
(11,331 )
Sale and maturity of available for sale securities
7,680
8,208
17,511
Net cash used in investing activities
(51,157 )
(16,808 )
(16,364 )
CASH FLOWS FROM FINANCING ACTIVITIES:
Shares repurchased and retired
(18,190 )
(22,881 )
(20,723 )
Dividends paid in cash
(18,407 )
(18,130 )
(17,825 )
Net cash used in financing activities
(36,597 )
(41,011 )
(38,548 )
Increase (decrease) in cash and cash equivalents
(37,364 )
24,986
22,082
Cash and cash equivalents at beginning of year
115,976
90,990
68,908
Cash and cash equivalents at end of year
$78,612
$115,976
$90,990
Supplemental cash flow information
Income taxes paid
$16,906
$20,586
$22,364
Interest paid
$38
$49
$182
Stock dividend issued
$47,053
$46,683
$32,538
(The accompanying notes are an integral part of these statements.)
Based on the information in these financial statements and the accompanying notes and schedules, compute
the following values for each company in 2011. (Round all percentages to 1 decimal places, e.g. 15.1%
and asset turnover ratio to 2 decimal places, e.g. 15.21.)
(1) Return on assets.
Return on assets
Tootsie Roll
%
Hershey Company
%
(2) Profit margin (use “Total Revenue”).
Profit margin
Tootsie Roll
%
Hershey Company
%
(3) Asset turnover.
Asset turnover
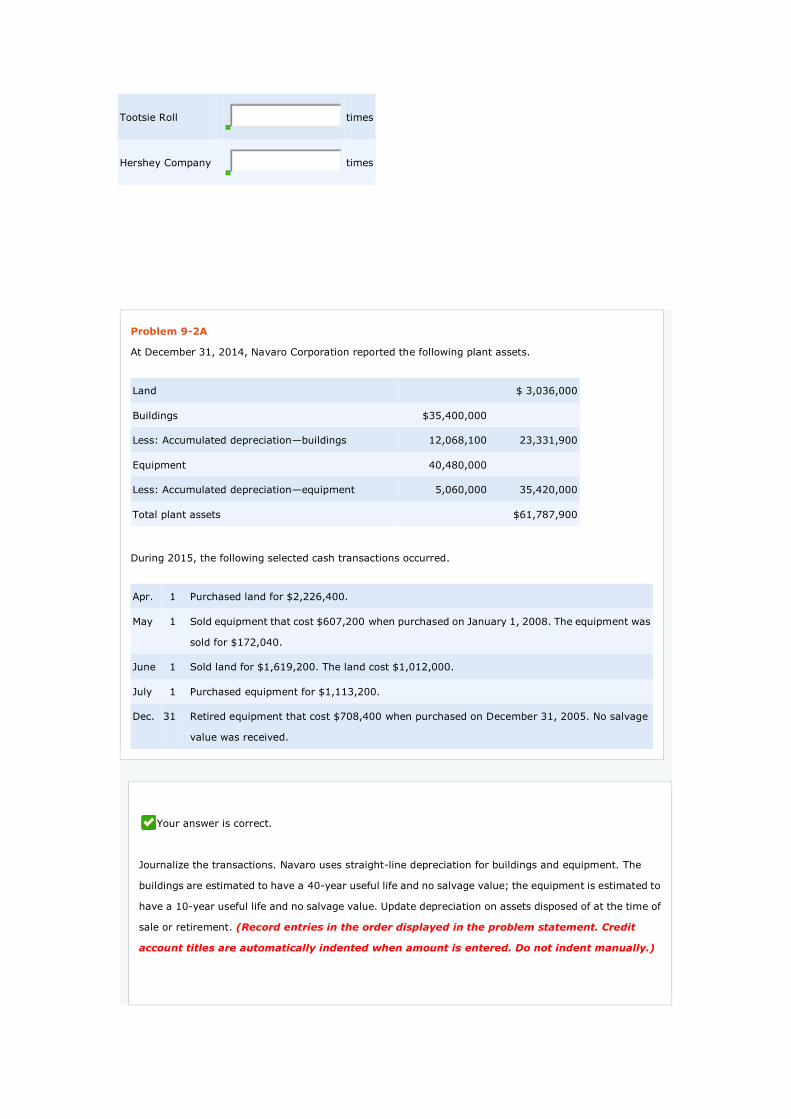
Tootsie Roll
times
Hershey Company
times
Problem 9-2A
At December 31, 2014, Navaro Corporation reported the following plant assets.
Land
$ 3,036,000
Buildings
$35,400,000
Less: Accumulated depreciation—buildings
12,068,100
23,331,900
Equipment
40,480,000
Less: Accumulated depreciation—equipment
5,060,000
35,420,000
Total plant assets
$61,787,900
During 2015, the following selected cash transactions occurred.
Apr. 1 Purchased land for $2,226,400.
May 1 Sold equipment that cost $607,200 when purchased on January 1, 2008. The equipment was
sold for $172,040.
June 1 Sold land for $1,619,200. The land cost $1,012,000.
July 1 Purchased equipment for $1,113,200.
Dec. 31 Retired equipment that cost $708,400 when purchased on December 31, 2005. No salvage
value was received.
Your answer is correct.
Journalize the transactions. Navaro uses straight-line depreciation for buildings and equipment. The
buildings are estimated to have a 40-year useful life and no salvage value; the equipment is estimated to
have a 10-year useful life and no salvage value. Update depreciation on assets disposed of at the time of
sale or retirement. (Record entries in the order displayed in the problem statement. Credit
account titles are automatically indented when amount is entered. Do not indent manually.)
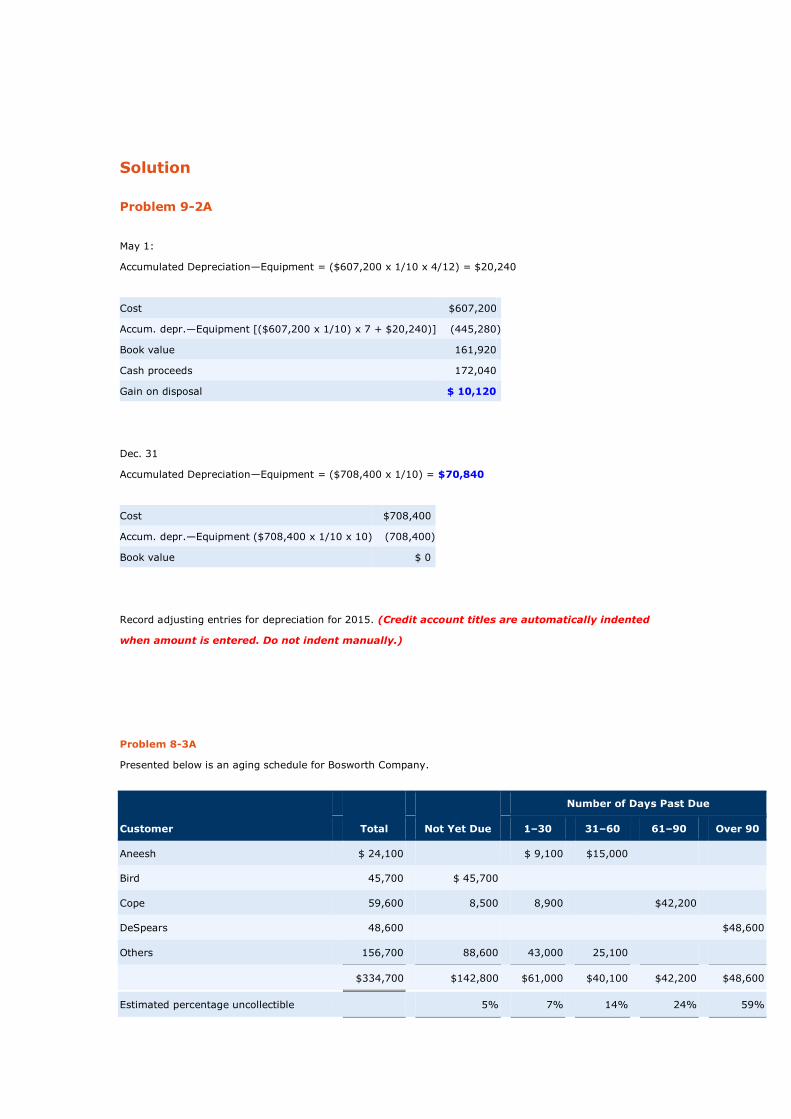
Solution
Problem 9-2A
May 1:
Accumulated Depreciation—Equipment = ($607,200 x 1/10 x 4/12) = $20,240
Cost
$607,200
Accum. depr.—Equipment [($607,200 x 1/10) x 7 + $20,240)]
(445,280 )
Book value
161,920
Cash proceeds
172,040
Gain on disposal
$ 10,120
Dec. 31
Accumulated Depreciation—Equipment = ($708,400 x 1/10) = $70,840
Cost
$708,400
Accum. depr.—Equipment ($708,400 x 1/10 x 10)
(708,400 )
Book value
$ 0
Record adjusting entries for depreciation for 2015. (Credit account titles are automatically indented
when amount is entered. Do not indent manually.)
Problem 8-3A
Presented below is an aging schedule for Bosworth Company.
Customer
Total
Not Yet Due
Number of Days Past Due
1–30
31–60
61–90
Over 90
Aneesh
$ 24,100
$ 9,100
$15,000
Bird
45,700
$ 45,700
Cope
59,600
8,500
8,900
$42,200
DeSpears
48,600
$48,600
Others 156,700 88,600 43,000 25,100
$334,700 $142,800 $61,000 $40,100 $42,200 $48,600
Estimated percentage uncollectible 5% 7% 14% 24% 59%
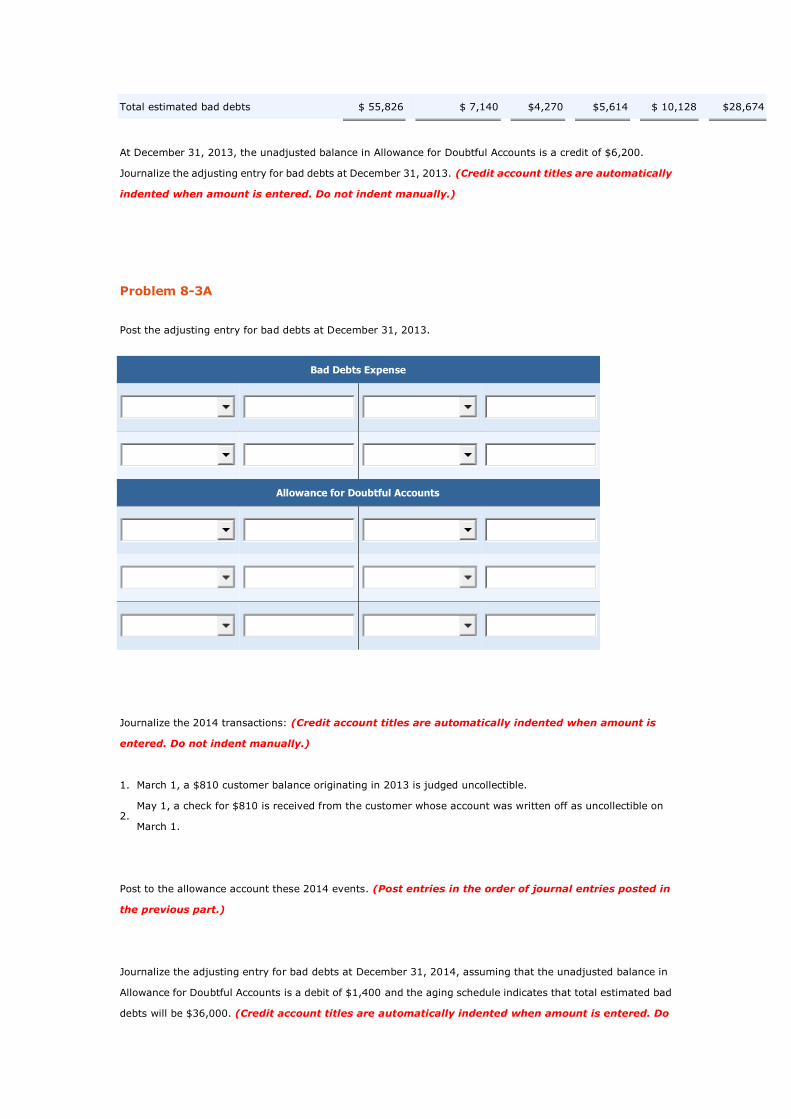
Total estimated bad debts $ 55,826 $ 7,140 $4,270 $5,614 $ 10,128 $28,674
At December 31, 2013, the unadjusted balance in Allowance for Doubtful Accounts is a credit of $6,200.
Journalize the adjusting entry for bad debts at December 31, 2013. (Credit account titles are automatically
indented when amount is entered. Do not indent manually.)
Problem 8-3A
Post the adjusting entry for bad debts at December 31, 2013.
Bad Debts Expense
Allowance for Doubtful Accounts
Journalize the 2014 transactions: (Credit account titles are automatically indented when amount is
entered. Do not indent manually.)
1. March 1, a $810 customer balance originating in 2013 is judged uncollectible.
2. May 1, a check for $810 is received from the customer whose account was written off as uncollectible on
March 1.
Post to the allowance account these 2014 events. (Post entries in the order of journal entries posted in
the previous part.)
Journalize the adjusting entry for bad debts at December 31, 2014, assuming that the unadjusted balance in
Allowance for Doubtful Accounts is a debit of $1,400 and the aging schedule indicates that total estimated bad
debts will be $36,000. (Credit account titles are automatically indented when amount is entered. Do
not indent manually.)
ACC 291 WileyPLUS Assignment: Week 3 Assignment
Resource: WileyPLUS
Complete the following Week 3 Assignment in WileyPLUS:
Problem 9-7A
Exercise 10-5
Exercise 10-8
Exercise 10-13
Exercise 10-22
Exercise 10-24
BYP 10-1
BYP 10-2
Problem 10-9A
Problem 10-13A
IFRS 10-4
Exercise 10-5
During the month of March, Olinger Company’s employees earned wages of $73,700. Withholdings
related to these wages were $5,638 for Social Security (FICA), $8,637 for federal income tax, $3,570 for
state income tax, and $461 for union dues. The company incurred no cost related to these earnings for
federal unemployment tax but incurred $806 for state unemployment tax.
Your answer is correct.
Prepare the necessary March 31 journal entry to record salaries and wages expense and salaries and
wages payable. Assume that wages earned during March will be paid during April. (Credit account
titles are automatically indented when amount is entered. Do not indent manually.)
Your answer is correct.
Prepare the entry to record the company’s payroll tax expense. (Credit account titles are
automatically indented when amount is entered. Do not indent manually.)
Exercise 10-8
On August 1, 2014, Ortega Corporation issued $980,400, 6%, 10-year bonds at face value. Interest is payable
annually on August 1. Ortega’s year-end is December 31.
Prepare journal entries to record the issuance of the bonds. (Credit account titles are automatically
indented when amount is entered. Do not indent manually.)
Prepare journal entries to record the accrual of interest on December 31, 2014. (Credit account titles are
automatically indented when amount is entered. Do not indent manually.)
Prepare journal entries to record the payment of interest on August 1, 2015. (Credit account titles are
automatically indented when amount is entered. Do not indent manually.)
Exercise 10-13
Romine Company issued $531,000 of 9%, 10-year bonds on January 1, 2014, at face value. Interest is
payable annually on January 1.
Your answer is correct.
Prepare the journal entries to record the issuance of the bonds. (Credit account titles are
automatically indented when amount is entered. Do not indent manually.)
Your answer is correct.
Prepare the journal entries to record the accrual of interest on December 31, 2014. (Credit account
titles are automatically indented when amount is entered. Do not indent manually.)
Your answer is correct.
Prepare the journal entries to record the payment of interest on January 1, 2015. (Credit account
titles are automatically indented when amount is entered. Do not indent manually.)
Your answer is correct.
Prepare the journal entries to record the redemption of the bonds at maturity, assuming interest for the
last interest period has been paid and recorded. (Credit account titles are automatically indented
when amount is entered. Do not indent manually.)

Exercise 10-22
Cole Corporation issued $445,000, 7%, 22-year bonds on January 1, 2014, for $360,961. This price
resulted in an effective-interest rate of 9% on the bonds. Interest is payable annually on January 1. Cole
uses the effective-interest method to amortize bond premium or discount.
Your answer is correct.
Prepare the schedule using effective-interest method to amortize bond premium or discount of Cole
Corporation. (Round answers to 0 decimal places, e.g. 125.)
Your answer is correct.
Prepare the journal entries to record the issuance of the bonds. (Round answers to 0 decimal
places, e.g. 125. Credit account titles are automatically indented when amount is entered. Do
not indent manually.)
Your answer is correct.
Prepare the journal entries to record the accrual of interest and the discount amortization on December
31, 2014. (Round answers to 0 decimal places, e.g. 125. Credit account titles are
automatically indented when amount is entered. Do not indent manually.)

Your answer is correct.
Prepare the journal entries to record the payment of interest on January 1, 2015. (Round answers to 0
decimal places, e.g. 125. Credit account titles are automatically indented when amount is
entered. Do not indent manually.)
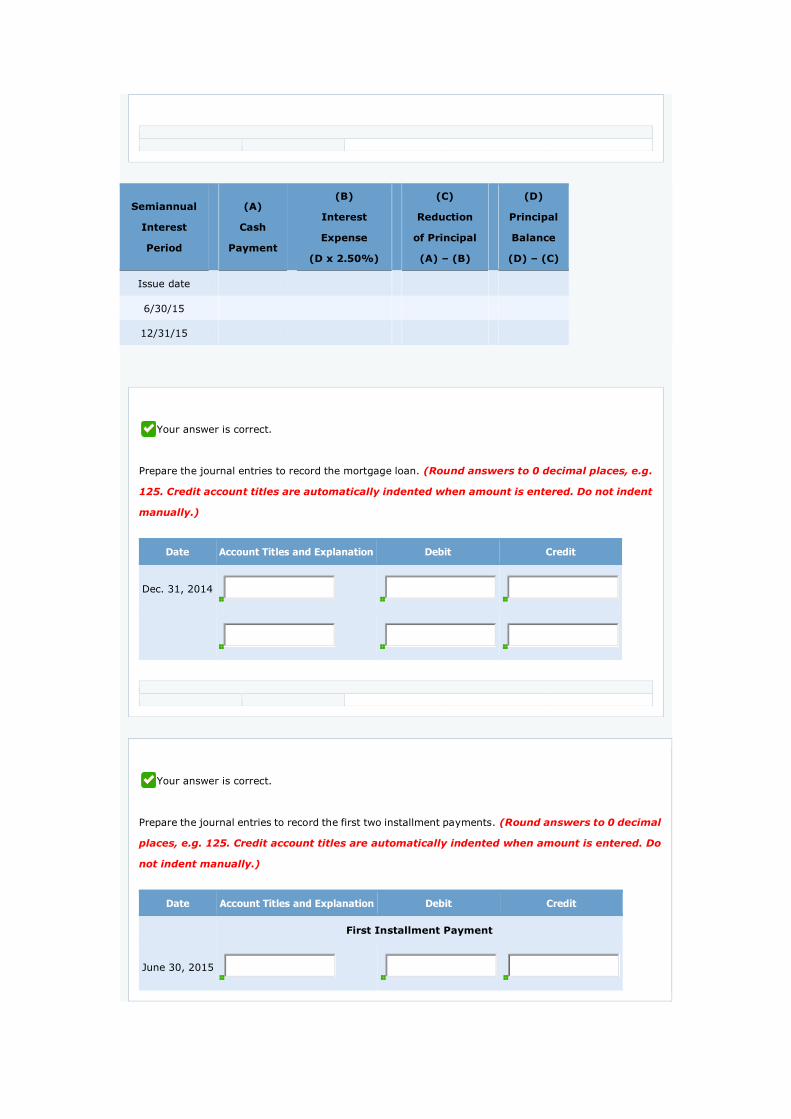
Exercise 10-24
Nance Co. receives $327,800 when it issues a $327,800, 5%, mortgage note payable to finance the
construction of a building at December 31, 2014. The terms provide for semiannual installment payments
of $15,662 on June 30 and December 31.
Your answer is correct.
Prepare the schedule using effective-interest method to amortize bond premium or discount of Nance
Co. (Round answers to 0 decimal places, e.g. 125.)
Semiannua
l
Interest
Period
Cash
Payment
Interest
Expense
Reduction
of Principal
Principal
Balance
Issue date
$
$
$
$
6/30/15
12/31/15
Semiannual
Interest
Period
(A)
Cash
Payment
(B)
Interest
Expense
(D x 2.50%)
(C)
Reduction
of Principal
(A) – (B)
(D)
Principal
Balance
(D) – (C)
Issue date
6/30/15
12/31/15
Your answer is correct.
Prepare the journal entries to record the mortgage loan. (Round answers to 0 decimal places, e.g.
125. Credit account titles are automatically indented when amount is entered. Do not indent
manually.)
Date Account Titles and Explanation Debit Credit
Dec. 31, 2014
Your answer is correct.
Prepare the journal entries to record the first two installment payments. (Round answers to 0 decimal
places, e.g. 125. Credit account titles are automatically indented when amount is entered. Do
not indent manually.)
Date Account Titles and Explanation Debit Credit
First Installment Payment
June 30, 2015
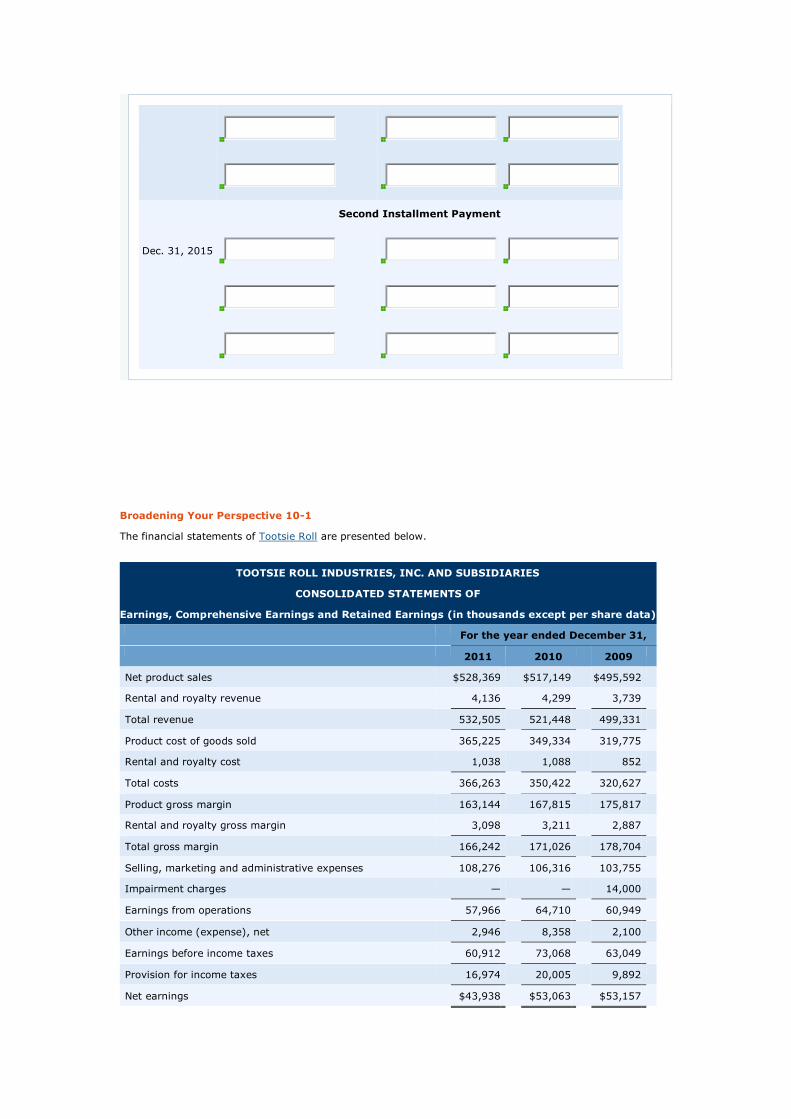
Second Installment Payment
Dec. 31, 2015
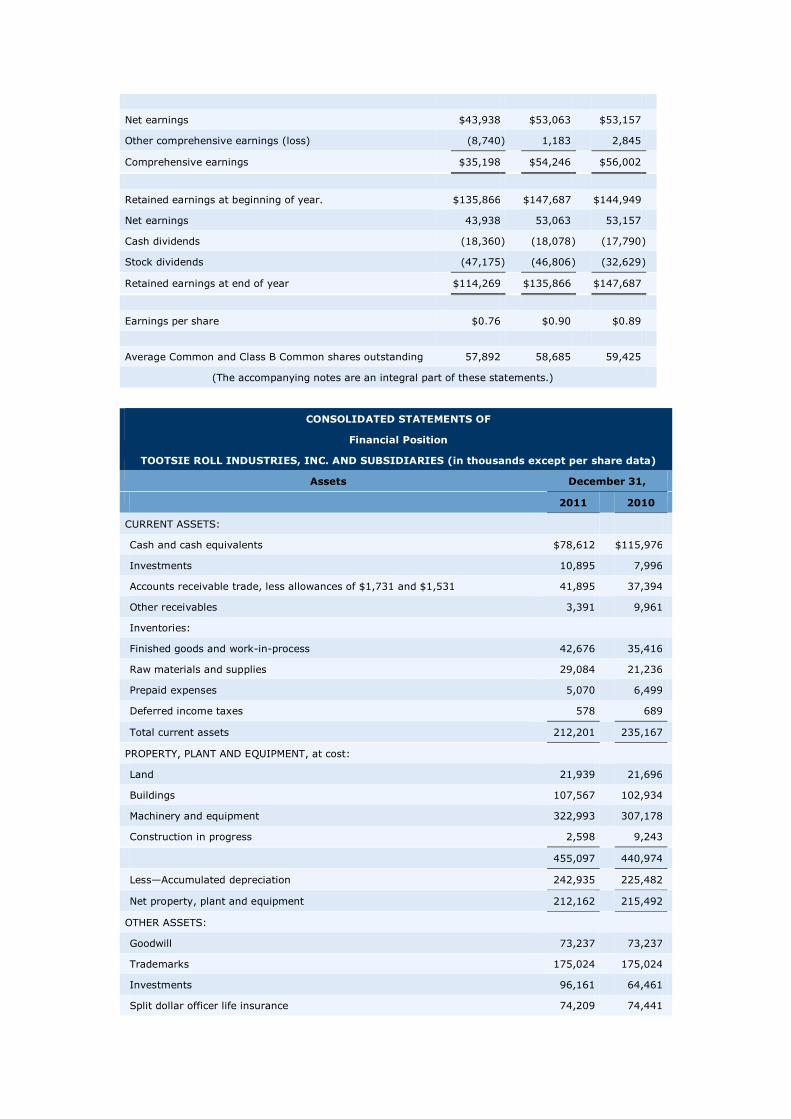
Broadening Your Perspective 10-1
The financial statements of Tootsie Roll are presented below.
TOOTSIE ROLL INDUSTRIES, INC. AND SUBSIDIARIES
CONSOLIDATED STATEMENTS OF
Earnings, Comprehensive Earnings and Retained Earnings (in thousands except per share data)
For the year ended December 31,
2011
2010
2009
Net product sales
$528,369
$517,149
$495,592
Rental and royalty revenue
4,136
4,299
3,739
Total revenue
532,505
521,448
499,331
Product cost of goods sold
365,225
349,334
319,775
Rental and royalty cost
1,038
1,088
852
Total costs
366,263
350,422
320,627
Product gross margin
163,144
167,815
175,817
Rental and royalty gross margin
3,098
3,211
2,887
Total gross margin
166,242
171,026
178,704
Selling, marketing and administrative expenses
108,276
106,316
103,755
Impairment charges
—
—
14,000
Earnings from operations
57,966
64,710
60,949
Other income (expense), net
2,946
8,358
2,100
Earnings before income taxes
60,912
73,068
63,049
Provision for income taxes
16,974
20,005
9,892
Net earnings
$43,938
$53,063
$53,157
Net earnings
$43,938
$53,063
$53,157
Other comprehensive earnings (loss)
(8,740 )
1,183
2,845
Comprehensive earnings
$35,198
$54,246
$56,002
Retained earnings at beginning of year.
$135,866
$147,687
$144,949
Net earnings
43,938
53,063
53,157
Cash dividends
(18,360 )
(18,078 )
(17,790 )
Stock dividends
(47,175 )
(46,806 )
(32,629 )
Retained earnings at end of year
$114,269
$135,866
$147,687
Earnings per share
$0.76
$0.90
$0.89
Average Common and Class B Common shares outstanding
57,892
58,685
59,425
(The accompanying notes are an integral part of these statements.)
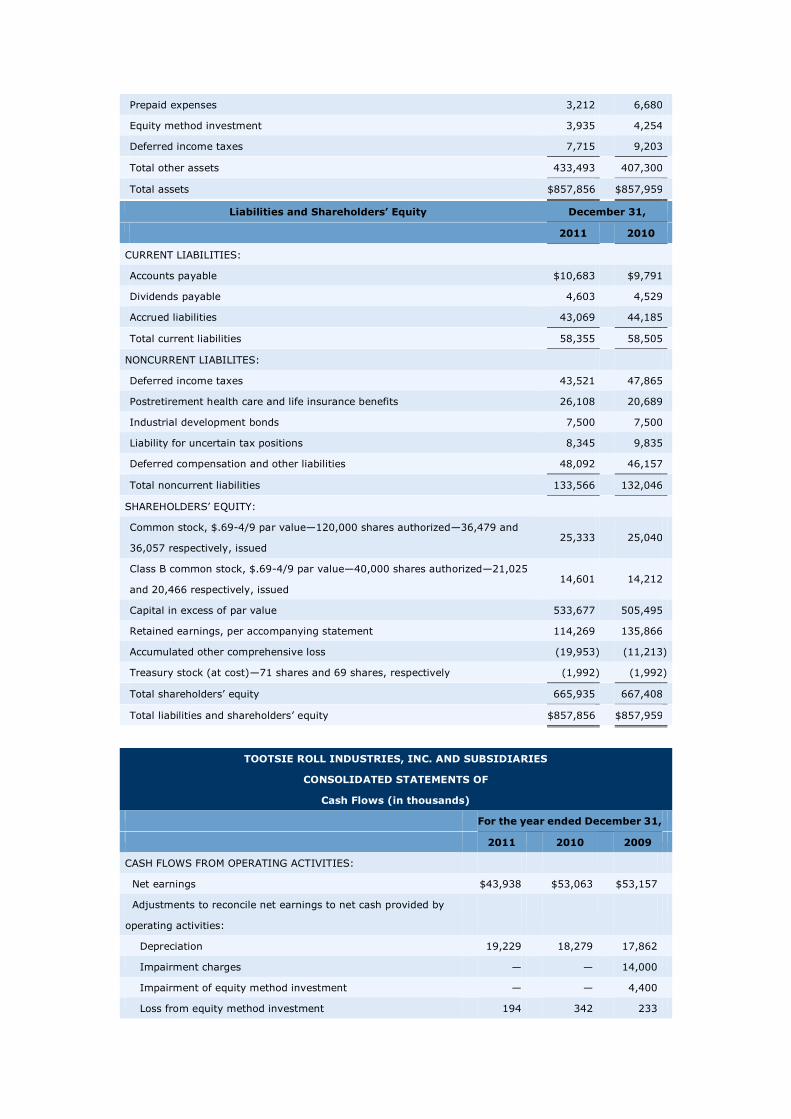
CONSOLIDATED STATEMENTS OF
Financial Position
TOOTSIE ROLL INDUSTRIES, INC. AND SUBSIDIARIES (in thousands except per share data)
Assets
December 31,
2011
2010
CURRENT ASSETS:
Cash and cash equivalents
$78,612
$115,976
Investments
10,895
7,996
Accounts receivable trade, less allowances of $1,731 and $1,531
41,895
37,394
Other receivables
3,391
9,961
Inventories:
Finished goods and work-in-process
42,676
35,416
Raw materials and supplies
29,084
21,236
Prepaid expenses
5,070
6,499
Deferred income taxes
578
689
Total current assets
212,201
235,167
PROPERTY, PLANT AND EQUIPMENT, at cost:
Land
21,939
21,696
Buildings
107,567
102,934
Machinery and equipment
322,993
307,178
Construction in progress
2,598
9,243
455,097
440,974
Less—Accumulated depreciation
242,935
225,482
Net property, plant and equipment
212,162
215,492
OTHER ASSETS:
Goodwill
73,237
73,237
Trademarks
175,024
175,024
Investments
96,161
64,461
Split dollar officer life insurance
74,209
74,441
Prepaid expenses
3,212
6,680
Equity method investment
3,935
4,254
Deferred income taxes
7,715
9,203
Total other assets
433,493
407,300
Total assets
$857,856
$857,959
Liabilities and Shareholders’ Equity
December 31,
2011
2010
CURRENT LIABILITIES:
Accounts payable
$10,683
$9,791
Dividends payable
4,603
4,529
Accrued liabilities
43,069
44,185
Total current liabilities
58,355
58,505
NONCURRENT LIABILITES:
Deferred income taxes
43,521
47,865
Postretirement health care and life insurance benefits
26,108
20,689
Industrial development bonds
7,500
7,500
Liability for uncertain tax positions
8,345
9,835
Deferred compensation and other liabilities
48,092
46,157
Total noncurrent liabilities
133,566
132,046
SHAREHOLDERS’ EQUITY:
Common stock, $.69-4/9 par value—120,000 shares authorized—36,479 and
36,057 respectively, issued 25,333
25,040
Class B common stock, $.69-4/9 par value—40,000 shares authorized—21,025
and 20,466 respectively, issued 14,601
14,212
Capital in excess of par value
533,677
505,495
Retained earnings, per accompanying statement
114,269
135,866
Accumulated other comprehensive loss
(19,953 )
(11,213 )
Treasury stock (at cost)—71 shares and 69 shares, respectively
(1,992 )
(1,992 )
Total shareholders’ equity
665,935
667,408
Total liabilities and shareholders’ equity
$857,856
$857,959
TOOTSIE ROLL INDUSTRIES, INC. AND SUBSIDIARIES
CONSOLIDATED STATEMENTS OF
Cash Flows (in thousands)
For the year ended December 31,
2011
2010
2009
CASH FLOWS FROM OPERATING ACTIVITIES:
Net earnings
$43,938
$53,063
$53,157
Adjustments to reconcile net earnings to net cash provided by
operating activities:
Depreciation
19,229
18,279
17,862
Impairment charges
—
—
14,000
Impairment of equity method investment
—
—
4,400
Loss from equity method investment
194
342
233
Amortization of marketable security premiums
1,267
522
320
Changes in operating assets and liabilities:
Accounts receivable
(5,448 )
717
(5,899 )
Other receivables
3,963
(2,373 )
(2,088 )
Inventories
(15,631 )
(1,447 )
455
Prepaid expenses and other assets
5,106
4,936
5,203
Accounts payable and accrued liabilities
84
2,180
(2,755 )
Income taxes payable and deferred
(5,772 )
2,322
(12,543 )
Postretirement health care and life insurance benefits
2,022
1,429
1,384
Deferred compensation and other liabilities
2,146
2,525
2,960
Others
(708 )
310
305
Net cash provided by operating activities
50,390
82,805
76,994
CASH FLOWS FROM INVESTING ACTIVITIES:
Capital expenditures
(16,351 )
(12,813 )
(20,831 )
Net purchase of trading securities
(3,234 )
(2,902 )
(1,713 )
Purchase of available for sale securities
(39,252 )
(9,301 )
(11,331 )
Sale and maturity of available for sale securities
7,680
8,208
17,511
Net cash used in investing activities
(51,157 )
(16,808 )
(16,364 )
CASH FLOWS FROM FINANCING ACTIVITIES:
Shares repurchased and retired
(18,190 )
(22,881 )
(20,723 )
Dividends paid in cash
(18,407 )
(18,130 )
(17,825 )
Net cash used in financing activities
(36,597 )
(41,011 )
(38,548 )
Increase (decrease) in cash and cash equivalents
(37,364 )
24,986
22,082
Cash and cash equivalents at beginning of year
115,976
90,990
68,908
Cash and cash equivalents at end of year
$78,612
$115,976
$90,990
Supplemental cash flow information
Income taxes paid
$16,906
$20,586
$22,364
Interest paid
$38
$49
$182
Stock dividend issued
$47,053
$46,683
$32,538
(The accompanying notes are an integral part of these statements.)
Answer the following questions.
What were Tootsie Roll’s total current liabilities at December 31, 2011? (Enter amount in thousands.)
Current liabilities as at December 31, 2011 $
What was the increase/decrease in Tootsie Roll’s total current liabilities from the prior year? (Enter amount in
thousands.)
Change in current liabilities $

How much were the accounts payable at December 31, 2011? (Enter amount in thousands.)
Accounts payable $
Broadening Your Perspective 10-2
The financial statements of The Hershey Company and Tootsie Roll are presented below.
THE HERSHEY COMPANY
CONSOLIDATED STATEMENTS OF INCOME
For the years ended December 31,
2011
2010
2009
In thousands of dollars except per share amounts
Net Sales
$6,080,788
$5,671,009
$5,298,668
Costs and Expenses:
Cost of sales
3,548,896
3,255,801
3,245,531
Selling, marketing and administrative
1,477,750
1,426,477
1,208,672
Business realignment and impairment (credits) charges, net
(886 )
83,433
82,875
Total costs and expenses
5,025,760
4,765,711
4,537,078
Income before Interest and Income Taxes
1,055,028
905,298
761,590
Interest expense, net
92,183
96,434
90,459
Income before Income Taxes
962,845
808,864
671,131
Provision for income taxes
333,883
299,065
235,137
Net Income
$628,962
$509,799
$435,994
Net Income Per Share—Basic—Class B Common Stock
$2.58
$2.08
$1.77
Net Income Per Share—Diluted—Class B Common Stock
$2.56
$2.07
$1.77
Net Income Per Share—Basic—Common Stock
$2.85
$2.29
$1.97
Net Income Per Share—Diluted—Common Stock
$2.74
$2.21
$1.90
Cash Dividends Paid Per Share:
Common Stock
$1.3800
$1.2800
$1.1900
Class B Common Stock
1.2500
1.1600
1.0712
The notes to consolidated financial statements are an integral part of these statements and are included in the
Hershey's 2011 Annual Report, available at www.thehersheycompany.com.
THE HERSHEY COMPANY
CONSOLIDATED BALANCE SHEETS
December 31,
2011
2010
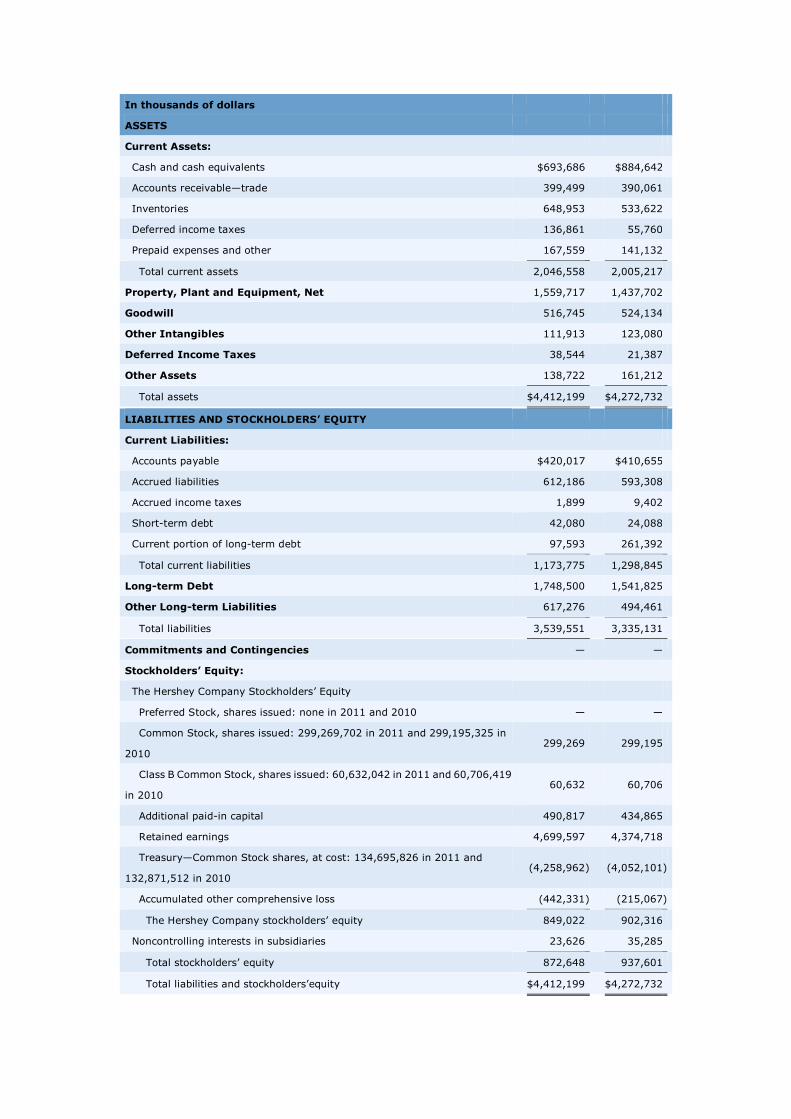
In thousands of dollars
ASSETS
Current Assets:
Cash and cash equivalents
$693,686
$884,642
Accounts receivable—trade
399,499
390,061
Inventories
648,953
533,622
Deferred income taxes
136,861
55,760
Prepaid expenses and other
167,559
141,132
Total current assets
2,046,558
2,005,217
Property, Plant and Equipment, Net
1,559,717
1,437,702
Goodwill
516,745
524,134
Other Intangibles
111,913
123,080
Deferred Income Taxes
38,544
21,387
Other Assets
138,722
161,212
Total assets
$4,412,199
$4,272,732
LIABILITIES AND STOCKHOLDERS’ EQUITY
Current Liabilities:
Accounts payable
$420,017
$410,655
Accrued liabilities
612,186
593,308
Accrued income taxes
1,899
9,402
Short-term debt
42,080
24,088
Current portion of long-term debt
97,593
261,392
Total current liabilities
1,173,775
1,298,845
Long-term Debt
1,748,500
1,541,825
Other Long-term Liabilities
617,276
494,461
Total liabilities
3,539,551
3,335,131
Commitments and Contingencies
—
—
Stockholders’ Equity:
The Hershey Company Stockholders’ Equity
Preferred Stock, shares issued: none in 2011 and 2010
—
—
Common Stock, shares issued: 299,269,702 in 2011 and 299,195,325 in
2010 299,269
299,195
Class B Common Stock, shares issued: 60,632,042 in 2011 and 60,706,419
in 2010 60,632
60,706
Additional paid-in capital
490,817
434,865
Retained earnings
4,699,597
4,374,718
Treasury—Common Stock shares, at cost: 134,695,826 in 2011 and
132,871,512 in 2010 (4,258,962 )
(4,052,101 )
Accumulated other comprehensive loss
(442,331 )
(215,067 )
The Hershey Company stockholders’ equity
849,022
902,316
Noncontrolling interests in subsidiaries
23,626
35,285
Total stockholders’ equity
872,648
937,601
Total liabilities and stockholders’equity
$4,412,199
$4,272,732
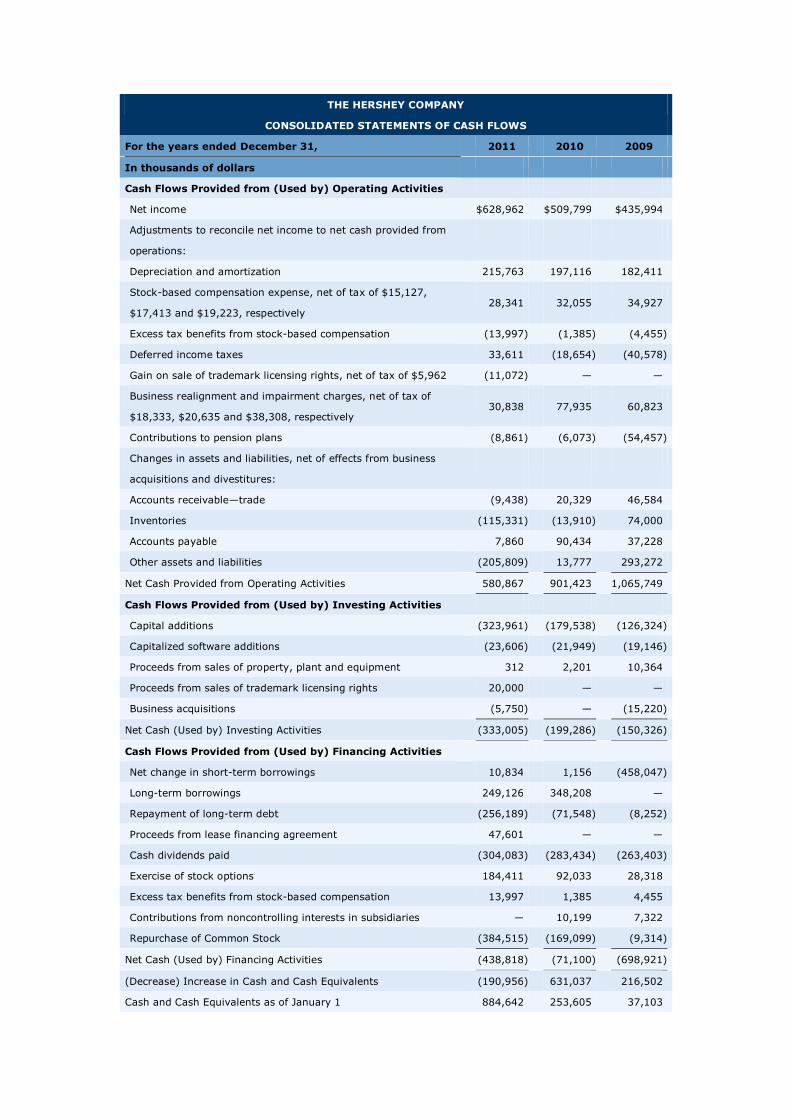
THE HERSHEY COMPANY
CONSOLIDATED STATEMENTS OF CASH FLOWS
For the years ended December 31,
2011
2010
2009
In thousands of dollars
Cash Flows Provided from (Used by) Operating Activities
Net income
$628,962
$509,799
$435,994
Adjustments to reconcile net income to net cash provided from
operations:
Depreciation and amortization
215,763
197,116
182,411
Stock-based compensation expense, net of tax of $15,127,
$17,413 and $19,223, respectively 28,341
32,055
34,927
Excess tax benefits from stock-based compensation
(13,997 )
(1,385 )
(4,455 )
Deferred income taxes
33,611
(18,654 )
(40,578 )
Gain on sale of trademark licensing rights, net of tax of $5,962
(11,072 )
—
—
Business realignment and impairment charges, net of tax of
$18,333, $20,635 and $38,308, respectively 30,838
77,935
60,823
Contributions to pension plans
(8,861 )
(6,073 )
(54,457 )
Changes in assets and liabilities, net of effects from business
acquisitions and divestitures:
Accounts receivable—trade
(9,438 )
20,329
46,584
Inventories
(115,331 )
(13,910 )
74,000
Accounts payable
7,860
90,434
37,228
Other assets and liabilities
(205,809 )
13,777
293,272
Net Cash Provided from Operating Activities
580,867
901,423
1,065,749
Cash Flows Provided from (Used by) Investing Activities
Capital additions
(323,961 )
(179,538 )
(126,324 )
Capitalized software additions
(23,606 )
(21,949 )
(19,146 )
Proceeds from sales of property, plant and equipment
312
2,201
10,364
Proceeds from sales of trademark licensing rights
20,000
—
—
Business acquisitions
(5,750 )
—
(15,220 )
Net Cash (Used by) Investing Activities
(333,005 )
(199,286 )
(150,326 )
Cash Flows Provided from (Used by) Financing Activities
Net change in short-term borrowings
10,834
1,156
(458,047 )
Long-term borrowings
249,126
348,208
—
Repayment of long-term debt
(256,189 )
(71,548 )
(8,252 )
Proceeds from lease financing agreement
47,601
—
—
Cash dividends paid
(304,083 )
(283,434 )
(263,403 )
Exercise of stock options
184,411
92,033
28,318
Excess tax benefits from stock-based compensation
13,997
1,385
4,455
Contributions from noncontrolling interests in subsidiaries
—
10,199
7,322
Repurchase of Common Stock
(384,515 )
(169,099 )
(9,314 )
Net Cash (Used by) Financing Activities
(438,818 )
(71,100 )
(698,921 )
(Decrease) Increase in Cash and Cash Equivalents
(190,956 )
631,037
216,502
Cash and Cash Equivalents as of January 1
884,642
253,605
37,103
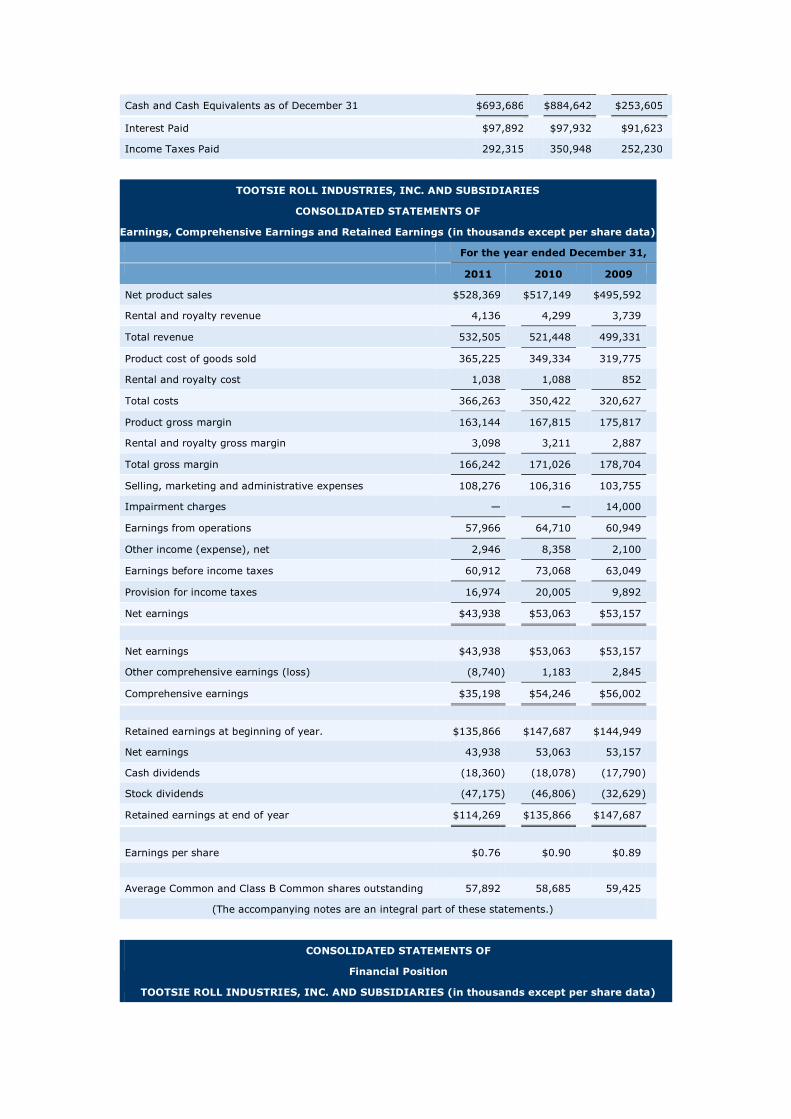
Cash and Cash Equivalents as of December 31
$693,686
$884,642
$253,605
Interest Paid
$97,892
$97,932
$91,623
Income Taxes Paid
292,315
350,948
252,230
TOOTSIE ROLL INDUSTRIES, INC. AND SUBSIDIARIES
CONSOLIDATED STATEMENTS OF
Earnings, Comprehensive Earnings and Retained Earnings (in thousands except per share data)
For the year ended December 31,
2011
2010
2009
Net product sales
$528,369
$517,149
$495,592
Rental and royalty revenue
4,136
4,299
3,739
Total revenue
532,505
521,448
499,331
Product cost of goods sold
365,225
349,334
319,775
Rental and royalty cost
1,038
1,088
852
Total costs
366,263
350,422
320,627
Product gross margin
163,144
167,815
175,817
Rental and royalty gross margin
3,098
3,211
2,887
Total gross margin
166,242
171,026
178,704
Selling, marketing and administrative expenses
108,276
106,316
103,755
Impairment charges
—
—
14,000
Earnings from operations
57,966
64,710
60,949
Other income (expense), net
2,946
8,358
2,100
Earnings before income taxes
60,912
73,068
63,049
Provision for income taxes
16,974
20,005
9,892
Net earnings
$43,938
$53,063
$53,157
Net earnings
$43,938
$53,063
$53,157
Other comprehensive earnings (loss)
(8,740 )
1,183
2,845
Comprehensive earnings
$35,198
$54,246
$56,002
Retained earnings at beginning of year.
$135,866
$147,687
$144,949
Net earnings
43,938
53,063
53,157
Cash dividends
(18,360 )
(18,078 )
(17,790 )
Stock dividends
(47,175 )
(46,806 )
(32,629 )
Retained earnings at end of year
$114,269
$135,866
$147,687
Earnings per share
$0.76
$0.90
$0.89
Average Common and Class B Common shares outstanding
57,892
58,685
59,425
(The accompanying notes are an integral part of these statements.)
CONSOLIDATED STATEMENTS OF
Financial Position
TOOTSIE ROLL INDUSTRIES, INC. AND SUBSIDIARIES (in thousands except per share data)
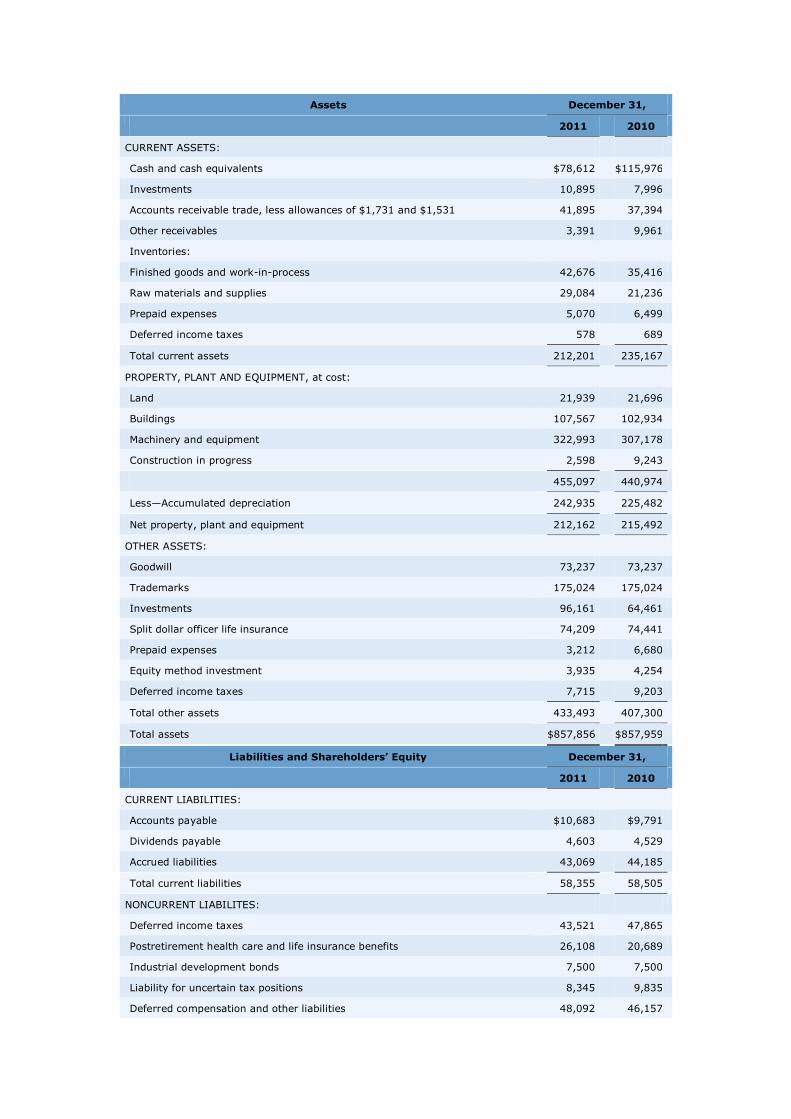
Assets
December 31,
2011
2010
CURRENT ASSETS:
Cash and cash equivalents
$78,612
$115,976
Investments
10,895
7,996
Accounts receivable trade, less allowances of $1,731 and $1,531
41,895
37,394
Other receivables
3,391
9,961
Inventories:
Finished goods and work-in-process
42,676
35,416
Raw materials and supplies
29,084
21,236
Prepaid expenses
5,070
6,499
Deferred income taxes
578
689
Total current assets
212,201
235,167
PROPERTY, PLANT AND EQUIPMENT, at cost:
Land
21,939
21,696
Buildings
107,567
102,934
Machinery and equipment
322,993
307,178
Construction in progress
2,598
9,243
455,097
440,974
Less—Accumulated depreciation
242,935
225,482
Net property, plant and equipment
212,162
215,492
OTHER ASSETS:
Goodwill
73,237
73,237
Trademarks
175,024
175,024
Investments
96,161
64,461
Split dollar officer life insurance
74,209
74,441
Prepaid expenses
3,212
6,680
Equity method investment
3,935
4,254
Deferred income taxes
7,715
9,203
Total other assets
433,493
407,300
Total assets
$857,856
$857,959
Liabilities and Shareholders’ Equity
December 31,
2011
2010
CURRENT LIABILITIES:
Accounts payable
$10,683
$9,791
Dividends payable
4,603
4,529
Accrued liabilities
43,069
44,185
Total current liabilities
58,355
58,505
NONCURRENT LIABILITES:
Deferred income taxes
43,521
47,865
Postretirement health care and life insurance benefits
26,108
20,689
Industrial development bonds
7,500
7,500
Liability for uncertain tax positions
8,345
9,835
Deferred compensation and other liabilities
48,092
46,157
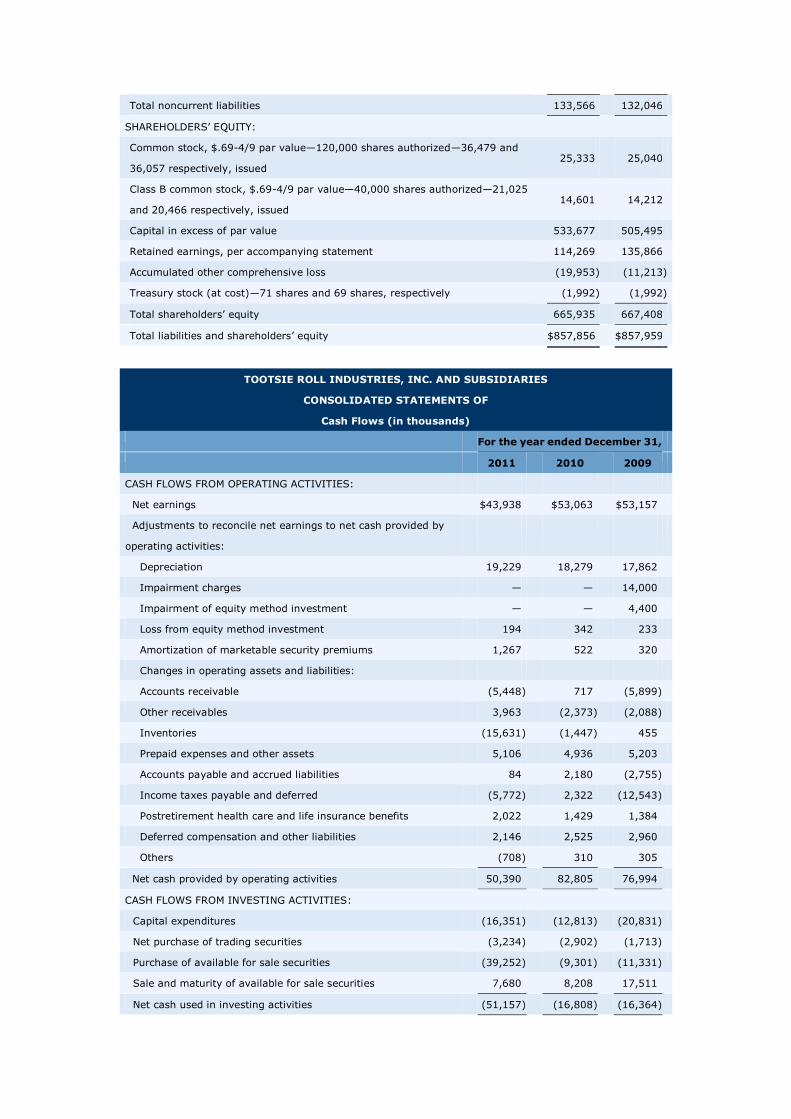
Total noncurrent liabilities
133,566
132,046
SHAREHOLDERS’ EQUITY:
Common stock, $.69-4/9 par value—120,000 shares authorized—36,479 and
36,057 respectively, issued 25,333
25,040
Class B common stock, $.69-4/9 par value—40,000 shares authorized—21,025
and 20,466 respectively, issued 14,601
14,212
Capital in excess of par value
533,677
505,495
Retained earnings, per accompanying statement
114,269
135,866
Accumulated other comprehensive loss
(19,953 )
(11,213 )
Treasury stock (at cost)—71 shares and 69 shares, respectively
(1,992 )
(1,992 )
Total shareholders’ equity
665,935
667,408
Total liabilities and shareholders’ equity
$857,856
$857,959
TOOTSIE ROLL INDUSTRIES, INC. AND SUBSIDIARIES
CONSOLIDATED STATEMENTS OF
Cash Flows (in thousands)
For the year ended December 31,
2011
2010
2009
CASH FLOWS FROM OPERATING ACTIVITIES:
Net earnings
$43,938
$53,063
$53,157
Adjustments to reconcile net earnings to net cash provided by
operating activities:
Depreciation
19,229
18,279
17,862
Impairment charges
—
—
14,000
Impairment of equity method investment
—
—
4,400
Loss from equity method investment
194
342
233
Amortization of marketable security premiums
1,267
522
320
Changes in operating assets and liabilities:
Accounts receivable
(5,448 )
717
(5,899 )
Other receivables
3,963
(2,373 )
(2,088 )
Inventories
(15,631 )
(1,447 )
455
Prepaid expenses and other assets
5,106
4,936
5,203
Accounts payable and accrued liabilities
84
2,180
(2,755 )
Income taxes payable and deferred
(5,772 )
2,322
(12,543 )
Postretirement health care and life insurance benefits
2,022
1,429
1,384
Deferred compensation and other liabilities
2,146
2,525
2,960
Others
(708 )
310
305
Net cash provided by operating activities
50,390
82,805
76,994
CASH FLOWS FROM INVESTING ACTIVITIES:
Capital expenditures
(16,351 )
(12,813 )
(20,831 )
Net purchase of trading securities
(3,234 )
(2,902 )
(1,713 )
Purchase of available for sale securities
(39,252 )
(9,301 )
(11,331 )
Sale and maturity of available for sale securities
7,680
8,208
17,511
Net cash used in investing activities
(51,157 )
(16,808 )
(16,364 )
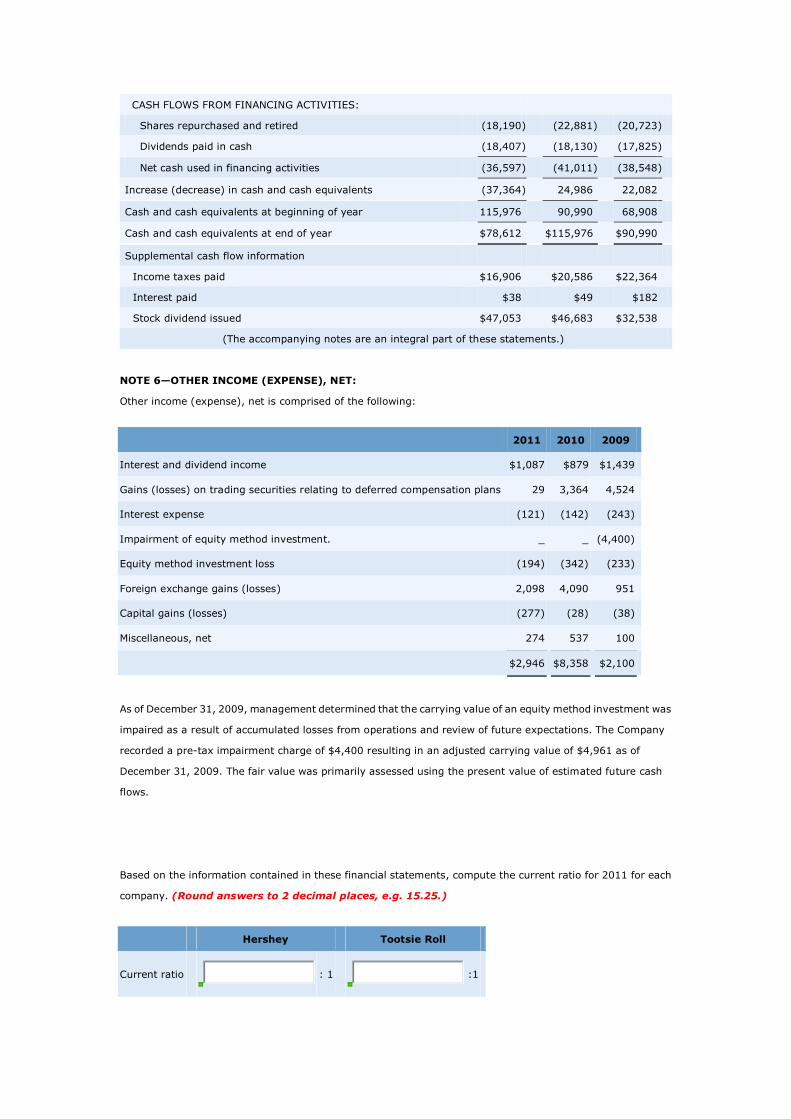
CASH FLOWS FROM FINANCING ACTIVITIES:
Shares repurchased and retired
(18,190 )
(22,881 )
(20,723 )
Dividends paid in cash
(18,407 )
(18,130 )
(17,825 )
Net cash used in financing activities
(36,597 )
(41,011 )
(38,548 )
Increase (decrease) in cash and cash equivalents
(37,364 )
24,986
22,082
Cash and cash equivalents at beginning of year
115,976
90,990
68,908
Cash and cash equivalents at end of year
$78,612
$115,976
$90,990
Supplemental cash flow information
Income taxes paid
$16,906
$20,586
$22,364
Interest paid
$38
$49
$182
Stock dividend issued
$47,053
$46,683
$32,538
(The accompanying notes are an integral part of these statements.)
NOTE 6—OTHER INCOME (EXPENSE), NET:
Other income (expense), net is comprised of the following:
2011
2010
2009
Interest and dividend income $1,087
$879
$1,439
Gains (losses) on trading securities relating to deferred compensation plans
29
3,364
4,524
Interest expense
(121)
(142)
(243)
Impairment of equity method investment.
_
_ (4,400)
Equity method investment loss
(194)
(342)
(233)
Foreign exchange gains (losses)
2,098
4,090
951
Capital gains (losses)
(277)
(28)
(38)
Miscellaneous, net
274
537
100
$2,946
$8,358
$2,100
As of December 31, 2009, management determined that the carrying value of an equity method investment was
impaired as a result of accumulated losses from operations and review of future expectations. The Company
recorded a pre-tax impairment charge of $4,400 resulting in an adjusted carrying value of $4,961 as of
December 31, 2009. The fair value was primarily assessed using the present value of estimated future cash
flows.
Based on the information contained in these financial statements, compute the current ratio for 2011 for each
company. (Round answers to 2 decimal places, e.g. 15.25.)
Hershey
Tootsie Roll
Current ratio
: 1
:1
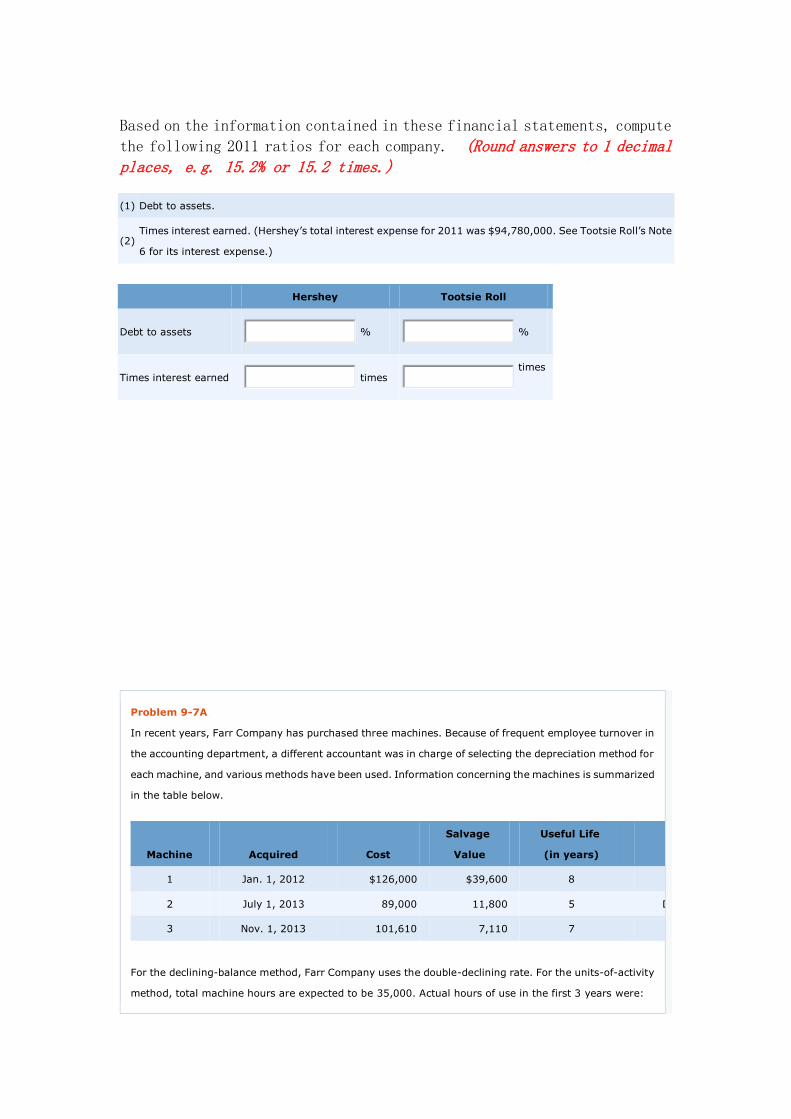
Based on the information contained in these financial statements, compute
the following 2011 ratios for each company. (Round answers to 1 decimal places, e.g. 15.2% or 15.2 times.)
(1) Debt to assets.
(2) Times interest earned. (Hershey’s total interest expense for 2011 was $94,780,000. See Tootsie Roll’s Note
6 for its interest expense.)
Hershey
Tootsie Roll
Debt to assets
%
%
Times interest earned
times
times
Problem 9-7A
In recent years, Farr Company has purchased three machines. Because of frequent employee turnover in
the accounting department, a different accountant was in charge of selecting the depreciation method for
each machine, and various methods have been used. Information concerning the machines is summarized
in the table below.
Machine
Acquired
Cost
Salvage
Value
Useful Life
(in years)
Depreciation
Method
1
Jan. 1, 2012
$126,000
$39,600
8
Straight-line
2
July 1, 2013
89,000
11,800
5
Declining-balance
3
Nov. 1, 2013
101,610
7,110
7
Units-of-activity
For the declining-balance method, Farr Company uses the double-declining rate. For the units-of-activity
method, total machine hours are expected to be 35,000. Actual hours of use in the first 3 years were:
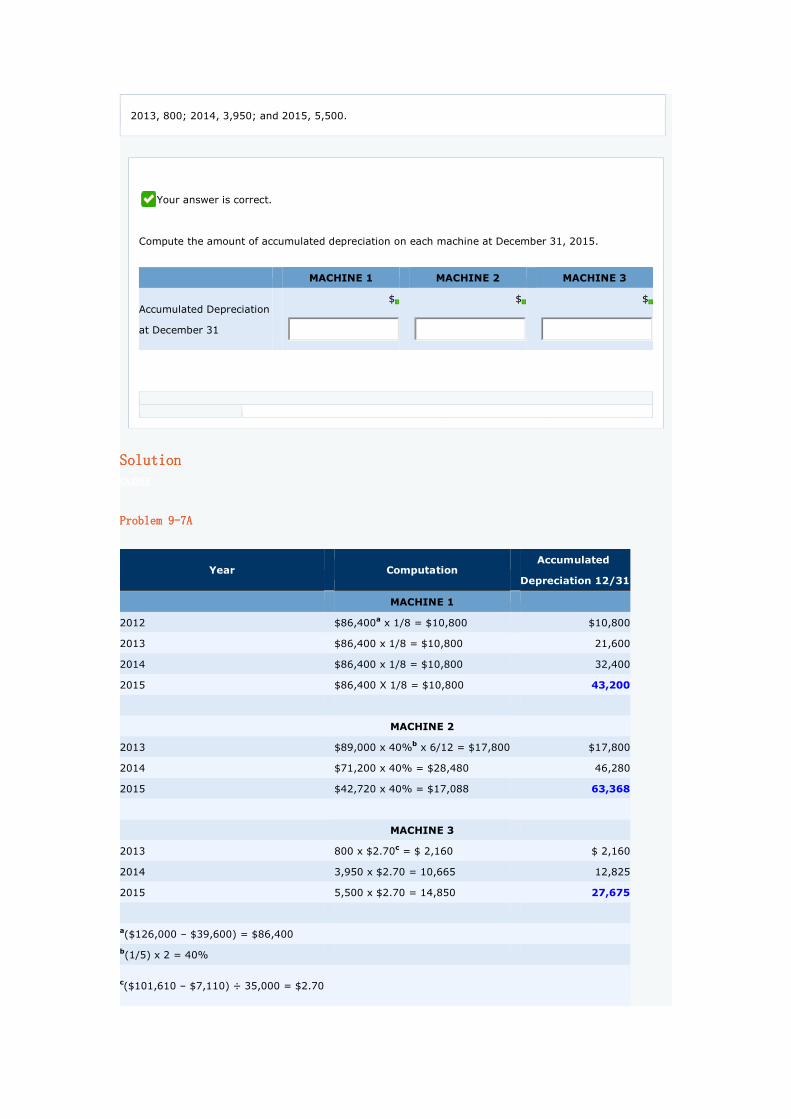
2013, 800; 2014, 3,950; and 2015, 5,500.
Your answer is correct.
Compute the amount of accumulated depreciation on each machine at December 31, 2015.
MACHINE 1
MACHINE 2
MACHINE 3
Accumulated Depreciation
at December 31
$
$
$
Solution CLOSE
Problem 9-7A
Year
Computation
Accumulated
Depreciation 12/31
MACHINE 1
2012
$86,400a x 1/8 = $10,800
$10,800
2013
$86,400 x 1/8 = $10,800
21,600
2014
$86,400 x 1/8 = $10,800
32,400
2015
$86,400 X 1/8 = $10,800
43,200
MACHINE 2
2013
$89,000 x 40%b x 6/12 = $17,800
$17,800
2014
$71,200 x 40% = $28,480
46,280
2015
$42,720 x 40% = $17,088
63,368
MACHINE 3
2013
800 x $2.70c = $ 2,160
$ 2,160
2014
3,950 x $2.70 = 10,665
12,825
2015
5,500 x $2.70 = 14,850
27,675
a($126,000 – $39,600) = $86,400
b(1/5) x 2 = 40%
c($101,610 – $7,110) ÷ 35,000 = $2.70
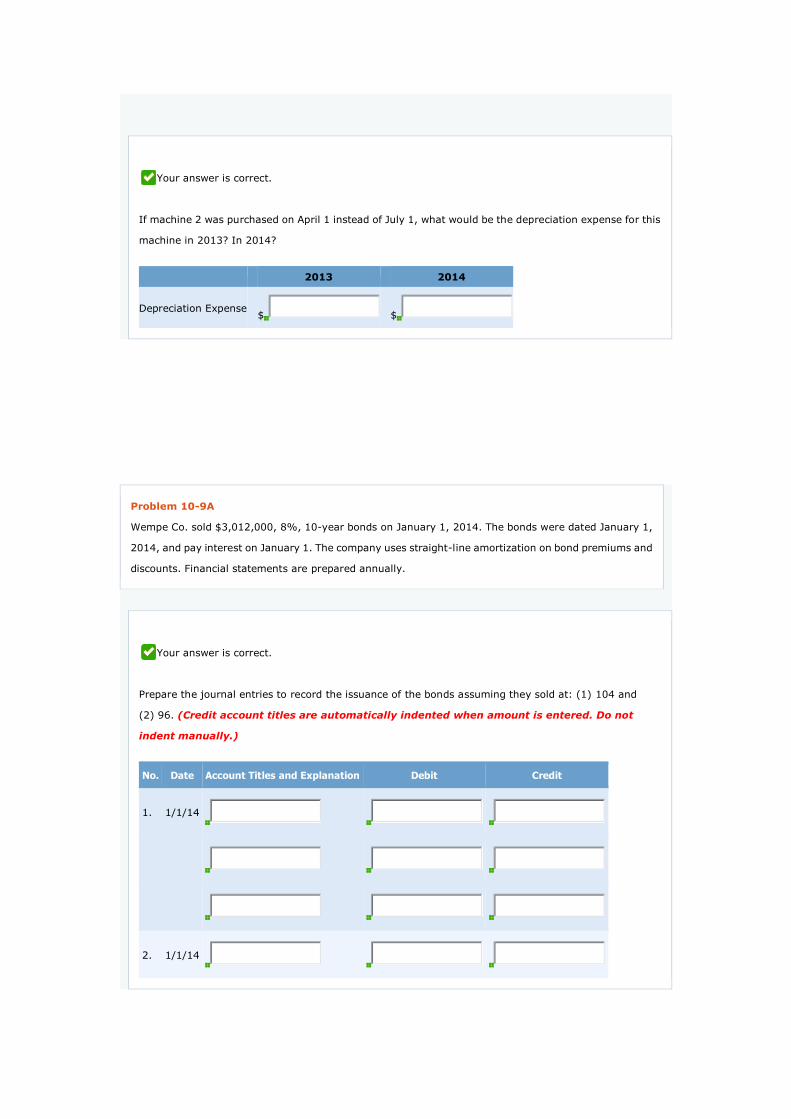
Your answer is correct.
If machine 2 was purchased on April 1 instead of July 1, what would be the depreciation expense for this
machine in 2013? In 2014?
2013
2014
Depreciation Expense $ $
Problem 10-9A
Wempe Co. sold $3,012,000, 8%, 10-year bonds on January 1, 2014. The bonds were dated January 1,
2014, and pay interest on January 1. The company uses straight-line amortization on bond premiums and
discounts. Financial statements are prepared annually.
Your answer is correct.
Prepare the journal entries to record the issuance of the bonds assuming they sold at: (1) 104 and
(2) 96. (Credit account titles are automatically indented when amount is entered. Do not
indent manually.)
No. Date Account Titles and Explanation Debit Credit
1. 1/1/14
2. 1/1/14
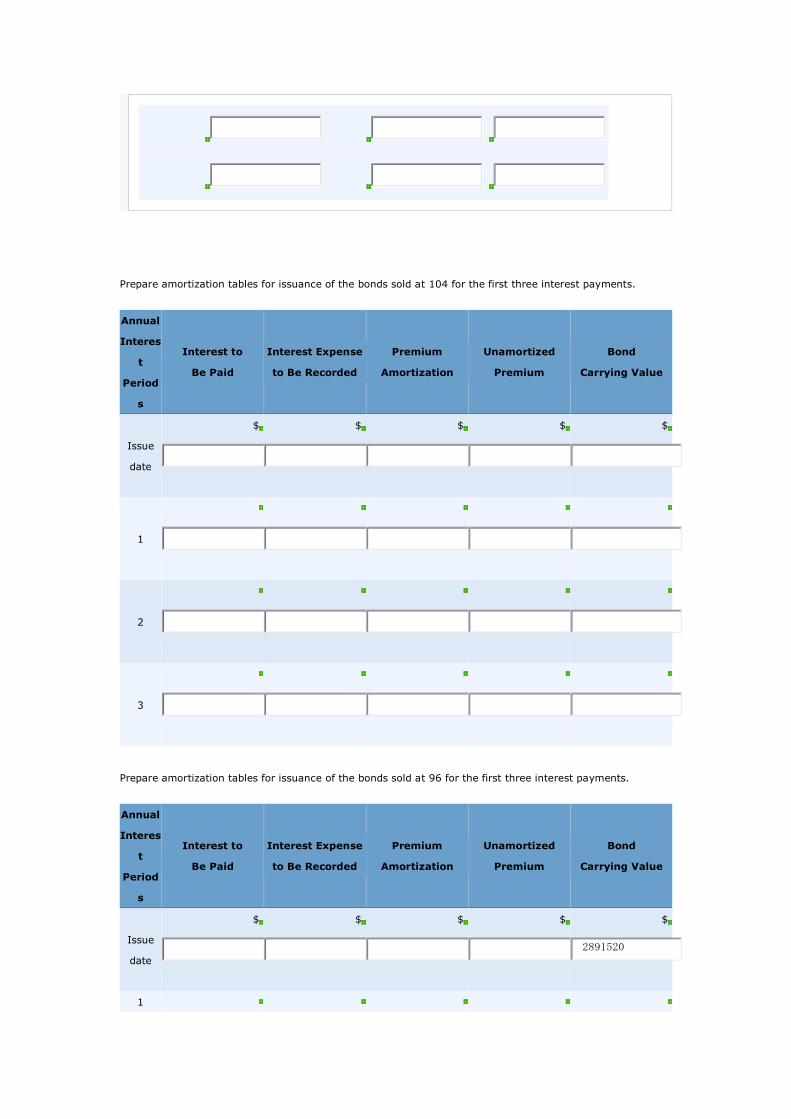
Prepare amortization tables for issuance of the bonds sold at 104 for the first three interest payments.
Annual
Interes
t
Period
s
Interest to
Be Paid
Interest Expense
to Be Recorded
Premium
Amortization
Unamortized
Premium
Bond
Carrying Value
Issue
date
$
$
$
$
$
1
2
3
Prepare amortization tables for issuance of the bonds sold at 96 for the first three interest payments.
Annual
Interes
t
Period
s
Interest to
Be Paid
Interest Expense
to Be Recorded
Premium
Amortization
Unamortized
Premium
Bond
Carrying Value
Issue
date
$
$
$
$
$
2891520
1
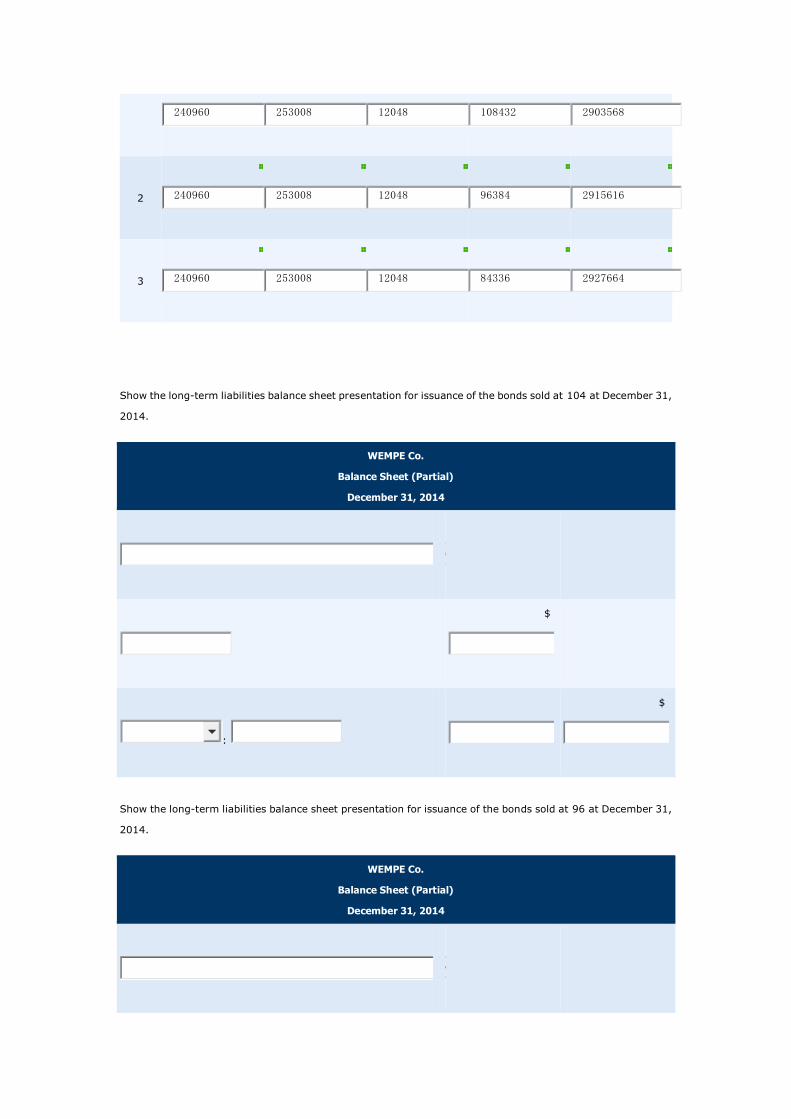
240960
253008
12048
108432
2903568
2
240960
253008
12048
96384
2915616
3
240960
253008
12048
84336
2927664
Show the long-term liabilities balance sheet presentation for issuance of the bonds sold at 104 at December 31,
2014.
WEMPE Co.
Balance Sheet (Partial)
December 31, 2014
$
:
$
Show the long-term liabilities balance sheet presentation for issuance of the bonds sold at 96 at December 31,
2014.
WEMPE Co.
Balance Sheet (Partial)
December 31, 2014
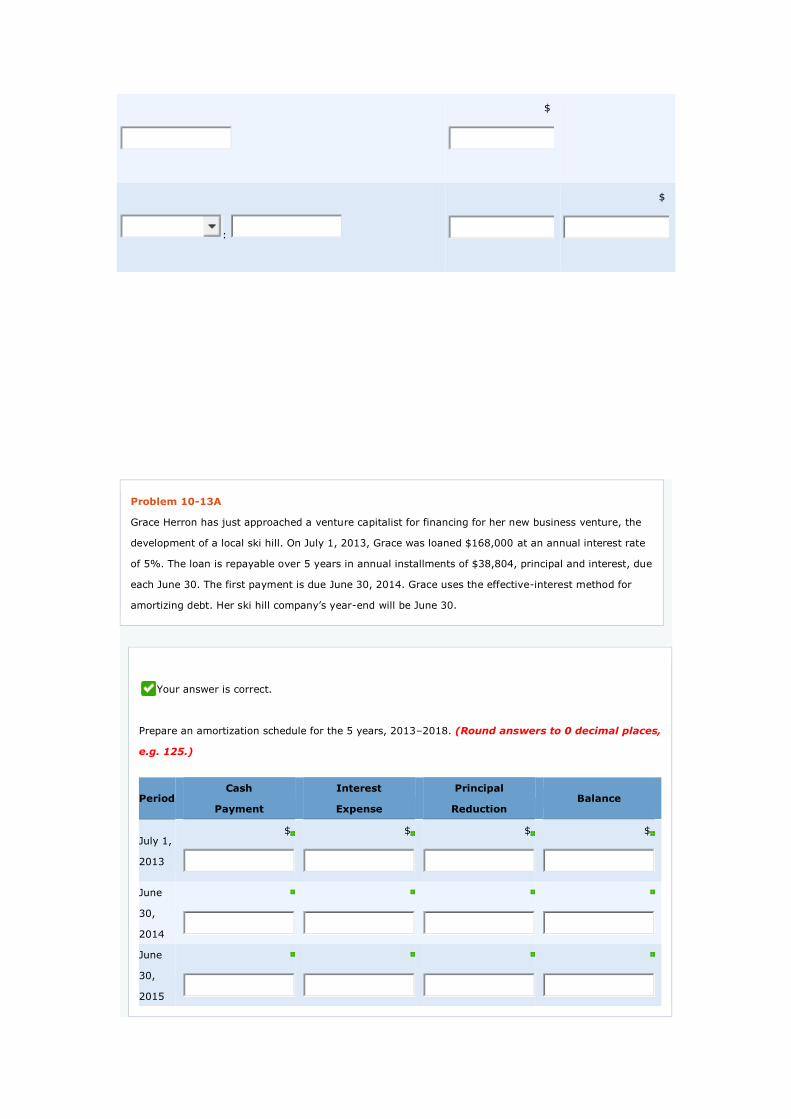
$
:
$
Problem 10-13A
Grace Herron has just approached a venture capitalist for financing for her new business venture, the
development of a local ski hill. On July 1, 2013, Grace was loaned $168,000 at an annual interest rate
of 5%. The loan is repayable over 5 years in annual installments of $38,804, principal and interest, due
each June 30. The first payment is due June 30, 2014. Grace uses the effective-interest method for
amortizing debt. Her ski hill company’s year-end will be June 30.
Your answer is correct.
Prepare an amortization schedule for the 5 years, 2013–2018. (Round answers to 0 decimal places,
e.g. 125.)
Period
Cash
Payment
Interest
Expense
Principal
Reduction Balance
July 1,
2013
$
$
$
$
June
30,
2014
June
30,
2015
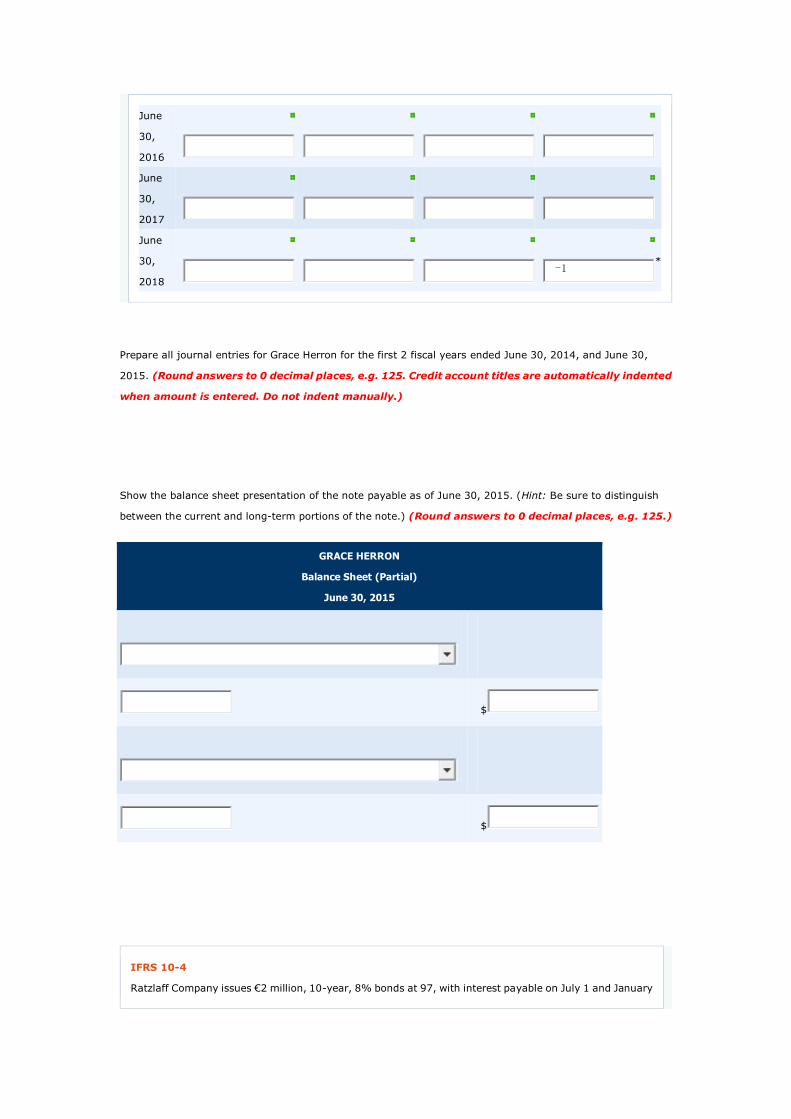
June
30,
2016
June
30,
2017
June
30,
2018
-1
*
Prepare all journal entries for Grace Herron for the first 2 fiscal years ended June 30, 2014, and June 30,
2015. (Round answers to 0 decimal places, e.g. 125. Credit account titles are automatically indented
when amount is entered. Do not indent manually.)
Show the balance sheet presentation of the note payable as of June 30, 2015. (Hint: Be sure to distinguish
between the current and long-term portions of the note.) (Round answers to 0 decimal places, e.g. 125.)
GRACE HERRON
Balance Sheet (Partial)
June 30, 2015
$
$
IFRS 10-4
Ratzlaff Company issues €2 million, 10-year, 8% bonds at 97, with interest payable on July 1 and January
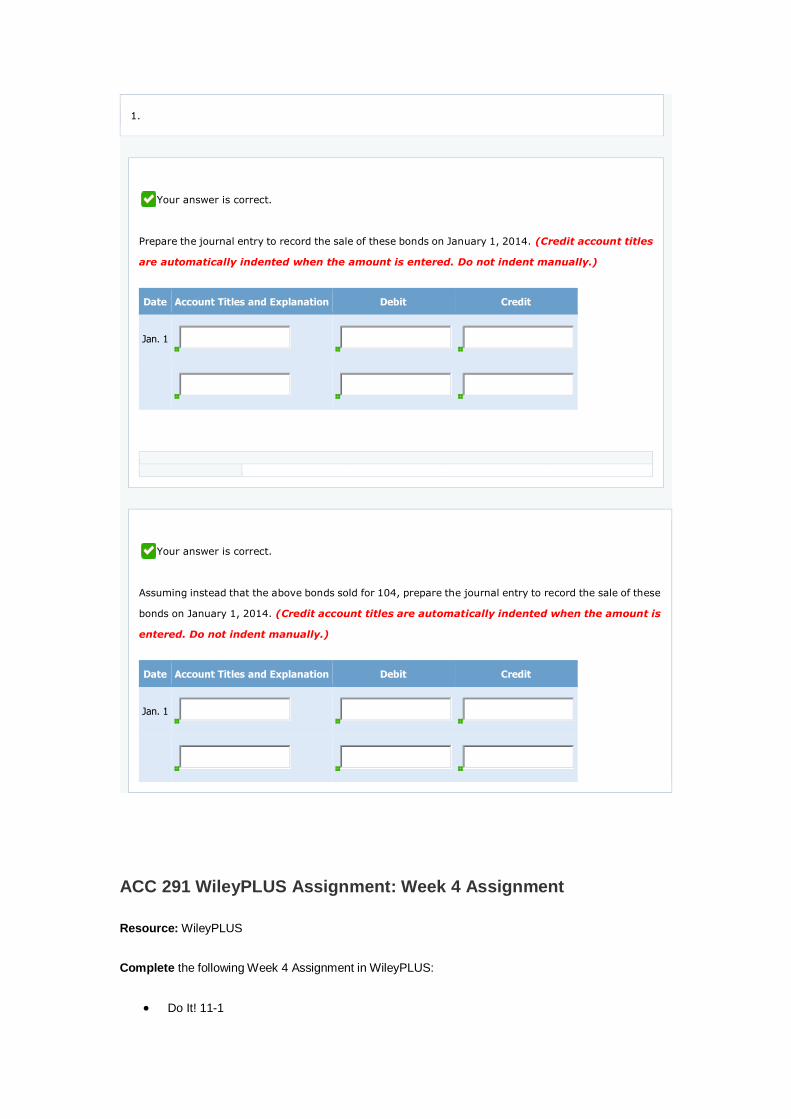
1.
Your answer is correct.
Prepare the journal entry to record the sale of these bonds on January 1, 2014. (Credit account titles
are automatically indented when the amount is entered. Do not indent manually.)
Date Account Titles and Explanation Debit Credit
Jan. 1
Your answer is correct.
Assuming instead that the above bonds sold for 104, prepare the journal entry to record the sale of these
bonds on January 1, 2014. (Credit account titles are automatically indented when the amount is
entered. Do not indent manually.)
Date Account Titles and Explanation Debit Credit
Jan. 1
ACC 291 WileyPLUS Assignment: Week 4 Assignment
Resource: WileyPLUS
Complete the following Week 4 Assignment in WileyPLUS:
Do It! 11-1
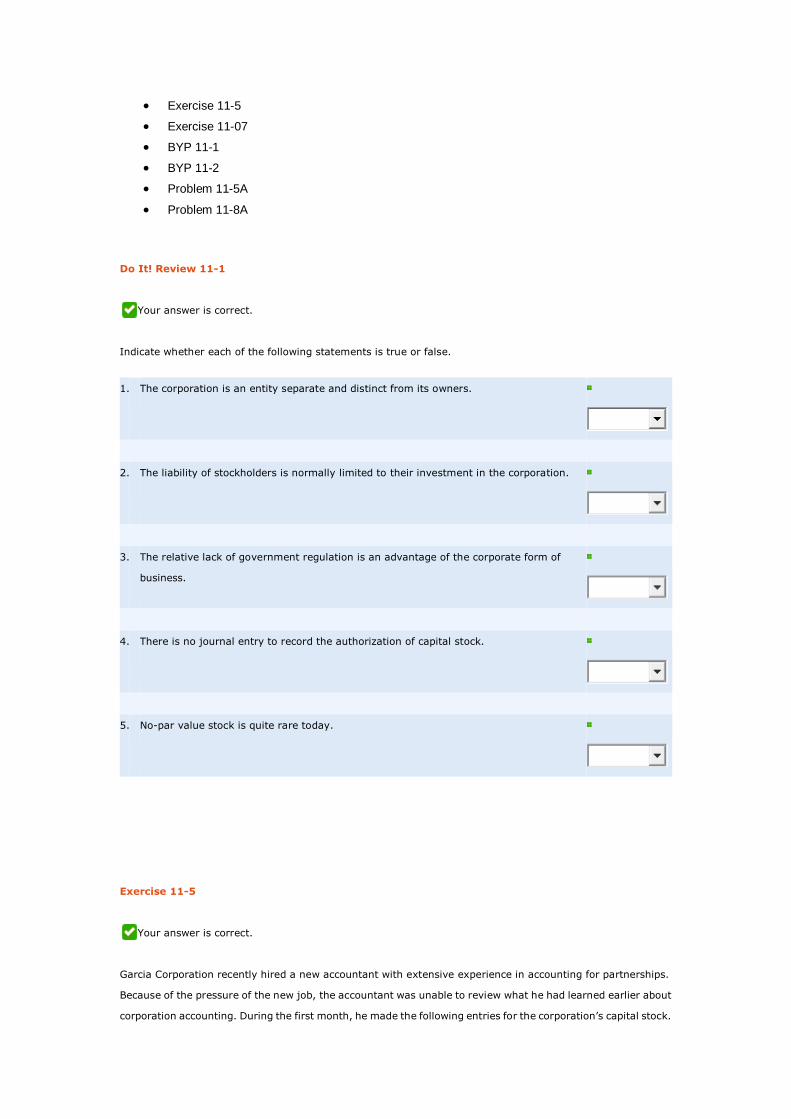
Exercise 11-5
Exercise 11-07
BYP 11-1
BYP 11-2
Problem 11-5A
Problem 11-8A
Do It! Review 11-1
Your answer is correct.
Indicate whether each of the following statements is true or false.
1.
The corporation is an entity separate and distinct from its owners.
2.
The liability of stockholders is normally limited to their investment in the corporation.
3.
The relative lack of government regulation is an advantage of the corporate form of
business.
4.
There is no journal entry to record the authorization of capital stock.
5.
No-par value stock is quite rare today.
Exercise 11-5
Your answer is correct.
Garcia Corporation recently hired a new accountant with extensive experience in accounting for partnerships.
Because of the pressure of the new job, the accountant was unable to review what he had learned earlier about
corporation accounting. During the first month, he made the following entries for the corporation’s capital stock.
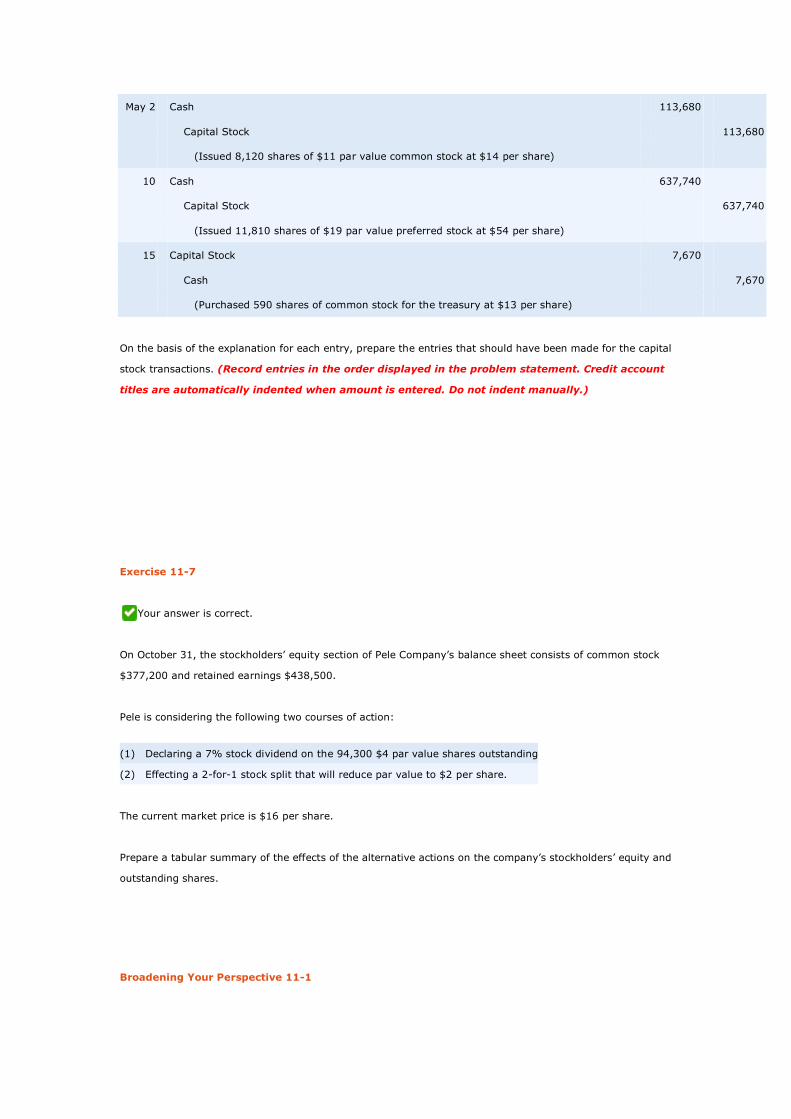
May 2
Cash
113,680
Capital Stock
113,680
(Issued 8,120 shares of $11 par value common stock at $14 per share)
10
Cash
637,740
Capital Stock
637,740
(Issued 11,810 shares of $19 par value preferred stock at $54 per share)
15
Capital Stock
7,670
Cash
7,670
(Purchased 590 shares of common stock for the treasury at $13 per share)
On the basis of the explanation for each entry, prepare the entries that should have been made for the capital
stock transactions. (Record entries in the order displayed in the problem statement. Credit account
titles are automatically indented when amount is entered. Do not indent manually.)
CLOSE
Exercise 11-7
Your answer is correct.
On October 31, the stockholders’ equity section of Pele Company’s balance sheet consists of common stock
$377,200 and retained earnings $438,500.
Pele is considering the following two courses of action:
(1)
Declaring a 7% stock dividend on the 94,300 $4 par value shares outstanding
(2)
Effecting a 2-for-1 stock split that will reduce par value to $2 per share.
The current market price is $16 per share.
Prepare a tabular summary of the effects of the alternative actions on the company’s stockholders’ equity and
outstanding shares.
Broadening Your Perspective 11-1
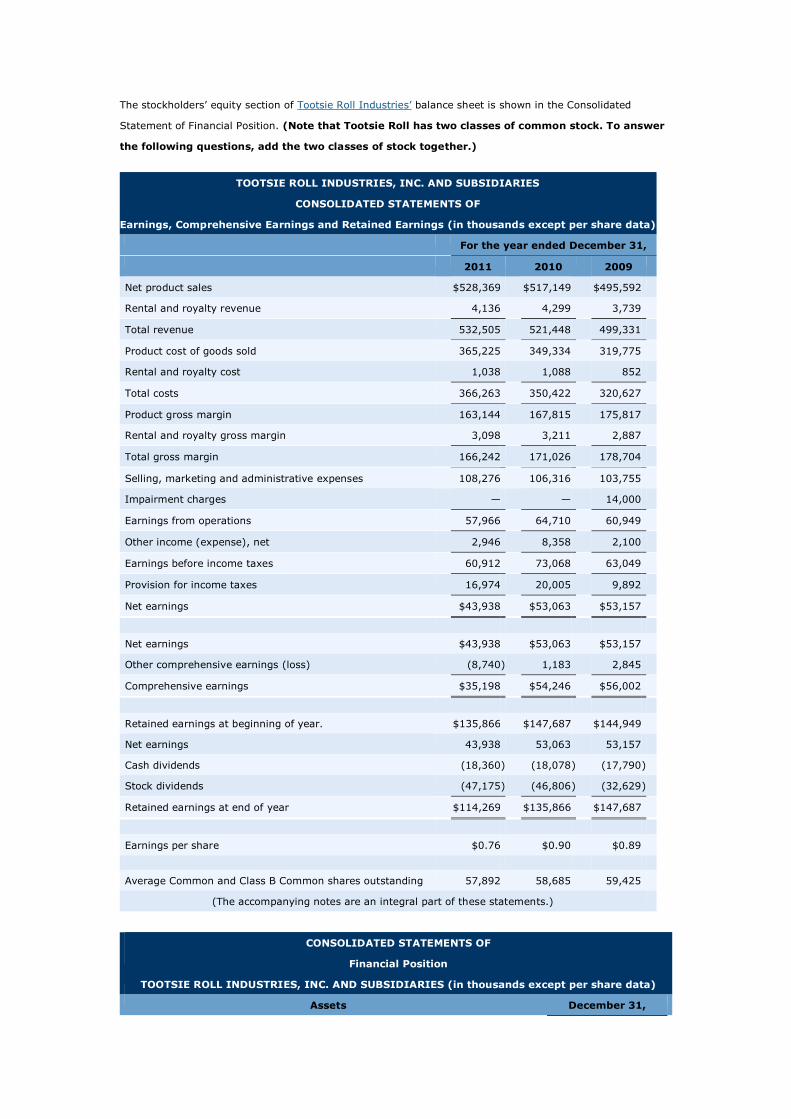
The stockholders’ equity section of Tootsie Roll Industries’ balance sheet is shown in the Consolidated
Statement of Financial Position. (Note that Tootsie Roll has two classes of common stock. To answer
the following questions, add the two classes of stock together.)
TOOTSIE ROLL INDUSTRIES, INC. AND SUBSIDIARIES
CONSOLIDATED STATEMENTS OF
Earnings, Comprehensive Earnings and Retained Earnings (in thousands except per share data)
For the year ended December 31,
2011
2010
2009
Net product sales
$528,369
$517,149
$495,592
Rental and royalty revenue
4,136
4,299
3,739
Total revenue
532,505
521,448
499,331
Product cost of goods sold
365,225
349,334
319,775
Rental and royalty cost
1,038
1,088
852
Total costs
366,263
350,422
320,627
Product gross margin
163,144
167,815
175,817
Rental and royalty gross margin
3,098
3,211
2,887
Total gross margin
166,242
171,026
178,704
Selling, marketing and administrative expenses
108,276
106,316
103,755
Impairment charges
—
—
14,000
Earnings from operations
57,966
64,710
60,949
Other income (expense), net
2,946
8,358
2,100
Earnings before income taxes
60,912
73,068
63,049
Provision for income taxes
16,974
20,005
9,892
Net earnings
$43,938
$53,063
$53,157
Net earnings
$43,938
$53,063
$53,157
Other comprehensive earnings (loss)
(8,740 )
1,183
2,845
Comprehensive earnings
$35,198
$54,246
$56,002
Retained earnings at beginning of year.
$135,866
$147,687
$144,949
Net earnings
43,938
53,063
53,157
Cash dividends
(18,360 )
(18,078 )
(17,790 )
Stock dividends
(47,175 )
(46,806 )
(32,629 )
Retained earnings at end of year
$114,269
$135,866
$147,687
Earnings per share
$0.76
$0.90
$0.89
Average Common and Class B Common shares outstanding
57,892
58,685
59,425
(The accompanying notes are an integral part of these statements.)
CONSOLIDATED STATEMENTS OF
Financial Position
TOOTSIE ROLL INDUSTRIES, INC. AND SUBSIDIARIES (in thousands except per share data)
Assets
December 31,
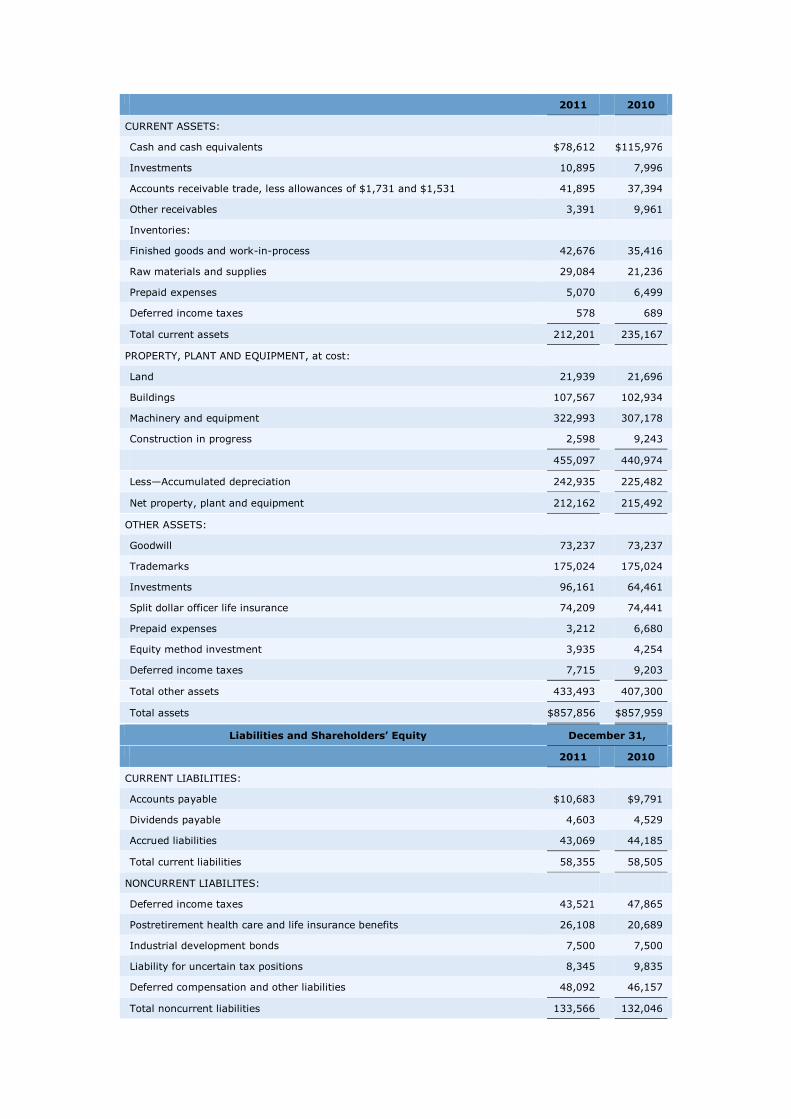
2011
2010
CURRENT ASSETS:
Cash and cash equivalents
$78,612
$115,976
Investments
10,895
7,996
Accounts receivable trade, less allowances of $1,731 and $1,531
41,895
37,394
Other receivables
3,391
9,961
Inventories:
Finished goods and work-in-process
42,676
35,416
Raw materials and supplies
29,084
21,236
Prepaid expenses
5,070
6,499
Deferred income taxes
578
689
Total current assets
212,201
235,167
PROPERTY, PLANT AND EQUIPMENT, at cost:
Land
21,939
21,696
Buildings
107,567
102,934
Machinery and equipment
322,993
307,178
Construction in progress
2,598
9,243
455,097
440,974
Less—Accumulated depreciation
242,935
225,482
Net property, plant and equipment
212,162
215,492
OTHER ASSETS:
Goodwill
73,237
73,237
Trademarks
175,024
175,024
Investments
96,161
64,461
Split dollar officer life insurance
74,209
74,441
Prepaid expenses
3,212
6,680
Equity method investment
3,935
4,254
Deferred income taxes
7,715
9,203
Total other assets
433,493
407,300
Total assets
$857,856
$857,959
Liabilities and Shareholders’ Equity
December 31,
2011
2010
CURRENT LIABILITIES:
Accounts payable
$10,683
$9,791
Dividends payable
4,603
4,529
Accrued liabilities
43,069
44,185
Total current liabilities
58,355
58,505
NONCURRENT LIABILITES:
Deferred income taxes
43,521
47,865
Postretirement health care and life insurance benefits
26,108
20,689
Industrial development bonds
7,500
7,500
Liability for uncertain tax positions
8,345
9,835
Deferred compensation and other liabilities
48,092
46,157
Total noncurrent liabilities
133,566
132,046

SHAREHOLDERS’ EQUITY:
Common stock, $.69-4/9 par value—120,000 shares authorized—36,479 and
36,057 respectively, issued 25,333
25,040
Class B common stock, $.69-4/9 par value—40,000 shares authorized—21,025
and 20,466 respectively, issued 14,601
14,212
Capital in excess of par value
533,677
505,495
Retained earnings, per accompanying statement
114,269
135,866
Accumulated other comprehensive loss
(19,953 )
(11,213 )
Treasury stock (at cost)—71 shares and 69 shares, respectively
(1,992 )
(1,992 )
Total shareholders’ equity
665,935
667,408
Total liabilities and shareholders’ equity
$857,856
$857,959
TOOTSIE ROLL INDUSTRIES, INC. AND SUBSIDIARIES
CONSOLIDATED STATEMENTS OF
Cash Flows (in thousands)
For the year ended December 31,
2011
2010
2009
CASH FLOWS FROM OPERATING ACTIVITIES:
Net earnings
$43,938
$53,063
$53,157
Adjustments to reconcile net earnings to net cash provided by
operating activities:
Depreciation
19,229
18,279
17,862
Impairment charges
—
—
14,000
Impairment of equity method investment
—
—
4,400
Loss from equity method investment
194
342
233
Amortization of marketable security premiums
1,267
522
320
Changes in operating assets and liabilities:
Accounts receivable
(5,448 )
717
(5,899 )
Other receivables
3,963
(2,373 )
(2,088 )
Inventories
(15,631 )
(1,447 )
455
Prepaid expenses and other assets
5,106
4,936
5,203
Accounts payable and accrued liabilities
84
2,180
(2,755 )
Income taxes payable and deferred
(5,772 )
2,322
(12,543 )
Postretirement health care and life insurance benefits
2,022
1,429
1,384
Deferred compensation and other liabilities
2,146
2,525
2,960
Others
(708 )
310
305
Net cash provided by operating activities
50,390
82,805
76,994
CASH FLOWS FROM INVESTING ACTIVITIES:
Capital expenditures
(16,351 )
(12,813 )
(20,831 )
Net purchase of trading securities
(3,234 )
(2,902 )
(1,713 )
Purchase of available for sale securities
(39,252 )
(9,301 )
(11,331 )
Sale and maturity of available for sale securities
7,680
8,208
17,511
Net cash used in investing activities
(51,157 )
(16,808 )
(16,364 )
CASH FLOWS FROM FINANCING ACTIVITIES:
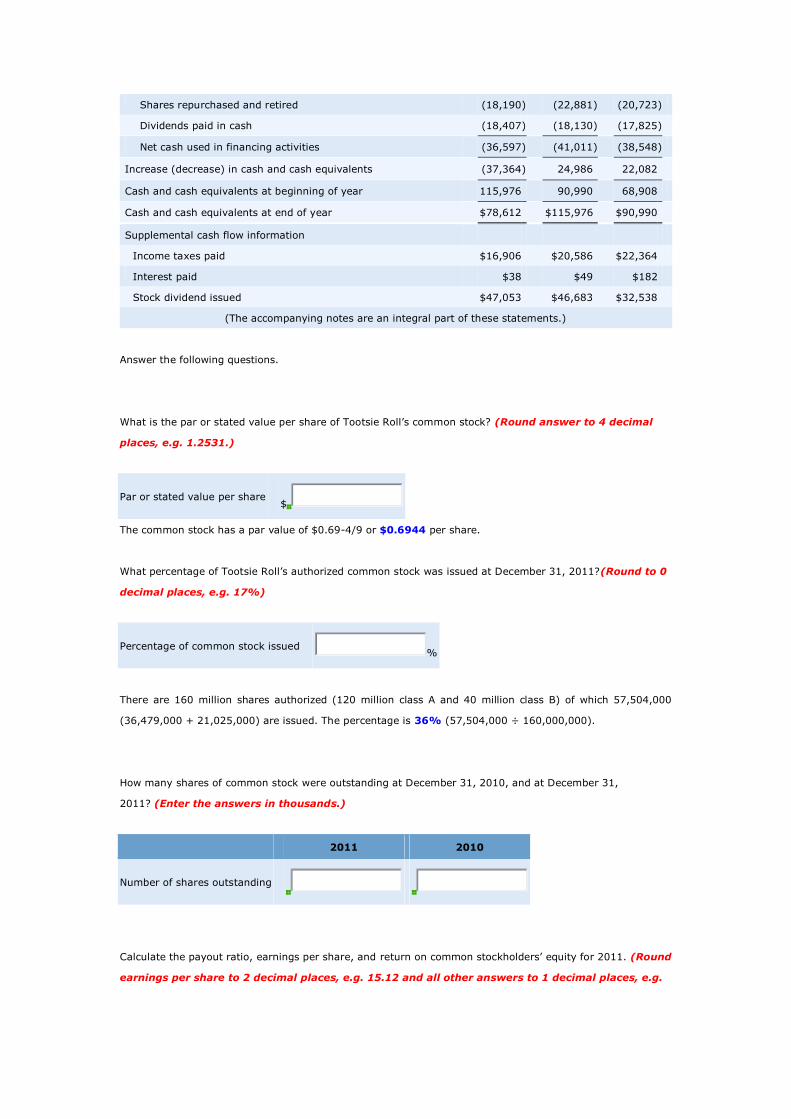
Shares repurchased and retired
(18,190 )
(22,881 )
(20,723 )
Dividends paid in cash
(18,407 )
(18,130 )
(17,825 )
Net cash used in financing activities
(36,597 )
(41,011 )
(38,548 )
Increase (decrease) in cash and cash equivalents
(37,364 )
24,986
22,082
Cash and cash equivalents at beginning of year
115,976
90,990
68,908
Cash and cash equivalents at end of year
$78,612
$115,976
$90,990
Supplemental cash flow information
Income taxes paid
$16,906
$20,586
$22,364
Interest paid
$38
$49
$182
Stock dividend issued
$47,053
$46,683
$32,538
(The accompanying notes are an integral part of these statements.)
Answer the following questions.
What is the par or stated value per share of Tootsie Roll’s common stock? (Round answer to 4 decimal
places, e.g. 1.2531.)
Par or stated value per share $
The common stock has a par value of $0.69-4/9 or $0.6944 per share.
What percentage of Tootsie Roll’s authorized common stock was issued at December 31, 2011?(Round to 0
decimal places, e.g. 17%)
Percentage of common stock issued %
There are 160 million shares authorized (120 million class A and 40 million class B) of which 57,504,000
(36,479,000 + 21,025,000) are issued. The percentage is 36% (57,504,000 ÷ 160,000,000).
How many shares of common stock were outstanding at December 31, 2010, and at December 31,
2011? (Enter the answers in thousands.)
2011
2010
Number of shares outstanding
Calculate the payout ratio, earnings per share, and return on common stockholders’ equity for 2011. (Round
earnings per share to 2 decimal places, e.g. 15.12 and all other answers to 1 decimal places, e.g.
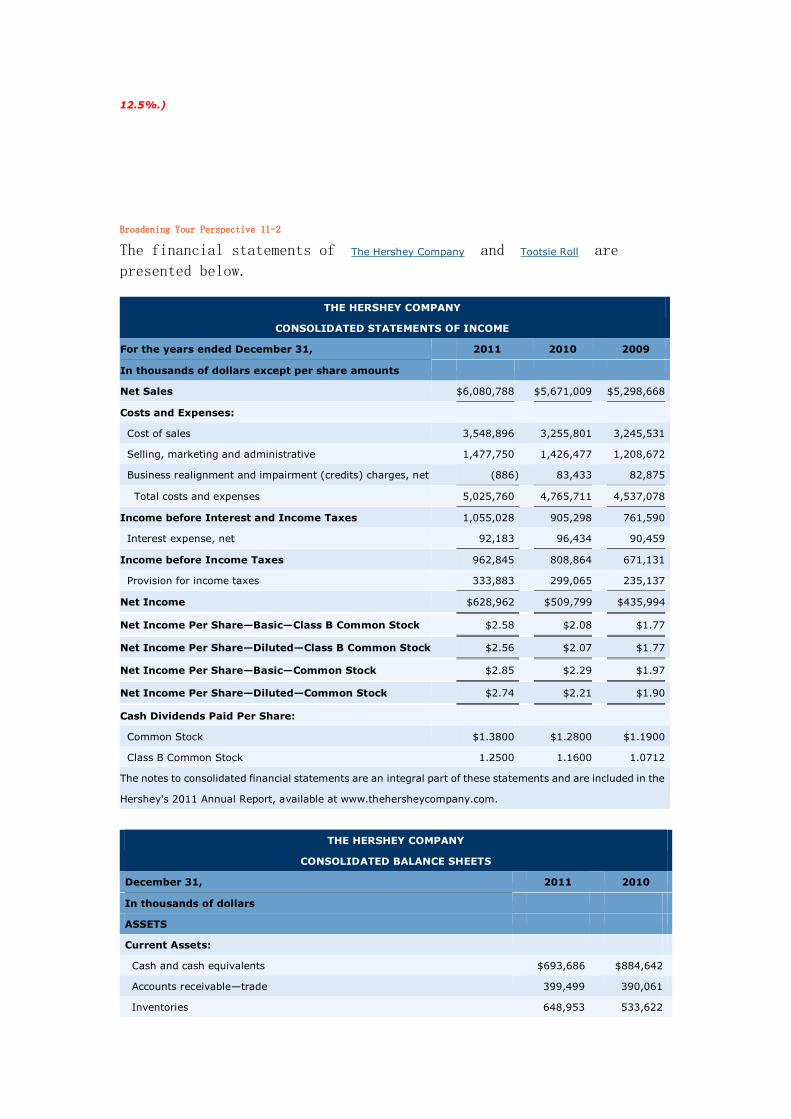
12.5%.)
Broadening Your Perspective 11-2
The financial statements of The Hershey Company and Tootsie Roll are
presented below.
THE HERSHEY COMPANY
CONSOLIDATED STATEMENTS OF INCOME
For the years ended December 31,
2011
2010
2009
In thousands of dollars except per share amounts
Net Sales
$6,080,788
$5,671,009
$5,298,668
Costs and Expenses:
Cost of sales
3,548,896
3,255,801
3,245,531
Selling, marketing and administrative
1,477,750
1,426,477
1,208,672
Business realignment and impairment (credits) charges, net
(886 )
83,433
82,875
Total costs and expenses
5,025,760
4,765,711
4,537,078
Income before Interest and Income Taxes
1,055,028
905,298
761,590
Interest expense, net
92,183
96,434
90,459
Income before Income Taxes
962,845
808,864
671,131
Provision for income taxes
333,883
299,065
235,137
Net Income
$628,962
$509,799
$435,994
Net Income Per Share—Basic—Class B Common Stock
$2.58
$2.08
$1.77
Net Income Per Share—Diluted—Class B Common Stock
$2.56
$2.07
$1.77
Net Income Per Share—Basic—Common Stock
$2.85
$2.29
$1.97
Net Income Per Share—Diluted—Common Stock
$2.74
$2.21
$1.90
Cash Dividends Paid Per Share:
Common Stock
$1.3800
$1.2800
$1.1900
Class B Common Stock
1.2500
1.1600
1.0712
The notes to consolidated financial statements are an integral part of these statements and are included in the
Hershey's 2011 Annual Report, available at www.thehersheycompany.com.
THE HERSHEY COMPANY
CONSOLIDATED BALANCE SHEETS
December 31,
2011
2010
In thousands of dollars
ASSETS
Current Assets:
Cash and cash equivalents
$693,686
$884,642
Accounts receivable—trade
399,499
390,061
Inventories
648,953
533,622
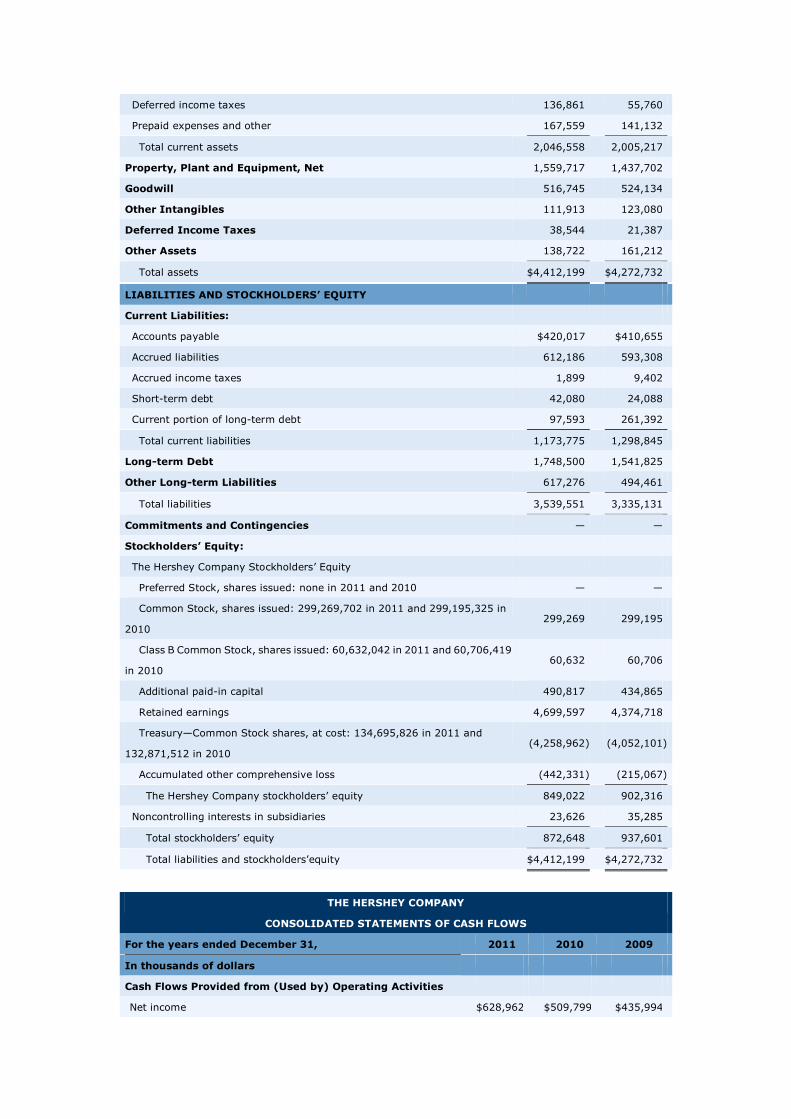
Deferred income taxes
136,861
55,760
Prepaid expenses and other
167,559
141,132
Total current assets
2,046,558
2,005,217
Property, Plant and Equipment, Net
1,559,717
1,437,702
Goodwill
516,745
524,134
Other Intangibles
111,913
123,080
Deferred Income Taxes
38,544
21,387
Other Assets
138,722
161,212
Total assets
$4,412,199
$4,272,732
LIABILITIES AND STOCKHOLDERS’ EQUITY
Current Liabilities:
Accounts payable
$420,017
$410,655
Accrued liabilities
612,186
593,308
Accrued income taxes
1,899
9,402
Short-term debt
42,080
24,088
Current portion of long-term debt
97,593
261,392
Total current liabilities
1,173,775
1,298,845
Long-term Debt
1,748,500
1,541,825
Other Long-term Liabilities
617,276
494,461
Total liabilities
3,539,551
3,335,131
Commitments and Contingencies
—
—
Stockholders’ Equity:
The Hershey Company Stockholders’ Equity
Preferred Stock, shares issued: none in 2011 and 2010
—
—
Common Stock, shares issued: 299,269,702 in 2011 and 299,195,325 in
2010 299,269
299,195
Class B Common Stock, shares issued: 60,632,042 in 2011 and 60,706,419
in 2010 60,632
60,706
Additional paid-in capital
490,817
434,865
Retained earnings
4,699,597
4,374,718
Treasury—Common Stock shares, at cost: 134,695,826 in 2011 and
132,871,512 in 2010 (4,258,962 )
(4,052,101 )
Accumulated other comprehensive loss
(442,331 )
(215,067 )
The Hershey Company stockholders’ equity
849,022
902,316
Noncontrolling interests in subsidiaries
23,626
35,285
Total stockholders’ equity
872,648
937,601
Total liabilities and stockholders’equity
$4,412,199
$4,272,732
THE HERSHEY COMPANY
CONSOLIDATED STATEMENTS OF CASH FLOWS
For the years ended December 31,
2011
2010
2009
In thousands of dollars
Cash Flows Provided from (Used by) Operating Activities
Net income
$628,962
$509,799
$435,994
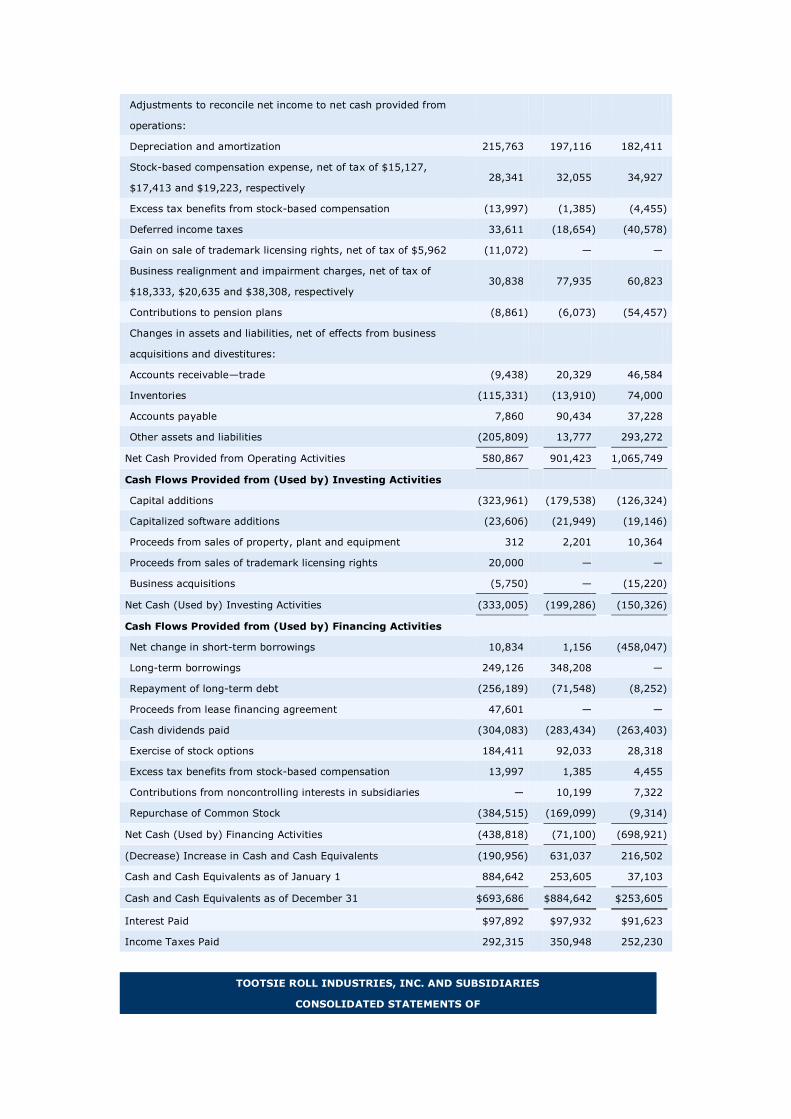
Adjustments to reconcile net income to net cash provided from
operations:
Depreciation and amortization
215,763
197,116
182,411
Stock-based compensation expense, net of tax of $15,127,
$17,413 and $19,223, respectively 28,341
32,055
34,927
Excess tax benefits from stock-based compensation
(13,997 )
(1,385 )
(4,455 )
Deferred income taxes
33,611
(18,654 )
(40,578 )
Gain on sale of trademark licensing rights, net of tax of $5,962
(11,072 )
—
—
Business realignment and impairment charges, net of tax of
$18,333, $20,635 and $38,308, respectively 30,838
77,935
60,823
Contributions to pension plans
(8,861 )
(6,073 )
(54,457 )
Changes in assets and liabilities, net of effects from business
acquisitions and divestitures:
Accounts receivable—trade
(9,438 )
20,329
46,584
Inventories
(115,331 )
(13,910 )
74,000
Accounts payable
7,860
90,434
37,228
Other assets and liabilities
(205,809 )
13,777
293,272
Net Cash Provided from Operating Activities
580,867
901,423
1,065,749
Cash Flows Provided from (Used by) Investing Activities
Capital additions
(323,961 )
(179,538 )
(126,324 )
Capitalized software additions
(23,606 )
(21,949 )
(19,146 )
Proceeds from sales of property, plant and equipment
312
2,201
10,364
Proceeds from sales of trademark licensing rights
20,000
—
—
Business acquisitions
(5,750 )
—
(15,220 )
Net Cash (Used by) Investing Activities
(333,005 )
(199,286 )
(150,326 )
Cash Flows Provided from (Used by) Financing Activities
Net change in short-term borrowings
10,834
1,156
(458,047 )
Long-term borrowings
249,126
348,208
—
Repayment of long-term debt
(256,189 )
(71,548 )
(8,252 )
Proceeds from lease financing agreement
47,601
—
—
Cash dividends paid
(304,083 )
(283,434 )
(263,403 )
Exercise of stock options
184,411
92,033
28,318
Excess tax benefits from stock-based compensation
13,997
1,385
4,455
Contributions from noncontrolling interests in subsidiaries
—
10,199
7,322
Repurchase of Common Stock
(384,515 )
(169,099 )
(9,314 )
Net Cash (Used by) Financing Activities
(438,818 )
(71,100 )
(698,921 )
(Decrease) Increase in Cash and Cash Equivalents
(190,956 )
631,037
216,502
Cash and Cash Equivalents as of January 1
884,642
253,605
37,103
Cash and Cash Equivalents as of December 31
$693,686
$884,642
$253,605
Interest Paid
$97,892
$97,932
$91,623
Income Taxes Paid
292,315
350,948
252,230
TOOTSIE ROLL INDUSTRIES, INC. AND SUBSIDIARIES
CONSOLIDATED STATEMENTS OF
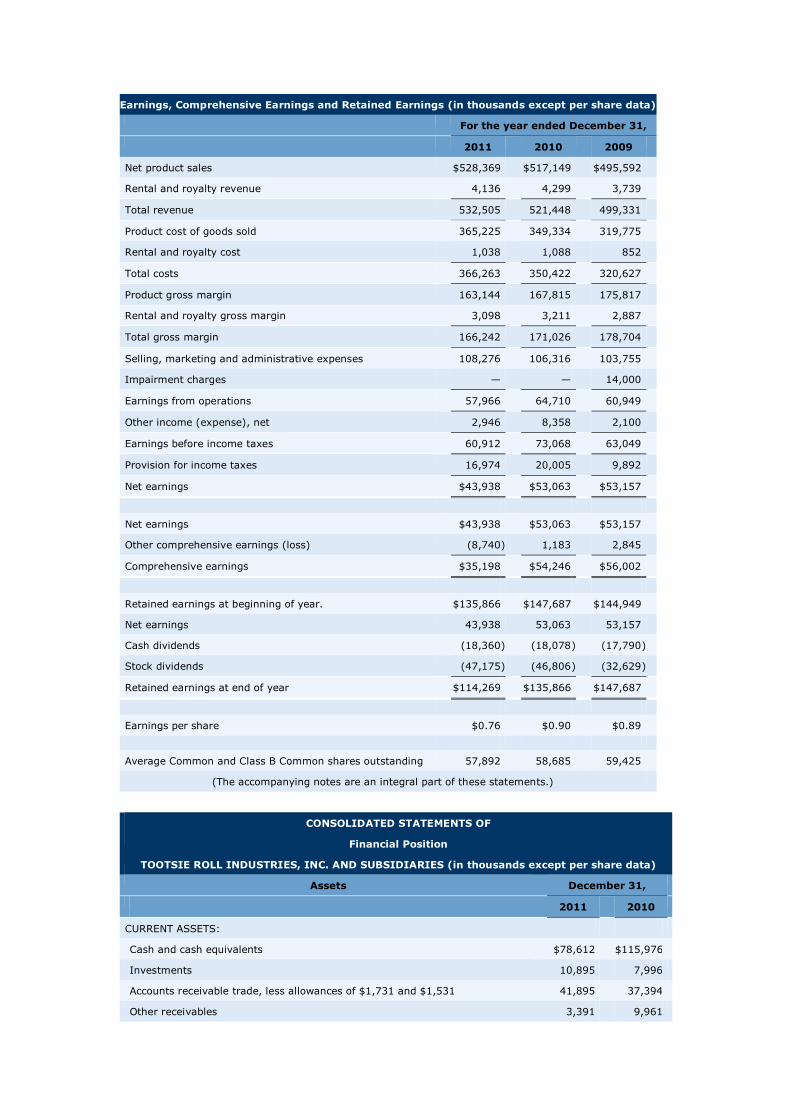
Earnings, Comprehensive Earnings and Retained Earnings (in thousands except per share data)
For the year ended December 31,
2011
2010
2009
Net product sales
$528,369
$517,149
$495,592
Rental and royalty revenue
4,136
4,299
3,739
Total revenue
532,505
521,448
499,331
Product cost of goods sold
365,225
349,334
319,775
Rental and royalty cost
1,038
1,088
852
Total costs
366,263
350,422
320,627
Product gross margin
163,144
167,815
175,817
Rental and royalty gross margin
3,098
3,211
2,887
Total gross margin
166,242
171,026
178,704
Selling, marketing and administrative expenses
108,276
106,316
103,755
Impairment charges
—
—
14,000
Earnings from operations
57,966
64,710
60,949
Other income (expense), net
2,946
8,358
2,100
Earnings before income taxes
60,912
73,068
63,049
Provision for income taxes
16,974
20,005
9,892
Net earnings
$43,938
$53,063
$53,157
Net earnings
$43,938
$53,063
$53,157
Other comprehensive earnings (loss)
(8,740 )
1,183
2,845
Comprehensive earnings
$35,198
$54,246
$56,002
Retained earnings at beginning of year.
$135,866
$147,687
$144,949
Net earnings
43,938
53,063
53,157
Cash dividends
(18,360 )
(18,078 )
(17,790 )
Stock dividends
(47,175 )
(46,806 )
(32,629 )
Retained earnings at end of year
$114,269
$135,866
$147,687
Earnings per share
$0.76
$0.90
$0.89
Average Common and Class B Common shares outstanding
57,892
58,685
59,425
(The accompanying notes are an integral part of these statements.)
CONSOLIDATED STATEMENTS OF
Financial Position
TOOTSIE ROLL INDUSTRIES, INC. AND SUBSIDIARIES (in thousands except per share data)
Assets
December 31,
2011
2010
CURRENT ASSETS:
Cash and cash equivalents
$78,612
$115,976
Investments
10,895
7,996
Accounts receivable trade, less allowances of $1,731 and $1,531
41,895
37,394
Other receivables
3,391
9,961
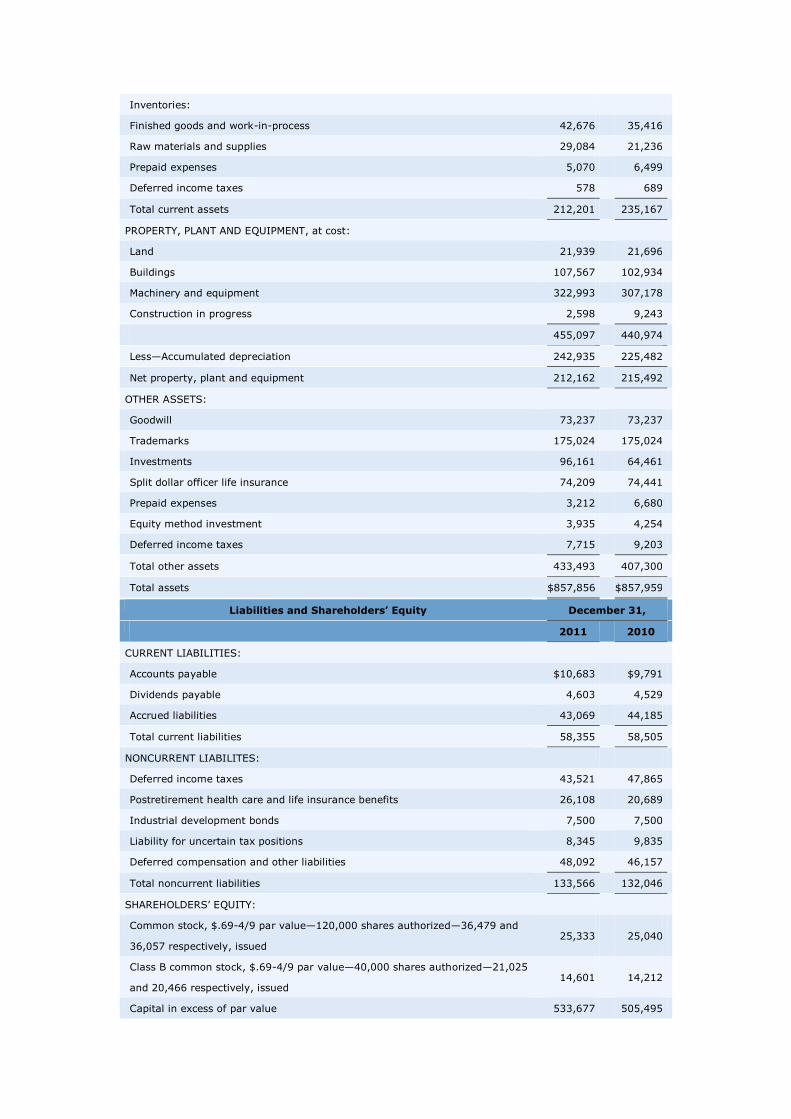
Inventories:
Finished goods and work-in-process
42,676
35,416
Raw materials and supplies
29,084
21,236
Prepaid expenses
5,070
6,499
Deferred income taxes
578
689
Total current assets
212,201
235,167
PROPERTY, PLANT AND EQUIPMENT, at cost:
Land
21,939
21,696
Buildings
107,567
102,934
Machinery and equipment
322,993
307,178
Construction in progress
2,598
9,243
455,097
440,974
Less—Accumulated depreciation
242,935
225,482
Net property, plant and equipment
212,162
215,492
OTHER ASSETS:
Goodwill
73,237
73,237
Trademarks
175,024
175,024
Investments
96,161
64,461
Split dollar officer life insurance
74,209
74,441
Prepaid expenses
3,212
6,680
Equity method investment
3,935
4,254
Deferred income taxes
7,715
9,203
Total other assets
433,493
407,300
Total assets
$857,856
$857,959
Liabilities and Shareholders’ Equity
December 31,
2011
2010
CURRENT LIABILITIES:
Accounts payable
$10,683
$9,791
Dividends payable
4,603
4,529
Accrued liabilities
43,069
44,185
Total current liabilities
58,355
58,505
NONCURRENT LIABILITES:
Deferred income taxes
43,521
47,865
Postretirement health care and life insurance benefits
26,108
20,689
Industrial development bonds
7,500
7,500
Liability for uncertain tax positions
8,345
9,835
Deferred compensation and other liabilities
48,092
46,157
Total noncurrent liabilities
133,566
132,046
SHAREHOLDERS’ EQUITY:
Common stock, $.69-4/9 par value—120,000 shares authorized—36,479 and
36,057 respectively, issued 25,333
25,040
Class B common stock, $.69-4/9 par value—40,000 shares authorized—21,025
and 20,466 respectively, issued 14,601
14,212
Capital in excess of par value
533,677
505,495
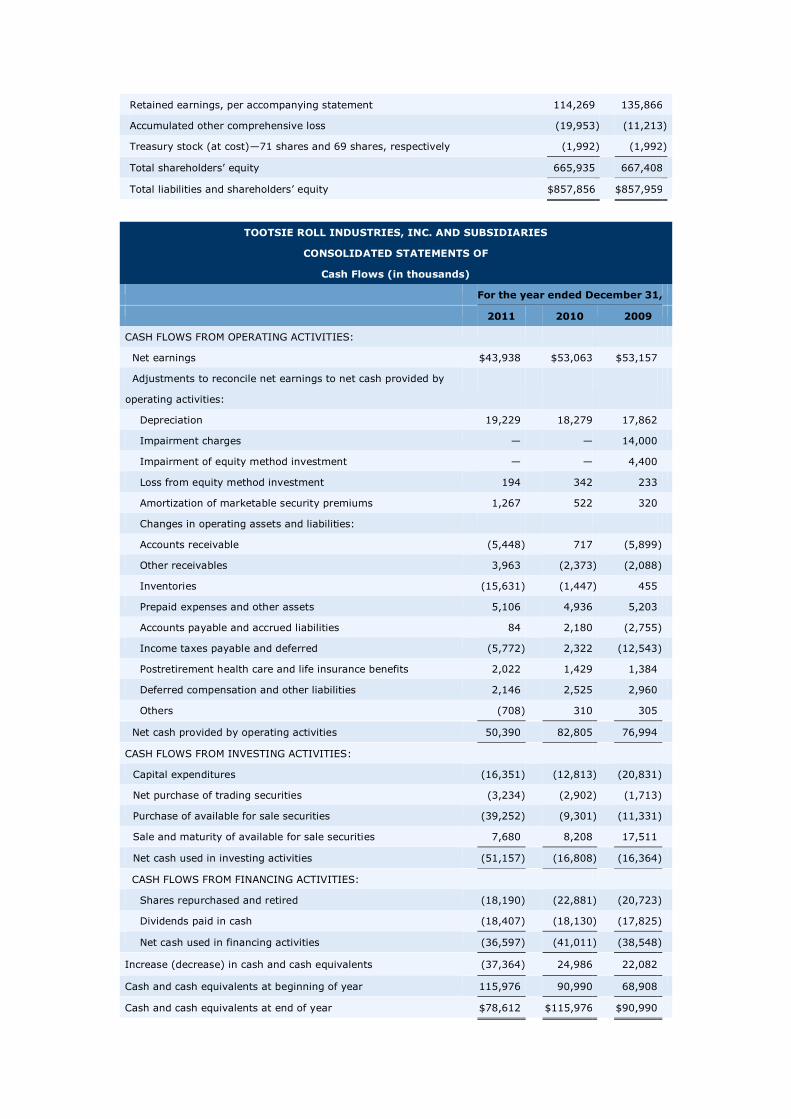
Retained earnings, per accompanying statement
114,269
135,866
Accumulated other comprehensive loss
(19,953 )
(11,213 )
Treasury stock (at cost)—71 shares and 69 shares, respectively
(1,992 )
(1,992 )
Total shareholders’ equity
665,935
667,408
Total liabilities and shareholders’ equity
$857,856
$857,959
TOOTSIE ROLL INDUSTRIES, INC. AND SUBSIDIARIES
CONSOLIDATED STATEMENTS OF
Cash Flows (in thousands)
For the year ended December 31,
2011
2010
2009
CASH FLOWS FROM OPERATING ACTIVITIES:
Net earnings
$43,938
$53,063
$53,157
Adjustments to reconcile net earnings to net cash provided by
operating activities:
Depreciation
19,229
18,279
17,862
Impairment charges
—
—
14,000
Impairment of equity method investment
—
—
4,400
Loss from equity method investment
194
342
233
Amortization of marketable security premiums
1,267
522
320
Changes in operating assets and liabilities:
Accounts receivable
(5,448 )
717
(5,899 )
Other receivables
3,963
(2,373 )
(2,088 )
Inventories
(15,631 )
(1,447 )
455
Prepaid expenses and other assets
5,106
4,936
5,203
Accounts payable and accrued liabilities
84
2,180
(2,755 )
Income taxes payable and deferred
(5,772 )
2,322
(12,543 )
Postretirement health care and life insurance benefits
2,022
1,429
1,384
Deferred compensation and other liabilities
2,146
2,525
2,960
Others
(708 )
310
305
Net cash provided by operating activities
50,390
82,805
76,994
CASH FLOWS FROM INVESTING ACTIVITIES:
Capital expenditures
(16,351 )
(12,813 )
(20,831 )
Net purchase of trading securities
(3,234 )
(2,902 )
(1,713 )
Purchase of available for sale securities
(39,252 )
(9,301 )
(11,331 )
Sale and maturity of available for sale securities
7,680
8,208
17,511
Net cash used in investing activities
(51,157 )
(16,808 )
(16,364 )
CASH FLOWS FROM FINANCING ACTIVITIES:
Shares repurchased and retired
(18,190 )
(22,881 )
(20,723 )
Dividends paid in cash
(18,407 )
(18,130 )
(17,825 )
Net cash used in financing activities
(36,597 )
(41,011 )
(38,548 )
Increase (decrease) in cash and cash equivalents
(37,364 )
24,986
22,082
Cash and cash equivalents at beginning of year
115,976
90,990
68,908
Cash and cash equivalents at end of year
$78,612
$115,976
$90,990
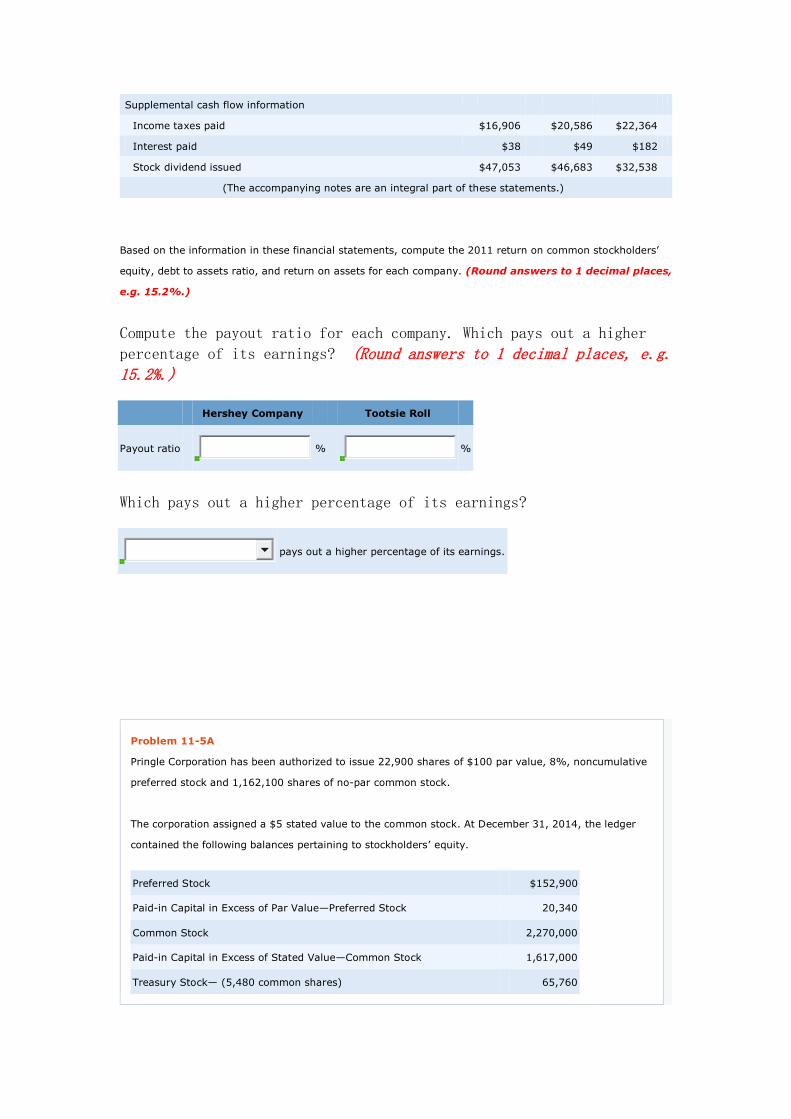
Supplemental cash flow information
Income taxes paid
$16,906
$20,586
$22,364
Interest paid
$38
$49
$182
Stock dividend issued
$47,053
$46,683
$32,538
(The accompanying notes are an integral part of these statements.)
Based on the information in these financial statements, compute the 2011 return on common stockholders’
equity, debt to assets ratio, and return on assets for each company. (Round answers to 1 decimal places,
e.g. 15.2%.)
Compute the payout ratio for each company. Which pays out a higher
percentage of its earnings? (Round answers to 1 decimal places, e.g. 15.2%.)
Hershey Company
Tootsie Roll
Payout ratio
%
%
Which pays out a higher percentage of its earnings?
pays out a higher percentage of its earnings.
Problem 11-5A
Pringle Corporation has been authorized to issue 22,900 shares of $100 par value, 8%, noncumulative
preferred stock and 1,162,100 shares of no-par common stock.
The corporation assigned a $5 stated value to the common stock. At December 31, 2014, the ledger
contained the following balances pertaining to stockholders’ equity.
Preferred Stock
$152,900
Paid-in Capital in Excess of Par Value—Preferred Stock
20,340
Common Stock
2,270,000
Paid-in Capital in Excess of Stated Value—Common Stock
1,617,000
Treasury Stock— (5,480 common shares)
65,760

Retained Earnings
82,300
The preferred stock was issued for $173,240 cash. All common stock issued was for cash. In
November 5,480 shares of common stock were purchased for the treasury at a per share cost of $12. No
dividends were declared in 2014.
Your answer is correct.
Prepare the journal entries for the following. (Credit account titles are automatically indented when
amount is entered. Do not indent manually.)
(1)
Issuance of preferred stock for cash.
(2)
Issuance of common stock for cash.
(3)
Purchase of common treasury stock for cash.
Problem 11-8A
On January 1, 2014, Everett Corporation had these stockholders’ equity accounts.
Common Stock ($10 par value, 69,700 shares issued and outstanding) $697,000
Paid-in Capital in Excess of Par Value 484,300
Retained Earnings 684,900
During the year, the following transactions occurred.
Jan. 15 Declared a $0.50 cash dividend per share to stockholders of record on January 31, payable
February 15.
Feb. 15 Paid the dividend declared in January.
Apr. 15 Declared a 10% stock dividend to stockholders of record on April 30, distributable May 15. On
April 15, the market price of the stock was $13 per share.
May 15 Issued the shares for the stock dividend.
Dec. 1 Declared a $0.60 per share cash dividend to stockholders of record on December 15, payable
January 10, 2015.
Dec. 31
Determined that net income for the year was $401,800.
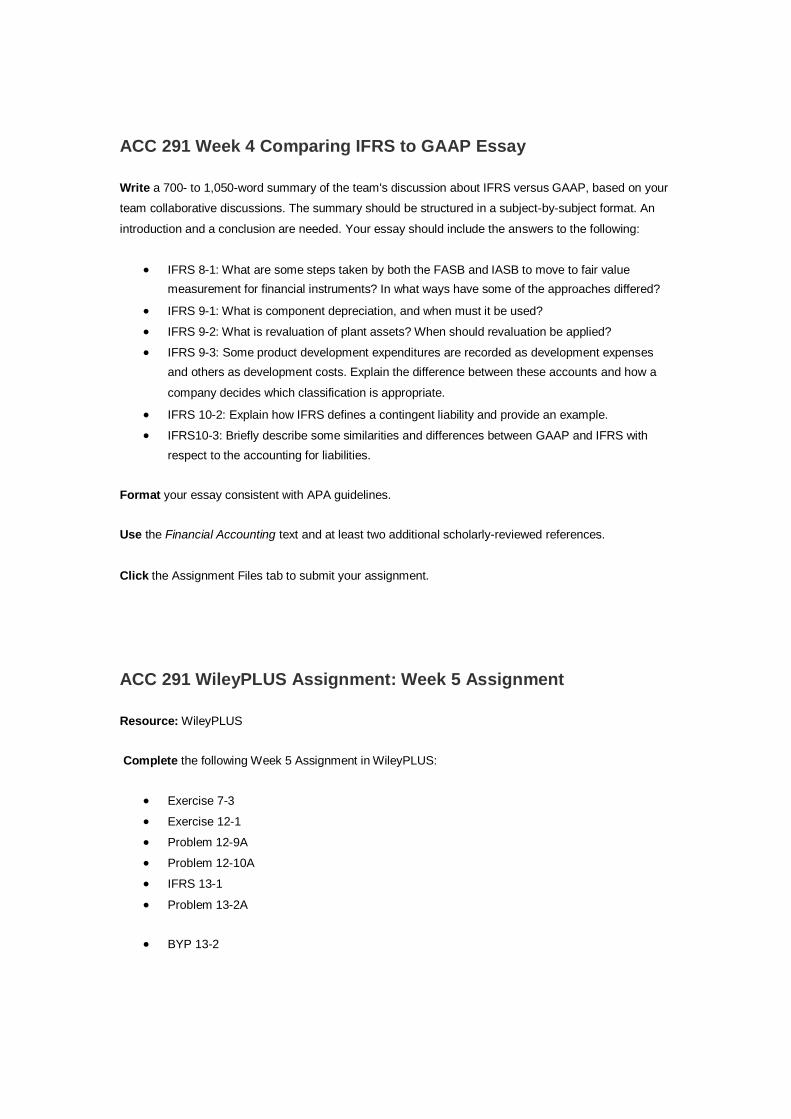
ACC 291 Week 4 Comparing IFRS to GAAP Essay
Write a 700- to 1,050-word summary of the team's discussion about IFRS versus GAAP, based on your
team collaborative discussions. The summary should be structured in a subject-by-subject format. An
introduction and a conclusion are needed. Your essay should include the answers to the following:
IFRS 8-1: What are some steps taken by both the FASB and IASB to move to fair value
measurement for financial instruments? In what ways have some of the approaches differed?
IFRS 9-1: What is component depreciation, and when must it be used?
IFRS 9-2: What is revaluation of plant assets? When should revaluation be applied?
IFRS 9-3: Some product development expenditures are recorded as development expenses
and others as development costs. Explain the difference between these accounts and how a
company decides which classification is appropriate.
IFRS 10-2: Explain how IFRS defines a contingent liability and provide an example.
IFRS10-3: Briefly describe some similarities and differences between GAAP and IFRS with
respect to the accounting for liabilities.
Format your essay consistent with APA guidelines.
Use the Financial Accounting text and at least two additional scholarly-reviewed references.
Click the Assignment Files tab to submit your assignment.
ACC 291 WileyPLUS Assignment: Week 5 Assignment
Resource: WileyPLUS
Complete the following Week 5 Assignment in WileyPLUS:
Exercise 7-3
Exercise 12-1
Problem 12-9A
Problem 12-10A
IFRS 13-1
Problem 13-2A
BYP 13-2
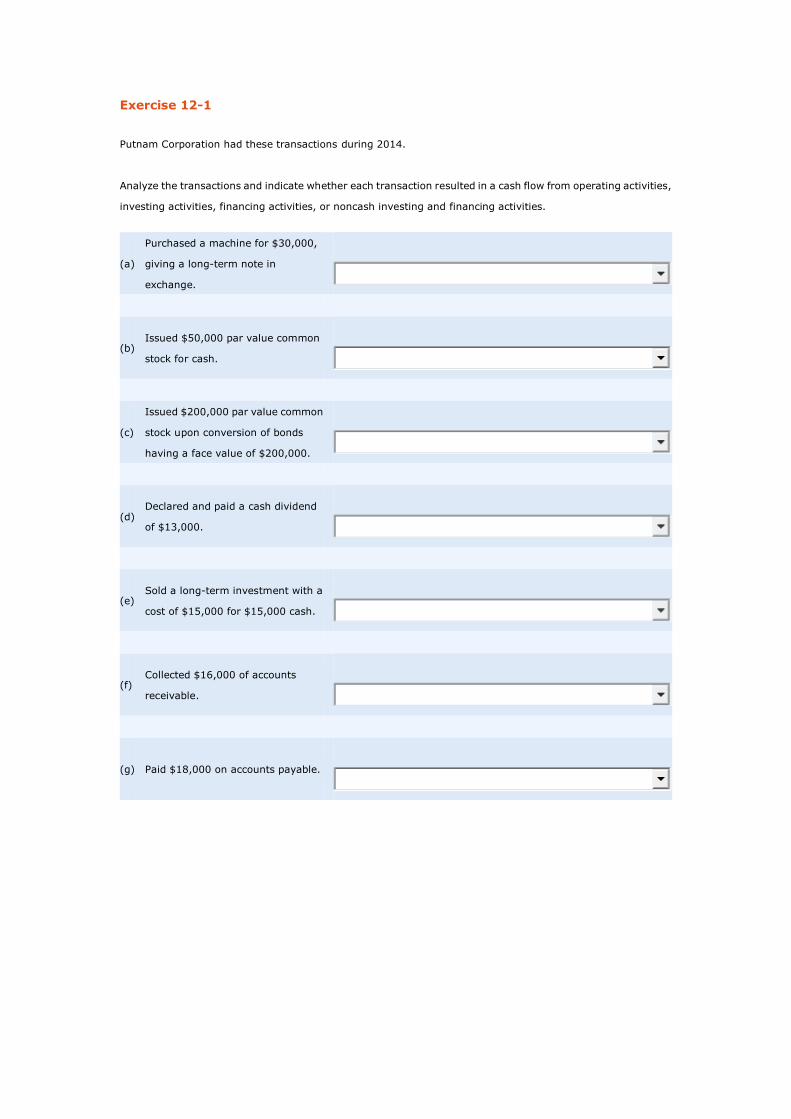
Exercise 12-1
Putnam Corporation had these transactions during 2014.
Analyze the transactions and indicate whether each transaction resulted in a cash flow from operating activities,
investing activities, financing activities, or noncash investing and financing activities.
(a)
Purchased a machine for $30,000,
giving a long-term note in
exchange.
(b)
Issued $50,000 par value common
stock for cash.
(c)
Issued $200,000 par value common
stock upon conversion of bonds
having a face value of $200,000.
(d)
Declared and paid a cash dividend
of $13,000.
(e)
Sold a long-term investment with a
cost of $15,000 for $15,000 cash.
(f)
Collected $16,000 of accounts
receivable.
(g)
Paid $18,000 on accounts payable.
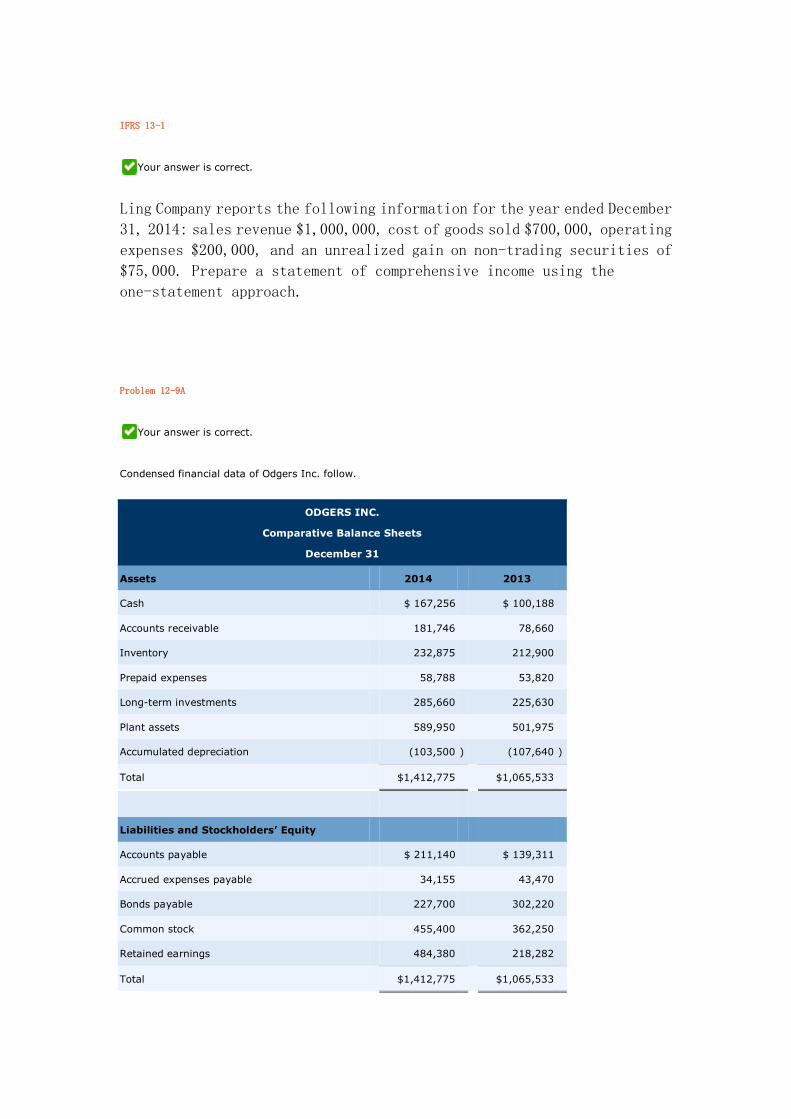
IFRS 13-1
Your answer is correct.
Ling Company reports the following information for the year ended December
31, 2014: sales revenue $1,000,000, cost of goods sold $700,000, operating
expenses $200,000, and an unrealized gain on non-trading securities of
$75,000. Prepare a statement of comprehensive income using the
one-statement approach.
Problem 12-9A
Your answer is correct.
Condensed financial data of Odgers Inc. follow.
ODGERS INC.
Comparative Balance Sheets
December 31
Assets
2014
2013
Cash
$ 167,256
$ 100,188
Accounts receivable
181,746
78,660
Inventory
232,875
212,900
Prepaid expenses
58,788
53,820
Long-term investments
285,660
225,630
Plant assets
589,950
501,975
Accumulated depreciation
(103,500 )
(107,640 )
Total
$1,412,775
$1,065,533
Liabilities and Stockholders’ Equity
Accounts payable
$ 211,140
$ 139,311
Accrued expenses payable
34,155
43,470
Bonds payable
227,700
302,220
Common stock
455,400
362,250
Retained earnings
484,380
218,282
Total
$1,412,775
$1,065,533
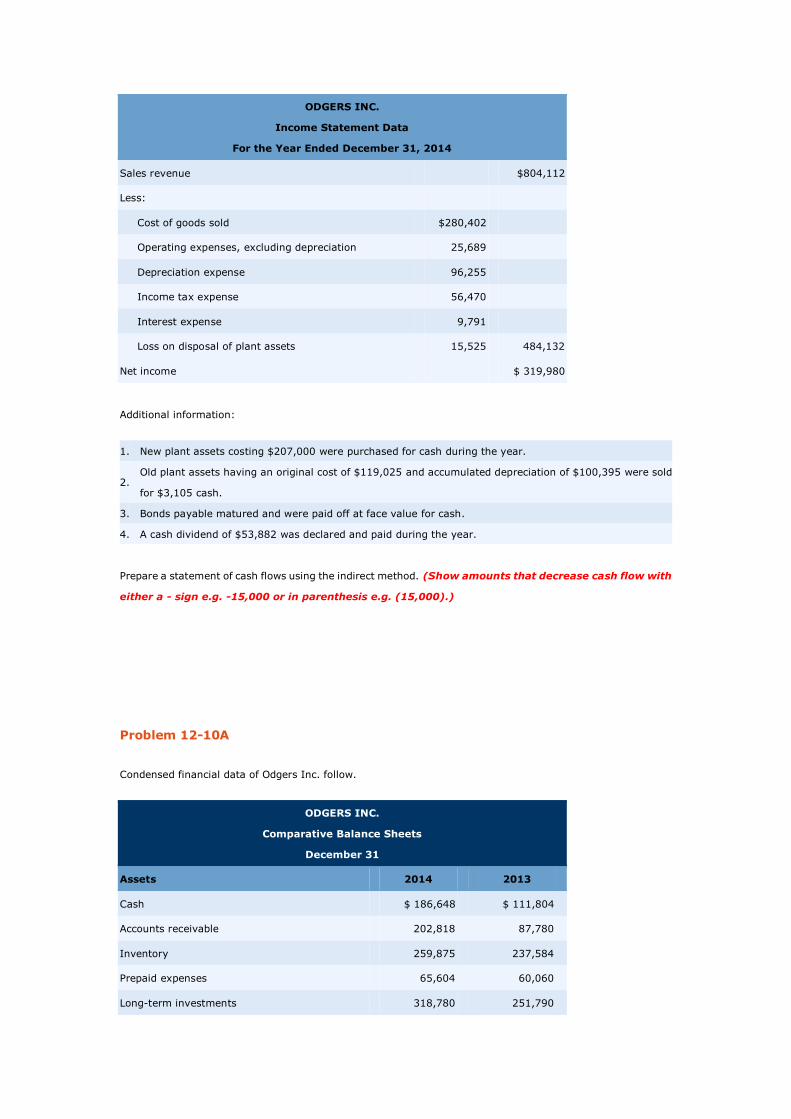
ODGERS INC.
Income Statement Data
For the Year Ended December 31, 2014
Sales revenue
$804,112
Less:
Cost of goods sold
$280,402
Operating expenses, excluding depreciation
25,689
Depreciation expense
96,255
Income tax expense
56,470
Interest expense
9,791
Loss on disposal of plant assets
15,525
484,132
Net income
$ 319,980
Additional information:
1. New plant assets costing $207,000 were purchased for cash during the year.
2.
Old plant assets having an original cost of $119,025 and accumulated depreciation of $100,395 were sold
for $3,105 cash.
3.
Bonds payable matured and were paid off at face value for cash.
4.
A cash dividend of $53,882 was declared and paid during the year.
Prepare a statement of cash flows using the indirect method. (Show amounts that decrease cash flow with
either a - sign e.g. -15,000 or in parenthesis e.g. (15,000).)
Problem 12-10A
Condensed financial data of Odgers Inc. follow.
ODGERS INC.
Comparative Balance Sheets
December 31
Assets
2014
2013
Cash
$ 186,648
$ 111,804
Accounts receivable
202,818
87,780
Inventory
259,875
237,584
Prepaid expenses
65,604
60,060
Long-term investments
318,780
251,790

Plant assets
658,350
560,175
Accumulated depreciation
(115,500 )
(120,120 )
Total
$1,576,575
$1,189,073
Liabilities and Stockholders’ Equity
Accounts payable
$ 235,620
$ 155,463
Accrued expenses payable
38,115
48,510
Bonds payable
254,100
337,260
Common stock
508,200
404,250
Retained earnings
540,540
243,590
Total
$1,576,575
$1,189,073
ODGERS INC.
Income Statement Data
For the Year Ended December 31, 2014
Sales revenue
$897,343
Less:
Cost of goods sold
$312,913
Operating expenses, excluding depreciation
28,667
Depreciation expense
107,415
Income taxes
63,017
Interest expense
10,926
Loss on disposal of plant assets
17,325
540,263
Net income
$ 357,080
Additional information:
1. New plant assets costing $231,000 were purchased for cash during the year.
2.
Old plant assets having an original cost of $132,825 and accumulated depreciation of $112,035 were sold
for $3,465 cash.
3.
Bonds payable matured and were paid off at face value for cash.
4.
A cash dividend of $60,130 was declared and paid during the year.
Further analysis reveals that accounts payable pertain to merchandise creditors.
Prepare a statement of cash flows for Odgers Inc. using the direct method. (Show amounts that decrease
cash flow with either a - sign e.g. -15,000 or in parenthesis e.g. (15,000).)
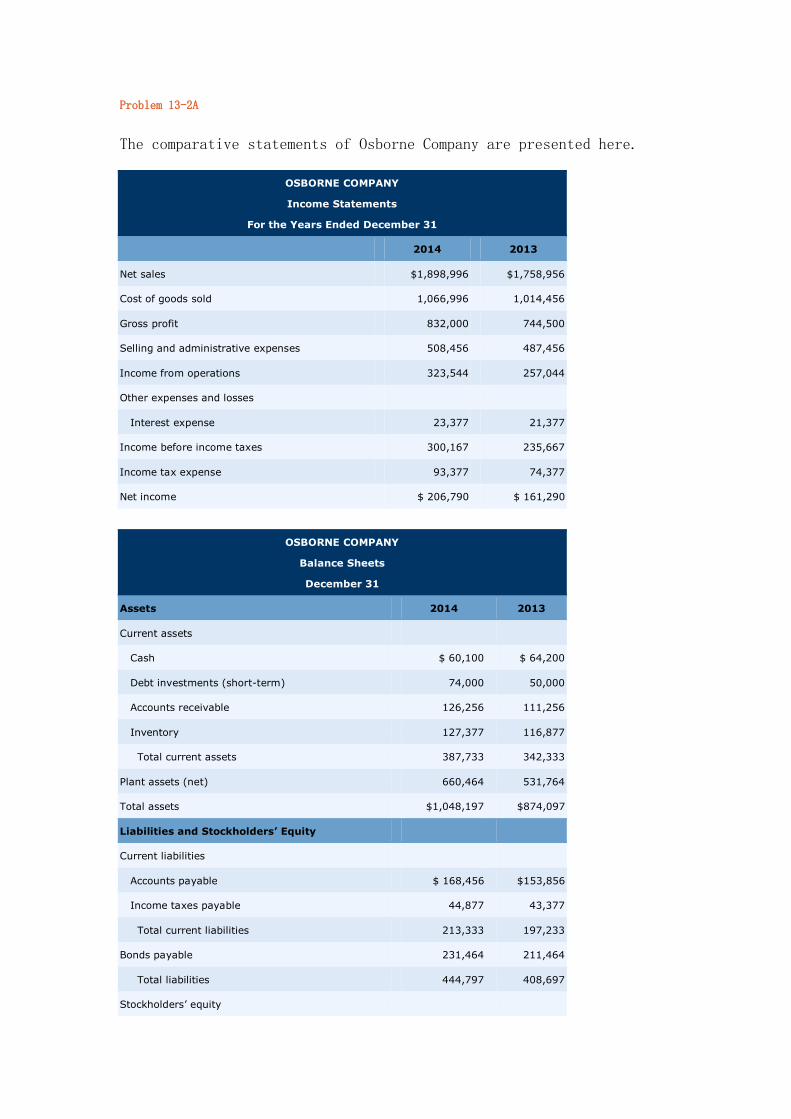
Problem 13-2A
The comparative statements of Osborne Company are presented here.
OSBORNE COMPANY
Income Statements
For the Years Ended December 31
2014
2013
Net sales
$1,898,996
$1,758,956
Cost of goods sold
1,066,996
1,014,456
Gross profit
832,000
744,500
Selling and administrative expenses
508,456
487,456
Income from operations
323,544
257,044
Other expenses and losses
Interest expense
23,377
21,377
Income before income taxes
300,167
235,667
Income tax expense
93,377
74,377
Net income
$ 206,790
$ 161,290
OSBORNE COMPANY
Balance Sheets
December 31
Assets
2014
2013
Current assets
Cash
$ 60,100
$ 64,200
Debt investments (short-term)
74,000
50,000
Accounts receivable
126,256
111,256
Inventory
127,377
116,877
Total current assets
387,733
342,333
Plant assets (net)
660,464
531,764
Total assets
$1,048,197
$874,097
Liabilities and Stockholders’ Equity
Current liabilities
Accounts payable
$ 168,456
$153,856
Income taxes payable
44,877
43,377
Total current liabilities
213,333
197,233
Bonds payable
231,464
211,464
Total liabilities
444,797
408,697
Stockholders’ equity
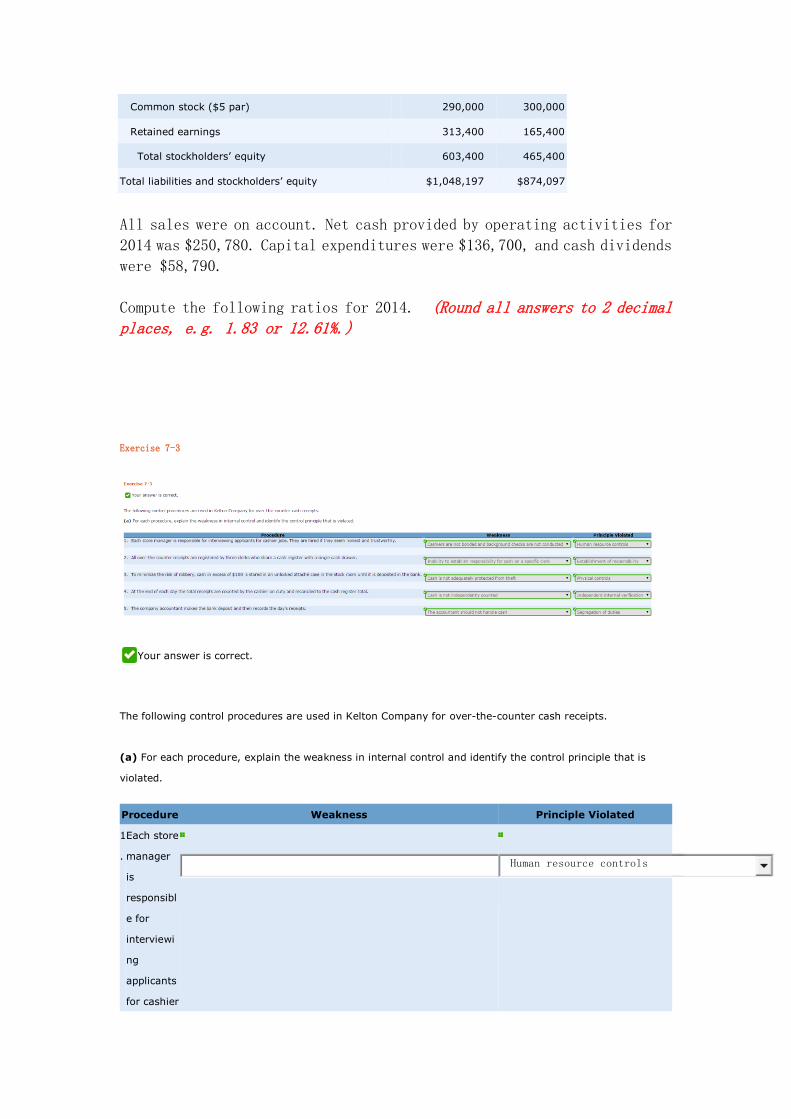
Common stock ($5 par)
290,000
300,000
Retained earnings
313,400
165,400
Total stockholders’ equity
603,400
465,400
Total liabilities and stockholders’ equity
$1,048,197
$874,097
All sales were on account. Net cash provided by operating activities for
2014 was $250,780. Capital expenditures were $136,700, and cash dividends
were $58,790.
Compute the following ratios for 2014. (Round all answers to 2 decimal places, e.g. 1.83 or 12.61%.)
Exercise 7-3
Your answer is correct.
The following control procedures are used in Kelton Company for over-the-counter cash receipts.
(a) For each procedure, explain the weakness in internal control and identify the control principle that is
violated.
Procedure Weakness
Principle Violated
1
.
Each store
manager
is
responsibl
e for
interviewi
ng
applicants
for cashier
Human resource controls
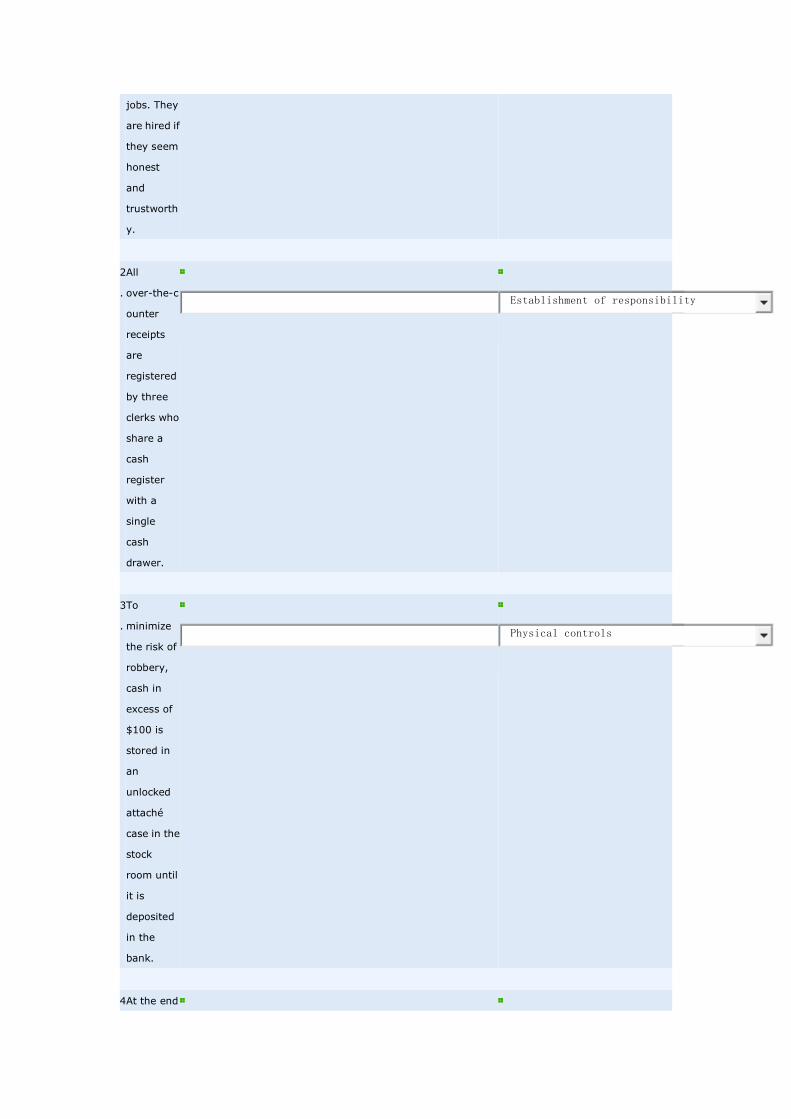
jobs. They
are hired if
they seem
honest
and
trustworth
y.
2
.
All
over-the-c
ounter
receipts
are
registered
by three
clerks who
share a
cash
register
with a
single
cash
drawer.
Establishment of responsibility
3
.
To
minimize
the risk of
robbery,
cash in
excess of
$100 is
stored in
an
unlocked
attaché
case in the
stock
room until
it is
deposited
in the
bank.
Physical controls
4 At the end

. of each
day the
total
receipts
are
counted
by the
cashier on
duty and
reconciled
to the
cash
register
total.
Independent internal verification
5
.
The
company
accountan
t makes
the bank
deposit
and then
records
the day’s
receipts.
Segregation of duties
Broadening Your Perspective 13-2
The financial statements of The Hershey Company and Tootsie Roll are presented below.
THE HERSHEY COMPANY
CONSOLIDATED STATEMENTS OF INCOME
For the years ended December 31,
2011
2010
2009
In thousands of dollars except per share amounts
Net Sales
$6,080,788
$5,671,009
$5,298,668
Costs and Expenses:
Cost of sales
3,548,896
3,255,801
3,245,531
Selling, marketing and administrative
1,477,750
1,426,477
1,208,672
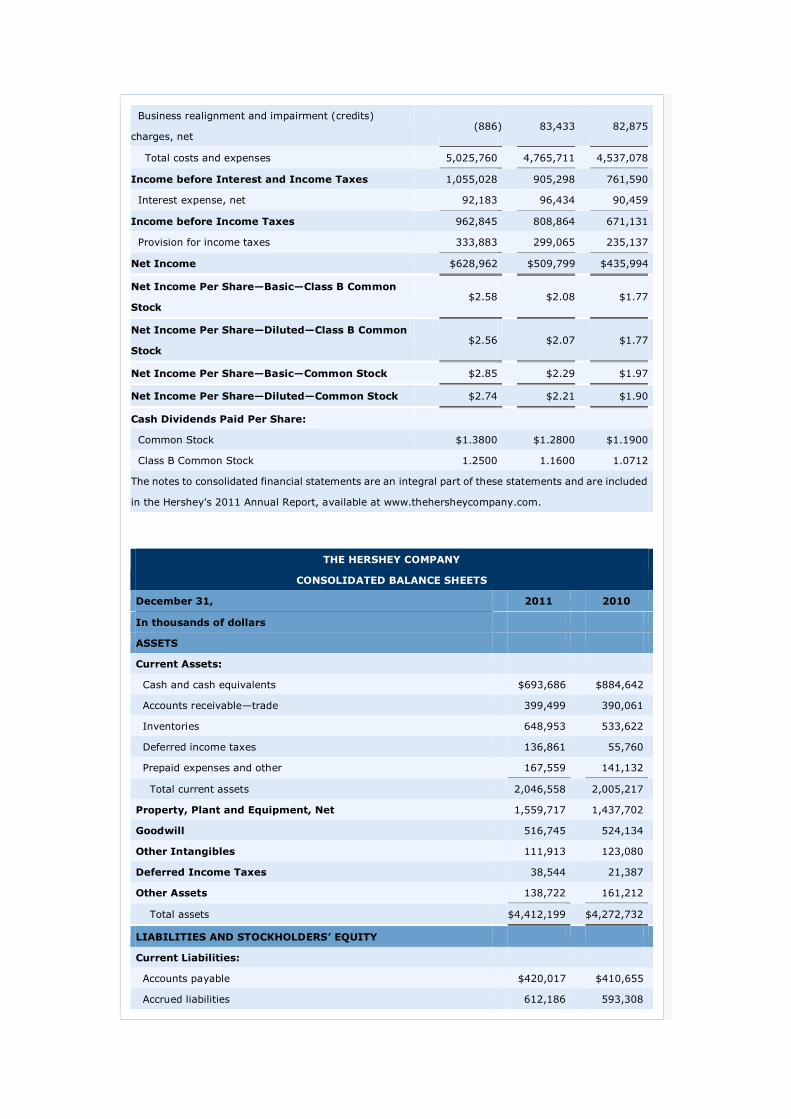
Business realignment and impairment (credits)
charges, net (886 )
83,433
82,875
Total costs and expenses
5,025,760
4,765,711
4,537,078
Income before Interest and Income Taxes
1,055,028
905,298
761,590
Interest expense, net
92,183
96,434
90,459
Income before Income Taxes
962,845
808,864
671,131
Provision for income taxes
333,883
299,065
235,137
Net Income
$628,962
$509,799
$435,994
Net Income Per Share—Basic—Class B Common
Stock $2.58
$2.08
$1.77
Net Income Per Share—Diluted—Class B Common
Stock $2.56
$2.07
$1.77
Net Income Per Share—Basic—Common Stock
$2.85
$2.29
$1.97
Net Income Per Share—Diluted—Common Stock
$2.74
$2.21
$1.90
Cash Dividends Paid Per Share:
Common Stock
$1.3800
$1.2800
$1.1900
Class B Common Stock
1.2500
1.1600
1.0712
The notes to consolidated financial statements are an integral part of these statements and are included
in the Hershey's 2011 Annual Report, available at www.thehersheycompany.com.
THE HERSHEY COMPANY
CONSOLIDATED BALANCE SHEETS
December 31,
2011
2010
In thousands of dollars
ASSETS
Current Assets:
Cash and cash equivalents
$693,686
$884,642
Accounts receivable—trade
399,499
390,061
Inventories
648,953
533,622
Deferred income taxes
136,861
55,760
Prepaid expenses and other
167,559
141,132
Total current assets
2,046,558
2,005,217
Property, Plant and Equipment, Net
1,559,717
1,437,702
Goodwill
516,745
524,134
Other Intangibles
111,913
123,080
Deferred Income Taxes
38,544
21,387
Other Assets
138,722
161,212
Total assets
$4,412,199
$4,272,732
LIABILITIES AND STOCKHOLDERS’ EQUITY
Current Liabilities:
Accounts payable
$420,017
$410,655
Accrued liabilities
612,186
593,308
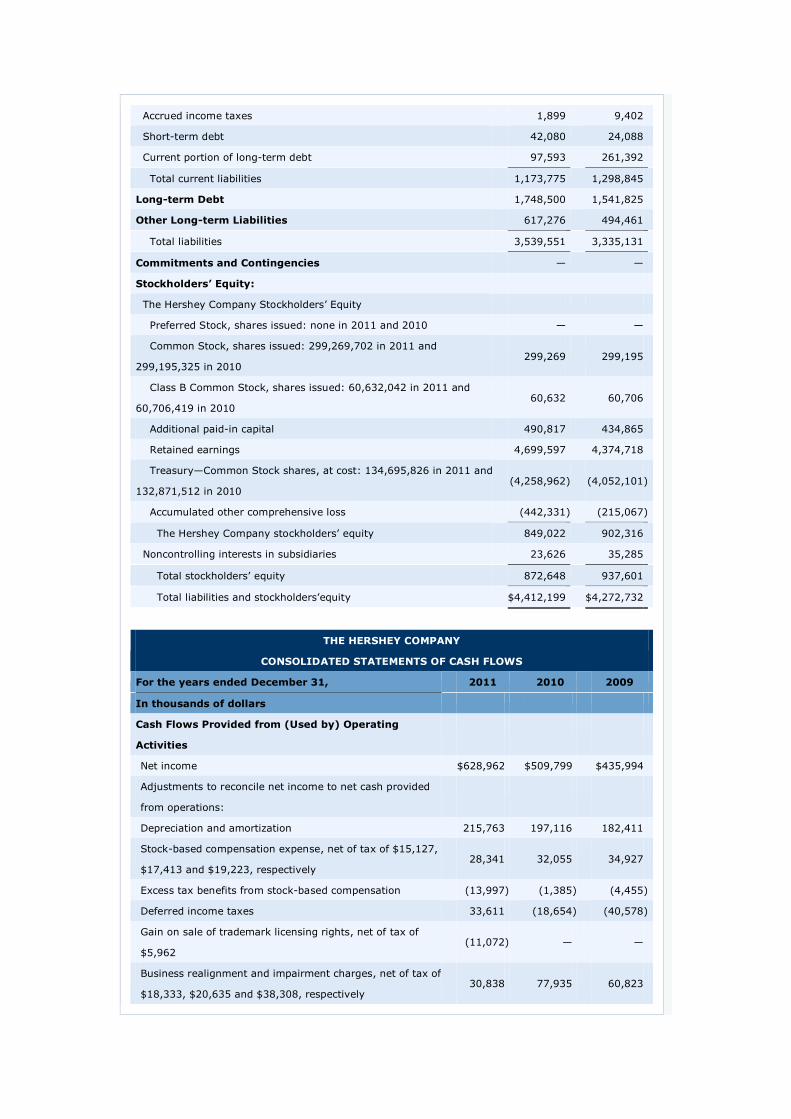
Accrued income taxes
1,899
9,402
Short-term debt
42,080
24,088
Current portion of long-term debt
97,593
261,392
Total current liabilities
1,173,775
1,298,845
Long-term Debt
1,748,500
1,541,825
Other Long-term Liabilities
617,276
494,461
Total liabilities
3,539,551
3,335,131
Commitments and Contingencies
—
—
Stockholders’ Equity:
The Hershey Company Stockholders’ Equity
Preferred Stock, shares issued: none in 2011 and 2010
—
—
Common Stock, shares issued: 299,269,702 in 2011 and
299,195,325 in 2010 299,269
299,195
Class B Common Stock, shares issued: 60,632,042 in 2011 and
60,706,419 in 2010 60,632
60,706
Additional paid-in capital
490,817
434,865
Retained earnings
4,699,597
4,374,718
Treasury—Common Stock shares, at cost: 134,695,826 in 2011 and
132,871,512 in 2010 (4,258,962 )
(4,052,101 )
Accumulated other comprehensive loss
(442,331 )
(215,067 )
The Hershey Company stockholders’ equity
849,022
902,316
Noncontrolling interests in subsidiaries
23,626
35,285
Total stockholders’ equity
872,648
937,601
Total liabilities and stockholders’equity
$4,412,199
$4,272,732
THE HERSHEY COMPANY
CONSOLIDATED STATEMENTS OF CASH FLOWS
For the years ended December 31,
2011
2010
2009
In thousands of dollars
Cash Flows Provided from (Used by) Operating
Activities
Net income
$628,962
$509,799
$435,994
Adjustments to reconcile net income to net cash provided
from operations:
Depreciation and amortization
215,763
197,116
182,411
Stock-based compensation expense, net of tax of $15,127,
$17,413 and $19,223, respectively 28,341
32,055
34,927
Excess tax benefits from stock-based compensation
(13,997 )
(1,385 )
(4,455 )
Deferred income taxes
33,611
(18,654 )
(40,578 )
Gain on sale of trademark licensing rights, net of tax of
$5,962 (11,072 )
—
—
Business realignment and impairment charges, net of tax of
$18,333, $20,635 and $38,308, respectively 30,838
77,935
60,823

Contributions to pension plans
(8,861 )
(6,073 )
(54,457 )
Changes in assets and liabilities, net of effects from business
acquisitions and divestitures:
Accounts receivable—trade
(9,438 )
20,329
46,584
Inventories
(115,331 )
(13,910 )
74,000
Accounts payable
7,860
90,434
37,228
Other assets and liabilities
(205,809 )
13,777
293,272
Net Cash Provided from Operating Activities
580,867
901,423
1,065,749
Cash Flows Provided from (Used by) Investing
Activities
Capital additions
(323,961 )
(179,538 )
(126,324 )
Capitalized software additions
(23,606 )
(21,949 )
(19,146 )
Proceeds from sales of property, plant and equipment
312
2,201
10,364
Proceeds from sales of trademark licensing rights
20,000
—
—
Business acquisitions
(5,750 )
—
(15,220 )
Net Cash (Used by) Investing Activities
(333,005 )
(199,286 )
(150,326 )
Cash Flows Provided from (Used by) Financing
Activities
Net change in short-term borrowings
10,834
1,156
(458,047 )
Long-term borrowings
249,126
348,208
—
Repayment of long-term debt
(256,189 )
(71,548 )
(8,252 )
Proceeds from lease financing agreement
47,601
—
—
Cash dividends paid
(304,083 )
(283,434 )
(263,403 )
Exercise of stock options
184,411
92,033
28,318
Excess tax benefits from stock-based compensation
13,997
1,385
4,455
Contributions from noncontrolling interests in subsidiaries
—
10,199
7,322
Repurchase of Common Stock
(384,515 )
(169,099 )
(9,314 )
Net Cash (Used by) Financing Activities
(438,818 )
(71,100 )
(698,921 )
(Decrease) Increase in Cash and Cash Equivalents
(190,956 )
631,037
216,502
Cash and Cash Equivalents as of January 1
884,642
253,605
37,103
Cash and Cash Equivalents as of December 31
$693,686
$884,642
$253,605
Interest Paid
$97,892
$97,932
$91,623
Income Taxes Paid
292,315
350,948
252,230
TOOTSIE ROLL INDUSTRIES, INC. AND SUBSIDIARIES
CONSOLIDATED STATEMENTS OF
Earnings, Comprehensive Earnings and Retained Earnings (in thousands except per share
data)
For the year ended December 31,
2011
2010
2009
Net product sales
$528,369
$517,149
$495,592
Rental and royalty revenue
4,136
4,299
3,739
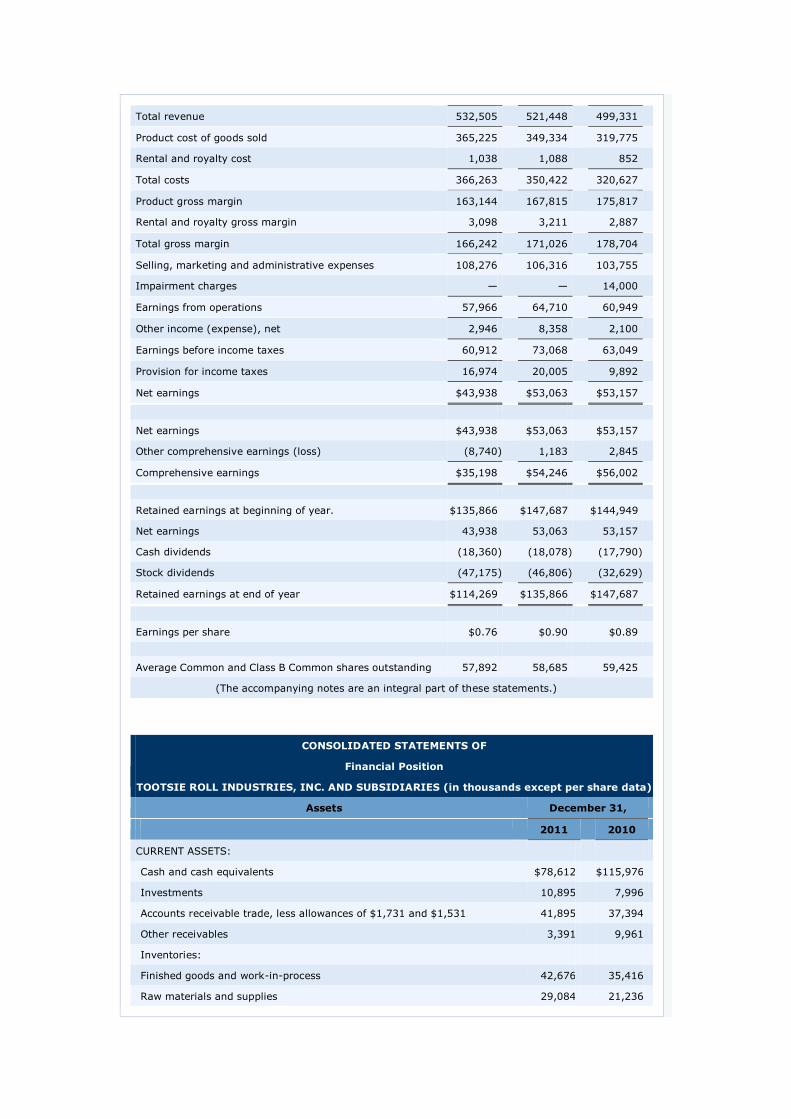
Total revenue
532,505
521,448
499,331
Product cost of goods sold
365,225
349,334
319,775
Rental and royalty cost
1,038
1,088
852
Total costs
366,263
350,422
320,627
Product gross margin
163,144
167,815
175,817
Rental and royalty gross margin
3,098
3,211
2,887
Total gross margin
166,242
171,026
178,704
Selling, marketing and administrative expenses
108,276
106,316
103,755
Impairment charges
—
—
14,000
Earnings from operations
57,966
64,710
60,949
Other income (expense), net
2,946
8,358
2,100
Earnings before income taxes
60,912
73,068
63,049
Provision for income taxes
16,974
20,005
9,892
Net earnings
$43,938
$53,063
$53,157
Net earnings
$43,938
$53,063
$53,157
Other comprehensive earnings (loss)
(8,740 )
1,183
2,845
Comprehensive earnings
$35,198
$54,246
$56,002
Retained earnings at beginning of year.
$135,866
$147,687
$144,949
Net earnings
43,938
53,063
53,157
Cash dividends
(18,360 )
(18,078 )
(17,790 )
Stock dividends
(47,175 )
(46,806 )
(32,629 )
Retained earnings at end of year
$114,269
$135,866
$147,687
Earnings per share
$0.76
$0.90
$0.89
Average Common and Class B Common shares outstanding
57,892
58,685
59,425
(The accompanying notes are an integral part of these statements.)
CONSOLIDATED STATEMENTS OF
Financial Position
TOOTSIE ROLL INDUSTRIES, INC. AND SUBSIDIARIES (in thousands except per share data)
Assets
December 31,
2011
2010
CURRENT ASSETS:
Cash and cash equivalents
$78,612
$115,976
Investments
10,895
7,996
Accounts receivable trade, less allowances of $1,731 and $1,531
41,895
37,394
Other receivables
3,391
9,961
Inventories:
Finished goods and work-in-process
42,676
35,416
Raw materials and supplies
29,084
21,236
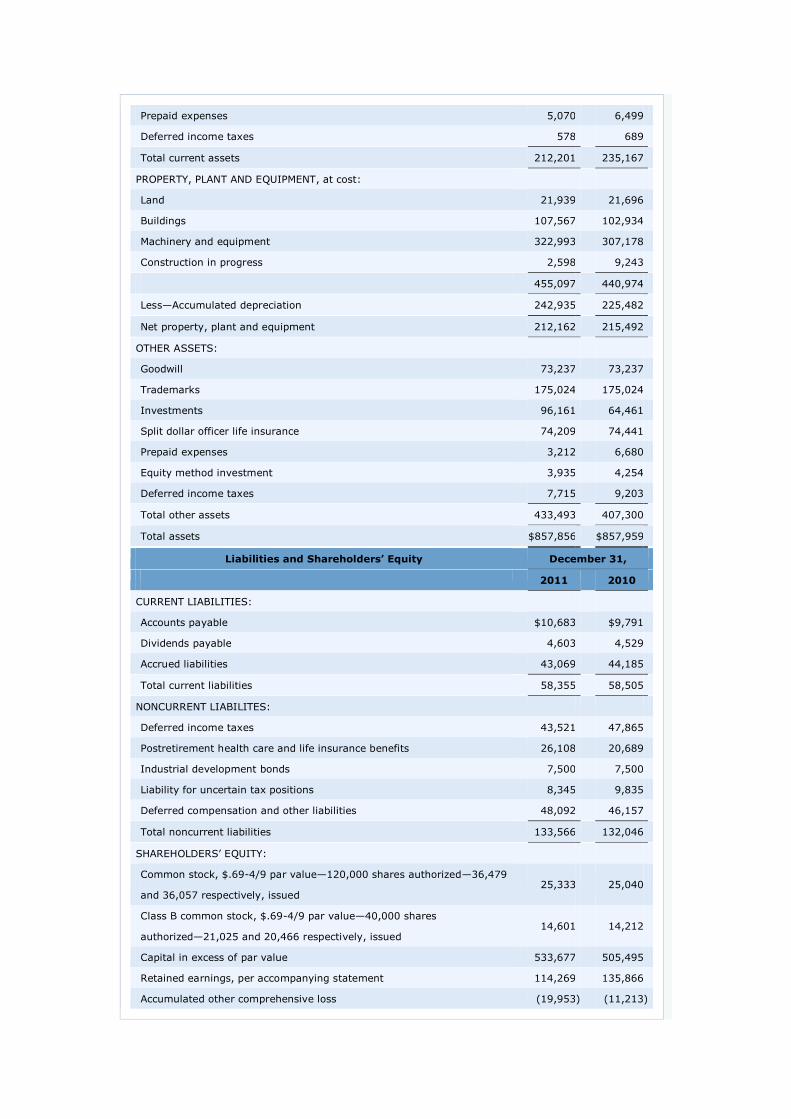
Prepaid expenses
5,070
6,499
Deferred income taxes
578
689
Total current assets
212,201
235,167
PROPERTY, PLANT AND EQUIPMENT, at cost:
Land
21,939
21,696
Buildings
107,567
102,934
Machinery and equipment
322,993
307,178
Construction in progress
2,598
9,243
455,097
440,974
Less—Accumulated depreciation
242,935
225,482
Net property, plant and equipment
212,162
215,492
OTHER ASSETS:
Goodwill
73,237
73,237
Trademarks
175,024
175,024
Investments
96,161
64,461
Split dollar officer life insurance
74,209
74,441
Prepaid expenses
3,212
6,680
Equity method investment
3,935
4,254
Deferred income taxes
7,715
9,203
Total other assets
433,493
407,300
Total assets
$857,856
$857,959
Liabilities and Shareholders’ Equity
December 31,
2011
2010
CURRENT LIABILITIES:
Accounts payable
$10,683
$9,791
Dividends payable
4,603
4,529
Accrued liabilities
43,069
44,185
Total current liabilities
58,355
58,505
NONCURRENT LIABILITES:
Deferred income taxes
43,521
47,865
Postretirement health care and life insurance benefits
26,108
20,689
Industrial development bonds
7,500
7,500
Liability for uncertain tax positions
8,345
9,835
Deferred compensation and other liabilities
48,092
46,157
Total noncurrent liabilities
133,566
132,046
SHAREHOLDERS’ EQUITY:
Common stock, $.69-4/9 par value—120,000 shares authorized—36,479
and 36,057 respectively, issued 25,333
25,040
Class B common stock, $.69-4/9 par value—40,000 shares
authorized—21,025 and 20,466 respectively, issued 14,601
14,212
Capital in excess of par value
533,677
505,495
Retained earnings, per accompanying statement
114,269
135,866
Accumulated other comprehensive loss
(19,953 )
(11,213 )
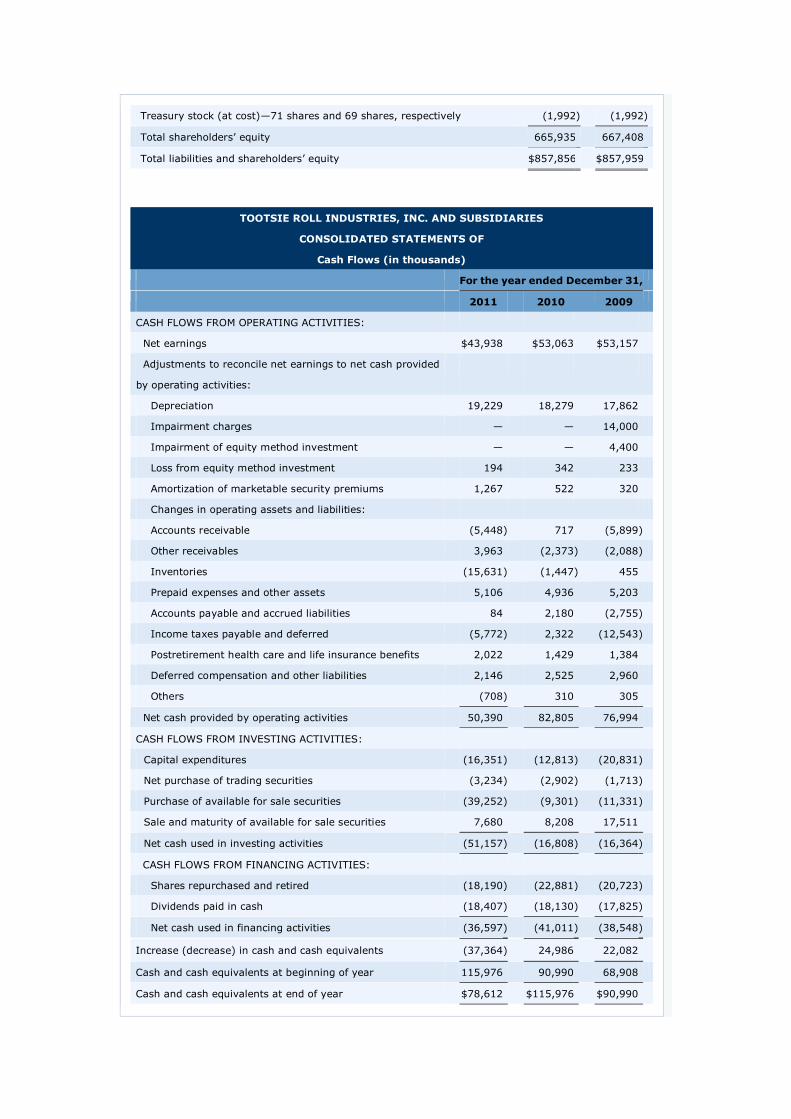
Treasury stock (at cost)—71 shares and 69 shares, respectively
(1,992 )
(1,992 )
Total shareholders’ equity
665,935
667,408
Total liabilities and shareholders’ equity
$857,856
$857,959
TOOTSIE ROLL INDUSTRIES, INC. AND SUBSIDIARIES
CONSOLIDATED STATEMENTS OF
Cash Flows (in thousands)
For the year ended December 31,
2011
2010
2009
CASH FLOWS FROM OPERATING ACTIVITIES:
Net earnings
$43,938
$53,063
$53,157
Adjustments to reconcile net earnings to net cash provided
by operating activities:
Depreciation
19,229
18,279
17,862
Impairment charges
—
—
14,000
Impairment of equity method investment
—
—
4,400
Loss from equity method investment
194
342
233
Amortization of marketable security premiums
1,267
522
320
Changes in operating assets and liabilities:
Accounts receivable
(5,448 )
717
(5,899 )
Other receivables
3,963
(2,373 )
(2,088 )
Inventories
(15,631 )
(1,447 )
455
Prepaid expenses and other assets
5,106
4,936
5,203
Accounts payable and accrued liabilities
84
2,180
(2,755 )
Income taxes payable and deferred
(5,772 )
2,322
(12,543 )
Postretirement health care and life insurance benefits
2,022
1,429
1,384
Deferred compensation and other liabilities
2,146
2,525
2,960
Others
(708 )
310
305
Net cash provided by operating activities
50,390
82,805
76,994
CASH FLOWS FROM INVESTING ACTIVITIES:
Capital expenditures
(16,351 )
(12,813 )
(20,831 )
Net purchase of trading securities
(3,234 )
(2,902 )
(1,713 )
Purchase of available for sale securities
(39,252 )
(9,301 )
(11,331 )
Sale and maturity of available for sale securities
7,680
8,208
17,511
Net cash used in investing activities
(51,157 )
(16,808 )
(16,364 )
CASH FLOWS FROM FINANCING ACTIVITIES:
Shares repurchased and retired
(18,190 )
(22,881 )
(20,723 )
Dividends paid in cash
(18,407 )
(18,130 )
(17,825 )
Net cash used in financing activities
(36,597 )
(41,011 )
(38,548 )
Increase (decrease) in cash and cash equivalents
(37,364 )
24,986
22,082
Cash and cash equivalents at beginning of year
115,976
90,990
68,908
Cash and cash equivalents at end of year
$78,612
$115,976
$90,990
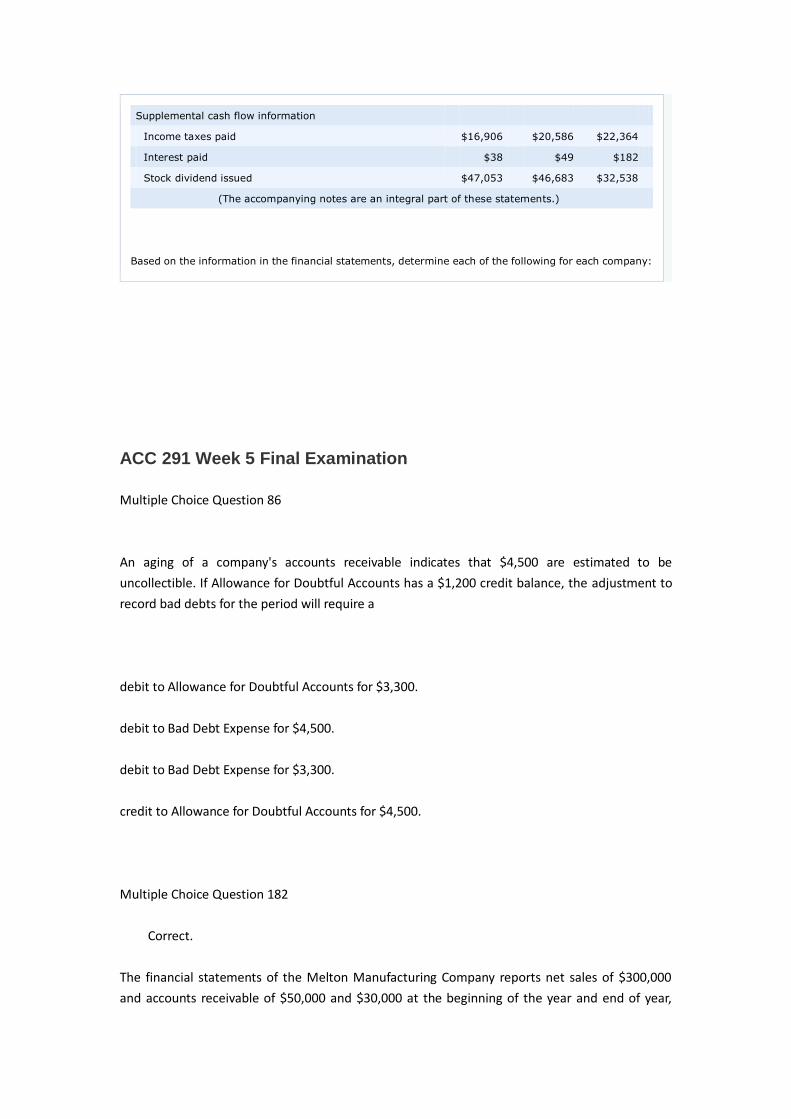
Supplemental cash flow information
Income taxes paid
$16,906
$20,586
$22,364
Interest paid
$38
$49
$182
Stock dividend issued
$47,053
$46,683
$32,538
(The accompanying notes are an integral part of these statements.)
Based on the information in the financial statements, determine each of the following for each company:
ACC 291 Week 5 Final Examination
Multiple Choice Question 86
An aging of a company's accounts receivable indicates that $4,500 are estimated to be
uncollectible. If Allowance for Doubtful Accounts has a $1,200 credit balance, the adjustment to
record bad debts for the period will require a
debit to Allowance for Doubtful Accounts for $3,300.
debit to Bad Debt Expense for $4,500.
debit to Bad Debt Expense for $3,300.
credit to Allowance for Doubtful Accounts for $4,500.
Multiple Choice Question 182
Correct.
The financial statements of the Melton Manufacturing Company reports net sales of $300,000
and accounts receivable of $50,000 and $30,000 at the beginning of the year and end of year,
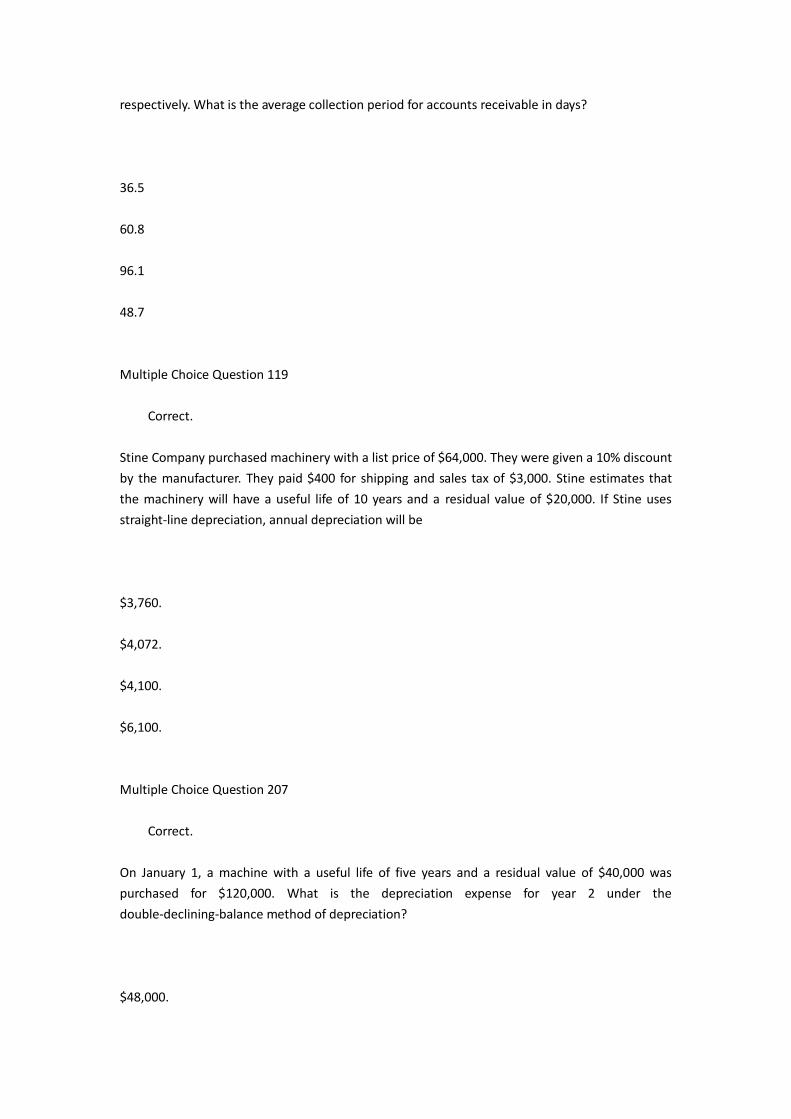
respectively. What is the average collection period for accounts receivable in days?
36.5
60.8
96.1
48.7
Multiple Choice Question 119
Correct.
Stine Company purchased machinery with a list price of $64,000. They were given a 10% discount
by the manufacturer. They paid $400 for shipping and sales tax of $3,000. Stine estimates that
the machinery will have a useful life of 10 years and a residual value of $20,000. If Stine uses
straight-line depreciation, annual depreciation will be
$3,760.
$4,072.
$4,100.
$6,100.
Multiple Choice Question 207
Correct.
On January 1, a machine with a useful life of five years and a residual value of $40,000 was
purchased for $120,000. What is the depreciation expense for year 2 under the
double-declining-balance method of depreciation?
$48,000.
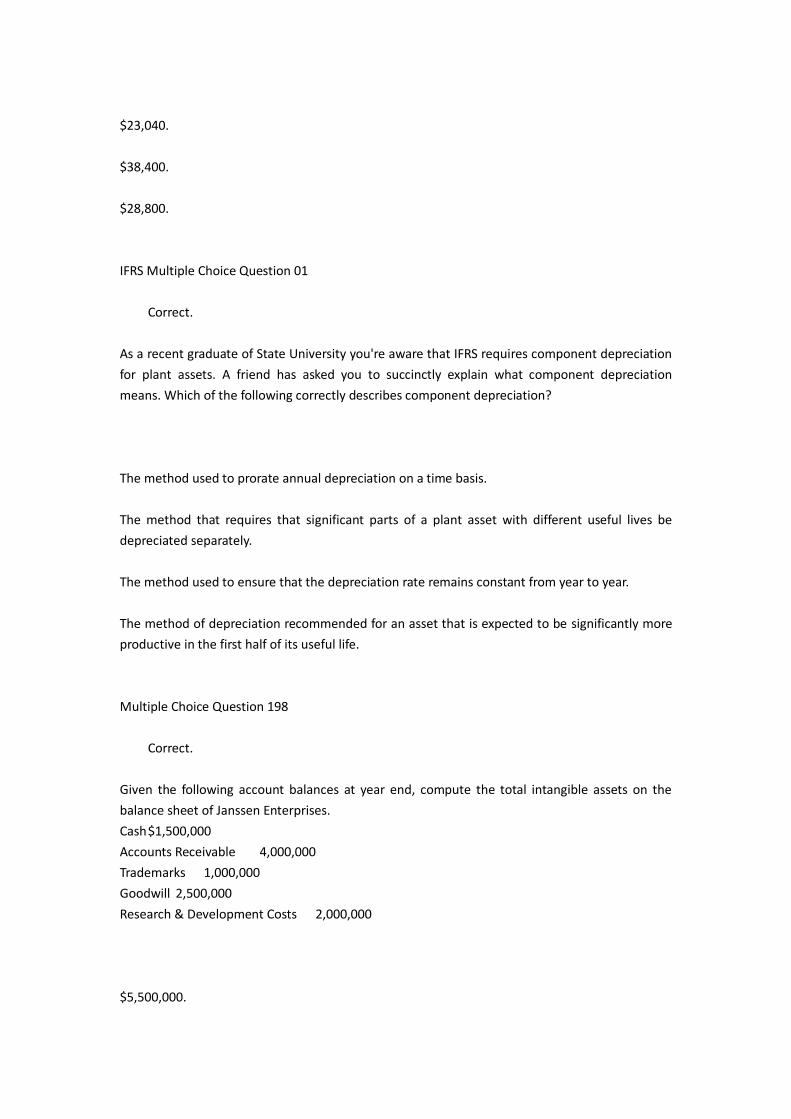
$23,040.
$38,400.
$28,800.
IFRS Multiple Choice Question 01
Correct.
As a recent graduate of State University you're aware that IFRS requires component depreciation
for plant assets. A friend has asked you to succinctly explain what component depreciation
means. Which of the following correctly describes component depreciation?
The method used to prorate annual depreciation on a time basis.
The method that requires that significant parts of a plant asset with different useful lives be
depreciated separately.
The method used to ensure that the depreciation rate remains constant from year to year.
The method of depreciation recommended for an asset that is expected to be significantly more
productive in the first half of its useful life.
Multiple Choice Question 198
Correct.
Given the following account balances at year end, compute the total intangible assets on the
balance sheet of Janssen Enterprises.
Cash $1,500,000
Accounts Receivable 4,000,000
Trademarks 1,000,000
Goodwill 2,500,000
Research & Development Costs 2,000,000
$5,500,000.
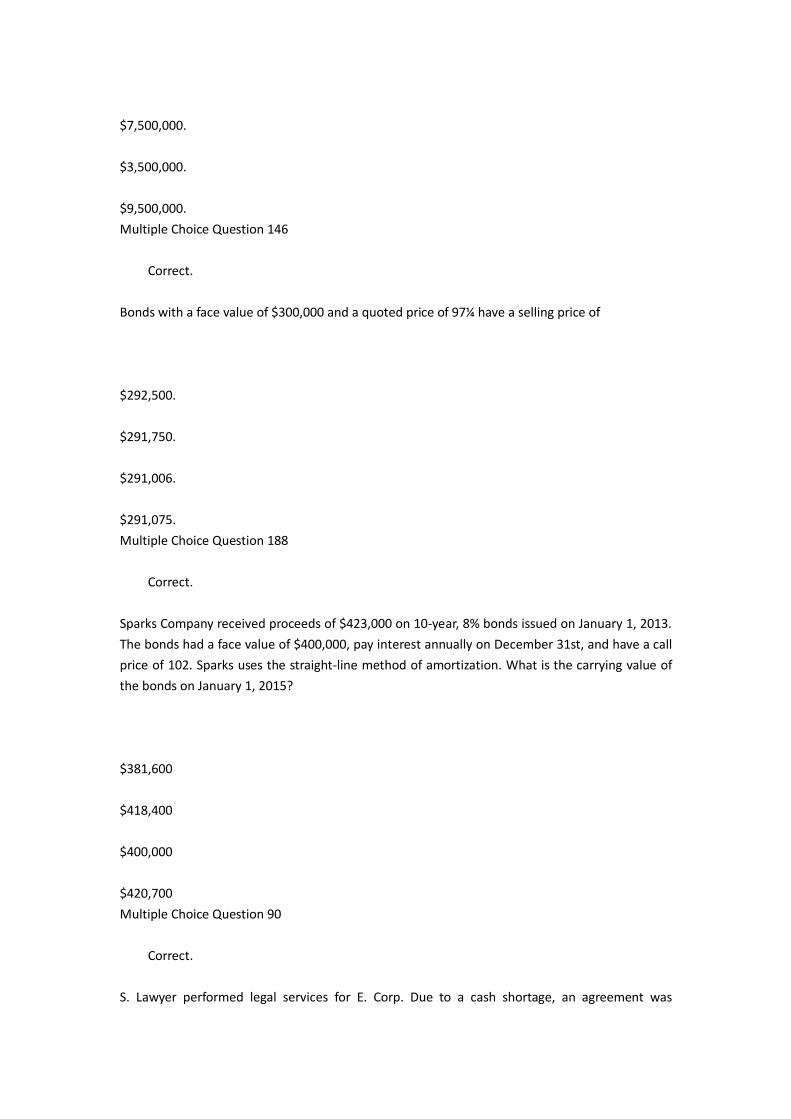
$7,500,000.
$3,500,000.
$9,500,000.
Multiple Choice Question 146
Correct.
Bonds with a face value of $300,000 and a quoted price of 97¼ have a selling price of
$292,500.
$291,750.
$291,006.
$291,075.
Multiple Choice Question 188
Correct.
Sparks Company received proceeds of $423,000 on 10-year, 8% bonds issued on January 1, 2013.
The bonds had a face value of $400,000, pay interest annually on December 31st, and have a call
price of 102. Sparks uses the straight-line method of amortization. What is the carrying value of
the bonds on January 1, 2015?
$381,600
$418,400
$400,000
$420,700
Multiple Choice Question 90
Correct.
S. Lawyer performed legal services for E. Corp. Due to a cash shortage, an agreement was
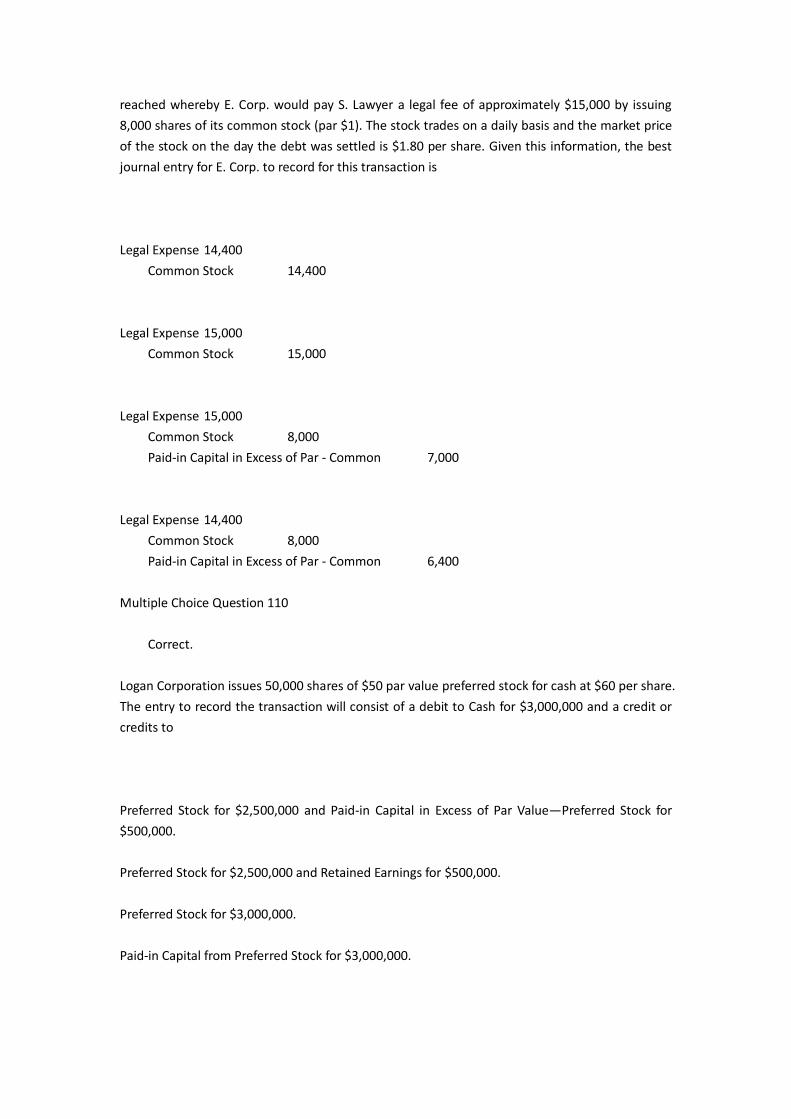
reached whereby E. Corp. would pay S. Lawyer a legal fee of approximately $15,000 by issuing
8,000 shares of its common stock (par $1). The stock trades on a daily basis and the market price
of the stock on the day the debt was settled is $1.80 per share. Given this information, the best
journal entry for E. Corp. to record for this transaction is
Legal Expense 14,400
Common Stock 14,400
Legal Expense 15,000
Common Stock 15,000
Legal Expense 15,000
Common Stock 8,000
Paid-in Capital in Excess of Par - Common 7,000
Legal Expense 14,400
Common Stock 8,000
Paid-in Capital in Excess of Par - Common 6,400
Multiple Choice Question 110
Correct.
Logan Corporation issues 50,000 shares of $50 par value preferred stock for cash at $60 per share.
The entry to record the transaction will consist of a debit to Cash for $3,000,000 and a credit or
credits to
Preferred Stock for $2,500,000 and Paid-in Capital in Excess of Par Value—Preferred Stock for
$500,000.
Preferred Stock for $2,500,000 and Retained Earnings for $500,000.
Preferred Stock for $3,000,000.
Paid-in Capital from Preferred Stock for $3,000,000.
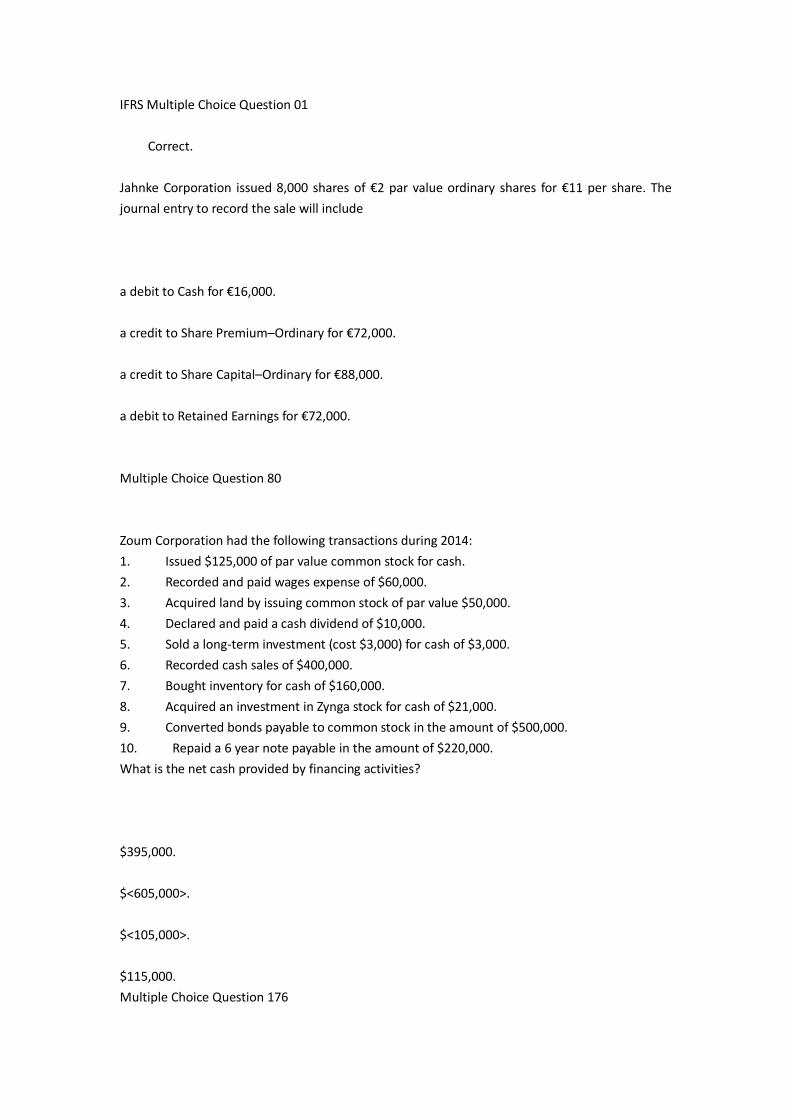
IFRS Multiple Choice Question 01
Correct.
Jahnke Corporation issued 8,000 shares of €2 par value ordinary shares for €11 per share. The
journal entry to record the sale will include
a debit to Cash for €16,000.
a credit to Share Premium–Ordinary for €72,000.
a credit to Share Capital–Ordinary for €88,000.
a debit to Retained Earnings for €72,000.
Multiple Choice Question 80
Zoum Corporation had the following transactions during 2014:
1. Issued $125,000 of par value common stock for cash.
2. Recorded and paid wages expense of $60,000.
3. Acquired land by issuing common stock of par value $50,000.
4. Declared and paid a cash dividend of $10,000.
5. Sold a long-term investment (cost $3,000) for cash of $3,000.
6. Recorded cash sales of $400,000.
7. Bought inventory for cash of $160,000.
8. Acquired an investment in Zynga stock for cash of $21,000.
9. Converted bonds payable to common stock in the amount of $500,000.
10. Repaid a 6 year note payable in the amount of $220,000.
What is the net cash provided by financing activities?
$395,000.
$<605,000>.
$<105,000>.
$115,000.
Multiple Choice Question 176
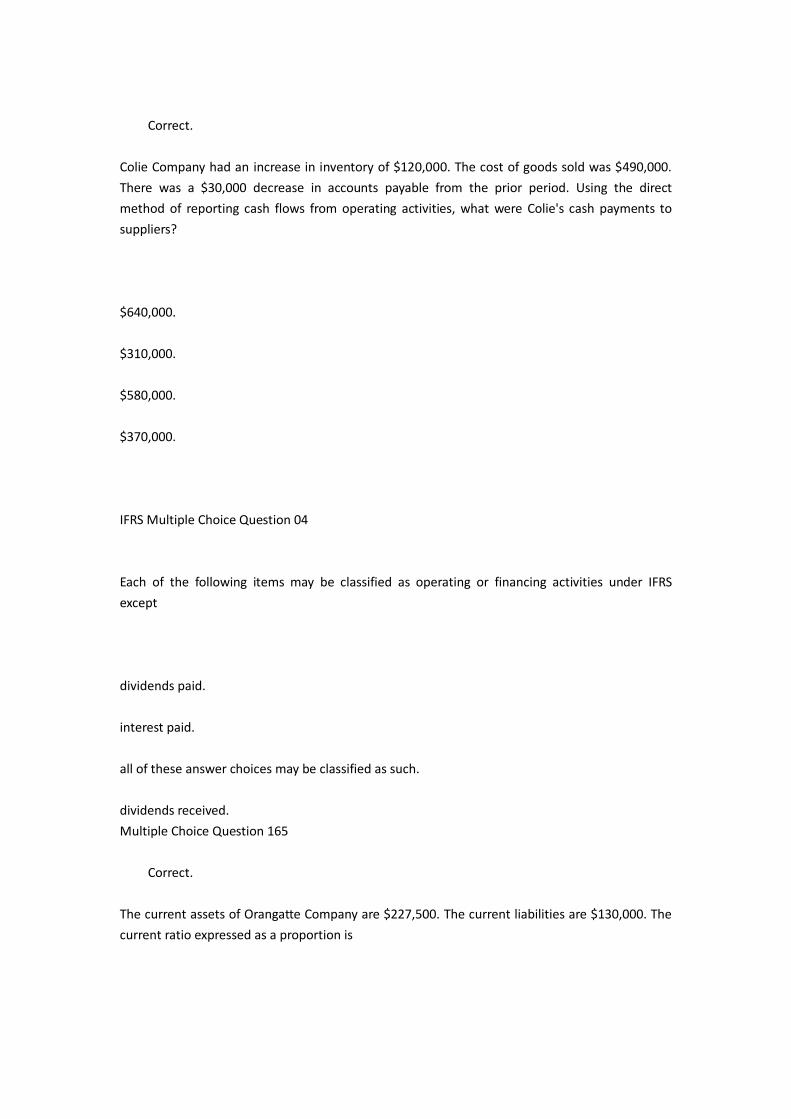
Correct.
Colie Company had an increase in inventory of $120,000. The cost of goods sold was $490,000.
There was a $30,000 decrease in accounts payable from the prior period. Using the direct
method of reporting cash flows from operating activities, what were Colie's cash payments to
suppliers?
$640,000.
$310,000.
$580,000.
$370,000.
IFRS Multiple Choice Question 04
Each of the following items may be classified as operating or financing activities under IFRS
except
dividends paid.
interest paid.
all of these answer choices may be classified as such.
dividends received.
Multiple Choice Question 165
Correct.
The current assets of Orangatte Company are $227,500. The current liabilities are $130,000. The
current ratio expressed as a proportion is
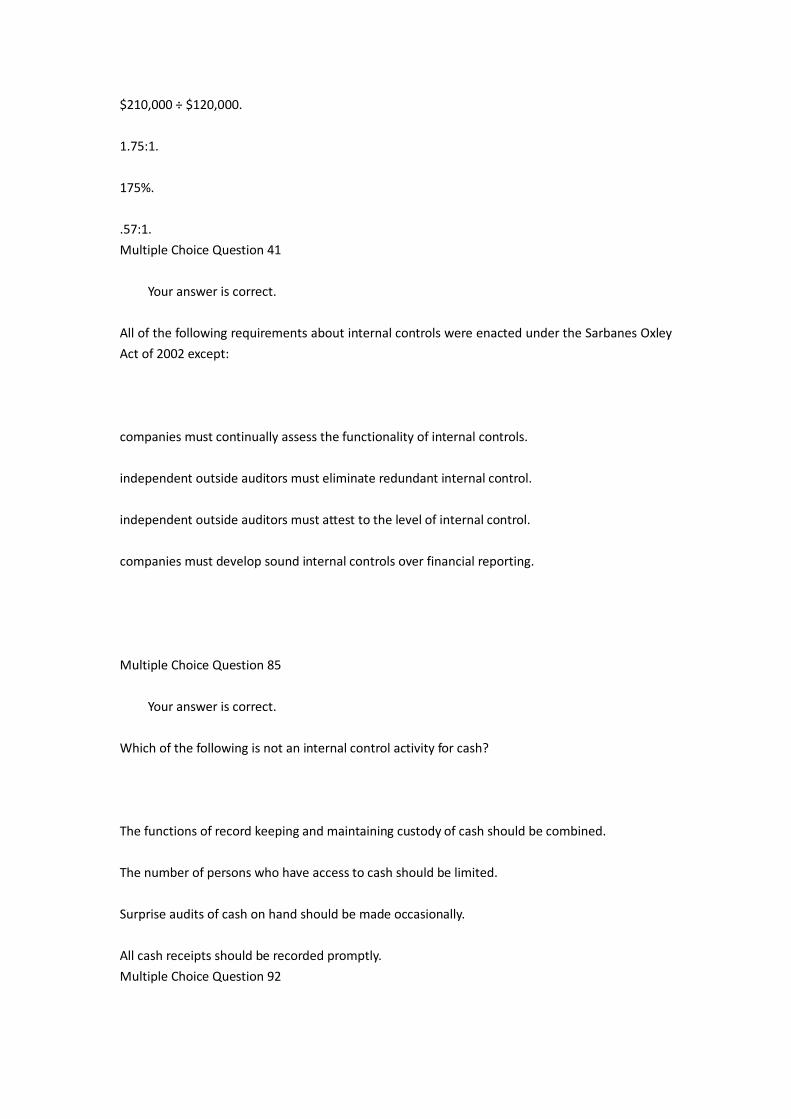
$210,000 ÷ $120,000.
1.75:1.
175%.
.57:1.
Multiple Choice Question 41
Your answer is correct.
All of the following requirements about internal controls were enacted under the Sarbanes Oxley
Act of 2002 except:
companies must continually assess the functionality of internal controls.
independent outside auditors must eliminate redundant internal control.
independent outside auditors must attest to the level of internal control.
companies must develop sound internal controls over financial reporting.
Multiple Choice Question 85
Your answer is correct.
Which of the following is not an internal control activity for cash?
The functions of record keeping and maintaining custody of cash should be combined.
The number of persons who have access to cash should be limited.
Surprise audits of cash on hand should be made occasionally.
All cash receipts should be recorded promptly.
Multiple Choice Question 92
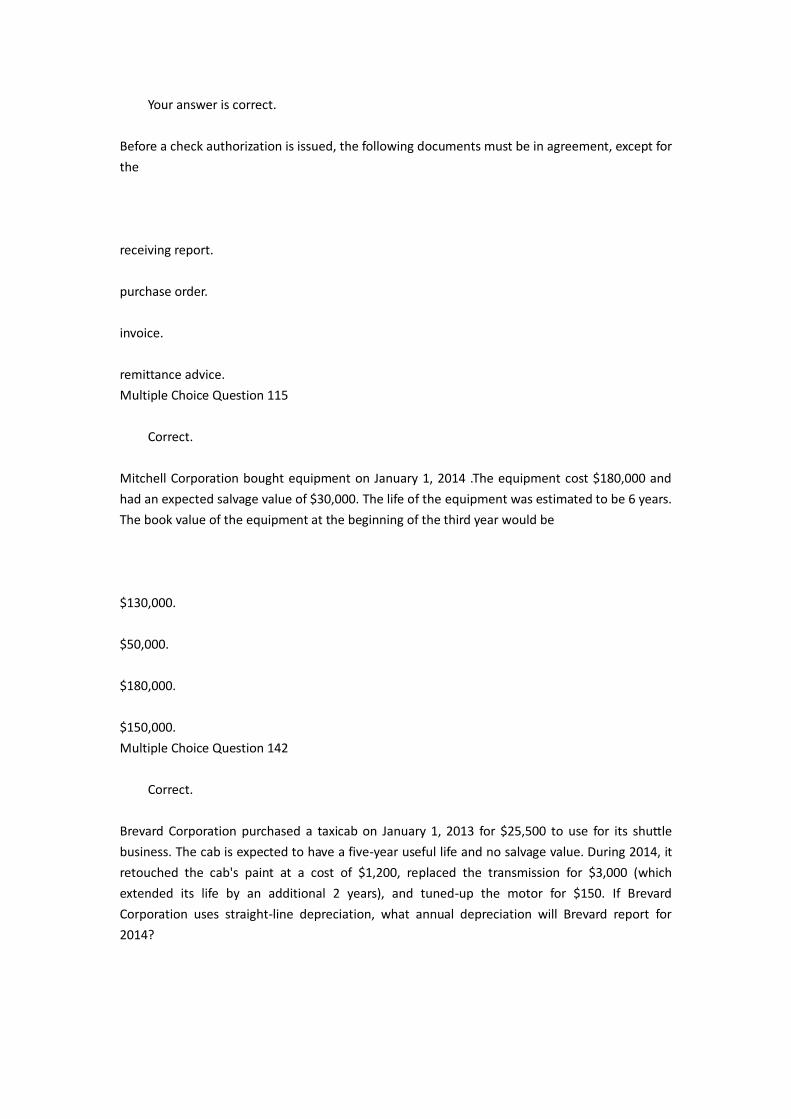
Your answer is correct.
Before a check authorization is issued, the following documents must be in agreement, except for
the
receiving report.
purchase order.
invoice.
remittance advice.
Multiple Choice Question 115
Correct.
Mitchell Corporation bought equipment on January 1, 2014 .The equipment cost $180,000 and
had an expected salvage value of $30,000. The life of the equipment was estimated to be 6 years.
The book value of the equipment at the beginning of the third year would be
$130,000.
$50,000.
$180,000.
$150,000.
Multiple Choice Question 142
Correct.
Brevard Corporation purchased a taxicab on January 1, 2013 for $25,500 to use for its shuttle
business. The cab is expected to have a five-year useful life and no salvage value. During 2014, it
retouched the cab's paint at a cost of $1,200, replaced the transmission for $3,000 (which
extended its life by an additional 2 years), and tuned-up the motor for $150. If Brevard
Corporation uses straight-line depreciation, what annual depreciation will Brevard report for
2014?
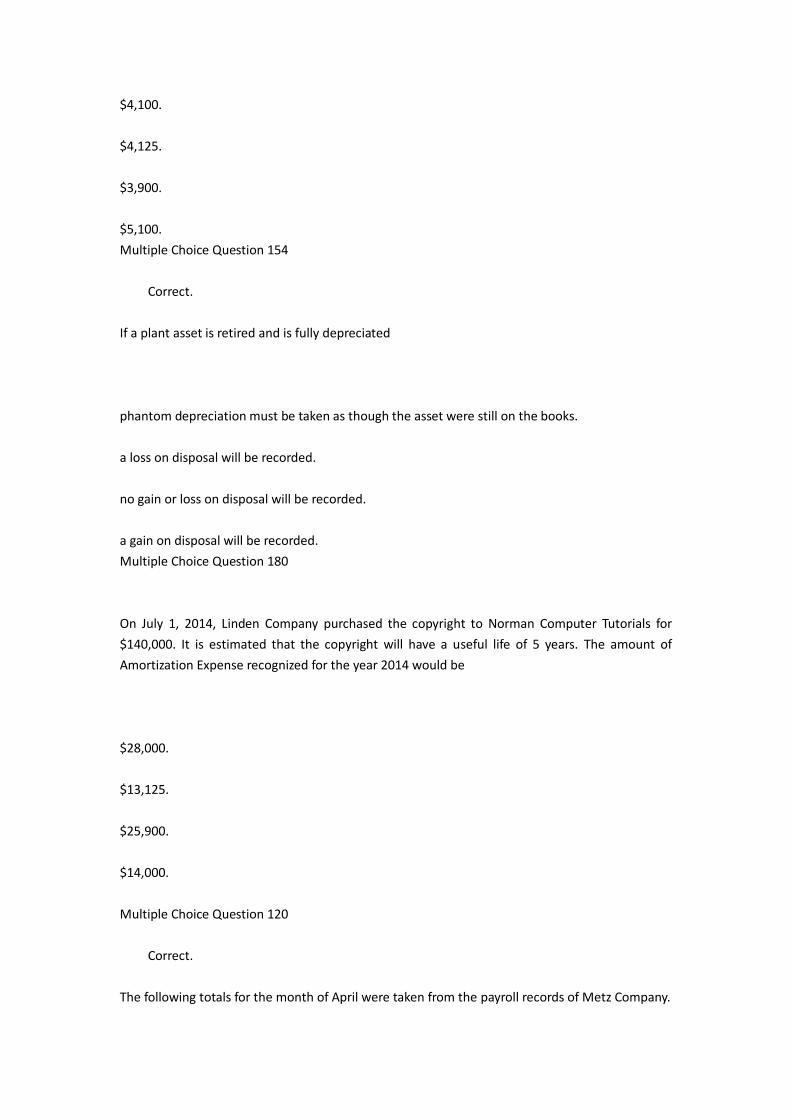
$4,100.
$4,125.
$3,900.
$5,100.
Multiple Choice Question 154
Correct.
If a plant asset is retired and is fully depreciated
phantom depreciation must be taken as though the asset were still on the books.
a loss on disposal will be recorded.
no gain or loss on disposal will be recorded.
a gain on disposal will be recorded.
Multiple Choice Question 180
On July 1, 2014, Linden Company purchased the copyright to Norman Computer Tutorials for
$140,000. It is estimated that the copyright will have a useful life of 5 years. The amount of
Amortization Expense recognized for the year 2014 would be
$28,000.
$13,125.
$25,900.
$14,000.
Multiple Choice Question 120
Correct.
The following totals for the month of April were taken from the payroll records of Metz Company.
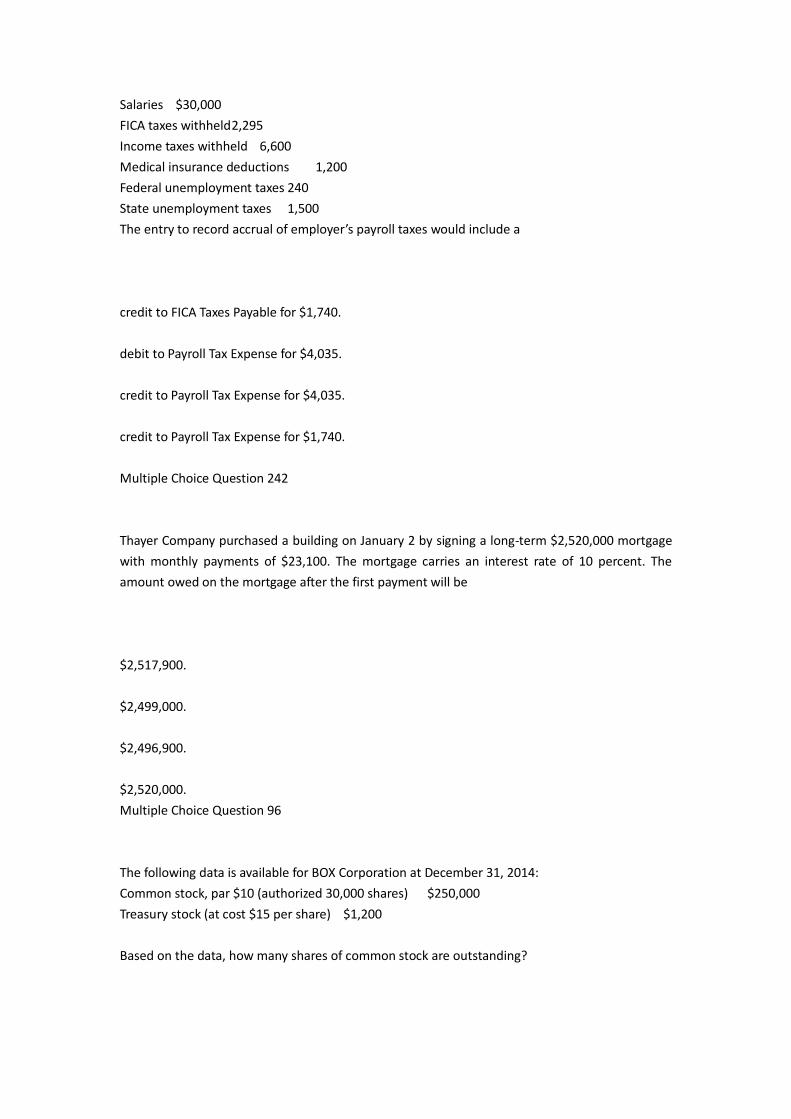
Salaries $30,000
FICA taxes withheld 2,295
Income taxes withheld 6,600
Medical insurance deductions 1,200
Federal unemployment taxes 240
State unemployment taxes 1,500
The entry to record accrual of employer’s payroll taxes would include a
credit to FICA Taxes Payable for $1,740.
debit to Payroll Tax Expense for $4,035.
credit to Payroll Tax Expense for $4,035.
credit to Payroll Tax Expense for $1,740.
Multiple Choice Question 242
Thayer Company purchased a building on January 2 by signing a long-term $2,520,000 mortgage
with monthly payments of $23,100. The mortgage carries an interest rate of 10 percent. The
amount owed on the mortgage after the first payment will be
$2,517,900.
$2,499,000.
$2,496,900.
$2,520,000.
Multiple Choice Question 96
The following data is available for BOX Corporation at December 31, 2014:
Common stock, par $10 (authorized 30,000 shares) $250,000
Treasury stock (at cost $15 per share) $1,200
Based on the data, how many shares of common stock are outstanding?
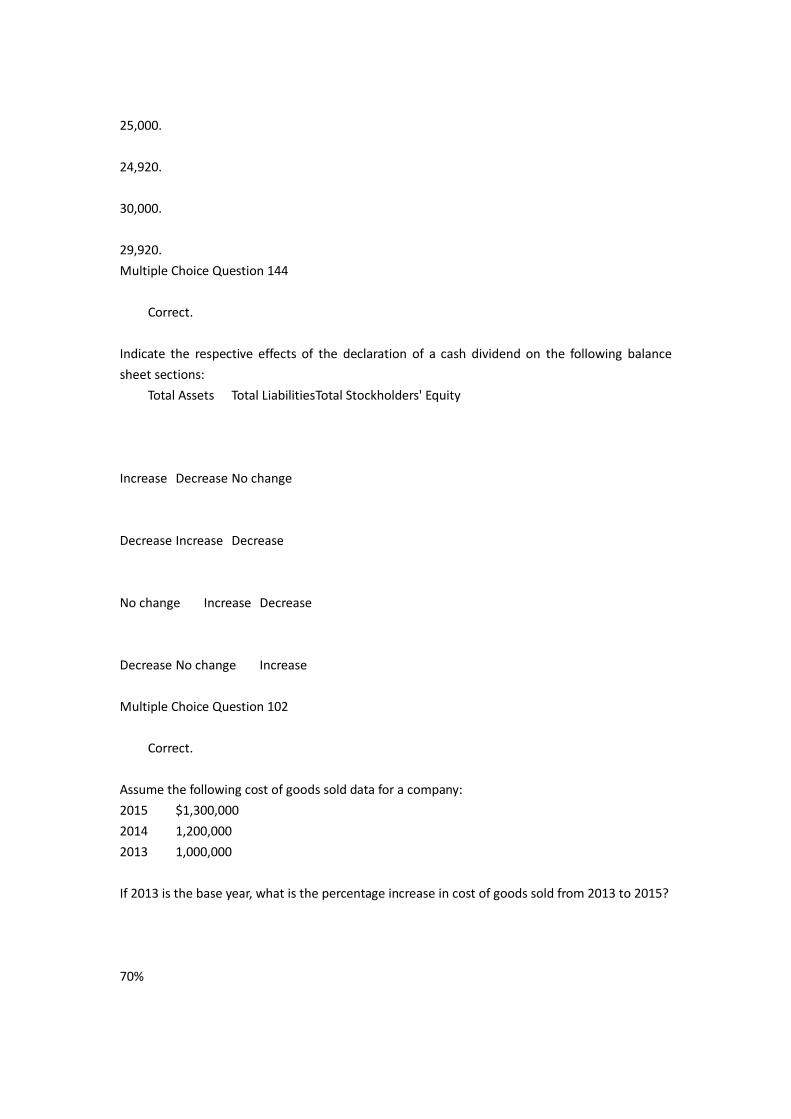
25,000.
24,920.
30,000.
29,920.
Multiple Choice Question 144
Correct.
Indicate the respective effects of the declaration of a cash dividend on the following balance
sheet sections:
Total Assets Total Liabilities Total Stockholders' Equity
Increase Decrease No change
Decrease Increase Decrease
No change Increase Decrease
Decrease No change Increase
Multiple Choice Question 102
Correct.
Assume the following cost of goods sold data for a company:
2015 $1,300,000
2014 1,200,000
2013 1,000,000
If 2013 is the base year, what is the percentage increase in cost of goods sold from 2013 to 2015?
70%
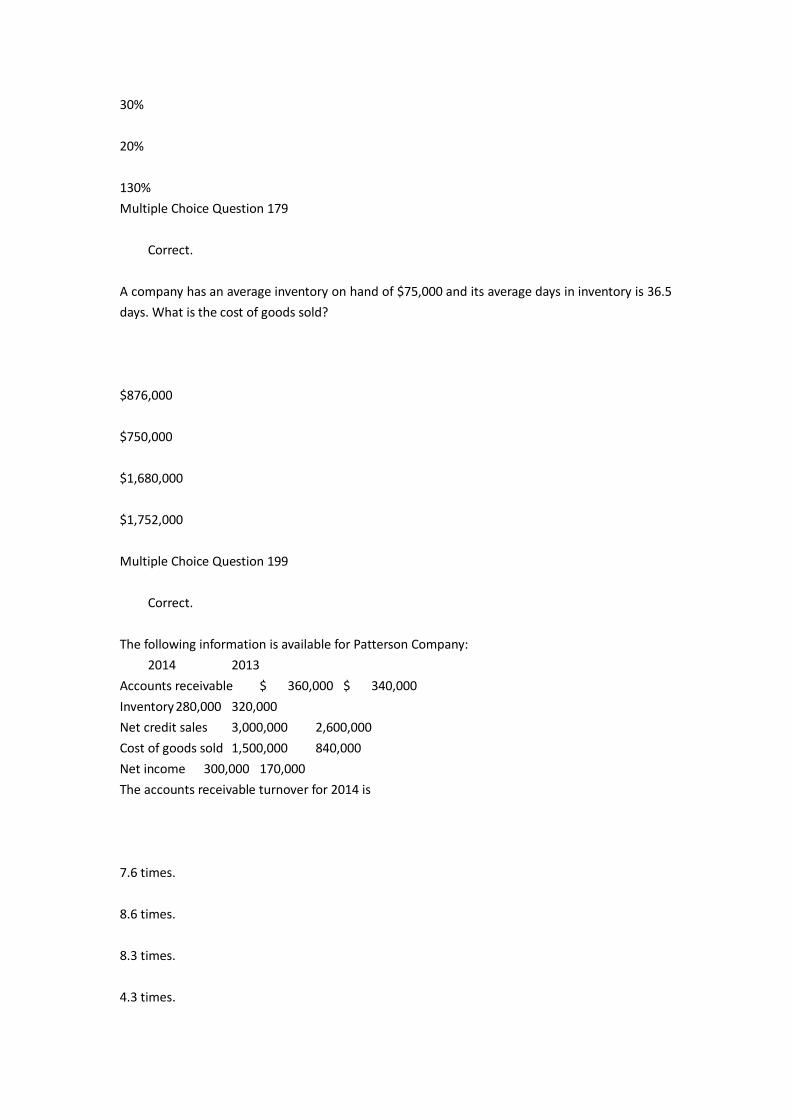
30%
20%
130%
Multiple Choice Question 179
Correct.
A company has an average inventory on hand of $75,000 and its average days in inventory is 36.5
days. What is the cost of goods sold?
$876,000
$750,000
$1,680,000
$1,752,000
Multiple Choice Question 199
Correct.
The following information is available for Patterson Company:
2014 2013
Accounts receivable $ 360,000 $ 340,000
Inventory 280,000 320,000
Net credit sales 3,000,000 2,600,000
Cost of goods sold 1,500,000 840,000
Net income 300,000 170,000
The accounts receivable turnover for 2014 is
7.6 times.
8.6 times.
8.3 times.
4.3 times.
Multiple Choice Question 221
Correct.
All of the following situtations below might indicate a company has a low quality of earnings
except
Revenue is recognized when earned.
Adoption of a different inventory method for each of the last three years.
A lack of disclosure about guaranteed payments that were mentioned in the MD&A of the annual
report.
Maintenance costs are capitalized and then depreciated.
IFRS Multiple Choice Question 05
IFRS
requires that receivables with different characteristics should be reported separately.
implies that receivables with different characteristics should be reported as one unsegregated
amount.
requires that receivables with different characteristics should be reported as one unsegregated
amount.
implies that receivables with different characteristics should be reported separately.