Embed Size (px)
Citation preview
Designing cities; designing the future Dimitri Zenghelis
ICN Summit, Copenhagen, 21 May 2014
1

2
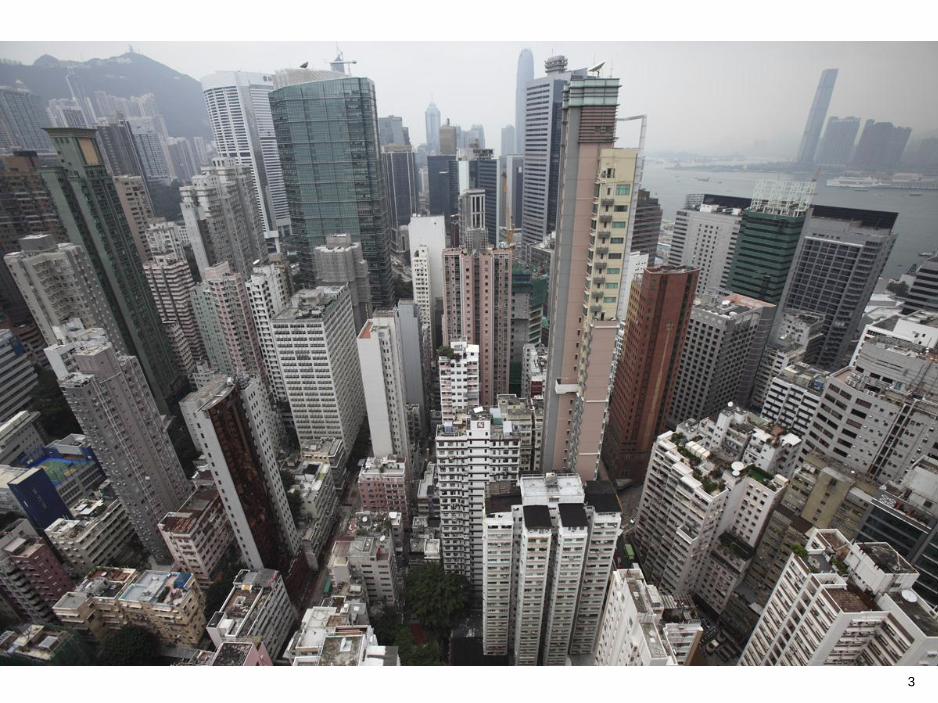
Over 50% of the global population now live in cities and urban
areas, rising to 70% by 2050
SOURCE: LSE Cities based on United Nations World Urbanization Prospects, 2007 Revision
The 200 largest metropolitan economies account for 20% of global population yet generate
46% of global GDP.
Billions
2050 2040 2030 2020 2010 2000 1990 1980 1970 1960 1950
Global
population
Urban
population
Rural
population
70% Urban
50% Urban
30% Urban
Cities
3
4
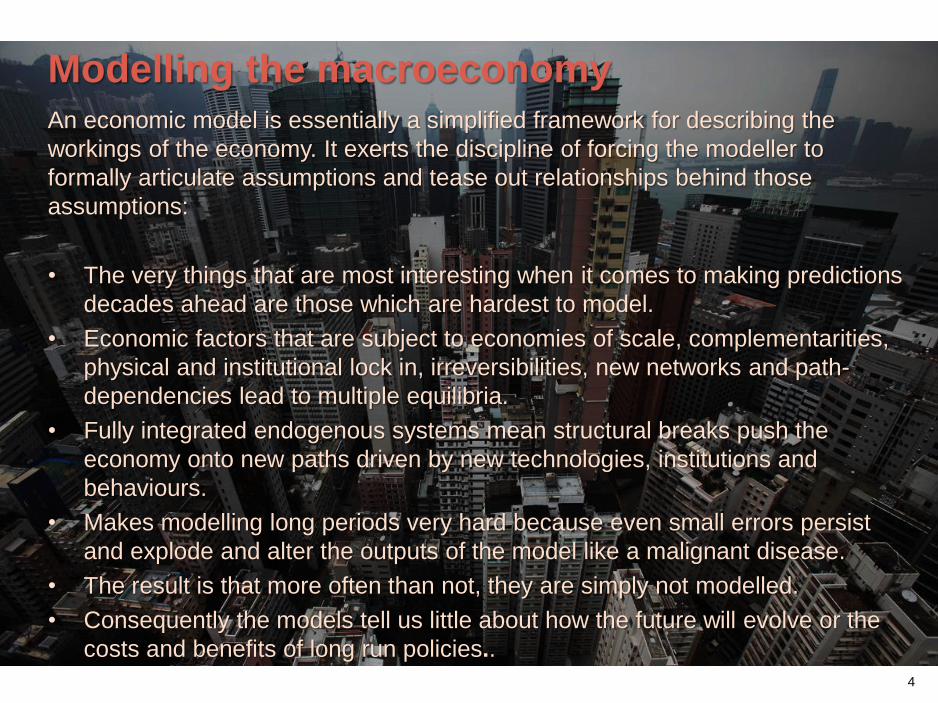
Modelling the macroeconomy An economic model is essentially a simplified framework for describing the
workings of the economy. It exerts the discipline of forcing the modeller to
formally articulate assumptions and tease out relationships behind those
assumptions:
• The very things that are most interesting when it comes to making predictions
decades ahead are those which are hardest to model.
• Economic factors that are subject to economies of scale, complementarities,
physical and institutional lock in, irreversibilities, new networks and path-
dependencies lead to multiple equilibria.
• Fully integrated endogenous systems mean structural breaks push the
economy onto new paths driven by new technologies, institutions and
behaviours.
• Makes modelling long periods very hard because even small errors persist
and explode and alter the outputs of the model like a malignant disease.
• The result is that more often than not, they are simply not modelled.
• Consequently the models tell us little about how the future will evolve or the
costs and benefits of long run policies..
*
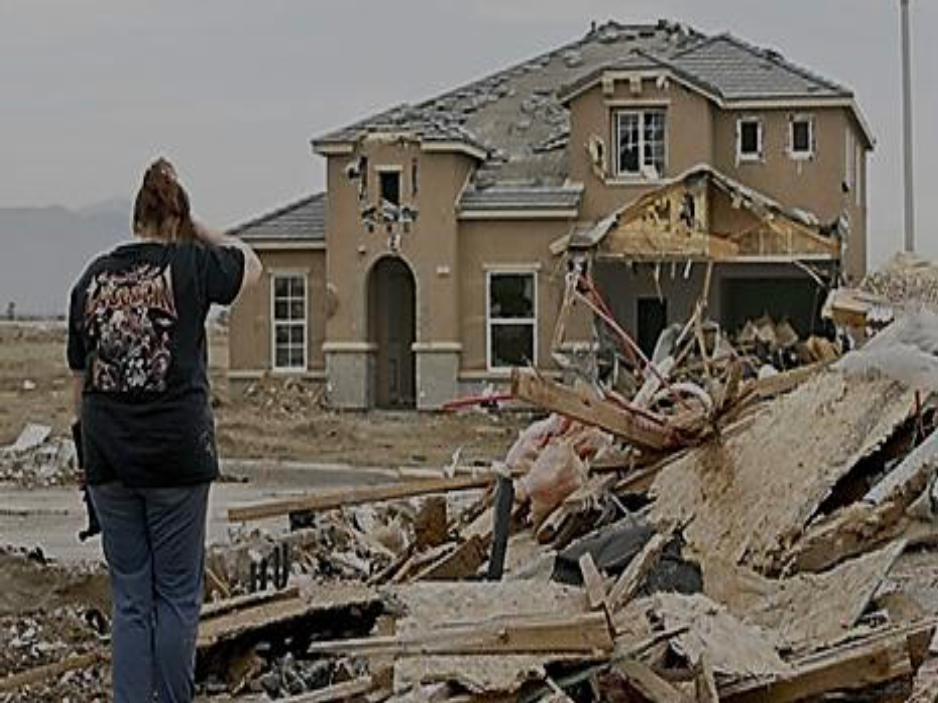
Planning the macroeconomy Urban planning and the recent financial market crash:
• Sprawling suburbs such as Victorville, 100 miles northeast of downtown
Los Angeles* entirely dependent on private cars to connect homes to work
and services.
• Such neighbourhoods unviable when fuel prices rose from $2 early in the
decade to $4 in 2008.
• The unsustainable nature of resource-intensive planning manifests itself in
the short- as well as the long-term.
*See Karlenzig (2011) ‘The Death of Sprawl’

7
8
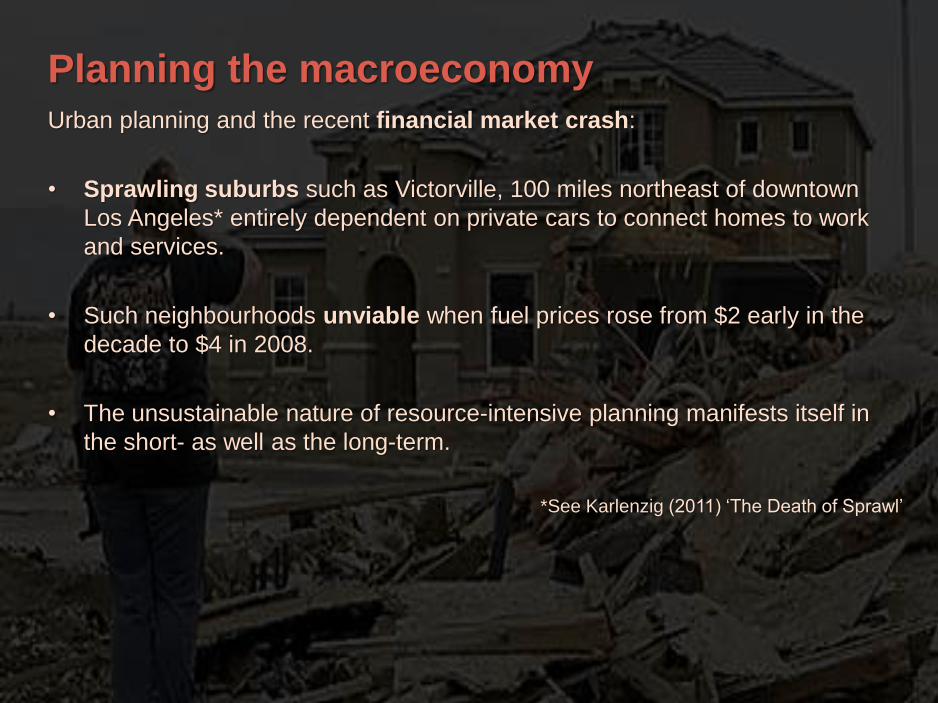
Designing an unsustainable future
1. An increase in the urban
infrastructure gap
Indian urban infrastructure gap estimated at $827
billion over next 20 years, 67% for roads
2. Growing costs of traffic
congestion
In Beijing these range between 7.5 and 15% of GDP
3. Rising cost of air pollution For 311 cities, 86% exceed WHO air quality guidelines
equating to 730,000 premature deaths
4. Increasing social exclusion Rising levels of socially divided cities
5. Lock-in of inefficiently high
levels of energy consumption
In study of 50 cities, almost 60% growth in expected
energy consumption related to sprawl
6. Wide range of other
economic and social costs
Road safety, health costs, reducing ecosystem
services
7. Embedded carbon
emissions
Production of infrastructure materials would generate
around 470 Gt of CO2 in developing countries
8. Operational carbon
emissions
Doubling of carbon emissions from transport by 2050
(majority being urban transport)
Sources: Creutzig and He (2009), SEI (2014) [preliminary analysis], Ahluwalia et al (2014), Bourdic et al (2012)
Cities

NCE Pillar 1 – Compact Urban Form: Maximising economies of
scale, agglomeration effects and networking advantages
• Human-scale cities with higher
density, mixed-use urban form and
good quality urban design
• Compact city development goes
beyond urban containment and
includes dense, transit-oriented
urban expansion for high-density,
high-growth cities
• Development in established
megacities can largely be
accommodated on existing urban
land
Re-densification is already happening in
some leading cities
New development in London (LSE Cities 2012) Floorspace additions between 2004 and 2011
Cities
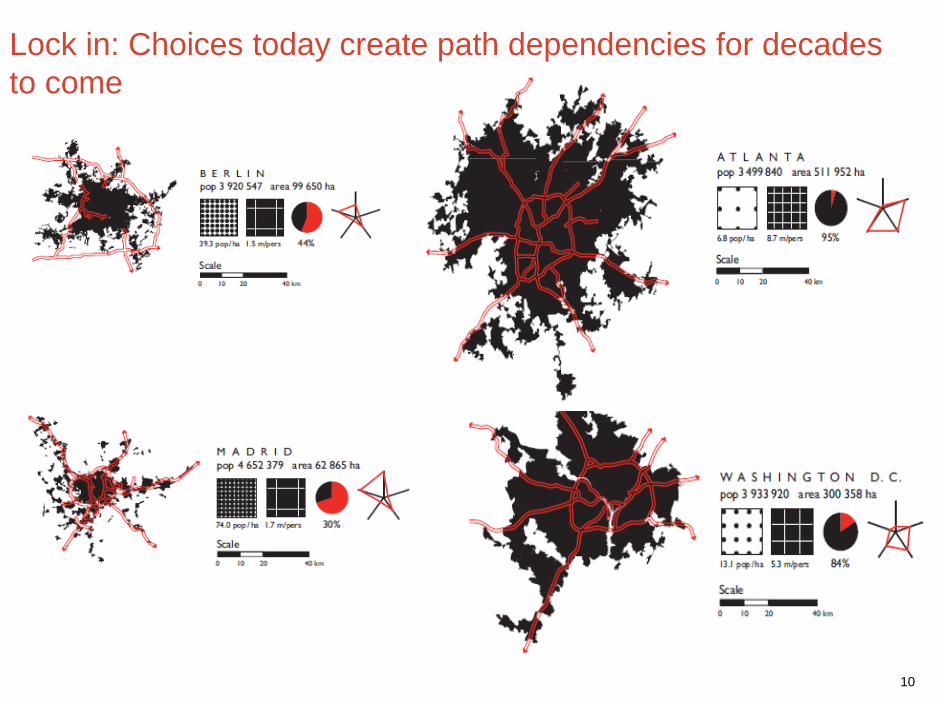
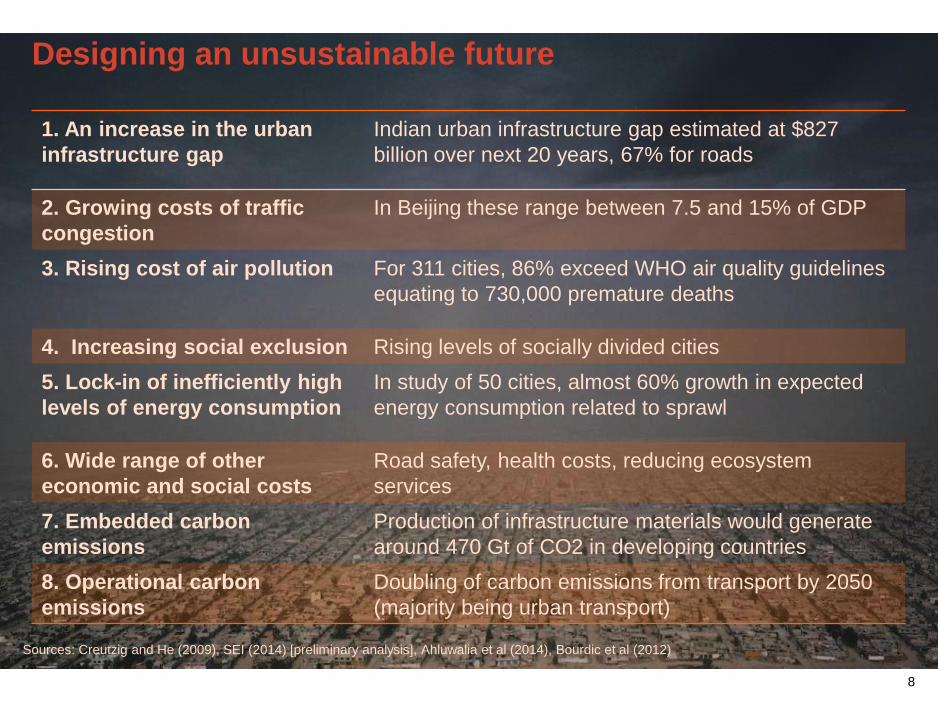
10
Lock in: Choices today create path dependencies for decades
to come
Cities
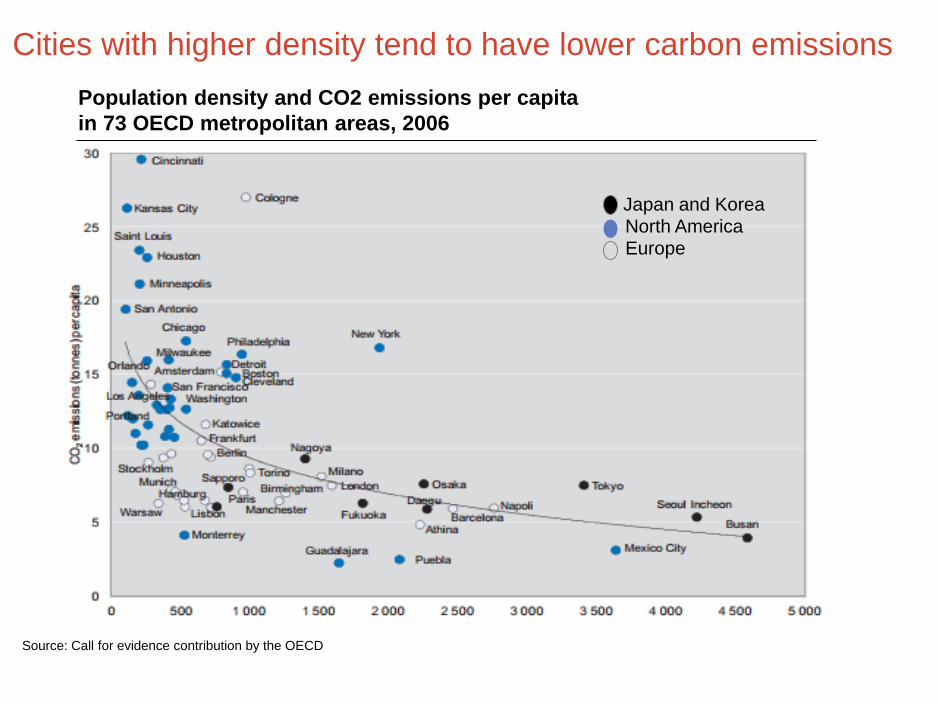
Source: Call for evidence contribution by the OECD
Cities with higher density tend to have lower carbon emissions
Japan and Korea
North America
Europe
Cities
Population density and CO2 emissions per capita
in 73 OECD metropolitan areas, 2006
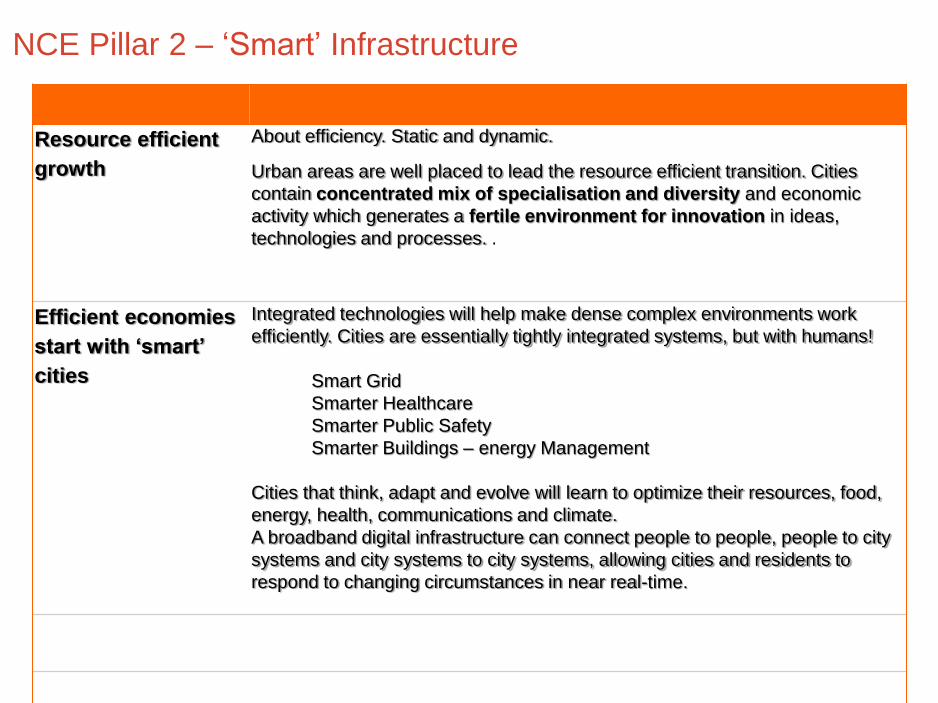
NCE Pillar 2 – ‘Smart’ Infrastructure
Resource efficient
growth
About efficiency. Static and dynamic.
Urban areas are well placed to lead the resource efficient transition. Cities
contain concentrated mix of specialisation and diversity and economic
activity which generates a fertile environment for innovation in ideas,
technologies and processes. .
Efficient economies
start with ‘smart’
cities
Integrated technologies will help make dense complex environments work
efficiently. Cities are essentially tightly integrated systems, but with humans!
Smart Grid
Smarter Healthcare
Smarter Public Safety
Smarter Buildings – energy Management
Cities that think, adapt and evolve will learn to optimize their resources, food,
energy, health, communications and climate.
A broadband digital infrastructure can connect people to people, people to city
systems and city systems to city systems, allowing cities and residents to
respond to changing circumstances in near real-time.
Cities
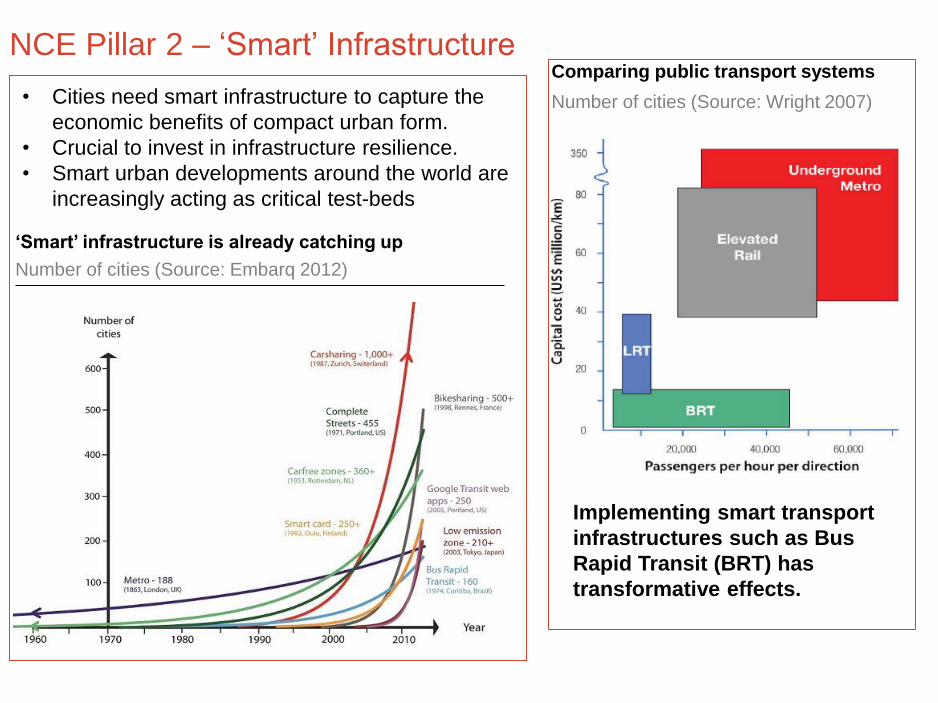
NCE Pillar 2 – ‘Smart’ Infrastructure
‘Smart’ infrastructure is already catching up
Number of cities (Source: Embarq 2012)
Comparing public transport systems
Number of cities (Source: Wright 2007)
Implementing smart transport
infrastructures such as Bus
Rapid Transit (BRT) has
transformative effects.
• Cities need smart infrastructure to capture the
economic benefits of compact urban form.
• Crucial to invest in infrastructure resilience.
• Smart urban developments around the world are
increasingly acting as critical test-beds
Cities

NCE Pillar 3 – Effective institutions
Case study
Financial control • Greater fiscal autonomy already a trend in higher income cities.
• Expenditure at the sub-national level in OECD countries reached 33% in
2005
• Only 4% of the 500 largest cities in developing countries are creditworthy in
international financial markets, and 20% in local markets. Yet for $1
invested in creditworthiness can leverage $100 from private sector
• City-level creditworthiness takes time to achieve, e.g. Lima took five years.
Transparency and
accountability
• Bangalore is using GIS technology and on-line self assessments to
streamline property tax. Revenues doubled in one year between 2007-08
and 2008-09.
Metropolitan
Authorities
• Transport for London: a single London wide agency overseeing all urban
transport modes- non-motorised transport, public transport, and road traffic.
Policy
coordination
• India’s National Urban Transport Policy, integrating transport and land use
planning as a single strategic goal.
Accounting
standards
• Need for system of ‘integrated accounts’ for cities - develop framework
similar to Standard National Accounting System – US GAAP
Cities
15
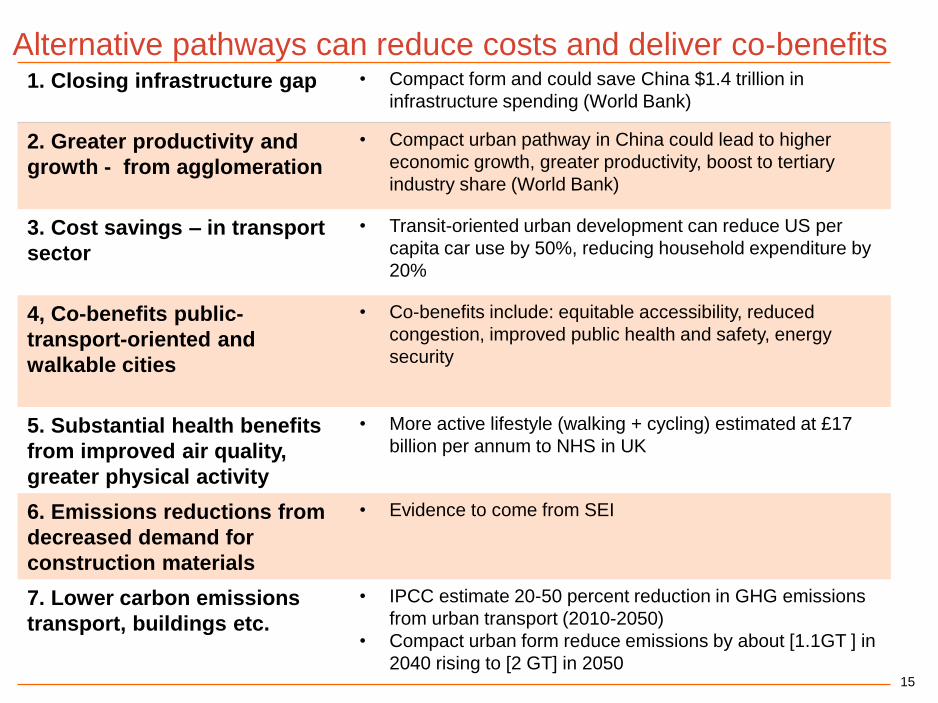
Alternative pathways can reduce costs and deliver co-benefits 1. Closing infrastructure gap
• Compact form and could save China $1.4 trillion in
infrastructure spending (World Bank)
2. Greater productivity and
growth - from agglomeration
• Compact urban pathway in China could lead to higher
economic growth, greater productivity, boost to tertiary
industry share (World Bank)
3. Cost savings – in transport
sector
• Transit-oriented urban development can reduce US per
capita car use by 50%, reducing household expenditure by
20%
4, Co-benefits public-
transport-oriented and
walkable cities
• Co-benefits include: equitable accessibility, reduced
congestion, improved public health and safety, energy
security
5. Substantial health benefits
from improved air quality,
greater physical activity
• More active lifestyle (walking + cycling) estimated at £17
billion per annum to NHS in UK
6. Emissions reductions from
decreased demand for
construction materials
• Evidence to come from SEI
7. Lower carbon emissions
transport, buildings etc.
• IPCC estimate 20-50 percent reduction in GHG emissions
from urban transport (2010-2050)
• Compact urban form reduce emissions by about [1.1GT ] in
2040 rising to [2 GT] in 2050
16
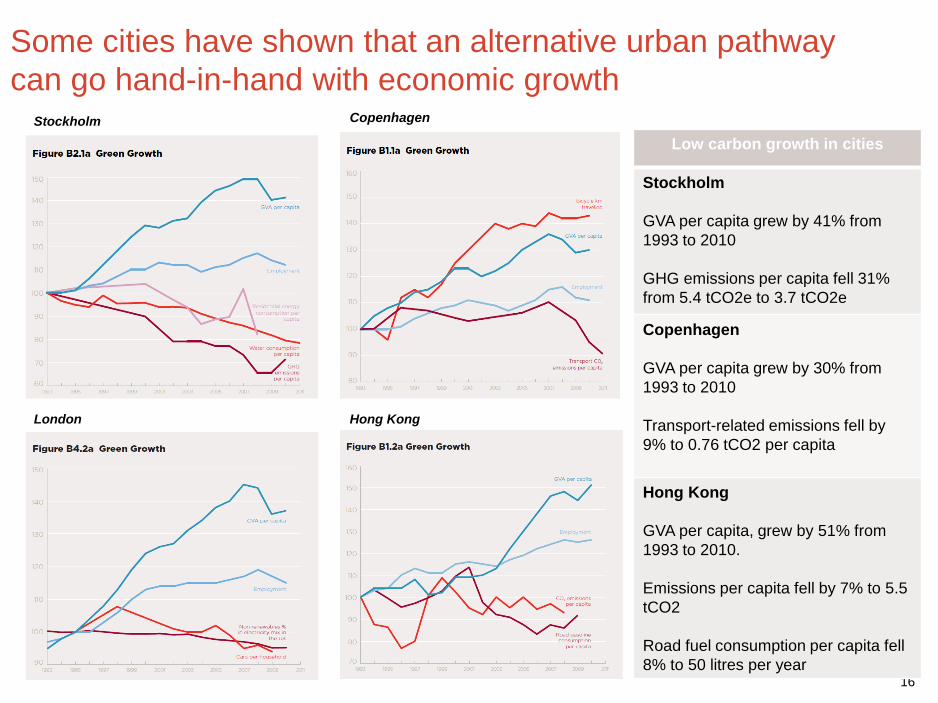
Some cities have shown that an alternative urban pathway
can go hand-in-hand with economic growth Stockholm Copenhagen
London Hong Kong
Low carbon growth in cities
Stockholm
GVA per capita grew by 41% from
1993 to 2010
GHG emissions per capita fell 31%
from 5.4 tCO2e to 3.7 tCO2e
Copenhagen
GVA per capita grew by 30% from
1993 to 2010
Transport-related emissions fell by
9% to 0.76 tCO2 per capita
Hong Kong
GVA per capita, grew by 51% from
1993 to 2010.
Emissions per capita fell by 7% to 5.5
tCO2
Road fuel consumption per capita fell
8% to 50 litres per year
Cities

Conclusion
We are at a crossroads: inaction will reduce citizen welfare, increase costs and insecurity
and eventually risk urban catastrophe.
• Resource-efficient growth is the only sustainable long-term option.
• A transition to a low-carbon resource efficient economy can bring a new era of progress,
induced innovation and prosperity. Cleaner, quieter, more efficient, energy secure
sustainably-planned cities also attractive.
• Credible long-term policy can reduce uncertainty in recession and generate profitable new
markets, drive private investment/jobs/growth.
• Long-run coordinated thinking is required – focus on designing and directing rather than
predicting future. Race in a market to supply a resource-constrained world.
• Major world cities are increasingly taking the lead setting strong targets.
The choices made in cities today on transport, infrastructure, buildings and industry, as they
grow rapidly over the coming decades, will determine:
• the technology, institutions and behaviours they lock-in to
• whether mankind can both manage climate change and capture the benefits of resource-
efficient growth.