Embed Size (px)
Citation preview

O C T O B E R 6 , 2 0 1 6
Private EnterpriseWelch LLP Presents:
Accounting UpdatesAudit Tax Accounting Consulting

AGENDA
2:30
3:00
3:15
3:30
3:55
4:05
4:154:15
4:25
4:40
4:50
NETWORKING & SNACKS
HST/ INPUT TAX CREDITS IN HOLDING COMPANIES GARTH STEELE
IFRS/ASPE SHAWN KELSO
INCOME TAX UPDATE: WHAT YOU NEED TO KNOWDON SCOTT
CRA TIPS: WHAT THEY’RE LOOKING FOR GARY DONELL
AUDIENCE Q&A
BUSINESS INCENTIVES UPDATE JOSHUA SMITH
AUDIENCE Q&A
BREAK
TRANSACTION INDUSTRY UPDATES STEPHAN MAY

SPEAKER BIOS
GARTH STEELE, CPA, CA AUDIT & INDIRECT TAX PARTNER
With With over 20 years of experience as a Partner at Welch, Garth has an exhausve list of Not-for-Profit audit experience. In addion to auding NPOs, Garth’s forte is Commodity Taxes (GST, HST, PST) and Payroll Taxes (CPP, EI, EHT, WCB). For the past 20 years, Garth has been a tutorial leader and lecturer for the CPA Canada In-Depth GST Course, as well as an instructor for CPA Ontario’s annual Professional Development program.
DON SCOTT, FCPA, FCADIRECTOR OF TAX SERVICES & TAX PARTNER
Don is nDon is na onally recognized for his extensive knowledge in the area of Personal and Corporate Tax Planning. He regularly contributes content to keep Welch LLP’s clients up to date on the latest tax issues.Don authors the annual Income Tax Update course, which is taught na onally through the CPA professional development program and teaches various specialized tax courses for the CPA Canada and CPA Ontario. He is also a meHe is also a mentor to students within the firm that are working towards their CPA designa on.
SHAWN KELSO, CPA, CADIRECTOR OF PROFESSIONAL STANDARDS & PARTNER
ShShawn began working with Welch LLP in 1993, serving clients in the private and not-for-profit sector. In 2005, Shawn was appointed Director of Professional Standards and is responsi-ble for the compliance with Quality Assurance policy in all 12 of Welch’s offices. He is also responsible for ensuring all Quality Control direcves, as set by the Canadian Instute of Chartered Accountants (CICA), are upheld on audit files as wwell as recommending and enforcing Welch’s internal quality assurance policies and procedures.
welchllp.com
SPEAKER BIOS
GARY DONELLINDEPENDENT CONTRACTOR & TAX CONSULTANT
STEPHAN MAY, MBA | MANAGING DIRECTORWELCHGROUP CONSULTING
SStephan is the Managing Director of WelchGroup Consulng. He brings years of experience in M&A, debt capital, private equity, advisory and restructuring services. Stephan works with compa-nies to maximize their value and ensure a smooth transion process, whether through buying or selling your company, financ-ing or restructuring. Stephan is a regular guest speaker at Telfer School of Business. In addion, he is currently the Chair of an iinterna onal Corporate Finance Group. In 2015, Stephan was a recipient of the Top 40 under 40 award.
JOSHUA SMITH, CPA, CA | BUSINESS INCENTIVES LEADER
Joshua gJoshua graduated with a Bachelor of Commerce from the Univer-sity of O awa in 2002 and began working with Welch LLP in 2006. He obtained his CA designa on in 2008. Joshua has worked on a number of government compliance audits, as well as audits for private sector and not-for-profit clients.Since 2007, Joshua has focused on tax compliance and planning for personal, business and estate clients. Joshua is also responsible for SR&ED and other business incebusiness incen ve planning.
Gary began with CRA in 1985 a er working in the private sector for eleven years and has stayed in various roles for nearly thirty years. He regularly consults with numerous CRA auditors on a variety of domesc and interna onal issues. In his roles with CRA, Gary has parcipated as a guest speaker in CRA sponsored tax events for some of Canada's largest companies, provided a special tax event to the Department of Jusce and the Depart-mement of Finance policy secon, and has been the CRA guest speaker for the last decade in the advanced tax program. Finally, he has acted as a consultant and advisor to 2 authors on their tax based textbooks, and currently heads the Tax 2 program at Athabasca University.
welchllp.com

PRIVATE ENTERPRISE ACCOUNTING UPDATES

3
Registration for HST required if carrying on a “Commercial Activity”
The holding of shares or debt in a subsidiary is not a CA
Voluntary registration may be permitted
HST + Holding Companies

4
S 186(3) Excise Tax Act
All or substantially all of the property of the subsidiary is used exclusively in CAs
Subsidiary is related to parent
The shares held by the parent and the debt held by the parent in the subsidiary is deemed to have been acquired by the parent for use exclusively in the course of its CAs
Deeming Rule

5
If parent company is registered for GST/HST
ITC’s are available in respect of expenditures incurred in relation to the shares or debt of the related company
Impact
6
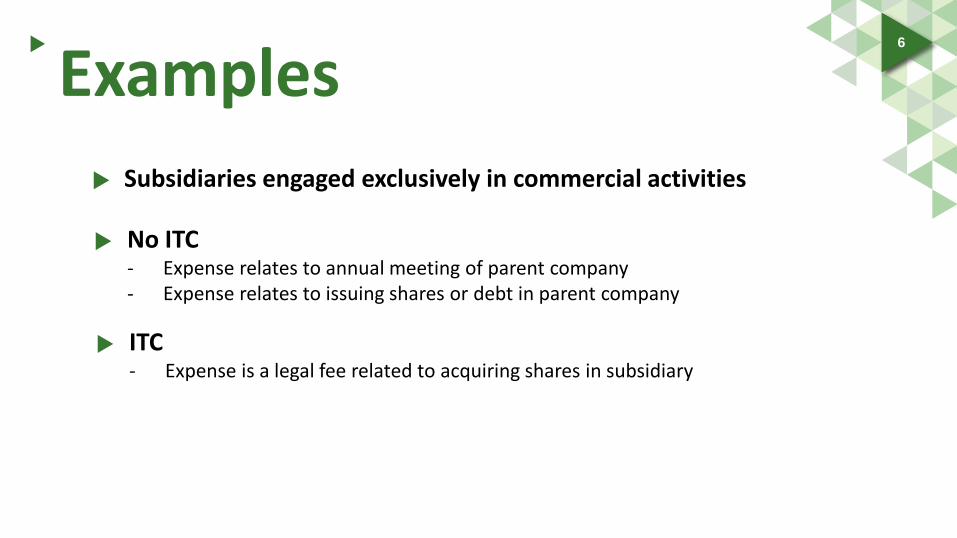
Subsidiaries engaged exclusively in commercial activities
No ITC - Expense relates to annual meeting of parent company - Expense relates to issuing shares or debt in parent company
ITC - Expense is a legal fee related to acquiring shares in subsidiary
Examples

8
Purpose • To clarify application of cost method to strategic investments
Key features • Measure at FV of consideration transferred at acquisition date
(includes contingent consideration) • Bargain purchase gain would not be recognized • Previously held investment would not be re-measured • Acquisition costs would be expensed
Amendments to ASPE 1591 (Subsidiaries) + 3051 (Investments)
Transition • Effective for Jan 1,2018 • Prospective (to new acquisitions)

9
Placement of significant accounting policy note
Change in accounting policy for current period no longer required under 1506
Amended 1521 (Balance Sheet) re: required disclosure of assets under capital lease. Consistent with section 3065 LEASES.
Removal of disclosure requirement re: impaired operating leases receivable (replaced by disclosure of allowance…similar to trade receivables)
2017 Annual Improvements

10
Purpose • Original purpose was to eliminate exception for redeemable preferred
shares
Developments • Significant concerns expressed from practitioners/preparers • Implementation postponed (effective date no earlier than Jan 1, 2018) • Discussions ongoing (viability of classification exemption)
Project – Redeemable Preferred Shares
11
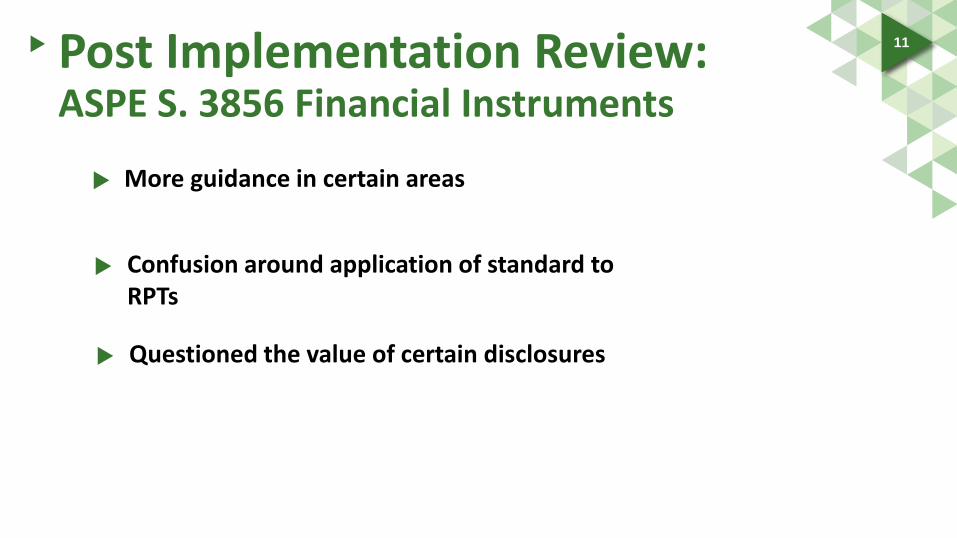
More guidance in certain areas
Confusion around application of standard to RPTs
Questioned the value of certain disclosures
Post Implementation Review: ASPE S. 3856 Financial Instruments

12
Assets in Scope • Unharvested crops • Agriculture produce • Animals held for sale • Bearer plants/animals
ASPE – Discussion Paper on Agriculture

13
Measurement Alternatives • Cost • Current value • Current value when conditions met • Insured value
ASPE – Discussion Paper on Agriculture

14 ASPE – Discussion Paper on Agriculture
Asset Preliminary View
Unharvested crops Cost
Agriculture produce Current value when conditions met (cost if not met)
Animals held for sale Current value when conditions met (cost if not met)
Bearer plants/animals Cost

15
Purpose • Address concerns re: off balance sheet financing
Implications • Lessees will be required to recognize most leases on balance sheets
• Right of use assets • Obligations to make lease payments
• While have impact on numerous financial metrics for entities with material leases • Essentially no change to lessor accounting
New IFRS Standard for Leases (IFRS 16)
Effective Date • Effective from Jan 1, 2019 • Early adoption requires IFRS 15 to be adopted as well*

16
Definition of a Lease • Identified asset • Control over asset Separating lease and non-lease components (e.g. service components)
Important Elements of IFRS 16
Transition Options • Full retrospective option (FY Dec 31, 2018 and Dec 31, 2019) • Modified retrospective approach (FY 2019)
• Cumulative effective = adjust opening R/E at Jan 1, 2019)
Exceptions to general application • Short term leases (< 1year) • Low value leases (< $5K)

17
Purpose • Provide more guidance on application or revenue recognition principles
IFRS 15
Transition • Effective from Jan 1, 2018
New 5 Step Process • ID Contract • Id separate performance obligations • Determine transaction price • Recognize revenue when performance obligations met

18
Purpose • Enhance the representational faithfulness of standard and improve the
execution of the standard
Financial Instruments
Transition • Effective date is Jan 1, 2018 • Transition relief
Key Elements • New financial instruments classification/measurement model • New impairment criteria • New hedging criteria

19
Amortized Cost
FVOCI
FVTPL
IFRS 9 Principle Measurement Categories

20
IFRS 9 Asset Classification FVOCI (equity instruments) FVTPL (equity instruments) Amortized cost FVOCI (debt instruments)
Not held for trading OCI election made by MGMT
Held for trading Principal & interest only Intent to hold & collect
Principal & interest only Mix of selling assets and collecting on contracts
Dividend income in P&L Change in FV through OCI
Dividend income in P&L Change in fair value the P&L
All items (interest revenue, FX, impairments, gain on sale etc. through P&L)
- Interest (P&L) - F/X (P&L) - Credit impairments (P&L) - Other gains/losses (OCI) - Reclass cumulative OCI adjustments on derecognition

21
Other IFRS Projects IFRS SECTION DESCRIPTION OF THE CHANGE EFFECTIVE DATE
IFRS 10 and 12, IAS 28 Clarifies the application of non-consolidation exemption for investment entities Jan 1, 2016
IFRS 11 Requires entity acquiring an interest in a joint operation to follow the provisions of IFRS 3 (so long as they don’t conflict with IFRS 11)
Jan 1, 2016
IFRS 14 Applies to entities subject to rate regulation permitting qualifying entities to defer certain expenditures which, in the absence of this section, would otherwise be expensed.
Jan 1, 2016
IAS 1 Clarifies application of disclosure certain disclosure requirements reflected (e.g. materiality, order of notes, disaggregation etc.)
Jan 1, 2016
IAS 16 and 38 Establishes that revenue based amortization models are not appropriate for PP&E and Intangible assets
Jan 1, 2016
IAS 16 and 41 Bearer plants now fall under the provisions of IAS 16 not IFRS 41. Government grants related to bearer plans will fall under the provisions of OAS 20 Government Grants.
Jan 1, 2016
IAS 27 IAS 27 now enables entities to account for investment in subsidiaries using the equity method when preparing non-consolidated financial statements to satisfy a regulatory requirement
Jan 1, 2016

22
Income Tax Update What You Need To Know
Don Scott FCPA, FCA Director of Tax Services, Tax Partner [email protected]

Incentives Tax Update – What You Need to Know
23
The Small Business Deduction
• Changes to partnership-based structures
• Changes to corporation-based structures

Partnership Example 24
LLP
CLIENTS
K Co
$400, 000 Contract for services
Kerry
50% C Co
Chris
$400, 000 Contract for services
Leslie
50%

Corporation Example 25
K Co
T/I $450K
Kerry
C Co
Chris
C Co
T/I $250K
$100K Fees
26
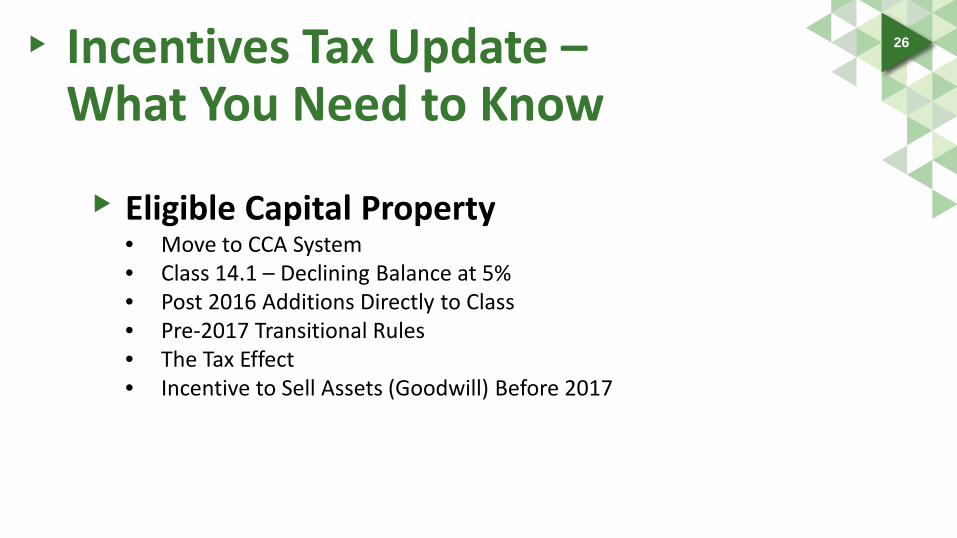
Eligible Capital Property • Move to CCA System • Class 14.1 – Declining Balance at 5% • Post 2016 Additions Directly to Class • Pre-2017 Transitional Rules • The Tax Effect • Incentive to Sell Assets (Goodwill) Before 2017
Incentives Tax Update – What You Need to Know

27
Life Insurance • Transfer of life insurance policies
• Changes for 2017 policies
Incentives Tax Update – What You Need to Know
28
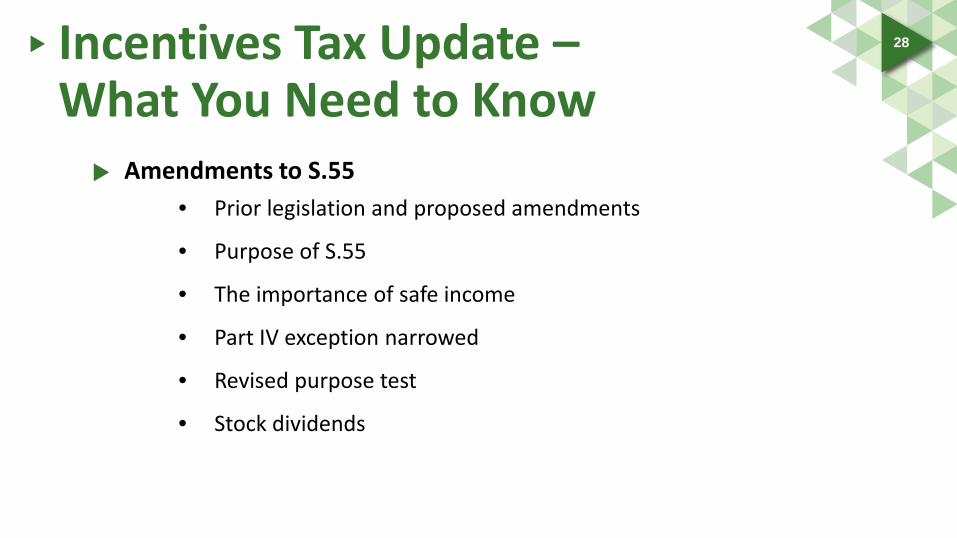
Amendments to S.55 • Prior legislation and proposed amendments
• Purpose of S.55
• The importance of safe income
• Part IV exception narrowed
• Revised purpose test
• Stock dividends
Incentives Tax Update – What You Need to Know

29 Incentives Tax Update – What You Need to Know
Amendments to S.55 • Redemption of shares/new S.55(2)
• Normal course dividends/loss consolidation transactions
• Safe income/discretionary dividend shares/ “skinny” shares
• Purpose test/creditor proofing
• Using S.55(2) as an advantage

30
OPCO
Hold Co
Mr. X
Invest Co
Mr. Y
OPCO Dividends
Dividends
Examples

Q&A
31

Break
32

33
The State of M&A In North America
Stephan May Managing Director, WelchGroup Consulting

North American M&A Trends
North American M&A Trends

v i a P i t c h B o o k SCARY

v i a P i t c h B o o k
M&A Activity is Slowing as Market Transitions North American M&A Deal Flow by Quarter
$176
$220
$226
$341
$329
$291
$324
$353
$351
$379
$304
2713 2640 2626 2568 2914 2756 2812 2724
2505 2155
1556
0
500
1000
1500
2000
2500
3000
3500
$0.00
$50.00
$100.00
$150.00
$200.00
$250.00
$300.00
$350.00
$400.00
1Q 2Q 3Q 4Q 1Q 2Q 3Q 4Q 1Q 2Q 3Q
2014 2015 2016
Deal Value ($B) Deal Count

v i a P i t c h B o o k
There's Too Much Capital Chasing Too Few Deals

v i a P i t c h B o o k
Multiples Remain at the Top End North American M&A EBITDA Multiples by Quarter
6.5x
5.9x
5.4x
5.8x
5.2x
6.8x
3.7x
5.8x
4.2x
5.6x
6.0x
6.5x
5.5x
4.8x
5.2x
4.0x
3.0x
4.2x
4.3x
4.1x
3.0x
4.2x
4.1x
4.9x
4.3x
4.7x
3.5x
5.8x
4.8x
5.9x
10.5x
9.0x 9.6x 10.1x
9.3x 9.8x
7.9x
9.9x 9.1x
9.9x 10.8x
10.0x 11.3x
9.6x
11.1x
0x
2x
4x
6x
8x
10x
12x
1Q 2Q 3Q 4Q 1Q 2Q 3Q 4Q 1Q 2Q 3Q 4Q 1Q 2Q 3Q
2013 2014 2015 2016
Debt/EBITDA Equity/EBITDA Valuation/EBITDA

v i a P i t c h B o o k
Middle-Market Deals Remain Bulk of M&A North American M&A Deals (#) by Size
0%
10%
20%
30%
40%
50%
60%
70%
80%
90%
100%
1Q 2Q 3Q 4Q 1Q 2Q 3Q 4Q 1Q 2Q 3Q 4Q 1Q 2Q 3Q
2013 2014 2015 2016
$5B+
$1B-$5B
$500M-$1B
$250M-$500M
$100M-$250M
Under $100M

v i a P i t c h B o o k
Mega Deals Taking Larger Share of M&A $ North American M&A Deals ($) by Size
0%
10%
20%
30%
40%
50%
60%
70%
80%
90%
100%
1Q 2Q 3Q 4Q 1Q 2Q 3Q 4Q 1Q 2Q 3Q 4Q 1Q 2Q 3Q
2013 2014 2015 2016
$5B+
$1B-$5B
$500M-$1B
$250M-$500M
$100M-$250M
Under $100M

v i a P i t c h B o o k
High Multiples and Competition Have Pushed PE Activity Down North American PE % of M&A
0%
5%
10%
15%
20%
25%
30%
35%
0
500
1000
1500
2000
2500
3000
3500
1Q 2Q 3Q 4Q 1Q 2Q 3Q 4Q 1Q 2Q 3Q 4Q 1Q 2Q 3Q
2013 2014 2015 2016
Sponsor Backed Corporate M&A Sponsor Backed %

v i a P i t c h B o o k
“Bankers are scared”

v i a P i t c h B o o k
Company Quality and Large Bank Lending Limits are Driving More Equity into Deals North American M&A Debt % by Quarter
0%
10%
20%
30%
40%
50%
60%
70%
80%
90%
100%
1Q 2Q 3Q 4Q 1Q 2Q 3Q 4Q 1Q 2Q 3Q 4Q 1Q 2Q 3Q
2013 2014 2015 2016
Debt % Equity %

PE Firms Keep Adding On at A Record Pace PE Add-On %
337
347 41
6
410 50
8
433 49
4
515
519
523
509
496
479
452
328
251
230 27
5 336 30
6
309 34
7
333
330
326
311
340
253
278
202
57% 60% 60% 55%
62% 58% 59% 61% 61% 62% 62% 59%
65% 62% 62%
0%
10%
20%
30%
40%
50%
60%
70%
0
100
200
300
400
500
600
700
800
900
1Q 2Q 3Q 4Q 1Q 2Q 3Q 4Q 1Q 2Q 3Q 4Q 1Q 2Q 3Q
2013 2014 2015 2016
Add-On Non Add-On Add-On %

North American M&A Trends
M&A in Canada

Volume of Completed Transactions Saw A Steep Downward Plunge Canadian M&A Deal Flow by Quarter
$16
$11
$9
$15
$31
$15
$12
$26
$12
$19
$11
$12
$14
$14
$9
0
50
100
150
200
250
300
350
$0.0
$5.0
$10.0
$15.0
$20.0
$25.0
$30.0
$35.0
1Q 2Q 3Q 4Q 1Q 2Q 3Q 4Q 1Q 2Q 3Q 4Q 1Q 2Q 3Q
2013 2014 2015 2016
Capital Invested ($B) Deal Count

U.S. M&A Activity Continues to be Robust U.S. M&A Deal Flow by Quarter
$106
$140
$150
$244
$145
$205
$214
$315
$317
$272
$313
$342
$337
$365
$295
0
500
1000
1500
2000
2500
3000
$0.0
$50.0
$100.0
$150.0
$200.0
$250.0
$300.0
$350.0
$400.0
1Q 2Q 3Q 4Q 1Q 2Q 3Q 4Q 1Q 2Q 3Q 4Q 1Q 2Q 3Q
2013 2014 2015 2016
Capital Invested ($B) Deal Count

North American M&A Trends
B2C Sector

v i a P i t c h B o o k
B2C Deal Value Hit a New High in 2Q 2016 North American M&A B2C Deal Flow by Quarter
$30
$39
$32
$63
$36
$57
$44
$56
$47
$54
$92
$33
$64
$121
$55
0
100
200
300
400
500
600
700
$0.0
$20.0
$40.0
$60.0
$80.0
$100.0
$120.0
$140.0
1Q 2Q 3Q 4Q 1Q 2Q 3Q 4Q 1Q 2Q 3Q 4Q 1Q 2Q 3Q
2013 2014 2015 2016
Deal Value ($B) Deal Count

v i a P i t c h B o o k
Median B2C Deal Size Swings Higher Median Deal Size for North American M&A B2C Deals
$21.7 $37.7
$21.3
$51.7
$26.0
$69.7
$38.0
$35.0 $26.3
$18.0 $28.1
$170.0
$0.0
$20.0
$40.0
$60.0
$80.0
$100.0
$120.0
$140.0
$160.0
$180.0
1Q 2Q 3Q 4Q 1Q 2Q 3Q 4Q 1Q 2Q 3Q 4Q 1Q 2Q 3Q
2013 2014 2015 2016

North American M&A Trends
B2B Sector

B2B M&A Activity Saw A First Sizable Slump in Some Time North American M&A B2B Deal Flow by Quarter
$31
$14
$35
$36
$38
$38
$43
$52
$34
$49
$70
$50
$65
$75
$23
0
200
400
600
800
1000
1200
1400
$0.0
$10.0
$20.0
$30.0
$40.0
$50.0
$60.0
$70.0
$80.0
1Q 2Q 3Q 4Q 1Q 2Q 3Q 4Q 1Q 2Q 3Q 4Q 1Q 2Q 3Q
2013 2014 2015 2016
Deal Value ($B) Deal Count

v i a P i t c h B o o k
B2B Deal Sizes Seeing a Big Trend Upwards Median Deal Size ($M) for North American B2B M&A Deals
$12.2 $11.8
$30.0
$17.0
$22.8
$35.0
$25.0
$19.3
$70.0
$0.0
$10.0
$20.0
$30.0
$40.0
$50.0
$60.0
$70.0
$80.0
1Q 2Q 3Q 4Q 1Q 2Q 3Q 4Q 1Q 2Q 3Q 4Q 1Q 2Q 3Q
2013 2014 2015 2016

North American M&A Trends
Energy Sector

Energy Deal Flow Falls Again North American M&A B2B Deal Flow by Quarter
$15
$23
$23
$36
$18
$19
$38
$102
$29
$51
$21
$41
$22
$13
$39
0
20
40
60
80
100
120
140
160
180
$0.0
$20.0
$40.0
$60.0
$80.0
$100.0
$120.0
1Q 2Q 3Q 4Q 1Q 2Q 3Q 4Q 1Q 2Q 3Q 4Q 1Q 2Q 3Q
2013 2014 2015 2016
Deal Value ($B) Deal Count

v i a P i t c h B o o k
3Q 2016 Median Deal Size was the Highest Median Deal Size ($M) for North American Energy M&A Deals
$27.8
$86.2 $73.3
$40.0
$68.6
$133.1
$52.8
$108.1
$22.0 $26.0
$119.0
$67.4
$24.1
$190.2
$0.0
$20.0
$40.0
$60.0
$80.0
$100.0
$120.0
$140.0
$160.0
$180.0
$200.0
1Q 2Q 3Q 4Q 1Q 2Q 3Q 4Q 1Q 2Q 3Q 4Q 1Q 2Q 3Q
2013 2014 2015 2016

North American M&A Trends
Healthcare Sector

v i a P i t c h B o o k
M&A Value and Volume for 3Q 2016 Tends Toward the Downward End North American M&A B2B Deal Flow by Quarter
$11
$18
$8
$27
$54
$21
$68
$32
$137
$90
$83
$41
$47
$68
$44
0
50
100
150
200
250
300
350
400
450
$0.0
$20.0
$40.0
$60.0
$80.0
$100.0
$120.0
$140.0
$160.0
1Q 2Q 3Q 4Q 1Q 2Q 3Q 4Q 1Q 2Q 3Q 4Q 1Q 2Q 3Q
2013 2014 2015 2016
Deal Value ($B) Deal Count

Valuations and Appetites are Increasing in the Healthcare Industry Median Deal Size ($M) for North American B2B M&A Deals
$45.0
$29.0
$59.9
$39.0
$65.6
$29.2 $30.0
$75.9
$45.0
$59.1 $65.7 $68.8
$0.0
$10.0
$20.0
$30.0
$40.0
$50.0
$60.0
$70.0
$80.0
1Q 2Q 3Q 4Q 1Q 2Q 3Q 4Q 1Q 2Q 3Q 4Q 1Q 2Q 3Q
2013 2014 2015 2016

v i a P i t c h B o o k
There is a lot of uncertainty in the market

North American M&A Trends
Changing Business Model

What’s Next?!?

v i a P i t c h B o o k
Autonomous Cars will change your
business model

“Uber, Lyft drivers know they will be replaced by self-driving cars”

260M* Average utilization rate of a
car is
“One out of ten cars sold in 2030 potentially being a shared vehicle”, and up to 15 percent
of new cars sold in 2030 could be fully autonomous**
Number of Cars in the U.S.
*Statista 2016 ** Mckinsey
95%
v i a P i t c h B o o k
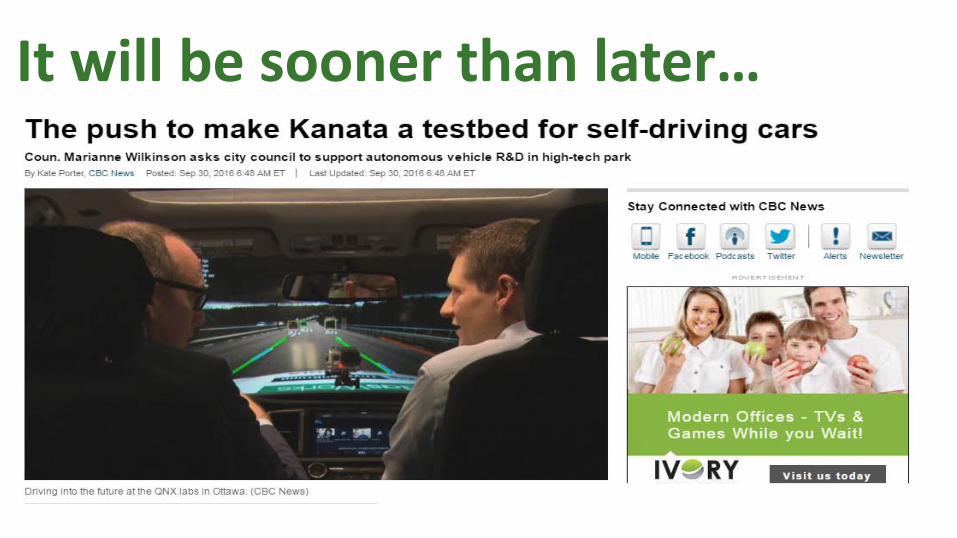
It will be sooner than later…

Companies That Will Be Obsolete or Reduced to Nothing
• Car insurance • Taxi • Parking garages • Auto parts dealer • Delivery trucks • Gas stations • Car rental
• Banks • Road construction • Car dealership • Real estate • Oil changers • Mechanics • Etc.…

68
CRA Tips: What They Are Looking For
Gary Donell Independent Contractor, Tax Consulting [email protected]

Basic Premise Qualification 69
The audit is not a restricted audit and the auditor is well experienced with a good level of technical expertise. The nature of the enquiry by a CRA auditor will depend on the outcome of a fact finding mission. Most audits require insight into the nature of the corporate business, whether there are other entities connected to the shareholders (other corporations, partnerships, trusts, etc), the reliability of the accounting system and interactions with the shareholder(s) and family members.

70
Full organization chart including entities and nature of ownership interests over time
Structure

71
Determining necessary connections between those either interacting with the company or having a connection to shareholders of the company
Control, Related (non-arm’s length), Associated + Affiliated
Updated share registry and minute book – verification of ownership history

72
Private Shareholder Agreements
Unanimous Shareholder Agreements
Buy/Sell Agreements
Insurance Policies
Any other relevant contractual agreements or arrangements including PACs
Legal
Formal valuation reports by qualified valuators

73
Valuation on property transfers between the company, shareholders and their family members (ITA 15(1))
Personal Amounts Expensed
Shareholder loan accounts – payments, source of funds, timing, offsetting salary, bonuses and dividends, any withholding requirements (ITA 15(2))
Shareholder Transactions Specifically

74
Whether improperly deducted (capital versus income)
Details to lead to tax planning transactions
Transaction Costs

75
The stop loss rules (affiliated persons and ITA 251.1)
Abils
Loss refreshing
The dividend stop loss rule (ITA 112(3))
Acquisition of Control
Losses & Loss Transactions

76
Shifting to other shareholders
Duplication
PUC
Preservation
77
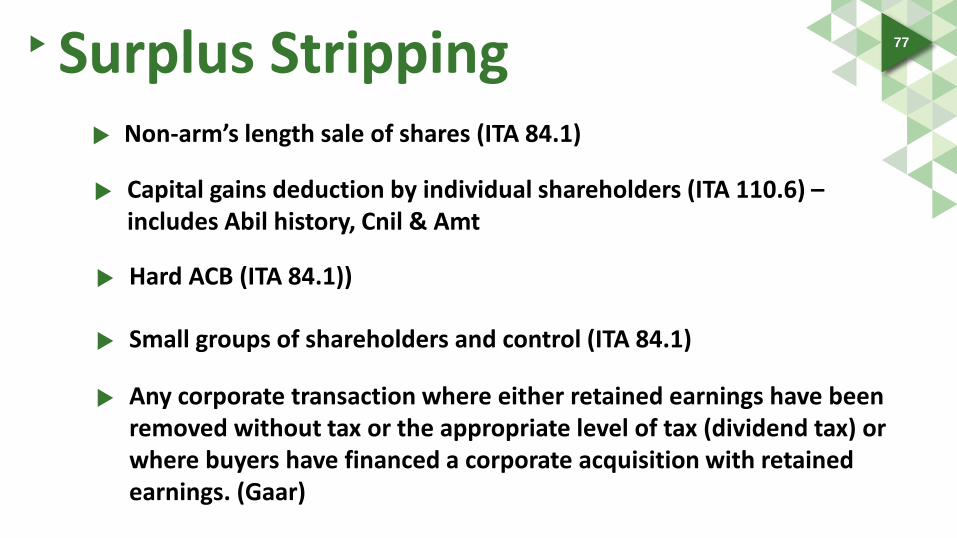
Non-arm’s length sale of shares (ITA 84.1)
Capital gains deduction by individual shareholders (ITA 110.6) – includes Abil history, Cnil & Amt
Hard ACB (ITA 84.1))
Small groups of shareholders and control (ITA 84.1)
Surplus Stripping
Any corporate transaction where either retained earnings have been removed without tax or the appropriate level of tax (dividend tax) or where buyers have financed a corporate acquisition with retained earnings. (Gaar)

78
Inter-corporate dividends
History of shareholders & shares for rough safe income determination
Subsequent transactions for series
Whether purification transactions included
Capital Gain Strips
T2057 (ITA 85(1))
Stock Dividends (ITA 15(1.1) and 55(2))

79
Continuity (depreciable property, CDA, R&D etc)
Acquisition of control (ITA 256(7)(b))
Transaction Costs
Gifting for family members (ITA 87(4))
Amalgamations
PUC determination (ITA 87(3))
Accounts created on amalgamation (goodwill etc)
Amalgamated interest expenses

80
The application of ITA 88(2)/69(5) (voluntary and involuntary dissolutions failing to file annual provincial corporate returns)
ITA 88(1) wind-up – continuity, bump (high priority)
Transfers of property one year or more in advance
Wind-ups + Dissolutions
81
Accuracy of attributes of shares
Valuation issues leading to gifting or shareholder benefits
Eligible property
Gifting for family members (ITA 87(4))
Rollovers Under ITA 85(1)
Timing on filing (if filed close to three year limit – tax avoidance?)

82
Their role, use, and whether properly established
Establishing settlor and trustee for trusts (attribution rules ITA 75(2))
Family partnerships
Family Trusts + Partnerships
84
Increased CRA Reviews
SR&ED Update
Five Questions Approach Continues
Documentation • Time sheets • The picture it paints
New CRA Programs • Pre-claim consultation (technology only) • Pre-claim review

85 Recent Cases Documentation • “In respect of” has a broad meaning • New draft legislation introduced
Oldcastle Building Products • Wages based on sales

Q&A
86