Embed Size (px)
Citation preview

Funded by a grant from the Robert Wood Johnson Foundation
Design Effect Anomalies in the American
Community Survey
Michel Boudreaux
Joint Statistical Meetings
July 29, 2012
San Diego, CA

Overview
• Background
• Irregularities in the DEFF of the ACS
• Potential drivers
• Practical significance for analysts
2

Design Effects
• A relative measure of sample efficiency
𝐷𝐸𝐹𝐹 = 𝜎𝑐𝑜𝑚𝑝𝑙𝑒𝑥2
𝜎𝑆𝑅𝑆2
• Sensitive to design elements
– Stratification (-)
– Intra-cluster correlation (+)
– Variance in the weights (+)
• Unique to each variable
• Typically 2-4
3
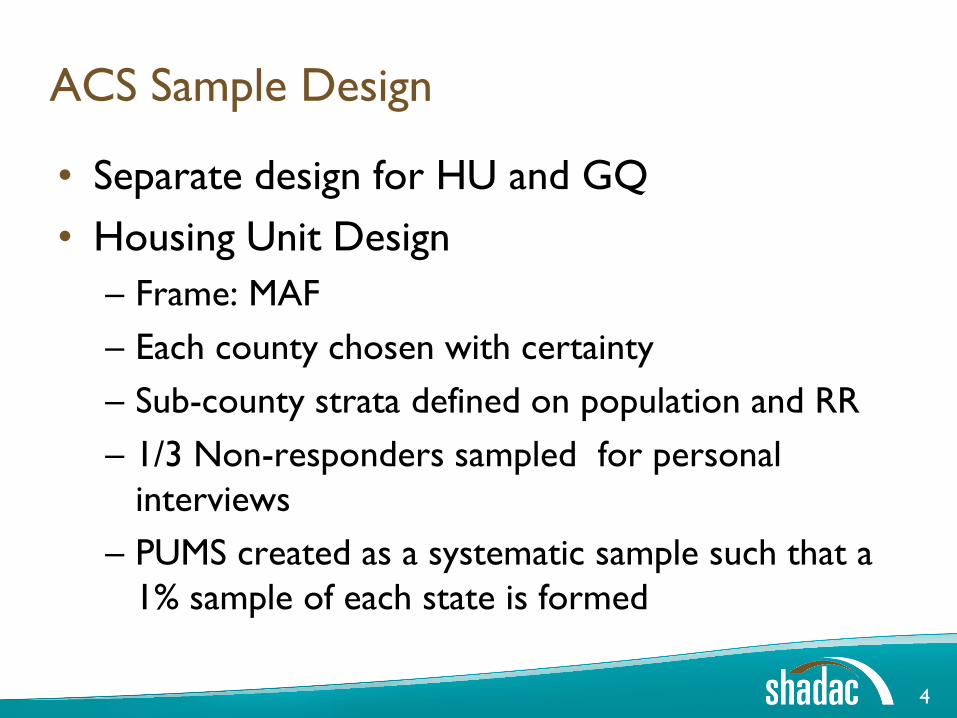
ACS Sample Design
• Separate design for HU and GQ
• Housing Unit Design
– Frame: MAF
– Each county chosen with certainty
– Sub-county strata defined on population and RR
– 1/3 Non-responders sampled for personal
interviews
– PUMS created as a systematic sample such that a
1% sample of each state is formed
4

Construction of Full Sample Weight
• Inverse of the probability of selection (BW)
• CAPI Sub-sample adjustment (SSF)
• Seasonal response adjustment
• Non-interview adjustment
• Mode bias adjustment
• Raking to control totals at the sub-county
level
5

Complex Variance Estimation
• Successive Difference Replication
– Similar to BRR w/Fay’s adjustment
– Geographic sort order is informative
• Replicate Weights (80 replicates)
– 1 of 3 replicate factors applied to each case
• 1.0 (50% of cases), 0.3, 1.7
• Factor assigned using a Hadamard Matrix (RF)
– BW adjusted with replicate factor
– Weighting process repeated
6

SDR Formula
7
𝜎𝑥 =4
𝑅 (𝑥𝑟 − 𝑥0)
2
𝑅
𝑟=1

Design Effects in the 2009 PUMS
8
7.0
10.0
2.0
21.7
5.0
0.0
5.0
10.0
15.0
20.0
25.0
Health
Insurance
Poverty Personal
Earnings
People in
Rental
Housing
HU that are
Rental
National ACS
State ACS
National CPS
2009 ACS PUMS
Average ratio of Nation
to State: 3.00

Design Effects in the 2010 PUMS
9
6.4
8.8
1.8
21.2
4.2
0.0
5.0
10.0
15.0
20.0
25.0
Health
Insurance
Poverty Personal
Earnings
People in
Rental
Housing
HU that are
Rental
National
State Average
2010 ACS PUMS
Average ratio of Nation
to State: 2.88

Design Effect for Health Insurance in 2008
Internal File (Derived from AFF)
10
8.01
2.96
0.00
1.00
2.00
3.00
4.00
5.00
6.00
7.00
8.00
9.00
National State Ave

2008 Design Factors (Published vs. Derived)
• DF’s are ratios of standard errors
– Used as a ratio-adjuster in place of SDR
11
2.5
1.8 1.8 1.7
0.0
0.5
1.0
1.5
2.0
2.5
3.0
National State Average
Derived from PUMS
Published

Using an Alternative Complex Variance
Estimator
• Taylor Series
– Strata: PUMA; Cluster: Household
12
1.1
3.2
4.7
1.8
0.5
0.0
1.0
2.0
3.0
4.0
5.0
Health
Insurance
Poverty Personal
Earnings
People in
Rental
Housing
HU that
are Rental
National ACS
State Average
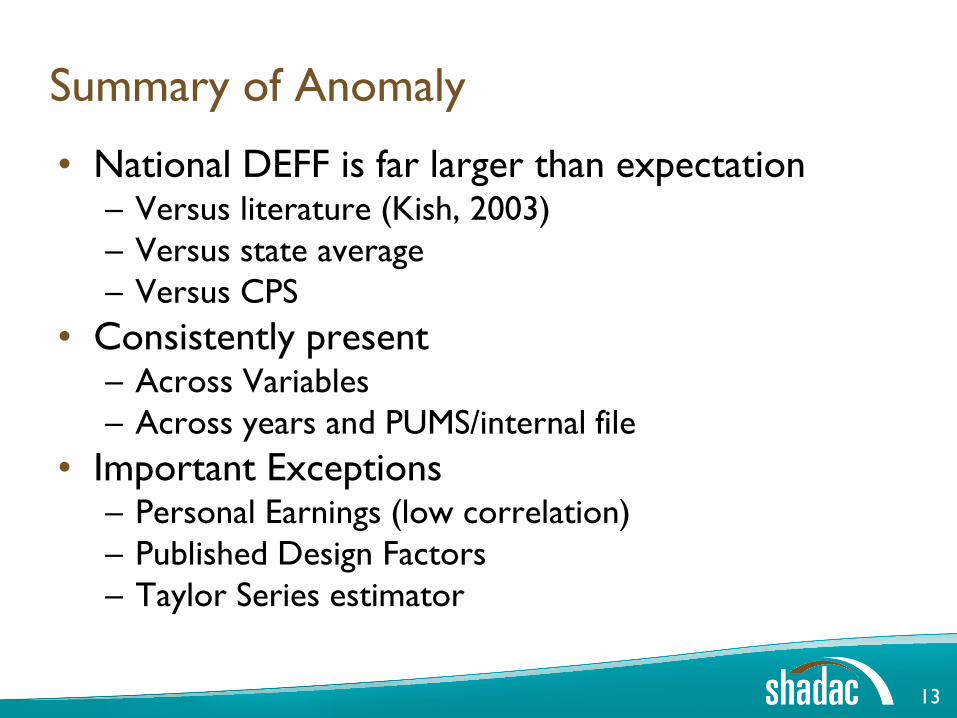
Summary of Anomaly
• National DEFF is far larger than expectation – Versus literature (Kish, 2003)
– Versus state average
– Versus CPS
• Consistently present – Across Variables
– Across years and PUMS/internal file
• Important Exceptions – Personal Earnings (low correlation)
– Published Design Factors
– Taylor Series estimator
13

Potential Causes
• Over-sampling – PUMS sampling rate set in each state to 1%
– Moderate geographic oversampling, but not likely
• Heterogeneity in the weights (1+L) – 1+L in line with expectations; not correlated with
geography (for full weight and replicates)
• Rounding of the weights – ACS rounds, CPS does not
– Ruled this out
• Sample Size – Definitely differentiates states from nation
14

Results by sample size (2009)
15
7.0
2.6
4.8
2.2 2.6
1.5
0.0
1.0
2.0
3.0
4.0
5.0
6.0
7.0
8.0
DEFF Ratio of National to State
Full Sample
50% Sample
7% Sample

Results by sample size (2009)
16
7.0
2.6
4.8
2.2 2.6
1.5
0.0
1.0
2.0
3.0
4.0
5.0
6.0
7.0
8.0
DEFF Ratio of National to State
Full Sample
50% Sample
7% Sample

Why Sample Size?
• As sample size increases, the probability of
capturing a meaningful outlier increases
• Only potential outlier in SDR versus Taylor
Series is the variation across weights.
𝑀𝑆𝐸𝑖 = 1
80 (𝑤𝑖𝑟 − 𝑤𝑖0
80
𝑟=1
)2
For i= (1…n) and r= (1…80)
17
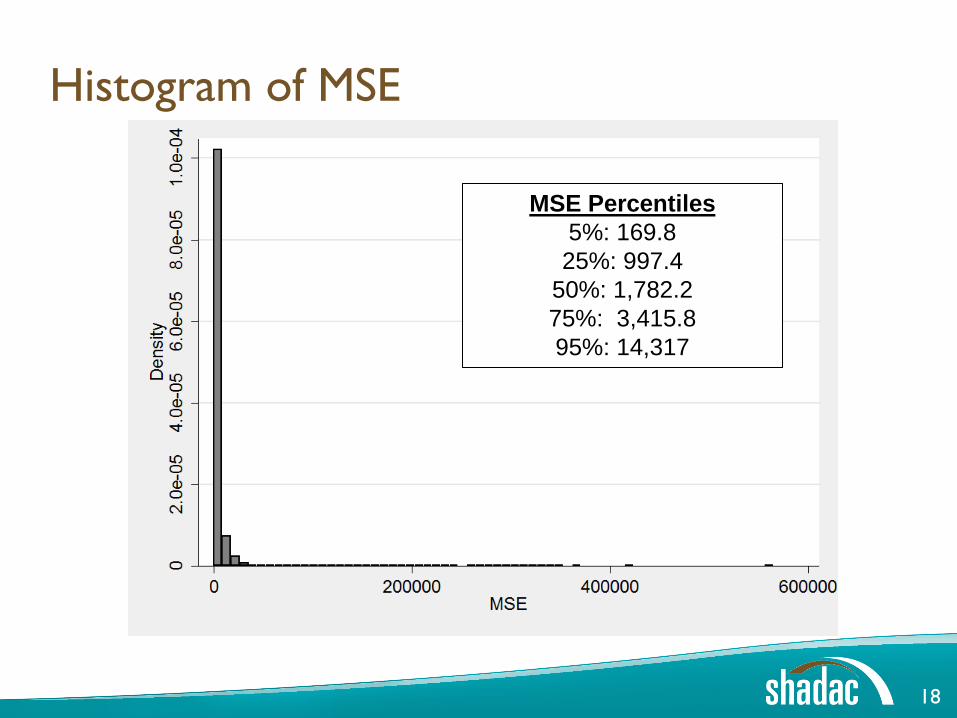
Histogram of MSE
18
MSE Percentiles
5%: 169.8
25%: 997.4
50%: 1,782.2
75%: 3,415.8
95%: 14,317
7.0
10.0
2.0
21.7
5.0
2.6
5.0
1.4
7.7
1.6
0.0
5.0
10.0
15.0
20.0
25.0
Health
Insurance
Poverty Personal
Earnings
People in
Rental
Housing
HU that
are Rental
Nat'l (Full Sample)
Nat'l (Excld Outlier)
State (Ecld. Outlier)
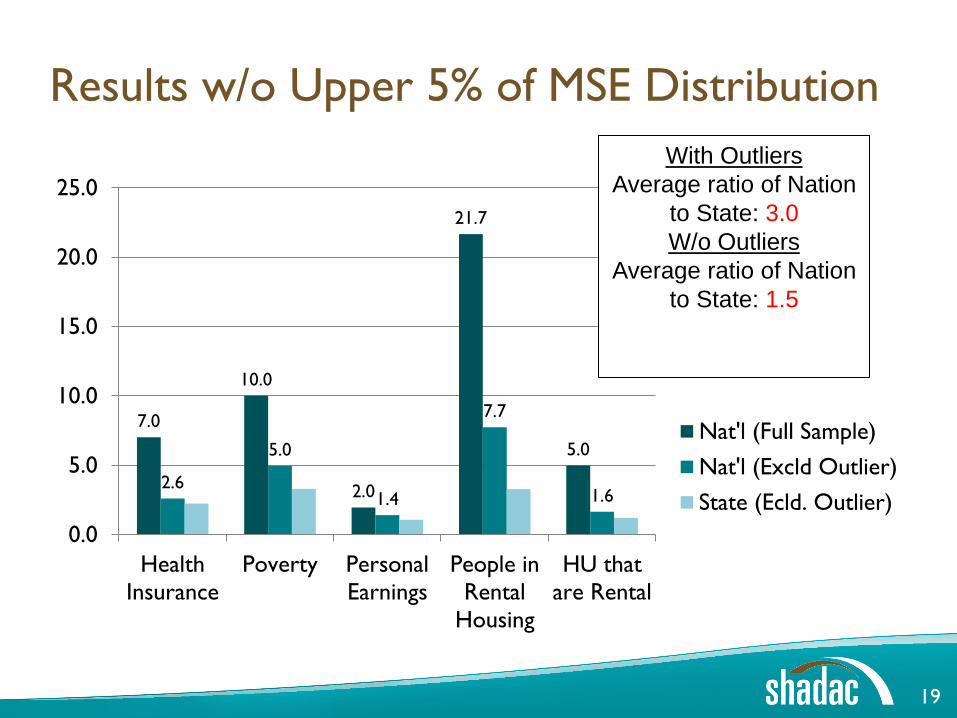
Results w/o Upper 5% of MSE Distribution
19
With Outliers
Average ratio of Nation
to State: 3.0
W/o Outliers
Average ratio of Nation
to State: 1.5

Effect Appears Non-Linear
20
U.S.
0.0
1.0
2.0
3.0
4.0
5.0
6.0
7.0
8.0
240
309
394
496
584
676
765
934
1,2
01
1,3
69
1,4
12
1,5
17
1,9
63
2,0
40
2,4
45
2,5
48
2,6
86
2,8
59
3,0
56
3,4
72
4,0
27
4,9
31
5,3
79
6,9
20
9,8
39
17,6
65
Desi
gn
Eff
ect
of
Healt
h I
nsu
ran
ce
Number of Outliers

Outlier Correlates
MSE
0-14,316 14,317+ (Outlier)
Full Sample Wt, Mean (SD) 89 (47.6) 322 (85.3)
Median Replicate, Mean (SD) 89 (47.8) 323 (85.9)
Mode/GQ*
HU Mail, % 99.6 .34
HU CATI/CAPI, % 85.3 14.9
GQ, % 97.3 2.7
* Significant at p<0.05; Remains significant after adjusting for age, race, and
sex
NOTE: CATI/CAPI is grouped together in PUMS
21

One Potential Reason for Outlying MSE
• Recall the weighting strategy for the replicates
– BW * RF * SSF …
• Potentially some correlation between RF and
SSF that causes larger MSE in CAPI cases,
relative to Mail/CATI
22

Limitations
• Our hypothesis that outlying MSE cause this
anomaly fails to explain 2 results
– Why do we fail to find an effect for characteristics
with low intra-class correlations (earnings)?
– The group (CATI/CAPI) with the highest rate and
frequency of outliers does not have the highest
DEFF
23

Design Effects by Mode/GQ
MSE
(mean)
% Outliers # Outliers DEFF of Insurance
HU Mail 2005 .34 6,814 4.5
HU CATI/CAPI 7110 14.9 142,427 1.9
GQ 3713 2.7 2,256 2.0
24

Practical Significance
• ACS is designed for local area estimation
• National standard errors already small
– National S.E. for health insurance: 0.06
– National S.E. w/o outliers: 0.03
– National S.E. assuming state DEFF: 0.01
• Two practical areas of concern
– Multi-year file: larger sample size
– Large sub-groups
25

National Design Effects in Single Year vs.
Multi-year
26
7.0
10.0
2.0
21.7
12.4 13.5
2.5
34.3
0.0
5.0
10.0
15.0
20.0
25.0
30.0
35.0
40.0
Coverage Poverty Earnings People in
Rentals
Single Year
Multi-Year
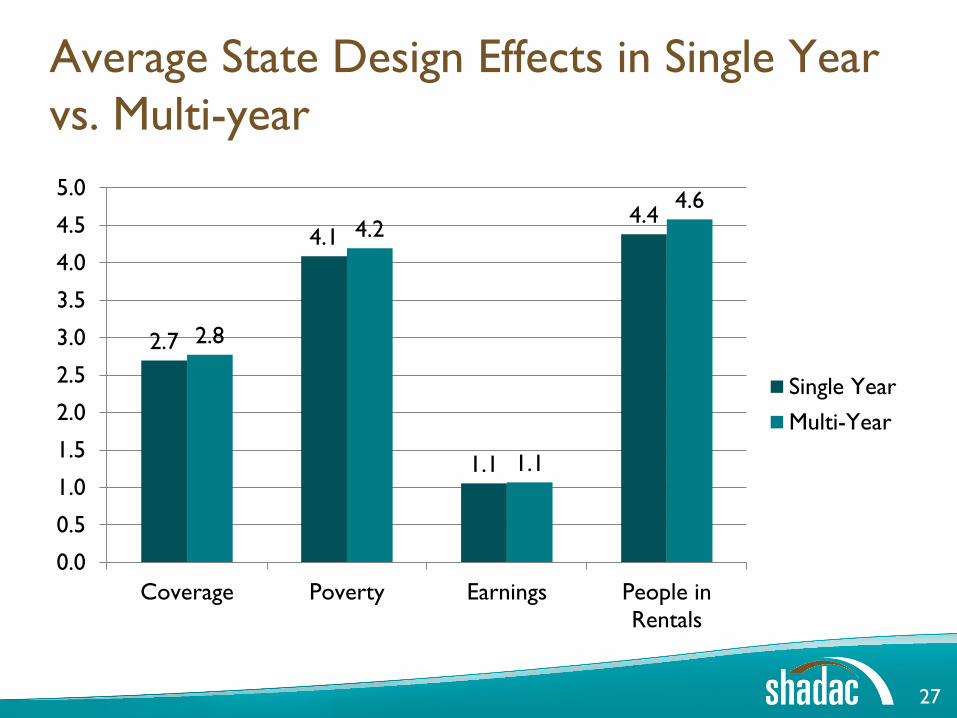
Average State Design Effects in Single Year
vs. Multi-year
27
2.7
4.1
1.1
4.4
2.8
4.2
1.1
4.6
0.0
0.5
1.0
1.5
2.0
2.5
3.0
3.5
4.0
4.5
5.0
Coverage Poverty Earnings People in
Rentals
Single Year
Multi-Year

Large Sub-Groups
28
0
1
2
3
4
5
6
7
NHOPI AIAN White Asian Multiple Black Other
DE
FF
SE (%) for Whites
Observed: 0.05
Assuming Ave DEFF: 0.03
Summary/Recommendations
• National Design Effects appear to large
– National SE’s upwardly biased
• Potentially driven by CAPI Sub-sampling
– Only apparent at aggregated domains
• Further investigation into RF by SSF interaction
– Accurate reflection of sample design or fixable in the
weights?
• Analysts that wish to avoid this can adopt
alternative variance method (TS)
29

Acknowledgements
• Funding
– RWJF grant to SHADAC
– Interdisciplinary Doctoral Fellowship Program
(Univ. of MN)
• Collaborators
– Peter Graven
– Michael Davern
– Kathleen Call
30

Sign up to receive our newsletter and updates at
www.shadac.org
@shadac
Michel Boudreaux