Embed Size (px)
Citation preview
BY
MOHAN GURUSWAMY
FORUM FOR STRATEGIC INITIATIVES
NEW DELHI
The Looming Crisis in India’s Agriculture.
06/12/17Centre for Policy Alternatives
1
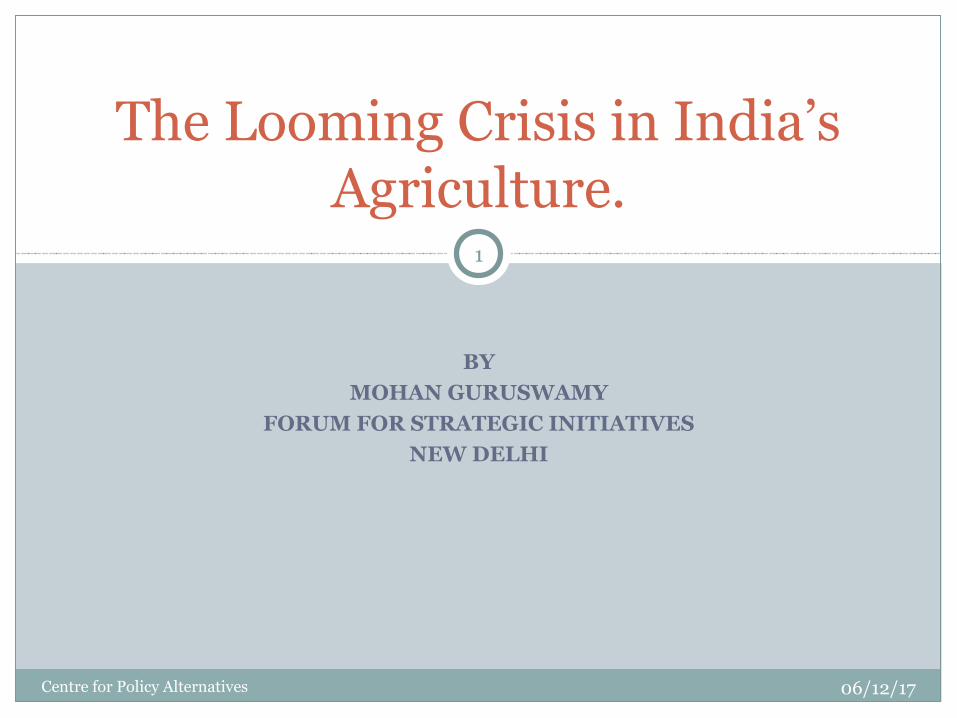
The Green Revolution.
06/12/17Centre for Policy Alternatives
2
Rice WheatCoarse Cereals Pulses
Total food grains
Growth Rate
1950-51 20.58 6.46 15.38 8.41 50.82 -
1960-61 34.58 11 23.74 12.7 82.02 4.90
1970-71 42.22 23.83 30.55 11.82 108.43 2.83
1980-81 53.63 36.31 29.02 10.63 129.59 1.80
1990-91 74.29 55.14 32.7 14.26 176.39 3.13
2000-01 84.98 69.68 31.08 11.07 196.81 1.10
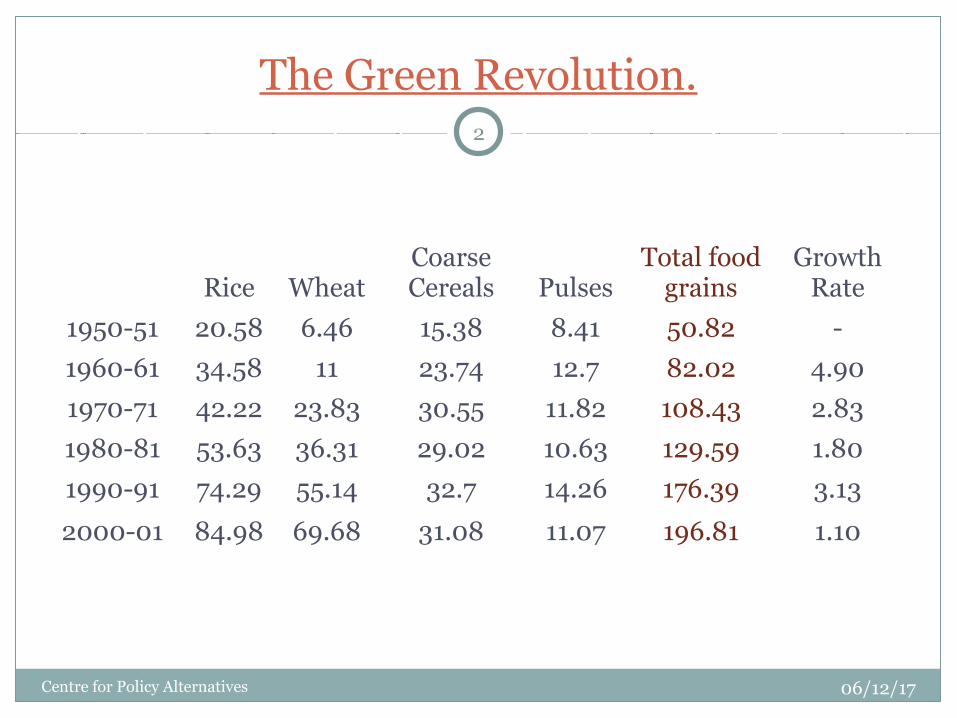
Demand/Supply Gap in Million Tons
06/12/17Centre for Policy Alternatives
3
Rice Wheat Pulses Sugar Oilseeds
2004-05 2.3 -4.2 -0.9 -4.1 -4.6
2005-06 6.7 -0.4 -1.0 0.7 -1.9
2006-07 6.6 2.4 -1.6 8.3 -6.2
2007-08 6.2 2.2 -2.6 5.1 -4.0
2008-09 P 6.0 9.8 -2.2 -8.1 -4.7
2009-10 P -2.8 2.1 -2.3 -7.5 -6.0
P: Projected (-): Indicates shortageSource: Estimated from data from Ministry of Agriculture and US
Department of Agriculture
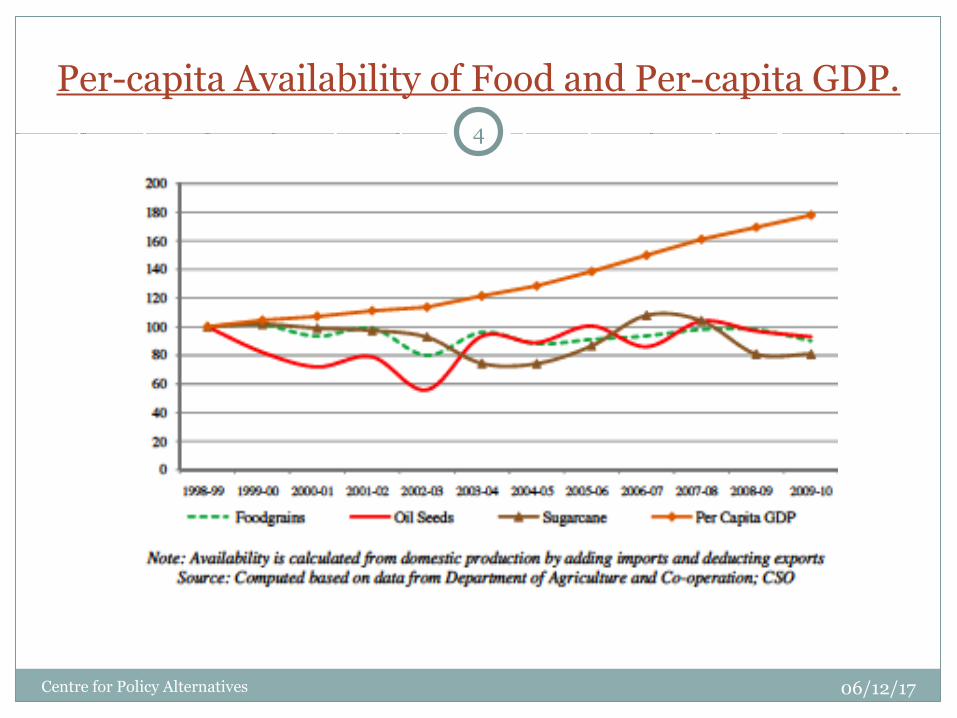
Per-capita Availability of Food and Per-capita GDP.
06/12/17Centre for Policy Alternatives
4
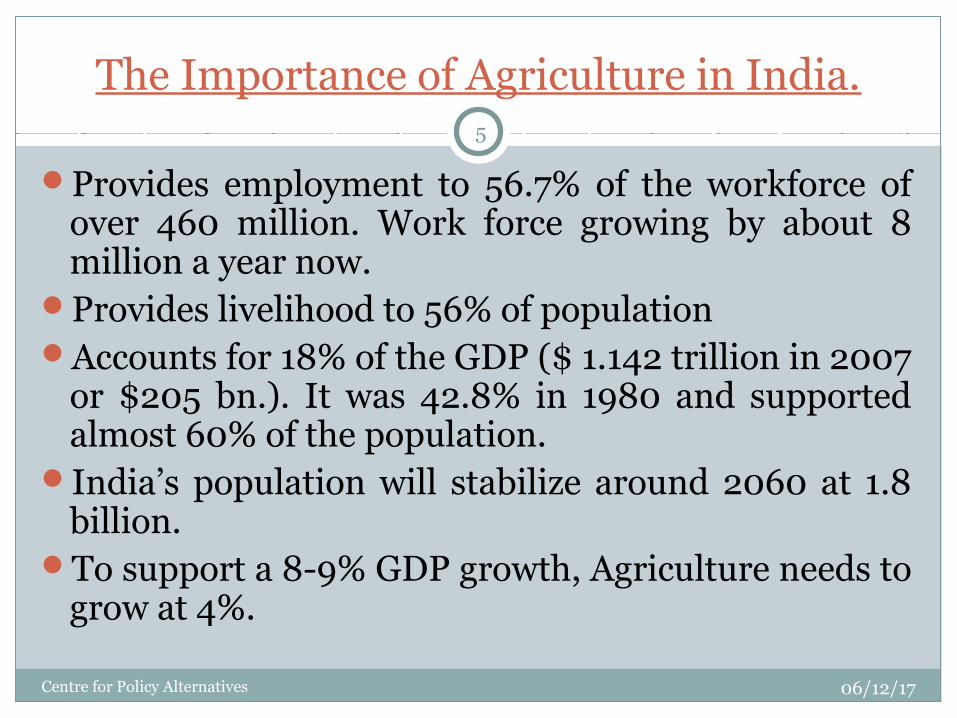
The Importance of Agriculture in India.
Provides employment to 56.7% of the workforce of over 460 million. Work force growing by about 8 million a year now.
Provides livelihood to 56% of populationAccounts for 18% of the GDP ($ 1.142 trillion in 2007
or $205 bn.). It was 42.8% in 1980 and supported almost 60% of the population.
India’s population will stabilize around 2060 at 1.8 billion.
To support a 8-9% GDP growth, Agriculture needs to grow at 4%.
06/12/17
5
Centre for Policy Alternatives

A demographic dividend or burden?
06/12/17
6
Centre for Policy Alternatives

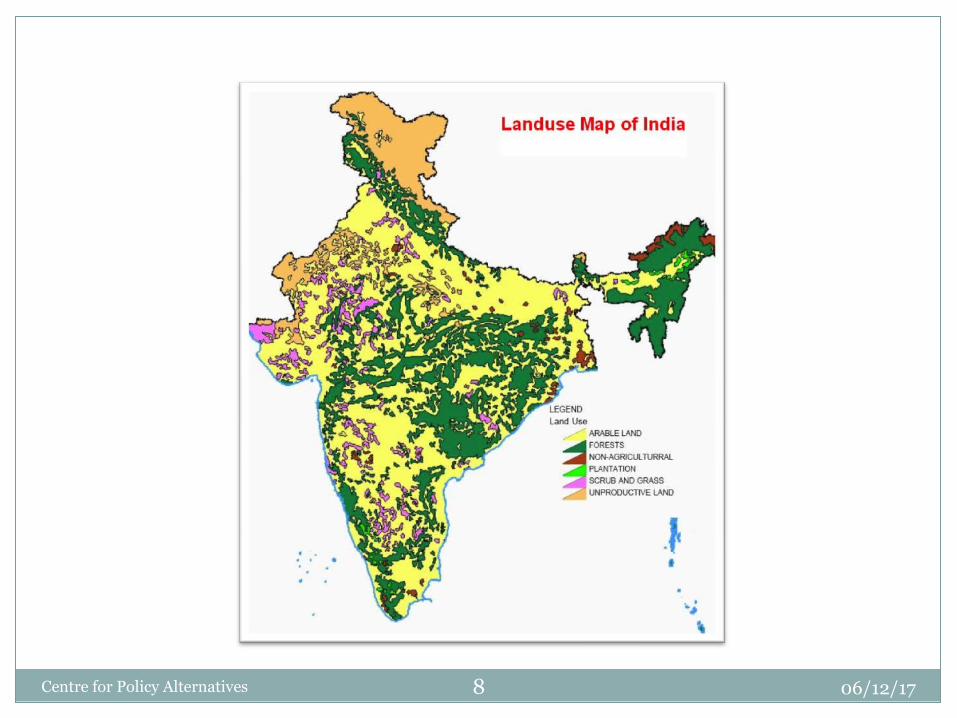
About 51.09% of the land is under cultivation.
21.81% under forest and 3.92% under pasture.
Built up areas and uncultivated lands occupy about 12.34% .
About 5.17% of the total land is uncultivated waste, which can be converted into agricultural land.
The other types of land comprises up 4.67%.
The Intensity of Agriculture.
06/12/17
7
Centre for Policy Alternatives
06/12/178Centre for Policy Alternatives
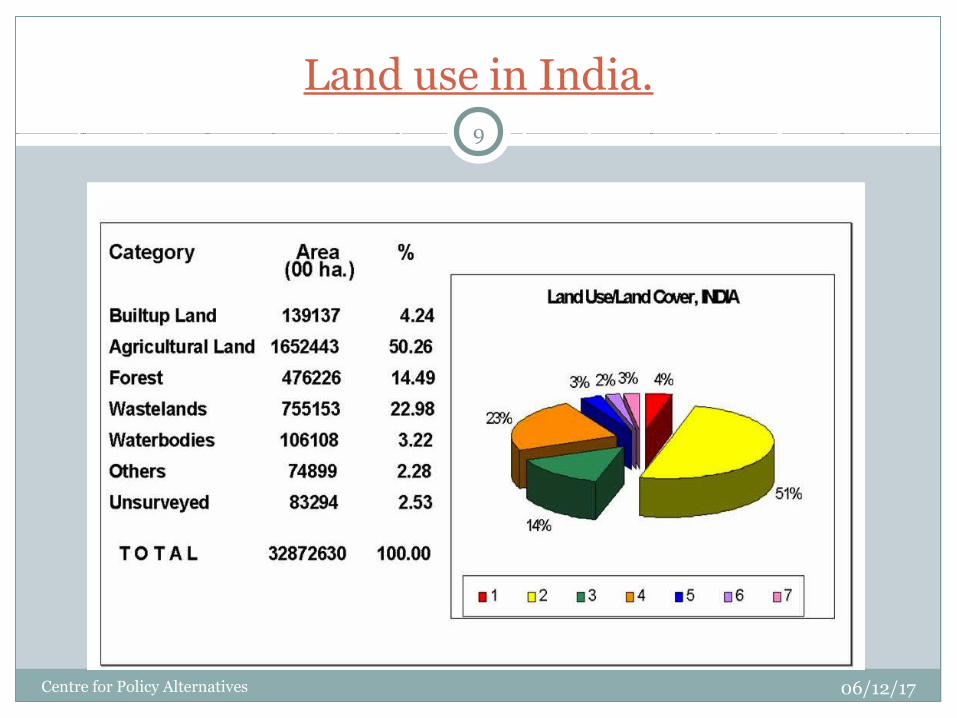
Land use in India.
06/12/17Centre for Policy Alternatives
9
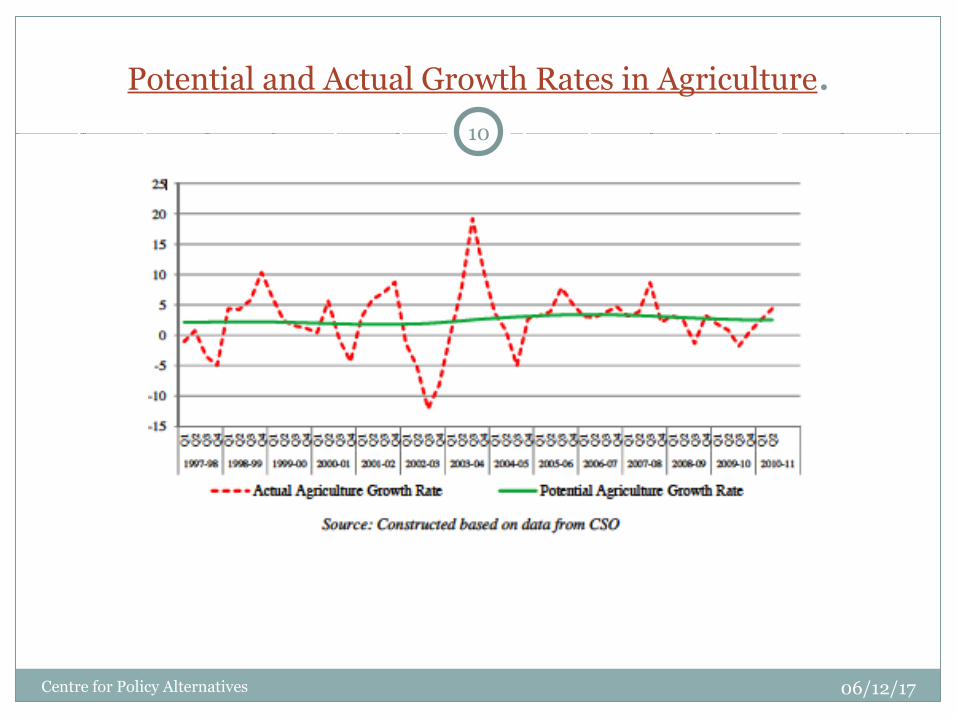
Potential and Actual Growth Rates in Agriculture.
06/12/17Centre for Policy Alternatives
10
06/12/1711Centre for Policy Alternatives
What went wrong in the 90s?
The production growth has slumped from 3.19% in the 80s to just 1.73% in the 90s. It is about 1.6% in the 2000’s.
The growth in yield has halved from 2.56% in the 80s to 1.02% in the 90s
India’s yield rates are way behind other agricultural countries
Per capita availability of cereals and pulses largely unchanged since 1980, at about 420 and 36 grams respectively.
06/12/17
12
Centre for Policy Alternatives
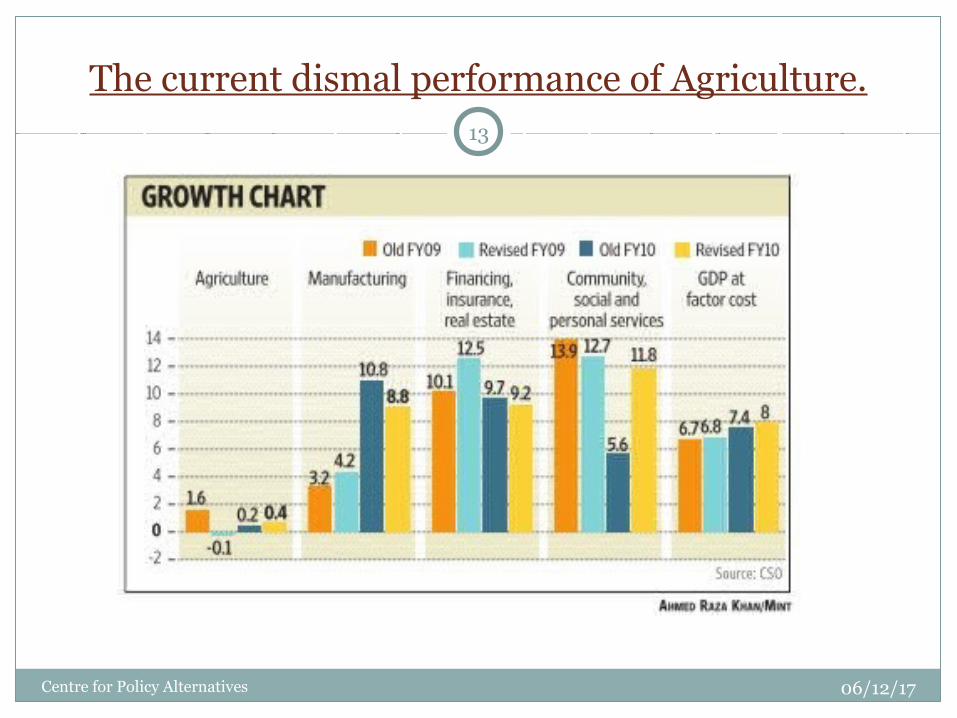
The current dismal performance of Agriculture.
06/12/17Centre for Policy Alternatives
13
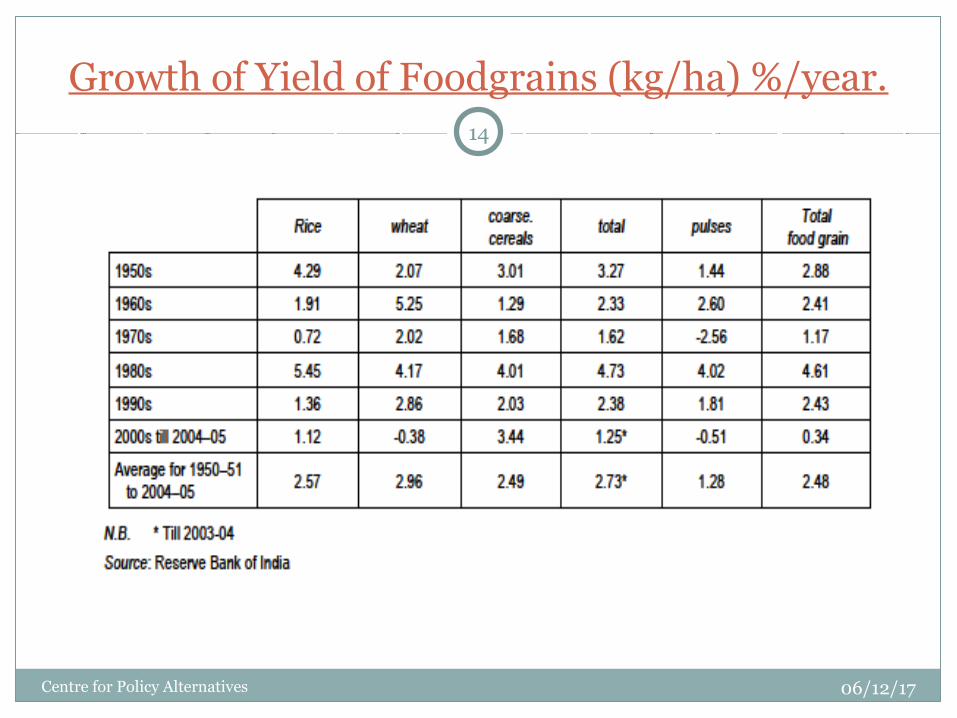
Growth of Yield of Foodgrains (kg/ha) %/year.
06/12/17Centre for Policy Alternatives
14
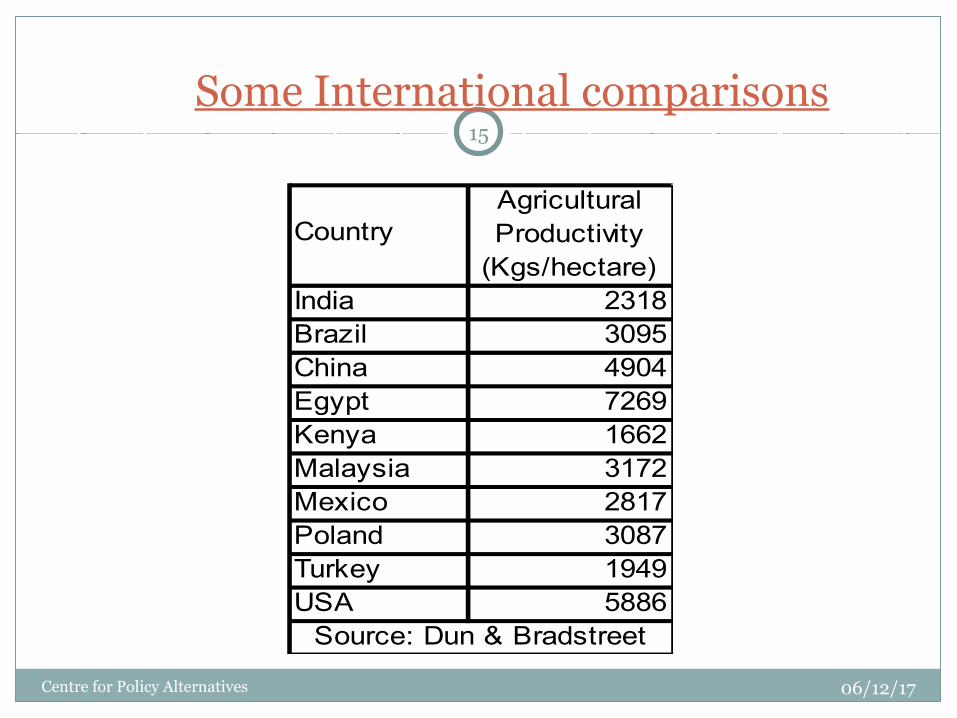
Some International comparisons
India 2318Brazil 3095China 4904Egypt 7269Kenya 1662Malaysia 3172Mexico 2817Poland 3087Turkey 1949USA 5886
Source: Dun & Bradstreet
CountryAgricultural Productivity
(Kgs/hectare)
06/12/17
15
Centre for Policy Alternatives

06/12/1716Centre for Policy Alternatives
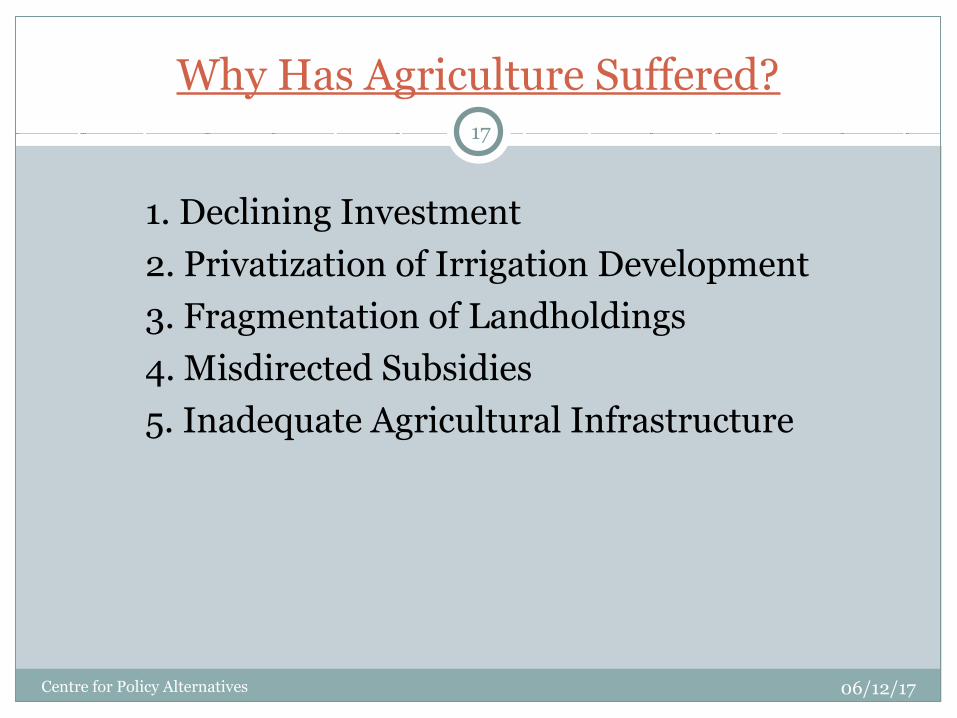
Why Has Agriculture Suffered?
1. Declining Investment
2. Privatization of Irrigation Development
3. Fragmentation of Landholdings
4. Misdirected Subsidies
5. Inadequate Agricultural Infrastructure
06/12/17
17
Centre for Policy Alternatives
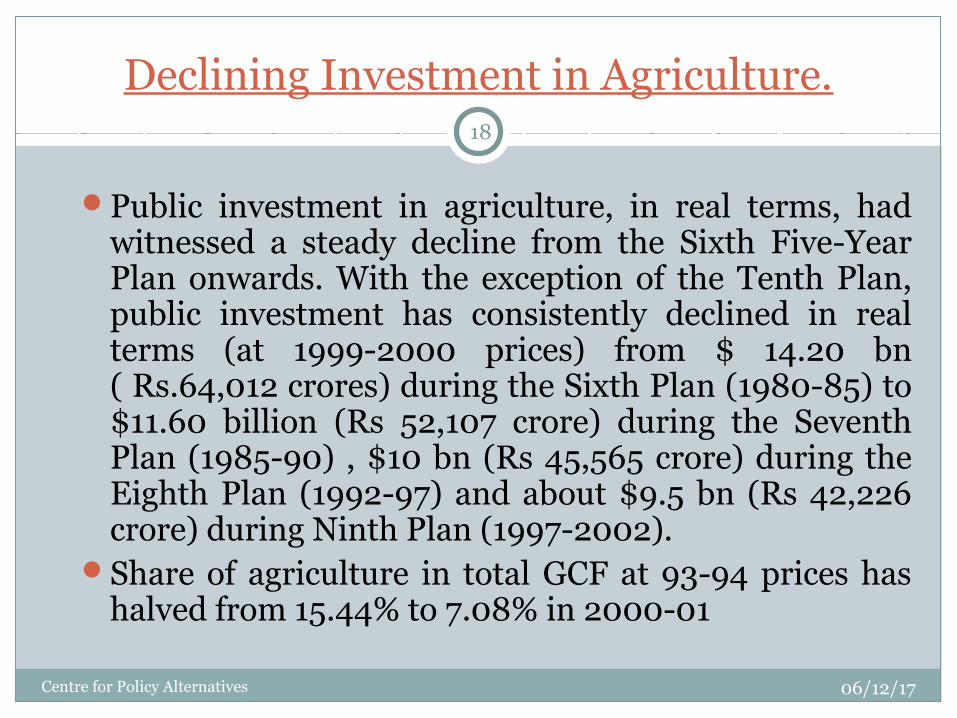
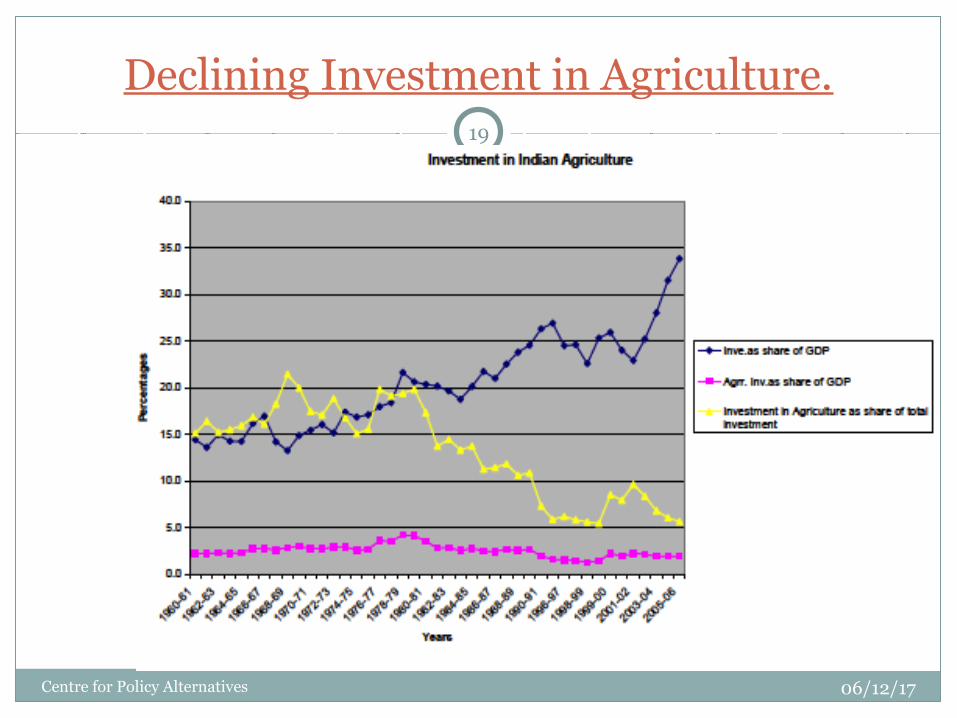
Declining Investment in Agriculture.
Public investment in agriculture, in real terms, had witnessed a steady decline from the Sixth Five-Year Plan onwards. With the exception of the Tenth Plan, public investment has consistently declined in real terms (at 1999-2000 prices) from $ 14.20 bn ( Rs.64,012 crores) during the Sixth Plan (1980-85) to $11.60 billion (Rs 52,107 crore) during the Seventh Plan (1985-90) , $10 bn (Rs 45,565 crore) during the Eighth Plan (1992-97) and about $9.5 bn (Rs 42,226 crore) during Ninth Plan (1997-2002).
Share of agriculture in total GCF at 93-94 prices has halved from 15.44% to 7.08% in 2000-01
06/12/17
18
Centre for Policy Alternatives
Declining Investment in Agriculture.
06/12/17Centre for Policy Alternatives
19
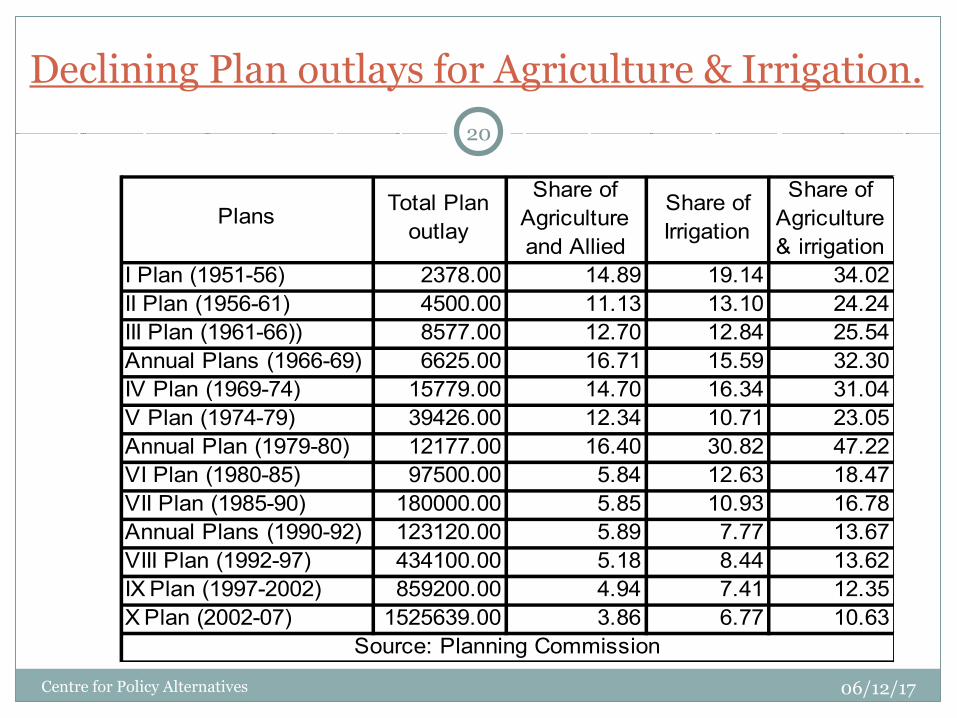
Declining Plan outlays for Agriculture & Irrigation.
I Plan (1951-56) 2378.00 14.89 19.14 34.02II Plan (1956-61) 4500.00 11.13 13.10 24.24III Plan (1961-66)) 8577.00 12.70 12.84 25.54Annual Plans (1966-69) 6625.00 16.71 15.59 32.30IV Plan (1969-74) 15779.00 14.70 16.34 31.04V Plan (1974-79) 39426.00 12.34 10.71 23.05Annual Plan (1979-80) 12177.00 16.40 30.82 47.22VI Plan (1980-85) 97500.00 5.84 12.63 18.47VII Plan (1985-90) 180000.00 5.85 10.93 16.78Annual Plans (1990-92) 123120.00 5.89 7.77 13.67VIII Plan (1992-97) 434100.00 5.18 8.44 13.62IX Plan (1997-2002) 859200.00 4.94 7.41 12.35X Plan (2002-07) 1525639.00 3.86 6.77 10.63
Share of Agriculture & irrigation
Source: Planning Commission
PlansTotal Plan
outlay
Share of Agriculture and Allied
Share of Irrigation
06/12/17
20
Centre for Policy Alternatives
Where is the money going?
In 2001-02 almost half of the amount allocated to irrigation was spent on power generation
While it makes more economic sense to focus on minor irrigation schemes, major and medium irrigation projects have accounted for more than three fourth of the planned funds
06/12/17
21
Centre for Policy Alternatives
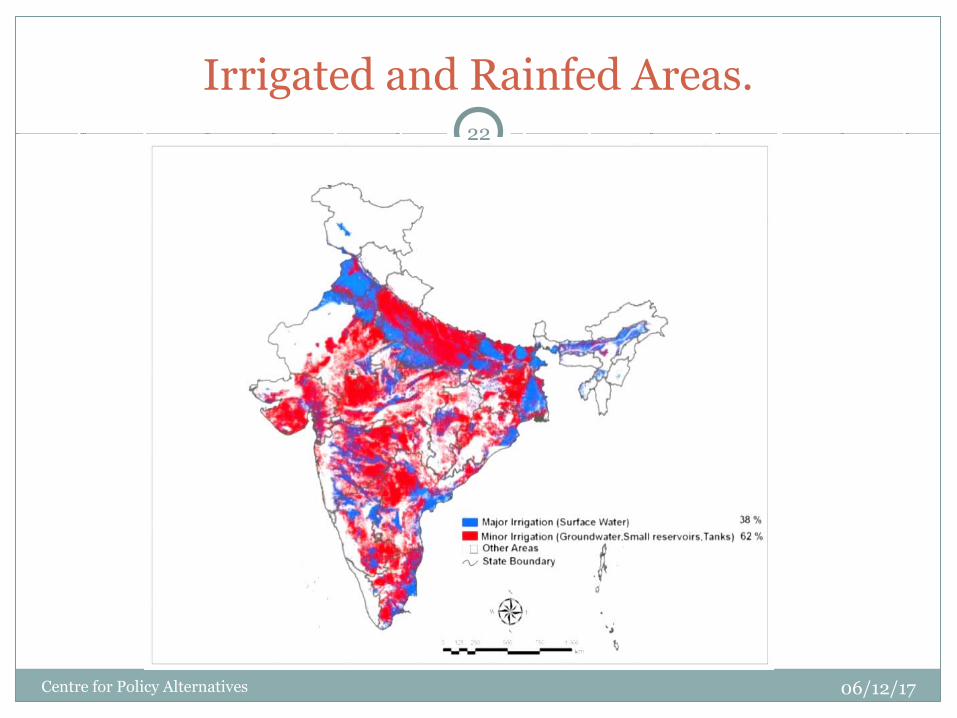
Irrigated and Rainfed Areas.
06/12/17
22
Centre for Policy Alternatives
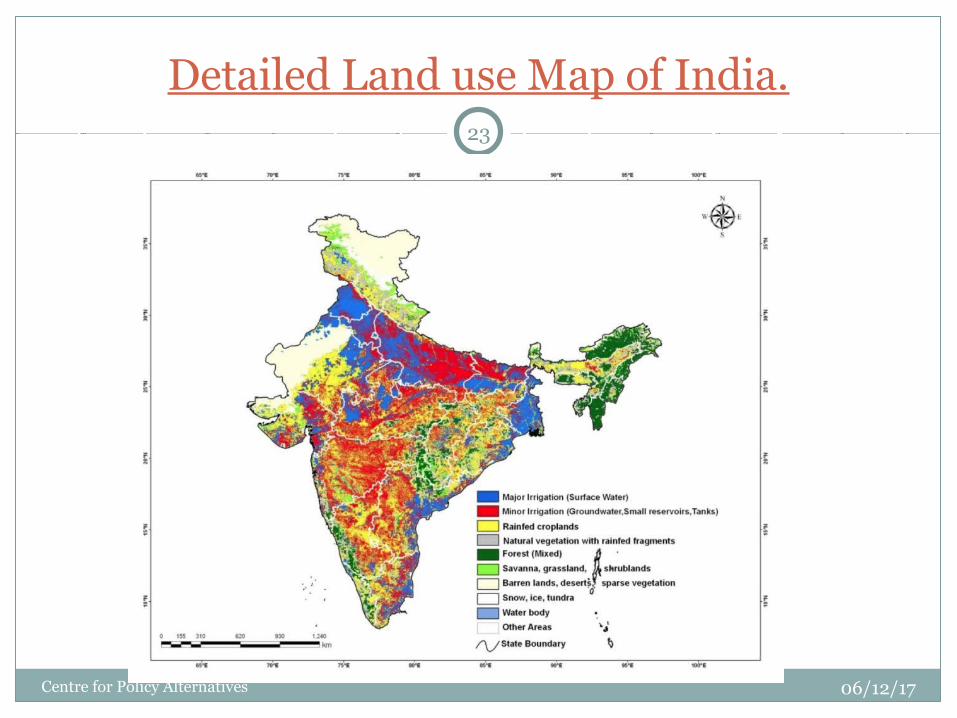
Detailed Land use Map of India.
06/12/17
23
Centre for Policy Alternatives

India has nearly 30% of global annualized irrigated areas, and is the leading irrigated area country in the World.
The total area available for irrigation (TAAI) for India at the end of 2000 was between 101 Mha and 113 Mha.
41 percent was from major irrigation (major and medium irrigation schemes); and
59 percent was from minor irrigation (groundwater, small reservoirs, and tanks).
38 percent was from surface water and 62 percent was from groundwater.
The GIAM estimates about 67 percent of India’s cropland as irrigated and the rest 33 percent rainfed.
Breakup of Irrigation in India.
06/12/17
24
Centre for Policy Alternatives
Privatization of irrigation development.
The entire increase in irrigated acreage in the last decade has been facilitated by mostly private investments in tube-wells and wells
Share of government canals and tanks in net irrigated area has come down from 45.54% in 1980-81 to just 35.39% in 1999-00
Share of tube-wells and wells in net irrigated area has risen from 45.70% in 1980-81 to 58.76% in 1999-00
06/12/17
25
Centre for Policy Alternatives
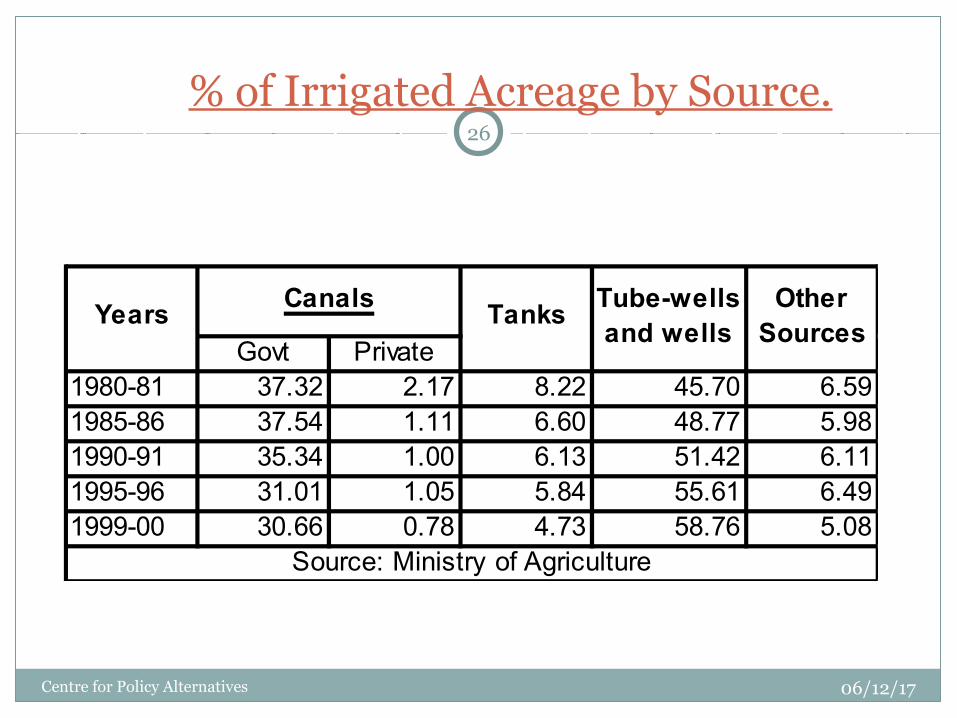
% of Irrigated Acreage by Source.
Govt Private1980-81 37.32 2.17 8.22 45.70 6.591985-86 37.54 1.11 6.60 48.77 5.981990-91 35.34 1.00 6.13 51.42 6.111995-96 31.01 1.05 5.84 55.61 6.491999-00 30.66 0.78 4.73 58.76 5.08
Years
Source: Ministry of Agriculture
Other Sources
TanksTube-wells and wells
Canals
06/12/17
26
Centre for Policy Alternatives
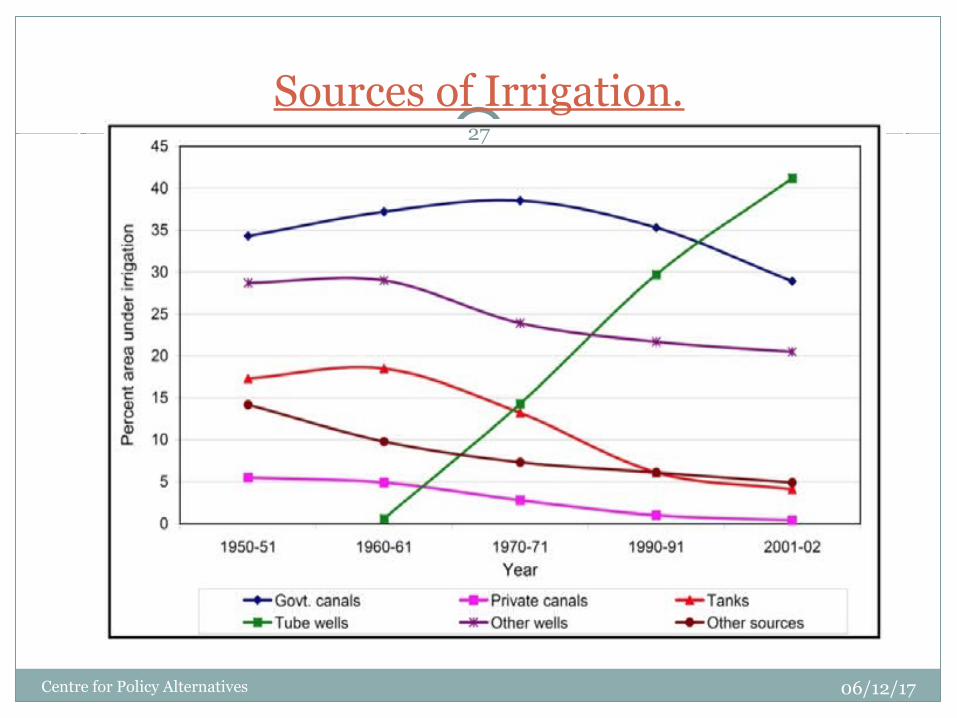
Sources of Irrigation.
06/12/17
27
Centre for Policy Alternatives
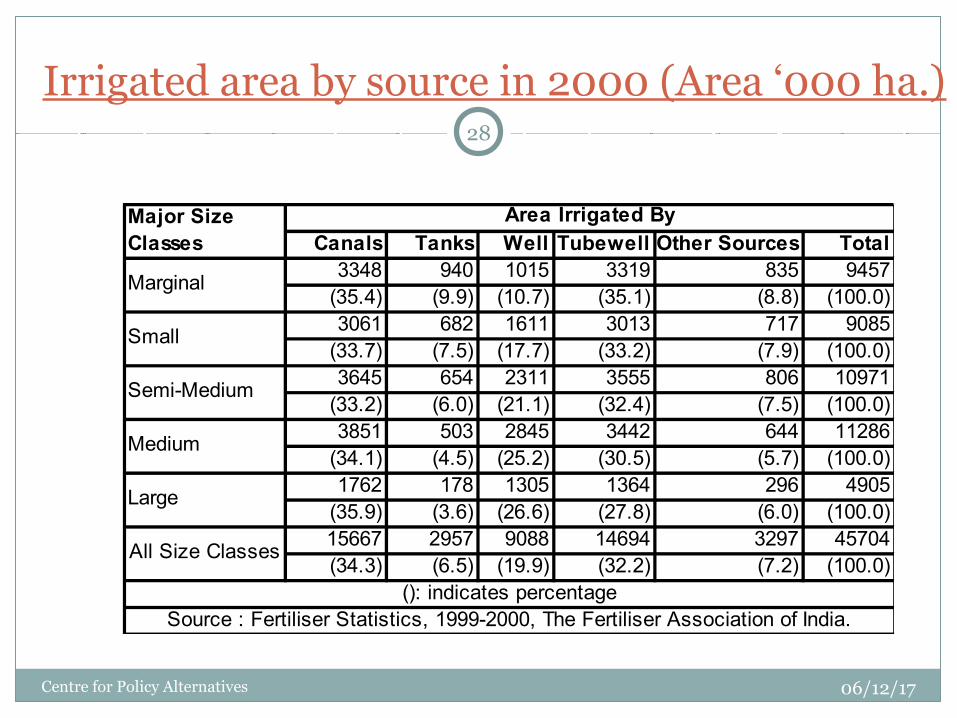
Irrigated area by source in 2000 (Area ‘000 ha.)
Canals Tanks Well Tubewell Other Sources Total3348 940 1015 3319 835 9457
(35.4) (9.9) (10.7) (35.1) (8.8) (100.0)3061 682 1611 3013 717 9085
(33.7) (7.5) (17.7) (33.2) (7.9) (100.0)3645 654 2311 3555 806 10971
(33.2) (6.0) (21.1) (32.4) (7.5) (100.0)3851 503 2845 3442 644 11286
(34.1) (4.5) (25.2) (30.5) (5.7) (100.0)1762 178 1305 1364 296 4905
(35.9) (3.6) (26.6) (27.8) (6.0) (100.0)15667 2957 9088 14694 3297 45704(34.3) (6.5) (19.9) (32.2) (7.2) (100.0)
Major Size Classes
Area Irrigated By
Marginal
Small
Semi-Medium
Medium
Source : Fertiliser Statistics, 1999-2000, The Fertiliser Association of India.(): indicates percentage
Large
All Size Classes
06/12/17
28
Centre for Policy Alternatives
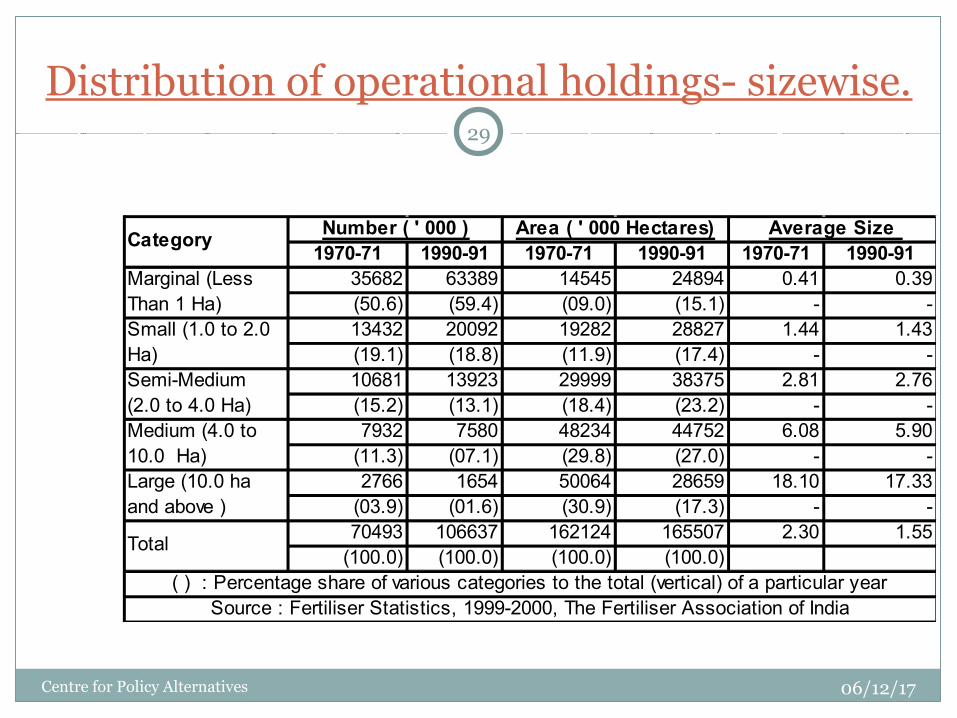
Distribution of operational holdings- sizewise.
1970-71 1990-91 1970-71 1990-91 1970-71 1990-9135682 63389 14545 24894 0.41 0.39(50.6) (59.4) (09.0) (15.1) - -13432 20092 19282 28827 1.44 1.43(19.1) (18.8) (11.9) (17.4) - -10681 13923 29999 38375 2.81 2.76(15.2) (13.1) (18.4) (23.2) - -7932 7580 48234 44752 6.08 5.90
(11.3) (07.1) (29.8) (27.0) - -2766 1654 50064 28659 18.10 17.33
(03.9) (01.6) (30.9) (17.3) - -70493 106637 162124 165507 2.30 1.55
(100.0) (100.0) (100.0) (100.0)
Category Number ( ' 000 ) Area ( ' 000 Hectares) Average Size
Marginal (Less Than 1 Ha)Small (1.0 to 2.0 Ha)Semi-Medium (2.0 to 4.0 Ha)Medium (4.0 to 10.0 Ha)Large (10.0 ha and above )
Total
( ) : Percentage share of various categories to the total (vertical) of a particular yearSource : Fertiliser Statistics, 1999-2000, The Fertiliser Association of India
06/12/17
29
Centre for Policy Alternatives
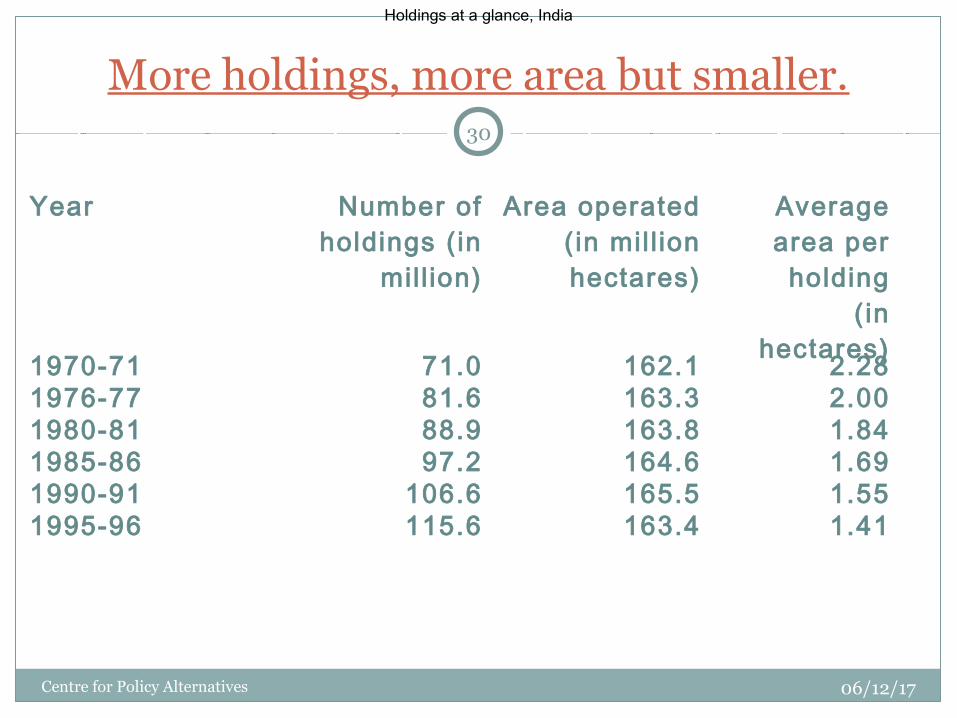
More holdings, more area but smaller.
06/12/17Centre for Policy Alternatives
30
Year Number of holdings (in
mil l ion)
Area operated(in mil l ion hectares)
Average area per
holding(in
hectares)1970-71 71.0 162.1 2.281976-77 81.6 163.3 2.001980-81 88.9 163.8 1.841985-86 97.2 164.6 1.691990-91 106.6 165.5 1.551995-96 115.6 163.4 1.41
Holdings at a glance, India

Distribution of land-holdings and area owned.
06/12/17
31
Centre for Policy Alternatives
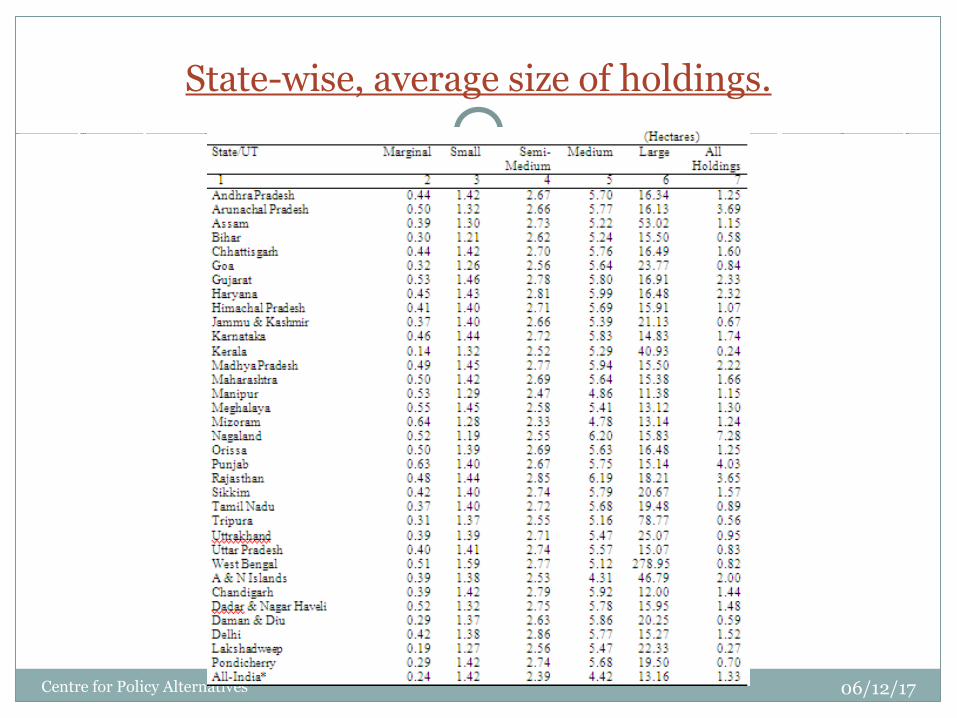
State-wise, average size of holdings.
06/12/17Centre for Policy Alternatives
32
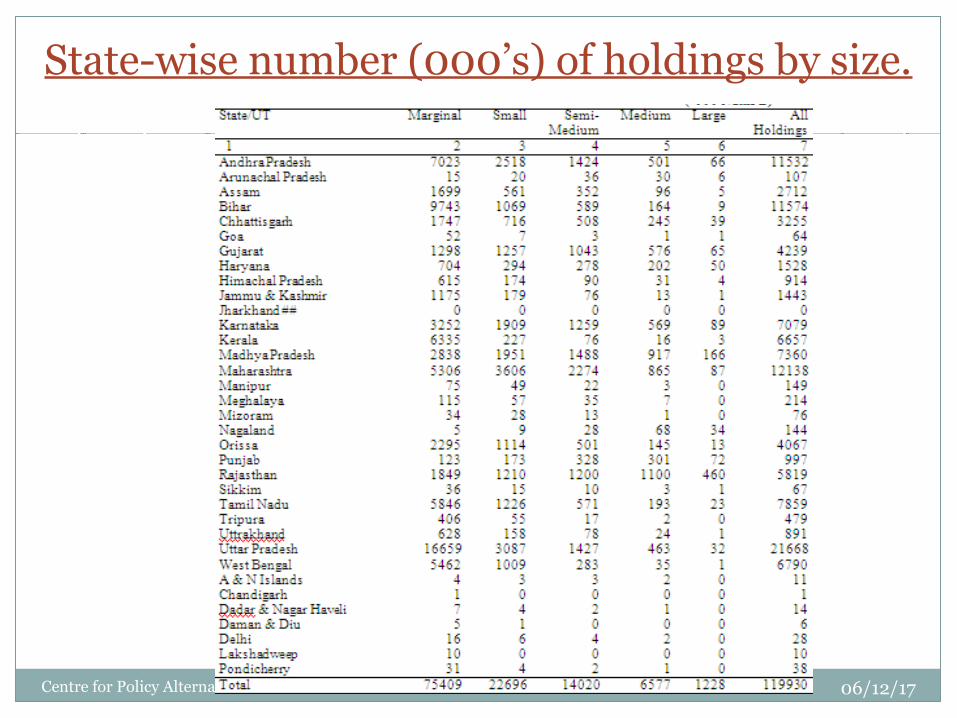
State-wise number (000’s) of holdings by size.
06/12/17Centre for Policy Alternatives
33
Inadequate Agricultural Infrastructure.
About 70% of India lives in rural areas and about 40% of rural habitations are not connected by all-weather roads
Lack of proper transport facility and inadequate post harvesting methods, food processing and transportation of foodstuffs has meant an annual wastage of $12 billion (Rs. 50,000 crores), out of an out of about $83 billion or Rs.370,000 crores.
06/12/17
34
Centre for Policy Alternatives
06/12/1735Centre for Policy Alternatives
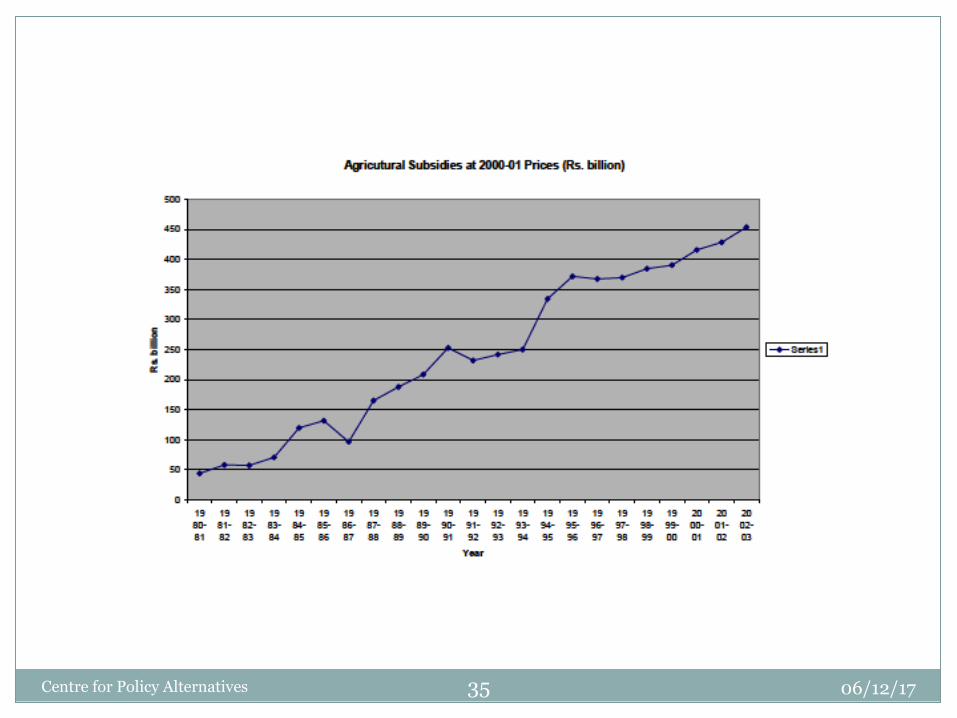
Misdirected Subsidies.
While direct investments in the sector have come down over the last decade, indirect support (subsidies) to the sector has risen rapidly in that period.
1. Food subsidy
2. Power subsidy
3. Fertilizer subsidy
06/12/17
36
Centre for Policy Alternatives
Food Subsidy.
There is a pronounced bias in the government’s procurement policy, with Punjab, Haryana, coastal AP and western UP accounting for the bulk (83.51%) of the procurement
The food subsidy bill has increased from Rs. 24.5 bn in 1990-91 to Rs. 175 bn in 2001-02 to Rs. 562 bn in 2009-10 or about 1% of GDP.
Instead of being the buyer of last resort FCI has become the preferred buyer for the farmers
The government policy has resulted in mountains of food-grains coinciding with starvation deaths
06/12/17
37
Centre for Policy Alternatives
Power Subsidy.
The subsidy provided to agricultural consumers has quadrupled from Rs. 73.35 bn in 1992-93, to Rs. 304.62 bn in 2001-02.
Free or highly subsidized power has meant that farmers have slid to the bottom of the State Electricity Board’s priority list
While the subsidy was launched to reach the lower rung farmers, it has mostly benefited the well-off farmers
06/12/17
38
Centre for Policy Alternatives
Fertilizer subsidy.
The fertilizer subsidy has ballooned from a mere Rs. 5 bn in 1980-81 to Rs. 132.50 billion in 1999-00, and to Rs.1292.43 billion in 2008-9
The fertilizer pricing has meant that it is a producer subsidy and not a consumer subsidy
It has also resulted in an sub-optimal fertilizer mix with too much urea being utilized
06/12/17
39
Centre for Policy Alternatives
Inadequate Agricultural Infrastructure.
About 70% of India lives in rural areas and about 40% of rural habitations are not connected by all-weather roads
Lack of proper transport facility and inadequate post harvesting methods, food processing and transportation of foodstuffs has meant an annual wastage of $11 bn (Rs.50,000 crores out of $82 bn or Rs.370,000 crores output).
06/12/17
40
Centre for Policy Alternatives
The Indian subcontinent boasts nearly half the world's hungry people. Half of all children under five years of age in South Asia are malnourished, which is more than even sub-Saharan Africa. The rural economy in S Asia is predominantly land based, absorbing nearly 70% of the total population. However, tough growing conditions for crops, continuous fragmentation of holdings in these areas make them extremely vulnerable to climatic fluctuations and low yield. In the so-called “poverty square” of South Asia, more than half of the farmland consists of marginal and small farms less than one hectare in size. Moreover, because of rapid population growth, the average farm size in this region has decreased by half every 15 years since 1960. In India approximately 92 million households or 490 million people are dependent on marginal or small farm holdings as per the 2001 census. This translates into 60 per cent of rural population or 42 per cent of total population. The effects of climate change in the form of increased frequency and intensity of drought and flood in the region threatens to affect most these poor farmers, according to the United Nation's report 'The State of World Population, 2009.
The flipside of the great growth story!
06/12/17Centre for Policy Alternatives
41
The writing on the wall!
06/12/17Centre for Policy Alternatives
42
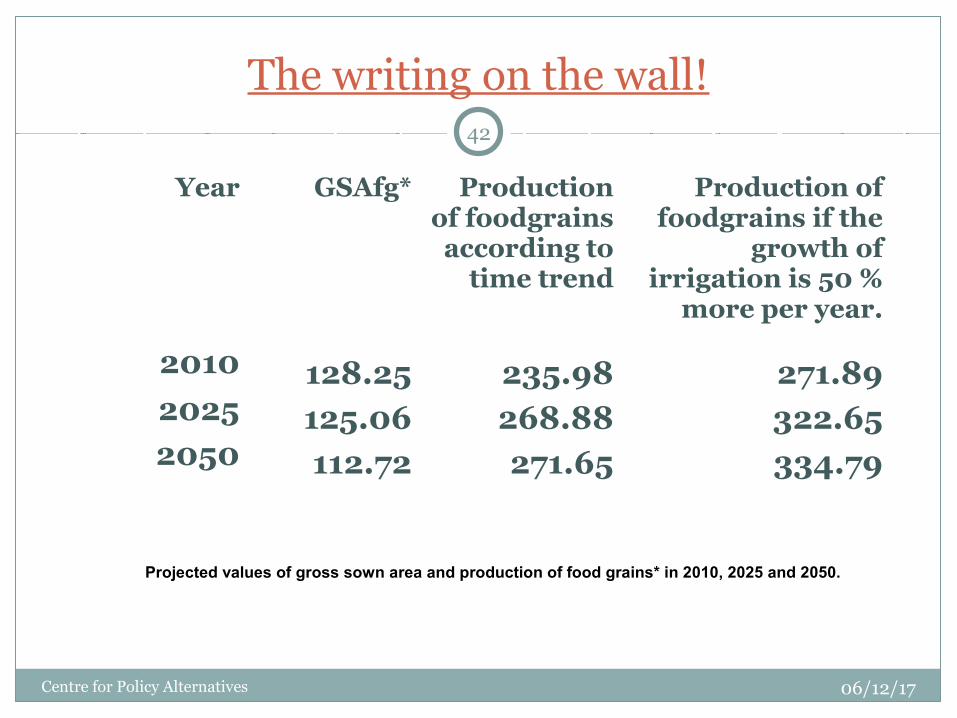
Year GSAfg* Production of foodgrainsaccording to
time trend
Production of foodgrains if the
growth of irrigation is 50 %
more per year.
2010 128.25 235.98 271.892025 125.06 268.88 322.652050 112.72 271.65 334.79
Projected values of gross sown area and production of food grains* in 2010, 2025 and 2050.
The central Indian tribal homeland, located between 18 and 25 degrees north of the equator across the Indian subcontinent, operationally cover nearly 100 districts in eight states of the country. These district together account for about 55 million tribal people (roughly 70 per cent of India’s tribal population) spread over 68 million hectares of geographic area. They form about 7% of Indian population, however their share is very high among the vulnerable groups like poor, hungry and small and marginal farmers. An FAO study indicates a declining role of agriculture in household food security which lasts for 2 to 6 months of the year for the majority of tribal farming households. As per the study an average household in upland systems is only able to meet 20 to 40% of their food requirements; those in the middle system 30 to 40% and those in lowland systems between 50 to 70% of their needs. In the past, most tribals were able to cover most of the shortfall with foods gathered from the forests. Forest degradation and curtailed forest access has reduced the availability of natural foods, compelling these communities, to depend more on purchased foods to meet their minimum survival needs. Sharp rise in international cereal prices of late (2007-08) had also a profound impact on the food security and increased vulnerabilities of the poor in S Asian countries.
06/12/17Centre for Policy Alternatives 43
The plight of India’s tribal people.
06/12/1744Centre for Policy Alternatives
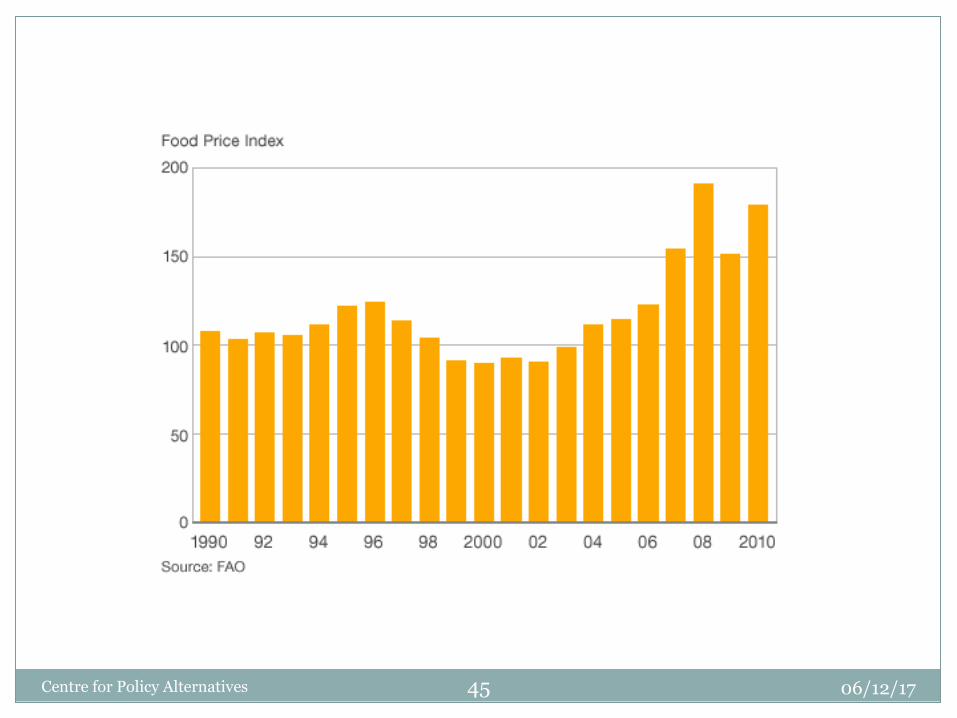
06/12/17Centre for Policy Alternatives 45
06/12/17Centre for Policy Alternatives 46
06/12/17Centre for Policy Alternatives 47

06/12/17Centre for Policy Alternatives 48
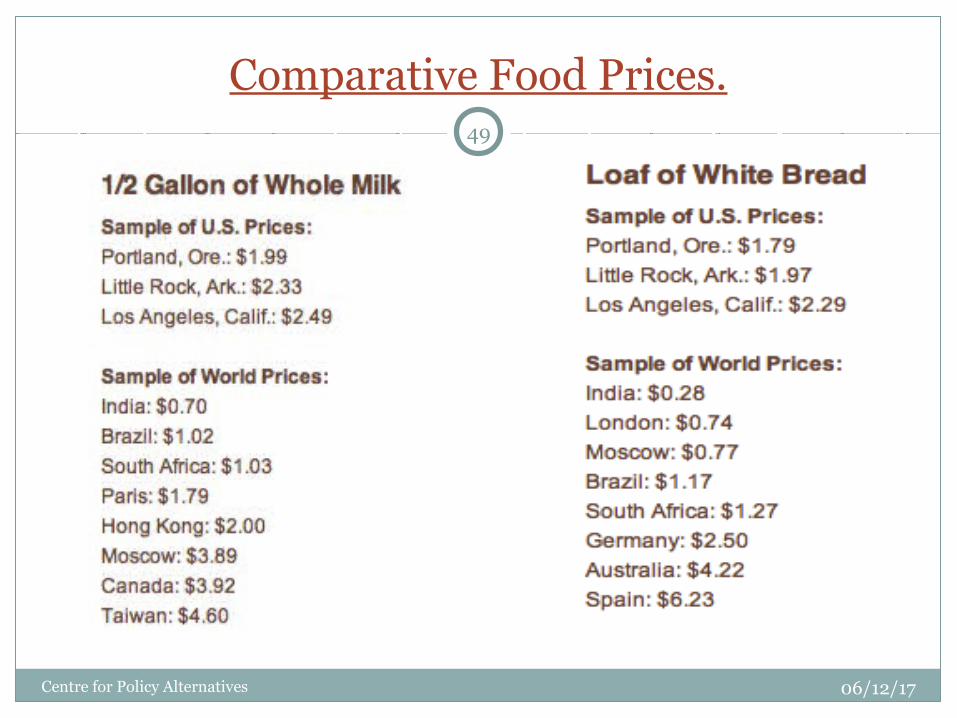
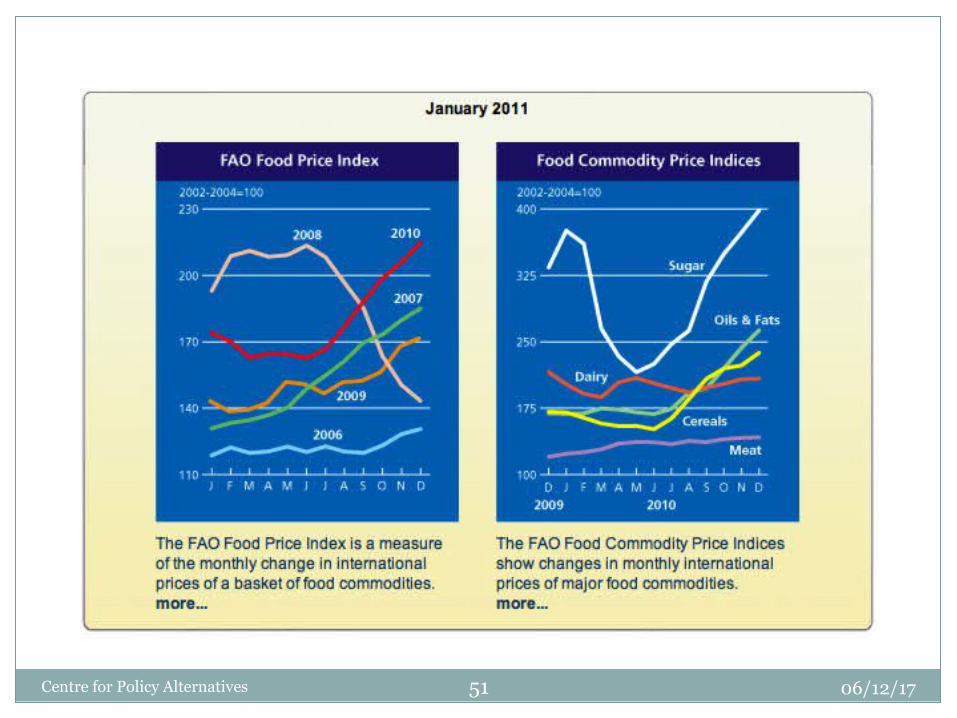
Comparative Food Prices.
06/12/17Centre for Policy Alternatives
49

Comparative Food Prices.
06/12/17Centre for Policy Alternatives
50
06/12/17Centre for Policy Alternatives 51
MOHAN GURUSWAMY
CENTRE FOR POLICY ALTERNATIVES
NEW DELHI
Email: [email protected]
www.cpasindia.org
Thank you!
Centre for Policy Alternatives 06/12/17
52
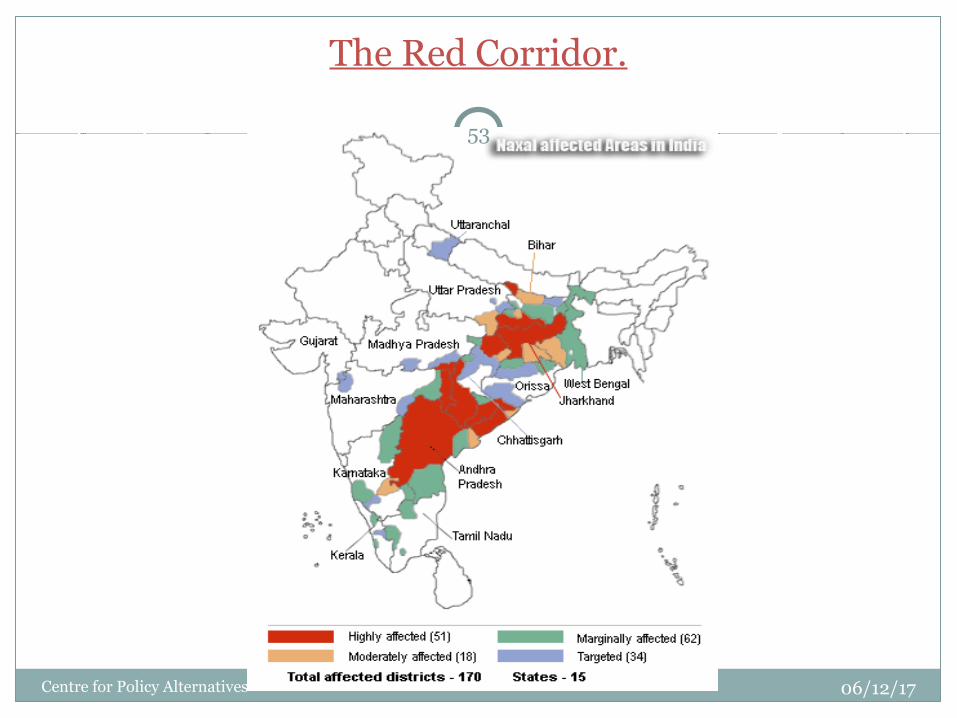
The Red Corridor.
06/12/17
53
Centre for Policy Alternatives
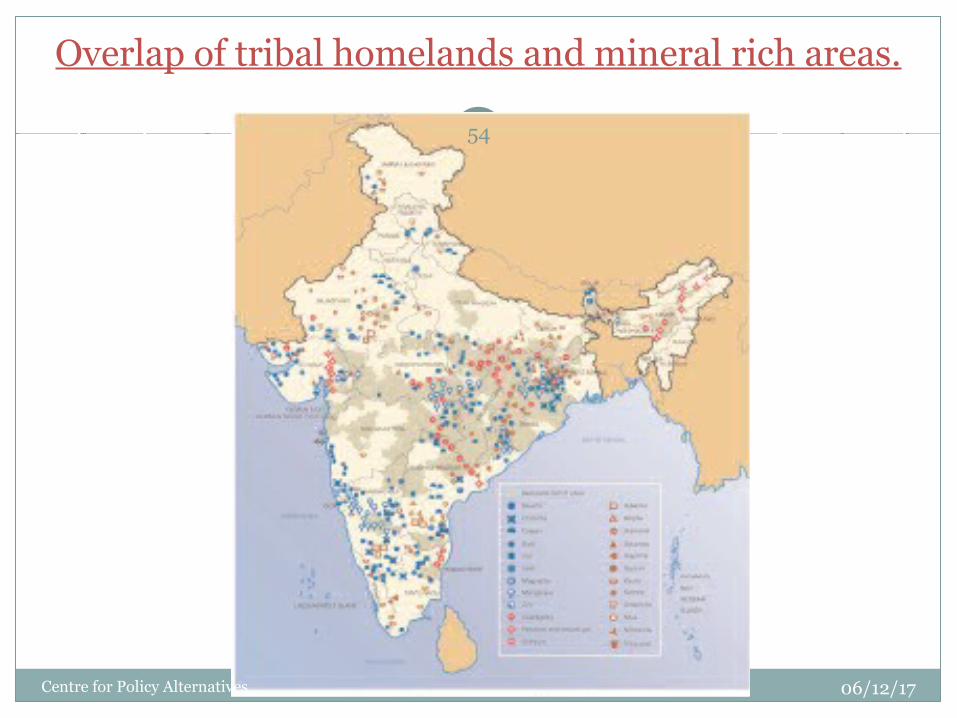
Overlap of tribal homelands and mineral rich areas.
06/12/17
54
Centre for Policy Alternatives
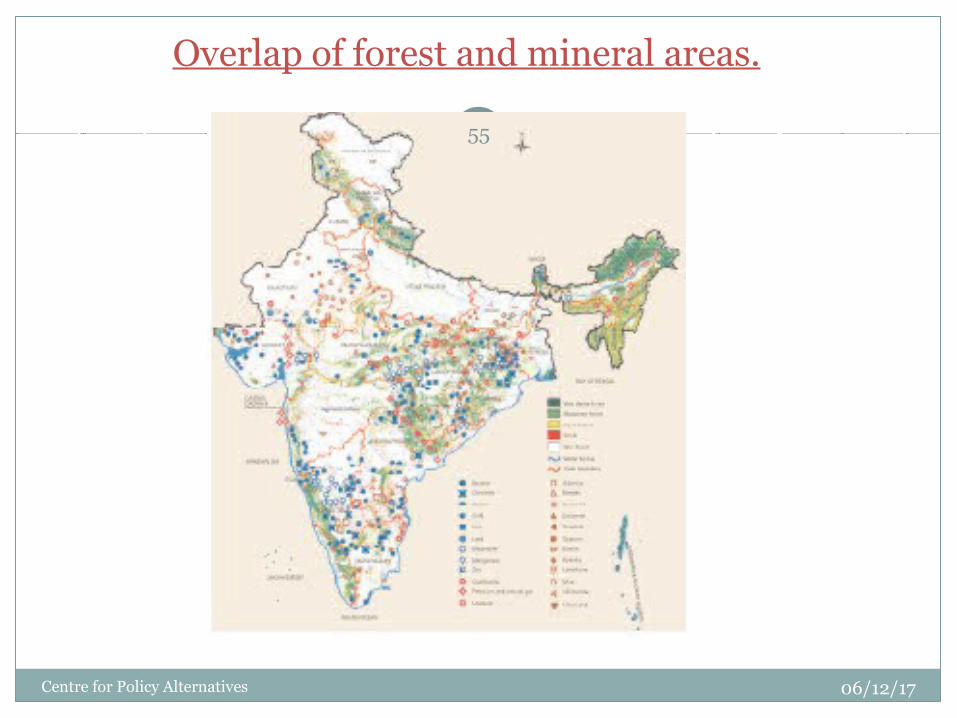
Overlap of forest and mineral areas.
06/12/17
55
Centre for Policy Alternatives
•Net irrigated area (NIA) to Net sown area (NSA) is 14.98% in tribal area against 33.59% in Rest of India.•Net area irrigated by major irrigation systems is 3.66% against 9.89% in Rest of India.•Net area irrigated by minor irrigation is 16.83% against 42.28% in Rest of India.•Groundwater is 11.32% in tribal areas against 24.28% in Rest of India.• Surface lift irrigation is 5.51% in tribal areas against 18.00% in Rest of India.• Population below poverty line is 42.67% in tribal areas against 26.00% in Rest of India.• Value of agricultural output (In Rs/ha) is Rs. 2697.55 in tribal areas against Rs. 8578 /ha. in Rest of India
Comparison of Irrigated area in Tribal & non-tribal areas.
06/12/17Centre for Policy Alternatives
56