Embed Size (px)
Citation preview

Critical and Sensitive Periods of Health For CognitiveAchievement in Young Peruvian Children
John Creamer
29 March 2016

Outline
1 Overview
2 Empirical Strategy
3 Results
4 Conclusion

Overview
Motivation
Previous research from Cunha and Heckman (2007) introduces criticaland sensitive periods of development
Critical period is when one period of the development cycle has areturn on investment, others do notSensitive period is when one period has a greater effect than all of theothers
Crookston et al. (2013) and Lopez-Boo (2009) (amongst others) hasshown positive impact of health on cognitionIs there an intersection between the two?
Overview
Contributions
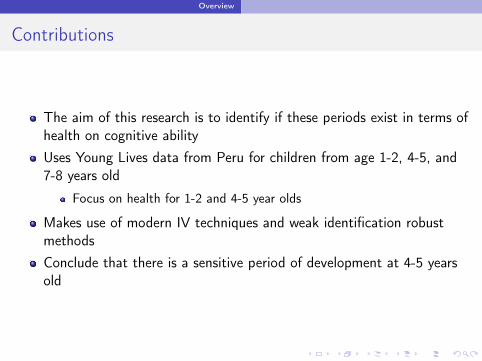
The aim of this research is to identify if these periods exist in terms ofhealth on cognitive abilityUses Young Lives data from Peru for children from age 1-2, 4-5, and7-8 years old
Focus on health for 1-2 and 4-5 year olds
Makes use of modern IV techniques and weak identification robustmethodsConclude that there is a sensitive period of development at 4-5 yearsold
Empirical Strategy
Theoretical model
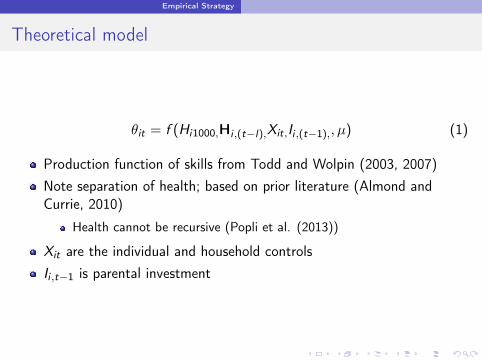
✓it = f (Hi1000,Hi ,(t�l),Xit,Ii ,(t�1),, µ) (1)
Production function of skills from Todd and Wolpin (2003, 2007)Note separation of health; based on prior literature (Almond andCurrie, 2010)
Health cannot be recursive (Popli et al. (2013))
Xit are the individual and household controlsIi ,t�1 is parental investment

Empirical Strategy
Estimating Equation
Linearise equation 1 to get
✓it = �0 + �1Hi ,(t�l) + �2Hi1000 + �3Ii ,(t�1) + �4Xit + µ+ ✏it (2)
Sensitive period at: |�1| > |�2| 6= 01
Critical period at: �1 6= 0; �2 = 0Coefficients interpreted as direct effects (Georgiadis et al. (2016))
1Popli et al. (2013)

Empirical Strategy
Endogeneity Concerns
Past literature and theory states that health is endogenousCannot disentangle direction of causation between health and cognitionCorrelation between health and unobserved factors such as endowmentand household decisionsTwo endogenous regressors
Lopez-Boo (2009) gives priors on direction of biasUpward if parents are reinforcing a child’s cognitionDownward if parents look to compensate for lagging cognitive ability

Empirical Strategy
Dealing with Endogeneity
Instrumental variables using birthweight and mother’s heightLewbel IV method
Creating instruments from heteroskedastic errors in the reduced formequationsWeak Instrument problem
Weak identification robust inference
Results
Data
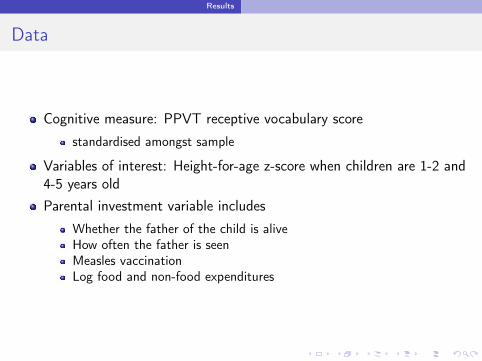
Cognitive measure: PPVT receptive vocabulary scorestandardised amongst sample
Variables of interest: Height-for-age z-score when children are 1-2 and4-5 years oldParental investment variable includes
Whether the father of the child is aliveHow often the father is seenMeasles vaccinationLog food and non-food expenditures

Results
Data
Control for household and individual characteristics and location(urban/rural and community)Previous research indicates a downward bias on OLS estimates (seeLopez-Boo (2009), Lopez-Boo and Canon (2014))Sample size of 1318
Remove children with no birthweight measurement and who’s primarylanguage is QuechuaAlso remove height-for-age z-scores greater and less than 5

Results
Table 1: OLS Regressions
(1) (2) (3)Height for Age R2 0.239⇤⇤⇤ 0.0954⇤⇤⇤ 0.0847⇤⇤⇤
(0.0333) (0.0253) (0.0284)Height for Age R1 -0.00957 0.0334 0.0405
(0.0301) (0.0240) (0.0249)Observations 1318 1318 1318R-squared 0.203 0.357 0.385Standard errors in parenthesesRobust Standard Errors, clustered on sentinel siteCluster fixed effects models use robust standard errors⇤ p < 0.1, ⇤⇤ p < 0.05, ⇤⇤⇤ p < 0.01
Results
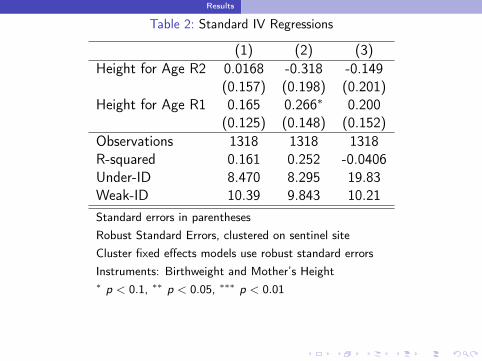
Table 2: Standard IV Regressions
(1) (2) (3)Height for Age R2 0.0168 -0.318 -0.149
(0.157) (0.198) (0.201)Height for Age R1 0.165 0.266⇤ 0.200
(0.125) (0.148) (0.152)Observations 1318 1318 1318R-squared 0.161 0.252 -0.0406Under-ID 8.470 8.295 19.83Weak-ID 10.39 9.843 10.21Standard errors in parenthesesRobust Standard Errors, clustered on sentinel siteCluster fixed effects models use robust standard errorsInstruments: Birthweight and Mother’s Height⇤ p < 0.1, ⇤⇤ p < 0.05, ⇤⇤⇤ p < 0.01

Results
Lewbel Point Estimates and Test Statistics
Table 3: Lewbel Regressions
(1) (2) (3)Height for Age R2 0.128 0.160 0.619
(0.134) (0.110) (0.591)Height for Age R1 0.0817 0.0290 -0.128
(0.100) (0.0755) (0.221)Observations 1318 1318 1318R-squared 0.352 0.0129 -0.225Under-ID 5.706 18.46 2.806Weak-ID 3.448 177.3 1.244Standard errors in parenthesesRobust Standard Errors, clustered on sentinel site⇤ p < 0.1, ⇤⇤ p < 0.05, ⇤⇤⇤ p < 0.01
Mother’s Height Parent Investment All controls

Conclusion
Conclusion
Weak identification makes it difficult to come to the conclusion of acritical period of development
Sensitive period is concluded as a result. What does this mean?Weakness in terms of direct effects, not total
Supports previous researchOutes-Leon and Porter (2013) and Crookston et al. (2013) both showpossibility of catch up
More research necessary to determine how general the results are

Conclusion
Almond, D. & Currie, J. Human Capital Development Before Age FiveHandbook of Labor Economics, 2010, 4(b), 1315-1486
Crookston, B. T.; Schott, W.; Cueto, S.; Dearden, K. A.; Engle, P.;Georgiadis, A.; Lundeen, E. A.; Penny, M. E.; Stein, A. D. & Behrman,J. R. Postinfancy growth, schooling, and cognitive achievement: YoungLives The American journal of clinical nutrition, Am Soc Nutrition,2013, 98, 1555-1563
Cunha, F. & Heckman, J. The Technology of Skill Formation AmericanEconomic Review Papers and Proceedings, 2007, 97:2, 31-47
Georgiadis, A.; Benny, L.; Crookston, B. T.; Hermida, P.; Mani, S.;Woldehanna, T.; Stein, A. D.; Behrman, J. R. & others Growthtrajectories from conception through middle childhood and cognitiveachievement at age 8 years: Evidence from four low-and middle-incomecountries SSM-Population Health, Elsevier, 2016
Lopez-Boo, F. The Production Function of Cognitive Skills: Nutrition,Parental Inputs and Caste Test Gaps in India Young Lives WorkingPaper no.55, Young Lives, 2009
Extra tables
Lopez Boo, F. & Canon, M. E. Cognitive skills gaps in India: can (late)nutrition ameliorate them? FRB of St. Louis Working Paper No, 2014.
Popli, G.; Gladwell, D. & Tsuchiya, A. Estimating the critical andsensitive periods of investment in early childhood: A methodologicalnote Social Science & Medicine, Elsevier, 2013, 97, 316-324
Todd, P. E. & Wolpin, K. I. On the specification and estimation of theproduction function for cognitive achievement* The Economic Journal,Wiley Online Library, 2003, 113, F3-F33
— The production of cognitive achievement in children: Home, school,and racial test score gaps Journal of Human capital, JSTOR, 2007, 1,91-136
Extra tables
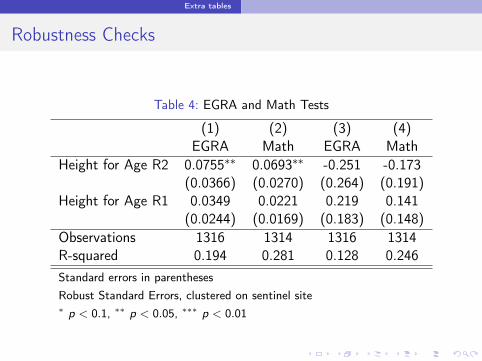
Robustness Checks
Table 4: EGRA and Math Tests
(1) (2) (3) (4)EGRA Math EGRA Math
Height for Age R2 0.0755⇤⇤ 0.0693⇤⇤ -0.251 -0.173(0.0366) (0.0270) (0.264) (0.191)
Height for Age R1 0.0349 0.0221 0.219 0.141(0.0244) (0.0169) (0.183) (0.148)
Observations 1316 1314 1316 1314R-squared 0.194 0.281 0.128 0.246Standard errors in parenthesesRobust Standard Errors, clustered on sentinel site⇤ p < 0.1, ⇤⇤ p < 0.05, ⇤⇤⇤ p < 0.01

Extra tables
Mother’s Height Generated Instrument
Figure 1: Confidence Set with Mother’s Height as generated instrument
Table 4

Extra tables
Figure 2: K Confidence Set
Table 4

Extra tables
Parental Investment Generated Instrument
Figure 3: Confidence Set with Parental Investment as generated instrument
Table 4
Extra tables
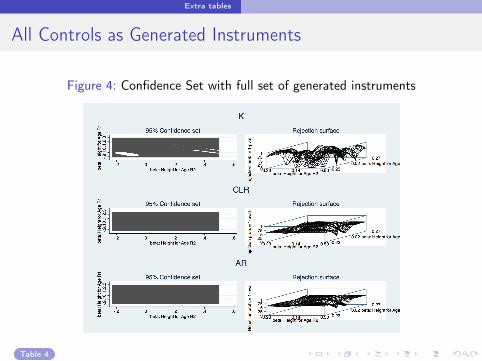
All Controls as Generated Instruments
Figure 4: Confidence Set with full set of generated instruments
Table 4