Embed Size (px)
Citation preview


CAPITALMIND • (C) ALL RIGHTS RESERVED • capitalmind.in Nov'15 The SparkPlug Report 2
Capital Mind Premium: The Sparkplug ReportNovember 2015
A First Look at November's Auto Industry Sales Data
The automotive industry witnessed a mixed reaction to the early festivities.
• Production stood at 1,799,478 units; a decline of -9.76% (YoY) or 194,539 units.
• Domestic Sales touched 1,654,226 units compared to 1,603,312 units during the same month of the previous year. This translated into agrowth of +3.18% (YoY) or 50,914 units.
• Exports had a massive impact with a decline of -17.61% (YoY) the lowest during the current year. 275,639 units were exported inNovember compared to 334,552 units during the same month of the previous year resulting in a decline of 58,913 units.
There is a Diwali effect at play here, since Diwali was in November this year, while it was in October last year. This changes the dynamicsand the only way to figure out how we have done is to add both October + November numbers together.
• Special Note: October + November (Diwali Effect) =
• Production: +2.31% (YoY)
• Domestic Sales: +8.84% (YoY)
• Exports: -11.85% (YoY)
• Effectively, after removing the Diwali Impact, sales are up 8%, but exports are down severely.
New Launches
1) Honda Motorcycles launched the CB Shine SP (Smart Power). The new 125cc commuter bike will replace Honda's existing CB Shine andwill be the 14th product of the 15 Honda bikes to be launched here by 2015.
2) Other manufacturers failed to launch any new vehicles and rather stuck with adding new features to existing models as they all loststeam due to the October new launches.

This is how the companies stack up!(% change YoY)
CAPITALMIND • (C) ALL RIGHTS RESERVED • capitalmind.in Nov'15 The SparkPlug Report 3
Company Production Domestic Exports
Ashok Leyland10,124
↑ 24.24%7,979
↑ 24.05%992
↓ -22.14%
Atul Auto3,863
↓ -7.14%3,995
↑ 8.68%10
↓ -92.37%
Bajaj Auto285,618
↓ -11.26%172,358
↑ 20.09%137,249
↓ -17.19%
Fiat India531
↓ -49.72%606
↓ -20.26%0
↓ 0.00%
Force Motors1,579
↓ -10.34%1,418
↑ 3.73%11
↓ -15.38%
Ford India13,998
↓ -9.87%8,773
↑ 54.97%8,416
↑ 18.52%
General Motors1,695
↓ -56.02%2,475
↓ -38.23%3,940
↑ 2526.67%
Hero MotoCorp506,361
↓ -8.67%538,180 ↑ 3.30%
12,551 ↓ -52.48%
Honda Cars16,559
↓ -2.55%14,712
↓ -3.61%120
↓ -86.52%
Honda Motorcycle & Scooter India319,179
↓ -13.75%311,946
↓ -11.82%14,391
↓ -20.17%
Hyundai Motor India49,771
↓ -5.57%43,651
↑ 22.92%14,008
↓ -25.41%
India Yamaha Motor48,880
↓ -22.99%42,718
↓ -4.39%12,643
↓ -13.99%
Mahindra & Mahindra41,317
↑ 8.07%39,383
↑ 22.69%2,207
↑ 0.68%
Mahindra Two Wheelers11,985
↓ -33.50%18,061
↑ 38.38%1,027
↓ -32.74%
Company Production Domestic Exports
Maruti Suzuki India103,495
↓ -11.80%110,599
↑ 10.57%10,225
↑ 1.02%
Nissan Motor India10,322
↓ -18.49%2,617
↑ 28.22%8,538
↓ -18.69%
Piaggio Vehicles16,223
↓ -13.25%14,567
↓ -1.38%2,022
↓ -28.22%
Renault India5,778
↑ 75.68%7,819
↑ 144.27%8
↓ -96.31%
Royal Enfield (Unit of Eicher)40,009
↑ 42.74%40,312
↑ 48.22%457
↑ 32.85%
SML Isuzu1,151
↑ 124.37%660
↑ 27.91%23
↑ 35.29%
Suzuki Motorcycle26,802
↓ -19.71%23,364
↓ -26.35%2,852
↑ 70.17%
TVS Motor Company220,232
↓ -4.29%191,780 ↑ 6.05%
33,621 ↓ -14.26%
Tata Motors35,817
↓ -22.38%35,345
↓ -5.56%3,573
↓ -16.77%
Toyota Kirloskar Motor10,946
↓ -23.93%10,278
↓ -15.58%1,120
↓ -42.89%
VECVs - Eicher3,490
↑ 26.59%2,905
↑ 30.09%629
↑ 15.41%
VECVs - Volvo67
↓ -36.79%105
↓ -11.02%0
↓ 0.00%
Volkswagen India15,354
↓ -15.98%3,884
↓ -49.51%9,416
↓ -17.62%

CAPITALMIND • (C) ALL RIGHTS RESERVED • capitalmind.in Nov'15 The SparkPlug Report 4

CAPITALMIND • (C) ALL RIGHTS RESERVED • capitalmind.in Nov'15 The SparkPlug Report 5
Capital Mind Premium: The Sparkplug ReportNovember 2015
What FollowsWhat follows is charts of each company's production, domestic sales and exports, compared to last year, for the first eight months of theyear. We have divided this into sections for:
• Two wheelers
• Three wheelers
• Passenger vehicles (Cars, SUVs)
• Commercial vehicles (Trucks, Buses)
We summarize each section as a whole in the beginning and then provide charts for each company.
All data is sourced from SIAM. Charts are by Capital Mind.
Disclaimer: While we have made all efforts to ensure that the data is clean and correct, we cannot vouch for the authenticity of this data andwhether it will reflect accurately in company books, due to the secondary nature which involves company releases to SIAM and then onwardto us. These numbers are not audited. We do not recommend the use of this information for trading or speculation in stocks, and none ofthis is investment advice.

TWO WHEELERS

TWO WHEELERS
CAPITALMIND • (C) ALL RIGHTS RESERVED • capitalmind.in Nov'15 The SparkPlug Report 7
1484
187
1598
895
1443
861
1577
334
1541
304
1785
560
1608
220
1561
587
1488
509
1560
164
1486
580
1602
348
1546
310
1730
992
1830
239
1418
592
Apr May Jun Jul Aug Sep Oct Nov0
500000
1000000
1500000
PRODUCTION-2014 -2015
1289
183
1398
376
1262
883
1298
694
1345
506
1553
608
1461
712
1301
434
1287
064
1380
950
1307
710
1300
457
1305
350
1537
137
1656
235
1320
561
Apr May Jun Jul Aug Sep Oct Nov0
500000
1000000
1500000
DOMESTIC SALES-2014 -2015
1949
31
2139
73
1822
32 2225
83
2335
51
2291
18
2149
11
2286
52
1846
61
2118
20
2310
08
2377
08
2511
82
2333
02
1896
98
1894
90
Apr May Jun Jul Aug Sep Oct Nov0
50000
100000
150000
200000
250000
EXPORTS-2014 -2015
-5%
0%
5%
10%
0.29%
-2.42%
2.96%1.59%
0.32%
-3.06%
13.81%
-9.16%
YoY GROWTH
Apr May Jun Jul Aug Sep Oct Nov
0%
5%
10%
-0.16%-1.25%
3.55%
0.14%
-2.98%
-1.06%
13.31%
1.47%
YoY GROWTH
Apr May Jun Jul Aug Sep Oct Nov
-10%
0%
10%
20%
-5.27%
-1.01%
26.77%
6.80% 7.55%
1.83%
-11.73%
-17.13%
YoY GROWTH
Apr May Jun Jul Aug Sep Oct Nov

CAPITALMIND • (C) ALL RIGHTS RESERVED • capitalmind.in Nov'15 The SparkPlug Report 8
Capital Mind Premium: The Sparkplug ReportNovember 2015
Two Wheelers
How did this segment fare? Let's take a look at the segment analysis; the sub-segment and each of the constituents:
Segment Analysis:• Production fell from 1,561,587 units to 1,418,592 units resulting in a decline of -9.16% (YoY)
• Domestic Sales grew from 1,301,434 units to 1,320,561 units resulting in a growth of +1.47% (YoY
• Exports declined from 228,652 units to 189,490 units resulting in the worst decline for the year at -17.13% (YoY)
• All this translated into an overall sales decline of -1.31% (YoY)
• Special Note: October + November (Diwali Effect) =
• Production: +2.49% (YoY)
• Domestic Sales: +7.73% (YoY)
• Exports: -14.51% (YoY)
CAPITALMIND • (C) ALL RIGHTS RESERVED • capitalmind.in Nov'15 The SparkPlug Report 9
Capital Mind Premium: The Sparkplug ReportNovember 2015
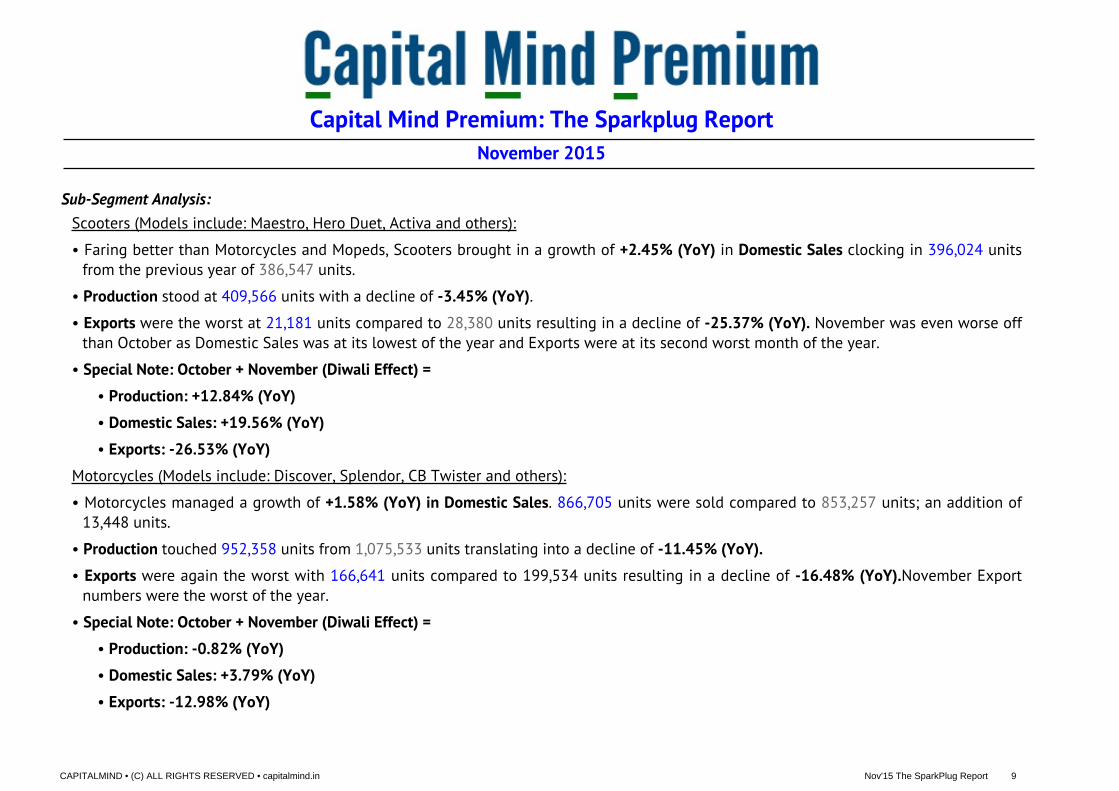
Sub-Segment Analysis:Scooters (Models include: Maestro, Hero Duet, Activa and others):
• Faring better than Motorcycles and Mopeds, Scooters brought in a growth of +2.45% (YoY) in Domestic Sales clocking in 396,024 unitsfrom the previous year of 386,547 units.
• Production stood at 409,566 units with a decline of -3.45% (YoY).
• Exports were the worst at 21,181 units compared to 28,380 units resulting in a decline of -25.37% (YoY). November was even worse offthan October as Domestic Sales was at its lowest of the year and Exports were at its second worst month of the year.
• Special Note: October + November (Diwali Effect) =
• Production: +12.84% (YoY)
• Domestic Sales: +19.56% (YoY)
• Exports: -26.53% (YoY)
Motorcycles (Models include: Discover, Splendor, CB Twister and others):
• Motorcycles managed a growth of +1.58% (YoY) in Domestic Sales. 866,705 units were sold compared to 853,257 units; an addition of13,448 units.
• Production touched 952,358 units from 1,075,533 units translating into a decline of -11.45% (YoY).
• Exports were again the worst with 166,641 units compared to 199,534 units resulting in a decline of -16.48% (YoY).November Exportnumbers were the worst of the year.
• Special Note: October + November (Diwali Effect) =
• Production: -0.82% (YoY)
• Domestic Sales: +3.79% (YoY)
• Exports: -12.98% (YoY)

CAPITALMIND • (C) ALL RIGHTS RESERVED • capitalmind.in Nov'15 The SparkPlug Report 10
Capital Mind Premium: The Sparkplug ReportNovember 2015
Constituent Analysis:• Outliers (manufacturer with the highest growth):
• Production: +42.74% (YoY) - Royal Enfield (Unit of Eicher)
• Domestic Sales: +48.22% (YoY) - Royal Enfield (Unit of Eicher)
• Exports: +70.17% (YoY) - Suzuki Motorcycle
• Total Overall Sales: +48.02% (YoY) - Royal Enfield (Unit of Eicher)
• Bajaj Auto broke into positive growth after 2 continuous months in the red. Overall Sales increased by +3.41% (YoY). Domestic Salesstood at +19.60% (YoY) - the only manufacturer after Royal Enfield and Mahindra Two Wheelers to clock in double digit growth. Exportswere bleak at -11.97% (YoY). Its market share increased from 16.73% to 17.94%.
• Hero MotoCorp - after 2 continuous months of 6 lakh+ sales, the overall sales for November fell to 550,731 units. Hero MotoCorp notonly managed to protect its market share from its rivals but also ate 1.81% into their share thereby increasing its total market share to36.47% from 34.66%. Domestic Sales fell from 13.50% (YoY) to 3.30% (YoY). Exports took a huge hit at -52.48% (YoY) continuing a 4month streak in the red.
• Honda Motorcycle & Scooter India (HMSI) lost over 2% of its market share during the month of November. All figures were in the red.Production was down -13.75% (YoY), Domestic Sales was also in the red at -11.82% (YoY), and Exports stood at -20.17% (YoY).November was the worst month for HMSI with an overall sales growth of -12.22% (YoY).
• Royal Enfield continued to outperform its rivals with a growth of +48.22% (YoY) in Domestic Sales and +32.85% (YoY) in Exports.December is expected to be in the red as the Chennai floods have caused most of the automotive majors to shut their plants.
• Mahindra Two Wheelers also managed a good recovery with a growth of +38.38% (YoY) in Domestic Sales - best of the year whileExports were in the negative at -32.74% (YoY) again the worst of the year.

Hero MotoCorp(Number of Vehicles)
CAPITALMIND • (C) ALL RIGHTS RESERVED • capitalmind.in Nov'15 The SparkPlug Report - [TWO WHEELERS] 11
5679
49
6024
83
5361
22
5541
10
5340
37 6209
84
5616
12
5544
36
5488
54
5780
94
5108
75
5028
47
4760
85 5849
44 6617
56
5063
61
Apr May Jun Jul Aug Sep Oct Nov0
200000
400000
600000
PRODUCTION-2014 -2015
5585
56
5893
60
5305
60
5166
61
5355
03
5808
82
5506
88
5210
01
5250
51
5602
22
5152
79
4651
01
4605
57
5896
44
6250
31
5381
80
Apr May Jun Jul Aug Sep Oct Nov0
200000
400000
600000
DOMESTIC SALES-2014 -2015
1249
8
1312
3
1103
4
1320
1
2310
6
2317
0
2436
8
2641
2
8240 99
78
2708
3
2247
9
1998
0
1710
0
1477
1
1255
1
Apr May Jun Jul Aug Sep Oct Nov0
5000
10000
15000
20000
25000
EXPORTS-2014 -2015
-10%
-5%
0%
5%
10%
15%
-3.36% -4.05% -4.71%
-9.25%-10.85%
-5.80%
17.83%
-8.67%
YoY GROWTH
Apr May Jun Jul Aug Sep Oct Nov
-10%
-5%
0%
5%
10%
-6.00%-4.94%
-2.88%
-9.98%
-14.00%
1.51%
13.50%
3.30%
YoY GROWTH
Apr May Jun Jul Aug Sep Oct Nov
-50%
0%
50%
100%
-34.07%-23.97%
145.45%
70.28%
-13.53%-26.20%
-39.38%-52.48%
YoY GROWTH
Apr May Jun Jul Aug Sep Oct Nov
38.27 %37.68 %
37.13 %35.13 %
34.65 %34.78 %34.92 %35.50 %
36.87 %37.05 %
34.37 %31.38 %
30.79 %33.79 %
36.16 %35.69 %
Apr'14May'14Jun'14Jul'14
Aug'14Sep'14Oct'14Nov'14Apr'15
May'15Jun'15Jul'15
Aug'15Sep'15Oct'15Nov'15
0 10 20 30
MARKET SHARE
43.33 %42.15 %42.01 %
39.78 %39.80 %
37.39 %37.67 %
40.03 %40.79 %40.57 %
39.40 %35.76 %35.28 %
38.36 %37.74 %
40.75 %
Apr'14May'14Jun'14Jul'14
Aug'14Sep'14Oct'14Nov'14Apr'15
May'15Jun'15Jul'15
Aug'15Sep'15Oct'15Nov'15
0 10 20 30 40
MARKET SHARE
6.41 %6.13 %6.05 %5.93 %
9.89 %10.11 %
11.34 %11.55 %
4.46 %4.71 %
11.72 %9.46 %
7.95 %7.33 %
7.79 %6.62 %
Apr'14May'14Jun'14Jul'14
Aug'14Sep'14Oct'14Nov'14Apr'15
May'15Jun'15Jul'15
Aug'15Sep'15Oct'15Nov'15
0 2 4 6 8 10
MARKET SHARE

Honda Motorcycle & Scooter India(Number of Vehicles)
CAPITALMIND • (C) ALL RIGHTS RESERVED • capitalmind.in Nov'15 The SparkPlug Report - [TWO WHEELERS] 12
3231
38
3508
09
3257
77 3957
12
3809
13
4261
51
3633
97
3700
74
3666
45
3532
77
3218
81
4130
67
3968
01
4208
28
4053
09
3191
79
Apr May Jun Jul Aug Sep Oct Nov0
100000
200000
300000
400000
PRODUCTION-2014 -2015
3019
78
3421
36
3093
87 3639
77
3708
71 4206
00
3616
70
3537
43
3289
94
3534
09
3318
59
3713
49
3731
69
4116
45
4318
87
3119
46
Apr May Jun Jul Aug Sep Oct Nov0
100000
200000
300000
400000
DOMESTIC SALES-2014 -2015
1192
8
1340
3
1376
5 1743
5
1715
2
1790
0
1535
9 1802
7
1169
9
1378
7 1701
5
1825
7 2206
0
1908
9
1697
5
1439
1
Apr May Jun Jul Aug Sep Oct Nov0
5000
10000
15000
20000
EXPORTS-2014 -2015
-10%
-5%
0%
5%
10%
13.46%
0.70%-1.20%
4.39% 4.17%
-1.25%
11.53%
-13.75%
YoY GROWTH
Apr May Jun Jul Aug Sep Oct Nov
-10%
0%
10%8.95%
3.29%
7.26%
2.03%0.62%
-2.13%
19.41%
-11.82%
YoY GROWTH
Apr May Jun Jul Aug Sep Oct Nov-20%
-10%
0%
10%
20%
-1.92%
2.87%
23.61%
4.71%
28.61%
6.64%10.52%
-20.17%
YoY GROWTH
Apr May Jun Jul Aug Sep Oct Nov
21.77 %21.94 %22.56 %
25.09 %24.71 %
23.87 %22.60 %
23.70 %24.63 %
22.64 %21.65 %
25.78 %25.66 %
24.31 %22.15 %22.50 %
Apr'14May'14Jun'14Jul'14
Aug'14Sep'14Oct'14Nov'14Apr'15
May'15Jun'15Jul'15
Aug'15Sep'15Oct'15Nov'15
0 5 10 15 20 25
MARKET SHARE
23.42 %24.47 %24.50 %
28.03 %27.56 %
27.07 %24.74 %
27.18 %25.56 %25.59 %25.38 %
28.56 %28.59 %
26.78 %26.08 %
23.62 %
Apr'14May'14Jun'14Jul'14
Aug'14Sep'14Oct'14Nov'14Apr'15
May'15Jun'15Jul'15
Aug'15Sep'15Oct'15Nov'15
0 5 10 15 20 25
MARKET SHARE
6.12 %6.26 %
7.55 %7.83 %
7.34 %7.81 %
7.15 %7.88 %
6.34 %6.51 %
7.37 %7.68 %
8.78 %8.18 %
8.95 %7.59 %
Apr'14May'14Jun'14Jul'14
Aug'14Sep'14Oct'14Nov'14Apr'15
May'15Jun'15Jul'15
Aug'15Sep'15Oct'15Nov'15
0 2 4 6 8
MARKET SHARE

THREE WHEELERS

THREE WHEELERS
CAPITALMIND • (C) ALL RIGHTS RESERVED • capitalmind.in Nov'15 The SparkPlug Report 14
6218
8
6892
3
7651
4 8779
8
8830
9
9500
1
8738
0
9122
0
7707
6
7404
6
7508
8
8462
0
8546
7 9637
7
9094
2
6958
3
Apr May Jun Jul Aug Sep Oct Nov0
20000
40000
60000
80000
PRODUCTION-2014 -2015
3344
6 4042
5 4738
3
5146
2
5255
0
5694
8
5230
7
4175
5
3266
6
3650
0 4387
5
4515
1
4612
4
4952
4
5236
1
4523
5
Apr May Jun Jul Aug Sep Oct Nov0
10000
20000
30000
40000
50000
DOMESTIC SALES-2014 -2015
2652
8
3028
5
3059
3 3719
8
3918
3
3637
0
3531
5 4233
7
4754
8
3874
3
3611
9
3828
3
4163
8
4473
0
3218
8
2763
1
Apr May Jun Jul Aug Sep Oct Nov0
10000
20000
30000
40000
EXPORTS-2014 -2015
-20%
-10%
0%
10%
20%
23.94%
7.43%
-1.86%-3.62% -3.22%
1.45%4.08%
-23.72%
YoY GROWTH
Apr May Jun Jul Aug Sep Oct Nov
-10%
-5%
0%
5%
-2.33%
-9.71%
-7.40%
-12.26%-12.23%-13.04%
0.10%
8.33%
YoY GROWTH
Apr May Jun Jul Aug Sep Oct Nov
-20%
0%
20%
40%
60%
79.24%
27.93%18.06%
2.92% 6.27%
22.99%
-8.85%
-34.74%
YoY GROWTH
Apr May Jun Jul Aug Sep Oct Nov

CAPITALMIND • (C) ALL RIGHTS RESERVED • capitalmind.in Nov'15 The SparkPlug Report 15
Capital Mind Premium: The Sparkplug ReportNovember 2015
Three Wheelers
How did this segment fare? Let's take a look at the segment analysis; the sub-segment and each of the constituents:
Segment Analysis:• Production fell from 91,220 units to 69,583 units resulting in a decline of -23.72% (YoY)
• Domestic Sales broke into the positive for the first time during the year from 41,755 units to 45,235 units resulting in a growth of just+8.33% (YoY)
• Exports declined from 42,337 units to 27,631 units resulting in a decline of -34.74% (YoY)
• All this translated into an overall sales decline of -13.35% (YoY)
• Special Note: October + November (Diwali Effect) =
• Production: -10.12% (YoY)
• Domestic Sales: +3.76% (YoY)
• Exports: -22.97% (YoY)

CAPITALMIND • (C) ALL RIGHTS RESERVED • capitalmind.in Nov'15 The SparkPlug Report 16
Capital Mind Premium: The Sparkplug ReportNovember 2015
Sub-Segment Analysis:Passenger Carrier (Models include: Ape, Alfa Champ and others)
• PC and GC both mirrored similar results in Overall Sales at -13.47% (YoY) and 12.36% (YoY).
• Domestic Sales broke into the positive for the first time during the year at +13.52% (YoY) in Domestic Sales clocking in 37,118 unitsfrom the previous year of 32,696 units.
• Production was in the negative at -24.17% (YoY).
• Exports were at the worst with 27,482 units compared to 41,964 units resulting in a decline of -34.51% (YoY). November has been theworst for Exports while Domestic Sales has been the best of the year.
• Special Note: October + November (Diwali Effect) =
• Production: -10.12% (YoY)
• Domestic Sales: +5.28% (YoY)
• Exports: -22.83% (YoY)
Goods Carrier (Models include: Atul Smart and others):
• After having the only positive month for the year in October, Domestic Sales went back to negative at -10.40% (YoY). 8,117 units weresold compared to 9,059 units during the same month of the previous year.
• For Exports, it had the worst month of the year at -60.05% (YoY) at 149 units compared to 373 units.
• Special Note: October + November (Diwali Effect) =
• Production: -9.37% (YoY)
• Domestic Sales: +2.76% (YoY)
• Exports: -41.86% (YoY)

CAPITALMIND • (C) ALL RIGHTS RESERVED • capitalmind.in Nov'15 The SparkPlug Report 17
Capital Mind Premium: The Sparkplug ReportNovember 2015
Constituent Analysis:• Outliers (manufacturer with the highest growth):
• Production: +18.84% (YoY) - Force Motors
• Domestic Sales: +24.05% (YoY) - Bajaj Auto
• Exports: +200% (YoY) - Force Motors
• Total Overall Sales: +200% (YoY) - Force Motors
• Bajaj Auto led the field with the second positive month of the year. Domestic Sales witnessed a growth of +24.05% (YoY) - best of theyear.However, Exports did not fare well with -39.47% (YoY) - the worst of the year. Domestic Sales helped the company increase itsmarket share from 52.10% to 53.14% (mostly eating into the market share of TVS Motors).
• Force Motors continued to maintain its focus on the International Markets such as Middle East, Asia, Latin America and Africa. Thecompany Exported 168 units compared to just 56 units for the same month of the previous year.
• Piaggio Vehicles continues is slow and steady pace of eating its rival's market share. The company has increased its market share from16.68% in April to 22.77% for the month of November. Both Domestic Sales and Exports were in the red at 1.38% (YoY) and -28.22%(YoY).
• TVS Motors losing 1.87% of its market share to its rivals managed to cut its losses with a better November. Domestic Sales stood at-6.93% (YoY) better than the double digit decline during the previous 3 months. Also for the first time in the year, its Exports were in thered at -16.70% (YoY) - in absolute terms it is a fall of over 40% in Exports.

Bajaj Auto(Number of Vehicles)
CAPITALMIND • (C) ALL RIGHTS RESERVED • capitalmind.in Nov'15 The SparkPlug Report - [THREE WHEELERS] 18
3224
0
3760
4
4336
4 5013
4
5085
1
5370
8
4770
5
5114
3
4685
0
4315
6
4142
6 4817
8
4903
3 5676
1
4912
9
3671
8
Apr May Jun Jul Aug Sep Oct Nov0
10000
20000
30000
40000
50000
PRODUCTION-2014 -2015
1394
1
1898
0 2270
1
2448
4
2436
6
2598
8
2318
9
1587
7
1412
2
1594
6 2064
7
2187
0
2235
9
2288
8
2313
5
1969
5
Apr May Jun Jul Aug Sep Oct Nov0
5000
10000
15000
20000
25000
DOMESTIC SALES-2014 -2015
1795
2
1943
6
2056
2 2696
7
2817
2
2645
2
2590
5 3143
43636
1
2763
0
2308
8
2592
8
2917
0
3128
4
2091
8
1902
6
Apr May Jun Jul Aug Sep Oct Nov0
10000
20000
30000
EXPORTS-2014 -2015
-20%
0%
20%
40%
45.32%
14.76%
-4.47% -3.90% -3.58%
5.68%2.99%
-28.21%
YoY GROWTH
Apr May Jun Jul Aug Sep Oct Nov
-10%
0%
10%
20%
1.30%
-15.99%
-9.05%-10.68%
-8.24%
-11.93%
-0.23%
24.05%
YoY GROWTH
Apr May Jun Jul Aug Sep Oct Nov
0%
50%
100%102.55%
42.16%
12.28%
-3.85%3.54%
18.27%
-19.25%
-39.47%
YoY GROWTH
Apr May Jun Jul Aug Sep Oct Nov
51.84 %54.56 %
56.67 %57.10 %57.58 %
56.53 %54.59 %56.07 %
60.78 %58.28 %
55.17 %56.93 %57.37 %
58.89 %54.02 %
52.77 %
Apr'14May'14Jun'14Jul'14
Aug'14Sep'14Oct'14Nov'14Apr'15
May'15Jun'15Jul'15
Aug'15Sep'15Oct'15Nov'15
0 20 40 60
MARKET SHARE
41.68 %46.95 %47.91 %47.58 %
46.37 %45.63 %
44.33 %38.02 %
43.23 %43.69 %
47.06 %48.44 %48.48 %
46.22 %44.18 %
43.54 %
Apr'14May'14Jun'14Jul'14
Aug'14Sep'14Oct'14Nov'14Apr'15
May'15Jun'15Jul'15
Aug'15Sep'15Oct'15Nov'15
0 10 20 30 40
MARKET SHARE
67.67 %64.18 %
67.21 %72.50 %71.90 %72.73 %73.35 %74.25 %
76.47 %71.32 %
63.92 %67.73 %
70.06 %69.94 %
64.99 %68.86 %
Apr'14May'14Jun'14Jul'14
Aug'14Sep'14Oct'14Nov'14Apr'15
May'15Jun'15Jul'15
Aug'15Sep'15Oct'15Nov'15
0 20 40 60
MARKET SHARE

Piaggio Vehicles(Number of Vehicles)
CAPITALMIND • (C) ALL RIGHTS RESERVED • capitalmind.in Nov'15 The SparkPlug Report - [THREE WHEELERS] 19
1485
1
1476
4 1693
3
1846
8
1888
0
1972
3
1865
2
1870
0
1373
1
1407
9
1523
6
1616
8
1568
0
1660
4
1828
0
1622
3
Apr May Jun Jul Aug Sep Oct Nov0
5000
10000
15000
PRODUCTION-2014 -2015
1229
7
1258
4
1437
2
1584
6
1656
5
1775
6
1672
3
1477
1
1124
2
1240
3
1321
6
1289
5
1289
6
1466
3
1630
6
1456
7
Apr May Jun Jul Aug Sep Oct Nov0
5000
10000
15000
DOMESTIC SALES-2014 -2015
2503
2536
2353
2439 25
97
2135
1738
2817
2134 22
59
2827 30
30
2512
2479
1817 20
22
Apr May Jun Jul Aug Sep Oct Nov0
1000
2000
3000
EXPORTS-2014 -2015
-15%
-10%
-5%-7.54%
-4.64%
-10.02%
-12.45%
-16.95%-15.81%
-1.99%
-13.25%
YoY GROWTH
Apr May Jun Jul Aug Sep Oct Nov
-20%
-15%
-10%
-5%-8.58%
-1.44%
-8.04%
-18.62%
-22.15%
-17.42%
-2.49%-1.38%
YoY GROWTH
Apr May Jun Jul Aug Sep Oct Nov
-20%
-10%
0%
10%
20%
-14.74%-10.92%
20.14%24.23%
-3.27%
16.11%
4.55%
-28.22%
YoY GROWTH
Apr May Jun Jul Aug Sep Oct Nov
23.88 %21.42 %
22.13 %21.03 %21.38 %
20.76 %21.35 %
20.50 %17.81 %
19.01 %20.29 %
19.11 %18.35 %
17.23 %20.10 %
23.31 %
Apr'14May'14Jun'14Jul'14
Aug'14Sep'14Oct'14Nov'14Apr'15
May'15Jun'15Jul'15
Aug'15Sep'15Oct'15Nov'15
0 5 10 15 20
MARKET SHARE
36.77 %31.13 %
30.33 %30.79 %31.52 %31.18 %31.97 %
35.38 %34.41 %33.98 %
30.12 %28.56 %
27.96 %29.61 %
31.14 %32.20 %
Apr'14May'14Jun'14Jul'14
Aug'14Sep'14Oct'14Nov'14Apr'15
May'15Jun'15Jul'15
Aug'15Sep'15Oct'15Nov'15
0 10 20 30
MARKET SHARE
9.44 %8.37 %
7.69 %6.56 %6.63 %
5.87 %4.92 %
6.65 %4.49 %
5.83 %7.83 %7.91 %
6.03 %5.54 %5.64 %
7.32 %
Apr'14May'14Jun'14Jul'14
Aug'14Sep'14Oct'14Nov'14Apr'15
May'15Jun'15Jul'15
Aug'15Sep'15Oct'15Nov'15
0 2 4 6 8
MARKET SHARE

PASSENGER VEHICLES

PASSENGER VEHICLES
CAPITALMIND • (C) ALL RIGHTS RESERVED • capitalmind.in Nov'15 The SparkPlug Report 21
2583
60
2688
66
2349
46 2773
09
2608
82
2860
56
2421
41 2812
34
2864
53
2700
86
2586
30 3029
58
2897
44
2891
63
2963
59
2522
03
Apr May Jun Jul Aug Sep Oct Nov0
100000
200000
300000
PRODUCTION-2014 -2015
1881
62
2079
53
2188
28
1995
62
2139
38
2235
84
2211
63
2124
37
2179
49
2176
71
2176
42
2223
68
2224
76
2321
67 2686
29
2366
64
Apr May Jun Jul Aug Sep Oct Nov0
50000
100000
150000
200000
250000
DOMESTIC SALES-2014 -2015
4176
4
4801
7
5153
3
5549
2
5305
2
5775
2
4863
7 5621
4
5047
9
5155
2
4034
3
6021
6
5956
8
5742
1
5925
5
5138
1
Apr May Jun Jul Aug Sep Oct Nov0
20000
40000
60000
EXPORTS-2014 -2015
-10%
0%
10%
20%
10.87%
0.45%
10.08% 9.25%11.06%
1.09%
22.39%
-10.32%
YoY GROWTH
Apr May Jun Jul Aug Sep Oct Nov
0%
5%
10%
15%
20%15.83%
4.67%
-0.54%
11.43%
3.99% 3.84%
21.46%
11.40%
YoY GROWTH
Apr May Jun Jul Aug Sep Oct Nov
-20%
-10%
0%
10%
20%20.87%
7.36%
-21.71%
8.51%12.28%
-0.57%
21.83%
-8.60%
YoY GROWTH
Apr May Jun Jul Aug Sep Oct Nov

CAPITALMIND • (C) ALL RIGHTS RESERVED • capitalmind.in Nov'15 The SparkPlug Report 22
Capital Mind Premium: The Sparkplug ReportNovember 2015
Passenger Vehicles (Passenger Cars + Utility Vehicles + Vans)
How did this segment fare? Let's take a look at the segment analysis; the sub-segment and each of the constituents:
Segment Analysis:• Production declined for the first time during the year from 281,234 units to 252,203 units resulting in a decline of -10.32% (YoY)
• Domestic Sales grew from 212,437 units to 236,664 units resulting in a growth of +11.40% (YoY)
• Exports also went into the red from 56,214 units to 51,381 units resulting in a decline of -8.60% (YoY). All this translated into an overallsales growth of +7.22% (YoY)
• Special Note: October + November (Diwali Effect) =
• Production: +4.81% (YoY)
• Domestic Sales: +16.53% (YoY)
• Exports: +5.52% (YoY)
Sub-Segment Analysis:Passenger Cars (Models include: KWID, M800, Micra, Nano, Polo, Santro, Spark, and others):
• PC brought in a growth of +10.39% (YoY) in Domestic Sales churning in 173,111 units from the previous year of 156,811 units
• UVs beat PCs in Exports with the latter falling into the negative at -17.35% (YoY) from 48,871 units to 40,390 units
• Special Note: October + November (Diwali Effect) =
• Production: +3.43% (YoY)
• Domestic Sales: +16.14% (YoY)
• Exports: -4.92% (YoY)

CAPITALMIND • (C) ALL RIGHTS RESERVED • capitalmind.in Nov'15 The SparkPlug Report 23
Capital Mind Premium: The Sparkplug ReportNovember 2015
Utility Vehicles (Models include: Bolero, Creta, Eco sport, Force One, Terrano, Thar and others):
• UVs outperformed PCs in Domestic Sales with a growth of +19.65% (YoY) - 48,880 units were sold compared to 40,815 units; an additionof 8,029 units propelling November into the second best month after October so far.
• Domestic Sales effect also rubbed to Exports. Exports touched +51.99% (YoY) - mainly contributed by Ford and Toyota Motors. Exportsstood at 10,898 units compared to 7,170 units - an overall increase of 3,728 units.
• Special Note: October + November (Diwali Effect) =
• Production: +8.99% (YoY)
• Domestic Sales: +20.28% (YoY)
• Exports: +84.91% (YoY)
Vans (Models include: Ace Magic, Gio, Omni, Trip, Venture and others):
• Both PCs and UVs outperformed Vans in both Domestic Sales and Exports. 14,673 units were sold against 14,775 units a year ago in theDomestic Market resulting in a decline of -0.69% (YoY).
• Exports fell to the worst of the year at -46.24% (YoY) with 93 units being exported compared to 173 units during the same month of theprevious year.
• Special Note: October + November (Diwali Effect) =
• Production: +7.78% (YoY)
• Domestic Sales: +9.14% (YoY)
• Exports: -27.17% (YoY)

CAPITALMIND • (C) ALL RIGHTS RESERVED • capitalmind.in Nov'15 The SparkPlug Report 24
Capital Mind Premium: The Sparkplug ReportNovember 2015
Constituent Analysis:• Outliers (manufacturer with the highest growth):
• Production: +75.68% (YoY) - Renault India
• Domestic Sales: +144.27% (YoY) - Renault India
• Exports: +2526.67% (YoY) - General Motors
• Total Overall Sales: +128.99% (YoY) - Renault India
• Volkswagen India leads the losers with Domestic Sales declining at -49.51% (YoY) - its worst growth yet. Force Motors leads the loserswith Exports declining at -100% (YoY); while Renault India concentrating on the Domestic Market with its iconic Duster and KWIDdecided to export just 8 units of Duster leading to a decline of -96.31% (YoY) - the average for the year including November has been-98.18%.
• Market leader Maruti Suzuki continues to disrupt the Domestic Market clocking in a growth of +10.57% (YoY) 110,599 units compared to100,024 units a year ago. Exports were at its second worst of the year at +1.02% (YoY) from 10,122 units to 10,225 units. It alsomanaged to add +1.01% to its market share.
• Renault India, Force Motors, General Motors India, and Ford India were the top performers with an exceptional growth in Overall Sales by+128.99% (YoY), +77.20% (YoY), +54.32% (YoY), and +34.69% (YoY).
• Hyundai Motor's market share rose by +1.20% to +20.02% though the company had its second worst month of Exports at -25.41% i.e. itexported 4,771 units lesser than the previous year during the same time. Its Domestic Sales stood at +22.92% (YoY) - third best month ofthe year.
• Mahindra & Mahindra lost steam of its SUVs sales. The company lost 0.57% of its market share. Bulk of its Domestic Sales & Exportscomes from the contributions of Scorpio, Xylo, HT, Bolero Plus, XUV500 followed by Bolero, ST, Quanto, Thar, and TUV300. DomesticSales growth of +35.86% (YoY) was the best for the current year which meant that the company for the second time in the current yearhad a positive overall growth at +33.45% (YoY) while Exports went into the red at -53.23% (YoY) - the second worst during the currentyear.

PASSENGER CARS

PASSENGER CARS
CAPITALMIND • (C) ALL RIGHTS RESERVED • capitalmind.in Nov'15 The SparkPlug Report 26
1902
52
2028
42
1769
24 2042
24
1978
24
2092
84
1770
64 2102
13
2137
32
2028
93
1965
83 2271
97
2153
72
2112
08
2129
54
1876
11
Apr May Jun Jul Aug Sep Oct Nov0
50000
100000
150000
200000
PRODUCTION-2014 -2015
1350
54
1485
77
1602
32
1379
22
1537
81
1548
98
1594
08
1568
11
1595
48
1600
67
1626
77
1620
22
1630
93
1695
90 1941
58
1731
11
Apr May Jun Jul Aug Sep Oct Nov0
50000
100000
150000
DOMESTIC SALES-2014 -2015
3515
4 4159
2
4603
6
4849
1
4658
7
5100
3
4346
3
4887
1
4281
5
4501
5
3595
7
5171
9
4657
9
4495
8
4739
8
4039
0
Apr May Jun Jul Aug Sep Oct Nov0
10000
20000
30000
40000
50000
EXPORTS-2014 -2015
-10%
0%
10%
20%
12.34%
0.03%
11.11% 11.25%8.87%
0.92%
20.27%
-10.75%
YoY GROWTH
Apr May Jun Jul Aug Sep Oct Nov
5%
10%
15%
20% 18.14%
7.73%
1.53%
17.47%
6.06%
9.48%
21.80%
10.39%
YoY GROWTH
Apr May Jun Jul Aug Sep Oct Nov
-20%
-10%
0%
10%
20%
21.79%
8.23%
-21.89%
6.66%
-0.02%
-11.85%
9.05%
-17.35%
YoY GROWTH
Apr May Jun Jul Aug Sep Oct Nov

Hyundai Motor India(Number of Vehicles)
CAPITALMIND • (C) ALL RIGHTS RESERVED • capitalmind.in Nov'15 The SparkPlug Report - [PASSENGER CARS] 27
4886
5
4636
1 5281
0
5375
0
5133
5
5355
3
4556
5 5270
4
5339
2
4436
2
5549
8
4950
4
4830
0
4962
0
4887
8
4164
7
Apr May Jun Jul Aug Sep Oct Nov0
10000
20000
30000
40000
50000
PRODUCTION-2014 -2015
3511
0
3595
5
3325
8
2906
7 3359
3
3490
6
3789
4
3544
8
3847
4
3732
8
3454
2
2959
9
3298
5
3519
3 3970
9
3777
1
Apr May Jun Jul Aug Sep Oct Nov0
10000
20000
30000
DOMESTIC SALES-2014 -2015
1497
4
1551
3
1700
4
1873
9
1436
1 1643
0
1800
9
1877
9
1290
4 1506
4
1576
4
1390
2
1355
7
1233
1
1307
4
1189
1
Apr May Jun Jul Aug Sep Oct Nov0
5000
10000
15000
EXPORTS-2014 -2015
-20%
-10%
0%
9.26%
-4.31%
5.09%
-7.90%-5.91%
-7.34%
7.27%
-20.98%
YoY GROWTH
Apr May Jun Jul Aug Sep Oct Nov
0%
2%
4%
6%
8%
9.58%
3.82% 3.86%
1.83%
-1.81%
0.82%
4.79%
6.55%
YoY GROWTH
Apr May Jun Jul Aug Sep Oct Nov
-30%
-20%
-10% -13.82%
-2.89%
-7.29%
-25.81%
-5.60%
-24.95%-27.40%
-36.68%
YoY GROWTH
Apr May Jun Jul Aug Sep Oct Nov
25.68 %22.86 %
29.85 %26.32 %
25.95 %25.59 %25.73 %
25.07 %24.98 %
21.86 %28.23 %
21.79 %22.43 %
23.49 %22.95 %
22.20 %
Apr'14May'14Jun'14Jul'14
Aug'14Sep'14Oct'14Nov'14Apr'15
May'15Jun'15Jul'15
Aug'15Sep'15Oct'15Nov'15
0 5 10 15 20 25
MARKET SHARE
26.00 %24.20 %
20.76 %21.07 %
21.84 %22.53 %
23.77 %22.61 %
24.11 %23.32 %
21.23 %18.27 %
20.22 %20.75 %20.45 %
21.82 %
Apr'14May'14Jun'14Jul'14
Aug'14Sep'14Oct'14Nov'14Apr'15
May'15Jun'15Jul'15
Aug'15Sep'15Oct'15Nov'15
0 5 10 15 20 25
MARKET SHARE
42.60 %37.30 %36.94 %
38.64 %30.83 %
32.21 %41.44 %
38.43 %30.14 %
33.46 %43.84 %
26.88 %29.11 %
27.43 %27.58 %
29.44 %
Apr'14May'14Jun'14Jul'14
Aug'14Sep'14Oct'14Nov'14Apr'15
May'15Jun'15Jul'15
Aug'15Sep'15Oct'15Nov'15
0 10 20 30 40
MARKET SHARE

Maruti Suzuki India(Number of Vehicles)
CAPITALMIND • (C) ALL RIGHTS RESERVED • capitalmind.in Nov'15 The SparkPlug Report - [PASSENGER CARS] 28
8896
3 1039
25
6650
7
9254
4
9274
1
9566
7
7261
5
9686
4
9788
4
1063
19
7968
4
1113
32
1021
00
9710
2
1021
47
8499
4
Apr May Jun Jul Aug Sep Oct Nov0
20000
40000
60000
80000
100000
PRODUCTION-2014 -2015
6578
6
7453
6 8622
3
7278
2
8282
3
8144
7
8058
9
8230
6
8418
8
8519
0
8663
0
9160
2
8645
4
8791
6
9795
1
8947
9
Apr May Jun Jul Aug Sep Oct Nov0
20000
40000
60000
80000
DOMESTIC SALES-2014 -2015
6867
9581 10
532
1041
0
1095
5
9207
6073
882299
31
1155
4
1146
5
1064
7
1035
8
7247
1221
3
8965
Apr May Jun Jul Aug Sep Oct Nov0
5000
10000
EXPORTS-2014 -2015
-10%
0%
10%
20%
30%
40%
10.03%
2.30%
19.81% 20.30%
10.09%
1.50%
40.67%
-12.25%
YoY GROWTH
Apr May Jun Jul Aug Sep Oct Nov
5%
10%
15%
20%
25%
27.97%
14.29%
0.47%
25.86%
4.38%
7.94%
21.54%
8.72%
YoY GROWTH
Apr May Jun Jul Aug Sep Oct Nov
0%
50%
100%
44.62%
20.59%
8.86%2.28%
-5.45%
-21.29%
101.10%
1.62%
YoY GROWTH
Apr May Jun Jul Aug Sep Oct Nov
46.76 %51.23 %
37.59 %45.31 %
46.88 %45.71 %
41.01 %46.08 %45.80 %
52.40 %40.53 %
49.00 %47.41 %
45.97 %47.97 %
45.30 %
Apr'14May'14Jun'14Jul'14
Aug'14Sep'14Oct'14Nov'14Apr'15
May'15Jun'15Jul'15
Aug'15Sep'15Oct'15Nov'15
0 10 20 30 40 50
MARKET SHARE
48.71 %50.17 %
53.81 %52.77 %53.86 %
52.58 %50.56 %
52.49 %52.77 %53.22 %53.25 %
56.54 %53.01 %
51.84 %50.45 %51.69 %
Apr'14May'14Jun'14Jul'14
Aug'14Sep'14Oct'14Nov'14Apr'15
May'15Jun'15Jul'15
Aug'15Sep'15Oct'15Nov'15
0 10 20 30 40 50
MARKET SHARE
19.53 %23.04 %22.88 %
21.47 %23.52 %
18.05 %13.97 %
18.05 %23.20 %
25.67 %31.89 %
20.59 %22.24 %
16.12 %25.77 %
22.20 %
Apr'14May'14Jun'14Jul'14
Aug'14Sep'14Oct'14Nov'14Apr'15
May'15Jun'15Jul'15
Aug'15Sep'15Oct'15Nov'15
0 10 20 30
MARKET SHARE

UTILITY VEHICLES

UTILITY VEHICLES
CAPITALMIND • (C) ALL RIGHTS RESERVED • capitalmind.in Nov'15 The SparkPlug Report 30
5421
9
4993
5
4545
9 5582
0
4879
0 6037
1
5223
2
5599
3
5694
1
5090
9
5016
4 5908
7
5925
6
6277
2
6673
2
5122
3
Apr May Jun Jul Aug Sep Oct Nov0
20000
40000
60000
PRODUCTION-2014 -2015
4068
0
4426
7
4384
9
4502
3
4650
1 5300
3
4810
5
4085
1
4352
6
4326
0
4127
8
4519
1
4460
8
4846
4 5812
0
4888
0
Apr May Jun Jul Aug Sep Oct Nov0
10000
20000
30000
40000
50000
DOMESTIC SALES-2014 -2015
6535
6366
5314 67
17
6132
6313
5082
7170
7465
6165
3860
7979
1273
6
1212
7
1175
7
1089
8
Apr May Jun Jul Aug Sep Oct Nov0
5000
10000
EXPORTS-2014 -2015
0%
10%
20%
5.02%1.95%
10.35%
5.85%
21.45%
3.98%
27.76%
-8.52%
YoY GROWTH
Apr May Jun Jul Aug Sep Oct Nov
-5%
0%
5%
10%
15%
20%
7.00%
-2.27%
-5.86%
0.37%
-4.07%
-8.56%
20.82%19.65%
YoY GROWTH
Apr May Jun Jul Aug Sep Oct Nov
0%
50%
100%
14.23%
-3.16%
-27.36%
18.79%
107.70%
92.10%
131.35%
51.99%
YoY GROWTH
Apr May Jun Jul Aug Sep Oct Nov

Mahindra & Mahindra(Number of Vehicles)
CAPITALMIND • (C) ALL RIGHTS RESERVED • capitalmind.in Nov'15 The SparkPlug Report - [UTILITY VEHICLES] 31
2137
9
1854
9
1535
8
1592
7
1431
0 1822
2
1747
5
1678
3
1809
7
1919
7
1638
7
1264
9
1248
1
1788
8
2326
6
1958
6
Apr May Jun Jul Aug Sep Oct Nov0
5000
10000
15000
20000
PRODUCTION-2014 -2015
1785
7
1783
1
1649
2
1434
8
1391
1
1964
7
1902
9
1361
2
1794
1
1698
0
1443
3
1320
4
1330
7
1871
7 2266
4
1868
6
Apr May Jun Jul Aug Sep Oct Nov0
5000
10000
15000
20000
DOMESTIC SALES-2014 -2015
491
431
271
379
216
339
328
402
251
343
439
496
474
480
401
188
Apr May Jun Jul Aug Sep Oct Nov0
100
200
300
400
EXPORTS-2014 -2015
-20%
-10%
0%
10%
20%
30%
-15.35%
3.49%6.70%
-20.58%
-12.78%
-1.83%
33.14%
16.70%
YoY GROWTH
Apr May Jun Jul Aug Sep Oct Nov
-10%
0%
10%
20%
30%
0.47%
-4.77%
-12.48%
-7.97%-4.34% -4.73%
19.10%
37.28%
YoY GROWTH
Apr May Jun Jul Aug Sep Oct Nov
-50%
0%
50%
100%
-48.88%
-20.42%
61.99%
30.87%
119.44%
41.59%
22.26%
-53.23%
YoY GROWTH
Apr May Jun Jul Aug Sep Oct Nov
39.43 %37.15 %
33.78 %28.53 %29.33 %30.18 %
33.46 %29.97 %
31.78 %37.71 %
32.67 %21.41 %21.06 %
28.50 %34.86 %
38.24 %
Apr'14May'14Jun'14Jul'14
Aug'14Sep'14Oct'14Nov'14Apr'15
May'15Jun'15Jul'15
Aug'15Sep'15Oct'15Nov'15
0 10 20 30
MARKET SHARE
43.90 %40.28 %
37.61 %31.87 %
29.92 %37.07 %
39.56 %33.32 %
41.22 %39.25 %
34.97 %29.22 %29.83 %
38.62 %39.00 %
38.23 %
Apr'14May'14Jun'14Jul'14
Aug'14Sep'14Oct'14Nov'14Apr'15
May'15Jun'15Jul'15
Aug'15Sep'15Oct'15Nov'15
0 10 20 30 40
MARKET SHARE
7.51 %6.77 %
5.10 %5.64 %
3.52 %5.37 %
6.45 %5.61 %
3.36 %5.56 %
11.37 %6.22 %
3.72 %3.96 %
3.41 %1.73 %
Apr'14May'14Jun'14Jul'14
Aug'14Sep'14Oct'14Nov'14Apr'15
May'15Jun'15Jul'15
Aug'15Sep'15Oct'15Nov'15
0 2 4 6 8 10
MARKET SHARE

Renault India(Number of Vehicles)
CAPITALMIND • (C) ALL RIGHTS RESERVED • capitalmind.in Nov'15 The SparkPlug Report - [UTILITY VEHICLES] 32
7183
4126
2130
3876
2345
3975
3207
3277
5156
4428
5464
4227
2311
1866
405
204
Apr May Jun Jul Aug Sep Oct Nov0
2000
4000
6000
PRODUCTION-2014 -2015
3175 33
50
3822
2823 31
06 3418
3419
2676
3742
3377
4018
1528
1381
1276
2033
2124
Apr May Jun Jul Aug Sep Oct Nov0
1000
2000
3000
4000
DOMESTIC SALES-2014 -2015
1647
554
430
389
333
59 38
217
22 4 30 0 6 0 0 8
Apr May Jun Jul Aug Sep Oct Nov0
500
1000
1500
EXPORTS-2014 -2015
-50%
0%
50%
100%
150%
-28.22%
7.32%
156.53%
9.06%-1.45%
-53.06%
-87.37%-93.77%
YoY GROWTH
Apr May Jun Jul Aug Sep Oct Nov
-60%
-40%
-20%
0%
17.86%
0.81%5.13%
-45.87%
-55.54%
-62.67%
-40.54%
-20.63%
YoY GROWTH
Apr May Jun Jul Aug Sep Oct Nov-100%
-98%
-96%
-94%
-98.66%
-99.28%
-93.02%
-100.00%
-98.20%
-100.00%-100.00%
-96.31%
YoY GROWTH
Apr May Jun Jul Aug Sep Oct Nov
13.25 %8.26 %
4.69 %6.94 %
4.81 %6.58 %
6.14 %5.85 %
9.05 %8.70 %
10.89 %7.15 %
3.90 %2.97 %
0.61 %0.40 %
Apr'14May'14Jun'14Jul'14
Aug'14Sep'14Oct'14Nov'14Apr'15
May'15Jun'15Jul'15
Aug'15Sep'15Oct'15Nov'15
0 5 10
MARKET SHARE
7.80 %7.57 %
8.72 %6.27 %
6.68 %6.45 %
7.11 %6.55 %
8.60 %7.81 %
9.73 %3.38 %
3.10 %2.63 %
3.50 %4.35 %
Apr'14May'14Jun'14Jul'14
Aug'14Sep'14Oct'14Nov'14Apr'15
May'15Jun'15Jul'15
Aug'15Sep'15Oct'15Nov'15
0 2 4 6 8
MARKET SHARE
25.20 %8.70 %
8.09 %5.79 %
5.43 %0.93 %0.75 %
3.03 %0.29 %0.06 %
0.78 %0.00 %0.05 %0.00 %0.00 %0.07 %
Apr'14May'14Jun'14Jul'14
Aug'14Sep'14Oct'14Nov'14Apr'15
May'15Jun'15Jul'15
Aug'15Sep'15Oct'15Nov'15
0 5 10 15 20 25
MARKET SHARE

COMMERCIAL VEHICLES

COMMERCIAL VEHICLES
CAPITALMIND • (C) ALL RIGHTS RESERVED • capitalmind.in Nov'15 The SparkPlug Report 34
5713
9
5398
4
5404
5
5701
7
5621
4
6054
7
5398
1
5997
6
5728
9
5943
3
5716
4
5910
2
6353
5 7189
1
6095
5
5910
0
Apr May Jun Jul Aug Sep Oct Nov0
20000
40000
60000
PRODUCTION-2014 -2015
4308
0
4698
6
5107
9
4777
5
4851
8 5607
8
5197
8
4768
6
4587
2
4884
1
5144
6
5179
5
5219
8 6284
5
5859
6
5176
6
Apr May Jun Jul Aug Sep Oct Nov0
20000
40000
60000
DOMESTIC SALES-2014 -2015
5747 63
43
6656 72
41
7098
8157
7494
7349
6889
8403
8330 86
99 9321
7672 81
68
7137
Apr May Jun Jul Aug Sep Oct Nov0
2000
4000
6000
8000
EXPORTS-2014 -2015
0%
5%
10%
15%
0.26%
10.09%
5.77%
3.66%
13.02%
18.74%
12.92%
-1.46%
YoY GROWTH
Apr May Jun Jul Aug Sep Oct Nov
5%
10%
6.48%
3.95%
0.72%
8.41%7.58%
12.07%12.73%
8.56%
YoY GROWTH
Apr May Jun Jul Aug Sep Oct Nov
0%
10%
20%
30%
19.87%
32.48%
25.15%
20.14%
31.32%
-5.95%
8.99%
-2.88%
YoY GROWTH
Apr May Jun Jul Aug Sep Oct Nov

CAPITALMIND • (C) ALL RIGHTS RESERVED • capitalmind.in Nov'15 The SparkPlug Report 35
Capital Mind Premium: The Sparkplug ReportNovember 2015
Commercial Vehicles (Passenger Carriers + Goods Carriers)
How did this segment fare? Let's take a look at the segment analysis; the sub-segment and each of the constituents:
Segment Analysis:• Production fell from 59,976 units to 59,100 units resulting in a decline of -1.46% (YoY)
• Domestic Sales grew from 47,686 units to 51,766 units resulting in a growth of +8.56% (YoY)
• Exports fell from 7,349 units to 7,137 units resulting in a decline of -2.88% (YoY)
• All this translated into an overall sales growth of +7.03% (YoY)
• Special Note: October + November (Diwali Effect) =
• Production: +5.35% (YoY)
• Domestic Sales: +10.73% (YoY)
• Exports: +3.11% (YoY)

CAPITALMIND • (C) ALL RIGHTS RESERVED • capitalmind.in Nov'15 The SparkPlug Report 36
Capital Mind Premium: The Sparkplug ReportNovember 2015
Sub-Segment Analysis:Passenger Carriers (Models include: Citiline, CityRide, Starbus, Tourister, Viking and others):
• PC brought in a growth of +14.25% (YoY) in Domestic Sales clocking in 4,570 units from the previous year of 4,000 units - this alsohappens to be the lowest Domestic Sales for the current year.
• Exports were in the red at -26.92% (YoY) as the total units exported fell by 476 units from 1,768 units to 1,292 units.
• Overall sales growth was at +1.63% (YoY) - lowest of the year.
• Special Note: October + November (Diwali Effect) =
• Production: +8.56% (YoY)
• Domestic Sales: +20.89% (YoY)
• Exports: -15.31% (YoY)
Goods Carriers (Models include: Ape Truck, Bolero Maxi Truck, Maxximo, Super Supreme, Winger and others):
• GC fared a lower growth of +8.03% (YoY) in Domestic Sales - 47,196 units were sold compared to 43,686 units; an addition of 3,510units.
• Exports fared positive with a growth of +4.73% (YoY).
• Special Note: October + November (Diwali Effect) =
• Production: +5.02% (YoY)
• Domestic Sales: +9.80% (YoY)
• Exports: +8.12% (YoY)

CAPITALMIND • (C) ALL RIGHTS RESERVED • capitalmind.in Nov'15 The SparkPlug Report 37
Capital Mind Premium: The Sparkplug ReportNovember 2015
Constituent Analysis:• Outliers (manufacturer with the highest growth):
• Production: +124.37% (YoY) - SML Isuzu
• Domestic Sales: +35% (YoY) - Isuzu Motors
• Exports: +35.29% (YoY) - SML Isuzu
• Total Overall Sales: +35% (YoY) - Isuzu Motors
• Mahindra & Mahindra which increased its market share by a whopping 7.5% in October, lost almost 3% of its market share to rival TataMotors which increased its market share from 43.10% to 45.59%.
• Tata Motors hit the red in Domestic Sales with a decline of -0.87% (YoY). The company managed to sell 23,389 units compared to23,594 units a year ago. Additionally, Exports which fared at +11.15% (YoY) during the month of October, reversed its trajectory to clockin a decline of -11.66% (YoY) with 3,463 units being exported compared to 3,920 units from a year ago.
• Ashok Leyland managed a decent growth in Domestic Sales at +24.05% (YoY) by selling 7,979 units compared to 6,432 units a year ago -fall of over a 1,000 units. Exports stood at 992 units compared to 1,274 units brining in a decline of -22.14% (YoY).

BUSES - PASSENGER CARRIERS

BUSES - PASSENGER CARRIERS
CAPITALMIND • (C) ALL RIGHTS RESERVED • capitalmind.in Nov'15 The SparkPlug Report 39
3936 42
71
4013 44
29
3882
3469
2513
324235
66
4466
5194
5083
4375 47
73
2445
3271
Apr May Jun Jul Aug Sep Oct Nov0
1000
2000
3000
4000
5000
PRODUCTION-2014 -2015
2877 32
84 3725
2950
2681
2523
2039
1665
3291
4259
4194 44
40
3041
3682
2398
2044
Apr May Jun Jul Aug Sep Oct Nov0
1000
2000
3000
4000
DOMESTIC SALES-2014 -2015
475
659 78
5
778
942
1296
1106
1325
518
815
1016
820
1140
767
1184
1033
Apr May Jun Jul Aug Sep Oct Nov0
500
1000
EXPORTS-2014 -2015
0%
10%
20%
30%
-9.40%
4.57%
29.43%
14.77%12.70%
37.59%
-2.71%0.89%
YoY GROWTH
Apr May Jun Jul Aug Sep Oct Nov
20%
30%
40%
50%
14.39%
29.69%
12.59%
50.51%
13.43%
45.94%
17.61%
22.76%
YoY GROWTH
Apr May Jun Jul Aug Sep Oct Nov
-40%
-20%
0%
20%9.05%
23.67%29.43%
5.40%
21.02%
-40.82%
7.05%
-22.04%
YoY GROWTH
Apr May Jun Jul Aug Sep Oct Nov

Ashok Leyland(Number of Vehicles)
CAPITALMIND • (C) ALL RIGHTS RESERVED • capitalmind.in Nov'15 The SparkPlug Report - [BUSES - PASSENGER CARRIERS] 40
1458 15
84 1837
1845
1909 20
36
1394 15
95
1131
2018
2398
2774
2395 24
98
1542 16
75
Apr May Jun Jul Aug Sep Oct Nov0
500
1000
1500
2000
2500
PRODUCTION-2014 -2015
807
879 11
66
1009 12
21
1119
933
657
940
1550
1404
2255
1556
1861
1126
1088
Apr May Jun Jul Aug Sep Oct Nov0
500
1000
1500
2000
DOMESTIC SALES-2014 -2015
280 34
9
469 54
2
643
780
743
852
243
426
604
449
557
373
739
542
Apr May Jun Jul Aug Sep Oct Nov0
200
400
600
800
EXPORTS-2014 -2015
-20%
0%
20%
40%
-22.43%
27.40%30.54%
50.35%
25.46%22.69%
10.62%5.02%
YoY GROWTH
Apr May Jun Jul Aug Sep Oct Nov
20%
40%
60%
80%
100%
120%
16.48%
76.34%
20.41%
123.49%
27.44%
66.31%
20.69%
65.60%
YoY GROWTH
Apr May Jun Jul Aug Sep Oct Nov
-40%
-20%
0%
20%
-13.21%
22.06%28.78%
-17.16%-13.37%
-52.18%
-0.54%
-36.38%
YoY GROWTH
Apr May Jun Jul Aug Sep Oct Nov
37.04 %37.09 %
45.78 %41.66 %
49.18 %58.69 %
55.47 %49.20 %
31.72 %45.19 %46.17 %
54.57 %54.74 %
52.34 %63.07 %
51.21 %
Apr'14May'14Jun'14Jul'14
Aug'14Sep'14Oct'14Nov'14Apr'15
May'15Jun'15Jul'15
Aug'15Sep'15Oct'15Nov'15
0 20 40 60
MARKET SHARE
28.05 %26.77 %
31.30 %34.20 %
45.54 %44.35 %
45.76 %39.46 %
28.56 %36.39 %
33.48 %50.79 %51.17 %50.54 %
46.96 %53.23 %
Apr'14May'14Jun'14Jul'14
Aug'14Sep'14Oct'14Nov'14Apr'15
May'15Jun'15Jul'15
Aug'15Sep'15Oct'15Nov'15
0 10 20 30 40 50
MARKET SHARE
58.95 %52.96 %
59.75 %69.67 %
68.26 %60.19 %
67.18 %64.30 %
46.91 %52.27 %
59.45 %54.76 %
48.86 %48.63 %
62.42 %52.47 %
Apr'14May'14Jun'14Jul'14
Aug'14Sep'14Oct'14Nov'14Apr'15
May'15Jun'15Jul'15
Aug'15Sep'15Oct'15Nov'15
0 20 40 60
MARKET SHARE

Tata Motors(Number of Vehicles)
CAPITALMIND • (C) ALL RIGHTS RESERVED • capitalmind.in Nov'15 The SparkPlug Report - [BUSES - PASSENGER CARRIERS] 41
1387
1409
1410
1707
1121
1068
724
124914
06
1235
1496
1183
1234
1721
490
911
Apr May Jun Jul Aug Sep Oct Nov0
500
1000
1500
PRODUCTION-2014 -2015
1120 12
67 1330
1148
974
925
839
737
1225
1393 14
57
1360
1048
1395
1009
671
Apr May Jun Jul Aug Sep Oct Nov0
500
1000
DOMESTIC SALES-2014 -2015
172
310
311
234 28
3
427
302
432
244
333
320
318
547
316
408
354
Apr May Jun Jul Aug Sep Oct Nov0
100
200
300
400
500
EXPORTS-2014 -2015
-20%
0%
20%
40%
60%
1.37%
-12.35%
6.10%
-30.70%
10.08%
61.14%
-32.32%-27.06%
YoY GROWTH
Apr May Jun Jul Aug Sep Oct Nov
0%
10%
20%
30%
40%
50%
9.38% 9.94% 9.55%
18.47%
7.60%
50.81%
20.26%
-8.96%
YoY GROWTH
Apr May Jun Jul Aug Sep Oct Nov
-20%
0%
20%
40%
60%
80%
41.86%
7.42%2.89%
35.90%
93.29%
-26.00%
35.10%
-18.06%
YoY GROWTH
Apr May Jun Jul Aug Sep Oct Nov
35.24 %32.99 %
35.14 %38.54 %
28.88 %30.79 %
28.81 %38.53 %39.43 %
27.65 %28.80 %
23.27 %28.21 %
36.06 %20.04 %
27.85 %
Apr'14May'14Jun'14Jul'14
Aug'14Sep'14Oct'14Nov'14Apr'15
May'15Jun'15Jul'15
Aug'15Sep'15Oct'15Nov'15
0 10 20 30
MARKET SHARE
38.93 %38.58 %
35.70 %38.92 %
36.33 %36.66 %
41.15 %44.26 %
37.22 %32.71 %
34.74 %30.63 %
34.46 %37.89 %
42.08 %32.83 %
Apr'14May'14Jun'14Jul'14
Aug'14Sep'14Oct'14Nov'14Apr'15
May'15Jun'15Jul'15
Aug'15Sep'15Oct'15Nov'15
0 10 20 30 40
MARKET SHARE
36.21 %47.04 %
39.62 %30.08 %30.04 %
32.95 %27.31 %
32.60 %47.10 %
40.86 %31.50 %
38.78 %47.98 %
41.20 %34.46 %34.27 %
Apr'14May'14Jun'14Jul'14
Aug'14Sep'14Oct'14Nov'14Apr'15
May'15Jun'15Jul'15
Aug'15Sep'15Oct'15Nov'15
0 10 20 30 40
MARKET SHARE

TRUCKS - GOODS CARRIERS

TRUCKS - GOODS CARRIERS
CAPITALMIND • (C) ALL RIGHTS RESERVED • capitalmind.in Nov'15 The SparkPlug Report 43
1683
2
1687
1
1640
4
1674
0
1772
1
1669
2
1605
2
1885
0
1988
7
2150
5
2043
5
2048
9 2480
4 2922
7
1784
8 2247
4
Apr May Jun Jul Aug Sep Oct Nov0
5000
10000
15000
20000
25000
PRODUCTION-2014 -2015
1255
2
1328
8
1464
9
1485
9
1431
9
1651
2
1585
3
1448
3
1598
6
1635
6
1799
0
1862
1
1997
5
2749
0
1978
3
1810
1
Apr May Jun Jul Aug Sep Oct Nov0
5000
10000
15000
20000
25000
DOMESTIC SALES-2014 -2015
1772
1651
1503
1919
1626
1451
1398
1392
1812
1825
2353
1963
2021
1606 17
09
1362
Apr May Jun Jul Aug Sep Oct Nov0
500
1000
1500
2000
EXPORTS-2014 -2015
20%
40%
60%
18.15%
27.47%24.57% 22.40%
39.97%
75.10%
11.19%
19.23%
YoY GROWTH
Apr May Jun Jul Aug Sep Oct Nov
30%
40%
50%
60%
27.36%
23.09% 22.81%25.32%
39.50%
66.48%
24.79% 24.98%
YoY GROWTH
Apr May Jun Jul Aug Sep Oct Nov
0%
10%
20%
30%
40%
50%
2.26%
10.54%
56.55%
2.29%
24.29%
10.68%
22.25%
-2.16%
YoY GROWTH
Apr May Jun Jul Aug Sep Oct Nov

Mahindra & Mahindra(Number of Vehicles)
CAPITALMIND • (C) ALL RIGHTS RESERVED • capitalmind.in Nov'15 The SparkPlug Report - [TRUCKS - GOODS CARRIERS] 44
277 32
1
395
291
159
272
190 24
0
337
350
344
423
357
490
587
466
Apr May Jun Jul Aug Sep Oct Nov0
100
200
300
400
500
PRODUCTION-2014 -2015
244
238 27
9
284
282
180 21
6 259
260
343 40
4
314 34
1
511
581
454
Apr May Jun Jul Aug Sep Oct Nov0
100
200
300
400
500
DOMESTIC SALES-2014 -2015
0 0
7 10 10 10
4
0
5
20
0
54
26
37
7 6
Apr May Jun Jul Aug Sep Oct Nov0
10
20
30
40
50
EXPORTS-2014 -2015
0%
50%
100%
150%
200%
21.66%9.03%
-12.91%
45.36%
124.53%
80.15%
208.95%
94.17%
YoY GROWTH
Apr May Jun Jul Aug Sep Oct Nov
50%
100%
150%
6.56%
44.12% 44.80%
10.56%20.92%
183.89%168.98%
75.29%
YoY GROWTH
Apr May Jun Jul Aug Sep Oct Nov-100%
0%
100%
200%
300%
400%
0.00% 0.00%
-100.00%
440.00%
160.00%
270.00%
75.00%
0.00%
YoY GROWTH
Apr May Jun Jul Aug Sep Oct Nov
1.65 %1.90 %
2.41 %1.74 %
0.90 %1.63 %
1.18 %1.27 %
1.69 %1.63 %1.68 %
2.06 %1.44 %
1.68 %3.29 %
2.07 %
Apr'14May'14Jun'14Jul'14
Aug'14Sep'14Oct'14Nov'14Apr'15
May'15Jun'15Jul'15
Aug'15Sep'15Oct'15Nov'15
0 1 2 3
MARKET SHARE
1.94 %1.79 %
1.90 %1.91 %1.97 %
1.09 %1.36 %
1.79 %1.63 %
2.10 %2.25 %
1.69 %1.71 %
1.86 %2.94 %
2.51 %
Apr'14May'14Jun'14Jul'14
Aug'14Sep'14Oct'14Nov'14Apr'15
May'15Jun'15Jul'15
Aug'15Sep'15Oct'15Nov'15
0.0 0.5 1.0 1.5 2.0 2.5
MARKET SHARE
0.00 %0.00 %
0.47 %0.52 %
0.62 %0.69 %
0.29 %0.00 %
0.28 %1.10 %
0.00 %2.75 %
1.29 %2.30 %
0.41 %0.44 %
Apr'14May'14Jun'14Jul'14
Aug'14Sep'14Oct'14Nov'14Apr'15
May'15Jun'15Jul'15
Aug'15Sep'15Oct'15Nov'15
0.0 0.5 1.0 1.5 2.0 2.5
MARKET SHARE

Tata Motors(Number of Vehicles)
CAPITALMIND • (C) ALL RIGHTS RESERVED • capitalmind.in Nov'15 The SparkPlug Report - [TRUCKS - GOODS CARRIERS] 45
9911
9329 9894
9835
1027
2
1016
8
1030
6 1216
7
1085
0
1247
9
1238
6
1142
1 1336
9 1567
4
1017
8
1345
0
Apr May Jun Jul Aug Sep Oct Nov0
5000
10000
15000
PRODUCTION-2014 -2015
7305 78
46
8290
8577
8167 94
79
9513
8715
8954
9395 99
93
1044
8
1096
9
1452
0
1149
5
1085
3
Apr May Jun Jul Aug Sep Oct Nov0
5000
10000
DOMESTIC SALES-2014 -2015
983
758 88
3
1348
1093
1029
917
86698
9 1178
1619
1380
1262
993
1061
846
Apr May Jun Jul Aug Sep Oct Nov0
500
1000
1500
EXPORTS-2014 -2015
0%
10%
20%
30%
40%
50%
9.47%
33.77%
25.19%
16.13%
30.15%
54.15%
-1.24%
10.54%
YoY GROWTH
Apr May Jun Jul Aug Sep Oct Nov
20%
30%
40%
50%
22.57%19.74% 20.54%
21.81%
34.31%
53.18%
20.83%
24.53%
YoY GROWTH
Apr May Jun Jul Aug Sep Oct Nov
0%
20%
40%
60%
80%
0.61%
55.41%
83.35%
2.37%
15.46%
-3.50%
15.70%
-2.31%
YoY GROWTH
Apr May Jun Jul Aug Sep Oct Nov
58.88 %55.30 %
60.31 %58.75 %57.97 %
60.92 %64.20 %64.55 %
54.56 %58.03 %
60.61 %55.74 %
53.90 %53.63 %
57.03 %59.85 %
Apr'14May'14Jun'14Jul'14
Aug'14Sep'14Oct'14Nov'14Apr'15
May'15Jun'15Jul'15
Aug'15Sep'15Oct'15Nov'15
0 20 40 60
MARKET SHARE
58.20 %59.05 %
56.59 %57.72 %57.04 %57.41 %
60.01 %60.17 %
56.01 %57.44 %
55.55 %56.11 %
54.91 %52.82 %
58.11 %59.96 %
Apr'14May'14Jun'14Jul'14
Aug'14Sep'14Oct'14Nov'14Apr'15
May'15Jun'15Jul'15
Aug'15Sep'15Oct'15Nov'15
0 20 40 60
MARKET SHARE
55.47 %45.91 %
58.75 %70.24 %
67.22 %70.92 %
65.59 %62.21 %
54.58 %64.55 %
68.81 %70.30 %
62.44 %61.83 %62.08 %62.11 %
Apr'14May'14Jun'14Jul'14
Aug'14Sep'14Oct'14Nov'14Apr'15
May'15Jun'15Jul'15
Aug'15Sep'15Oct'15Nov'15
0 20 40 60
MARKET SHARE