Embed Size (px)
Citation preview

Assignment: Financial Ratio Analysis
Subject: Basic Accounting (ACC30205)
Company: LTKM Berhad
Group members: Le Jia Nian (0319957) Marco Leong Wong Ka Henn (0320026) Chin Khang Wei (0320728)
Submission Date: 1st June 2015
Company Overview: LTKM Berhad is a subsidiary of “Ladang Ternakan Kelang Management Sendirian Berhad”. It is one of the Malaysiabased famous investment holding company and engaged in the provision of management services. LTKM Berhad is based in Klang, Malaysia.
The Company is engaged in production and sales of eggs initially.Over the times until present, the company expand and operates in three segments: production and sale of poultry and related products, extraction and sale of sand and investment holding.
Core production and sale of poultry and related products segment is engaged in the
production, distribution and sales of chicken eggs, chickens and organic fertilizers for plantation, gardening, or landscaping.
Their extraction and sale of sand segment is engaged in the mining, extracting and sale
of sand. In this segment, LTKM Berhad involved in production and processing of glass. Whereas the investment holding segment is engaged in investment activities in quoted
and unquoted securities, as well as investment properties held by the Company on a long term basis.
The Company’s brands of products include LTK Omega Plus, LTK Organic Selenium
Plus and LTK BioFer. LTKM Berhad eggs export to Singapore and Hong Kong reputed by its qualities to control the price floor.
“Successful companies are about people who commit their jobs towards excellence”
LTKM Berhad

Company’s History: The passion for egg business has led the Tan family to establish a small scale farm for the production of chicken eggs, which also led to the incorporation of Ladang Ternakan Kelang Sdn Bhd that was held in 1976 by the three Tan brothers. From its humble beginning, the farm initially operated on a small piece of 10acre land in Kampung Jawa, Klang. Over the years, the company has progressed to a sophisticated, highly automated farm in Malacca spanning over 400 acres. A total of 1.8 million birds accommodate over 100 conventional and modern multi decker cages and closed house systems that produce over one million eggs per day. The group has over 400 staff, of which 25% are foreign workers. A large number of these employees are long serving and dedicated members of the management team who synonymously developed and grew with the Group. Steady growth, sustainable profitability and very prudent management define LTKM group today. In anticipation of future development, the company will continue to tap into research and development as well as emphasize on innovation that brings the company to new dimensions, along with new opportunities. The journey continues until today. Company’s Board Of Directors: Ir. Kamarudin bin Md Derom (Chairman)
Datuk Tan Kok (Managing Director)
Datin Lim Hooi Tin (NonExecuting Director)
Ooi Chee Seng (NonExecuting Director)
Ravindran Markandu (Audit Head)
Company’s Value: LTKM Berhad wants to uphold the highest standards of professionalism and corporate governance to maximize the benefit of our stakeholders at all times.
● Integrity, ● Technical leadership, ● Cost efficiency and effectiveness, ● Teamwork, and ● Professional business ethics
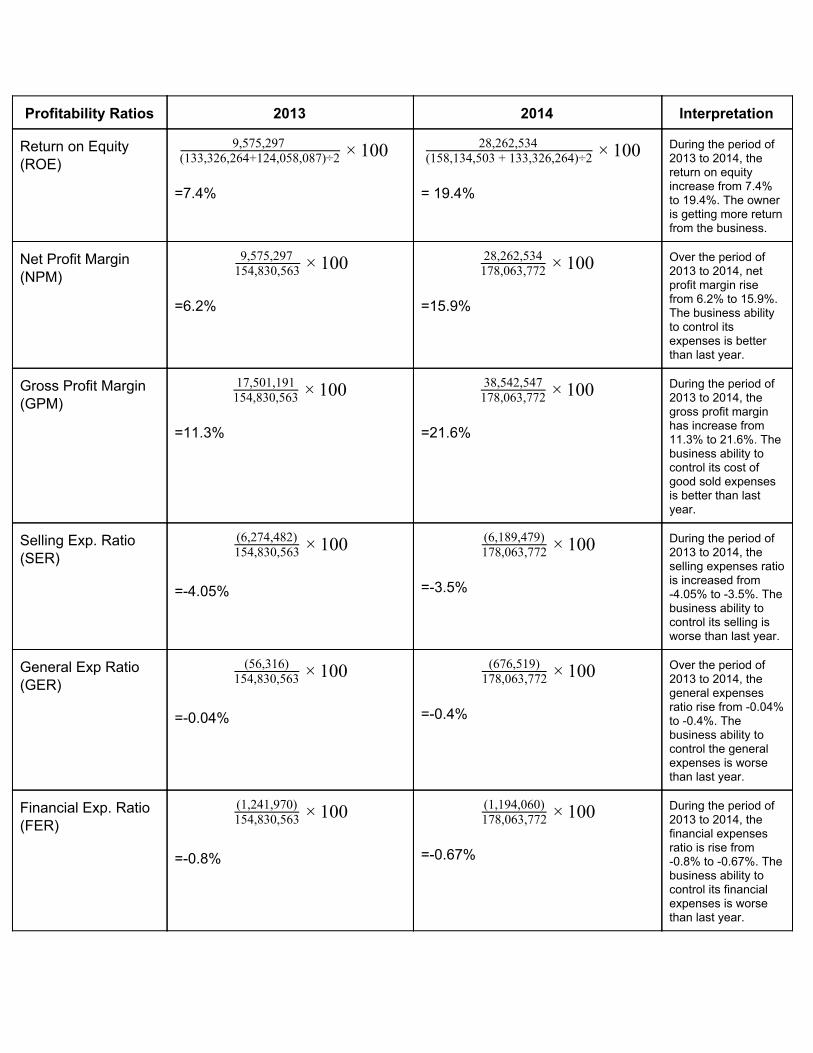
Profitability Ratios 2013 2014 Interpretation
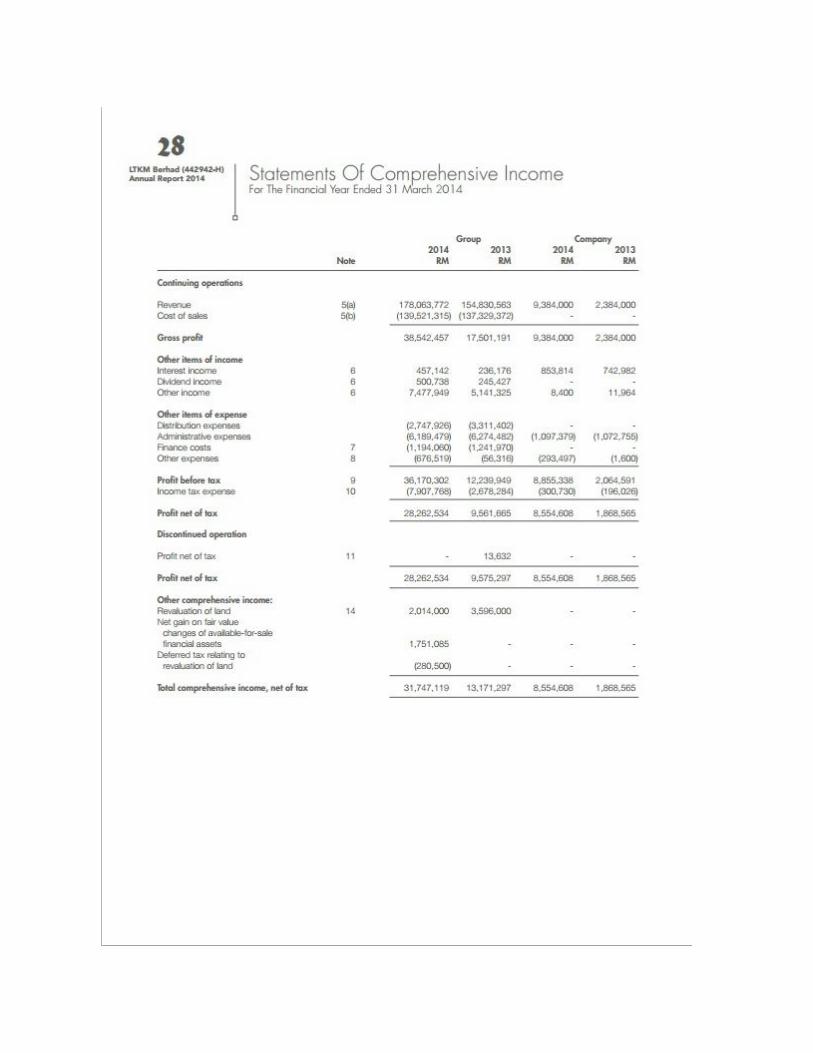
Return on Equity (ROE)
009,575,297(133,326,264+124,058,087)÷2 × 1 =7.4%
0028,262,534(158,134,503 + 133,326,264)÷2 × 1 = 19.4%
During the period of 2013 to 2014, the return on equity increase from 7.4% to 19.4%. The owner is getting more return from the business.
Net Profit Margin (NPM)
009,575,297154,830,563 × 1
=6.2%
0028,262,534178,063,772 × 1
=15.9%
Over the period of 2013 to 2014, net profit margin rise from 6.2% to 15.9%. The business ability to control its expenses is better than last year.
Gross Profit Margin (GPM)
0017,501,191154,830,563 × 1
=11.3%
0038,542,547178,063,772 × 1
=21.6%
During the period of 2013 to 2014, the gross profit margin has increase from 11.3% to 21.6%. The business ability to control its cost of good sold expenses is better than last year.
Selling Exp. Ratio (SER)
00(6,274,482)154,830,563 × 1
=4.05%
00(6,189,479)178,063,772 × 1
=3.5%
During the period of 2013 to 2014, the selling expenses ratio is increased from 4.05% to 3.5%. The business ability to control its selling is worse than last year.
General Exp Ratio (GER)
00(56,316)154,830,563 × 1
=0.04%
00(676,519)178,063,772 × 1
=0.4%
Over the period of 2013 to 2014, the general expenses ratio rise from 0.04% to 0.4%. The business ability to control the general expenses is worse than last year.
Financial Exp. Ratio (FER)
00(1,241,970)154,830,563 × 1
=0.8%
00(1,194,060)178,063,772 × 1
=0.67%
During the period of 2013 to 2014, the financial expenses ratio is rise from 0.8% to 0.67%. The business ability to control its financial expenses is worse than last year.
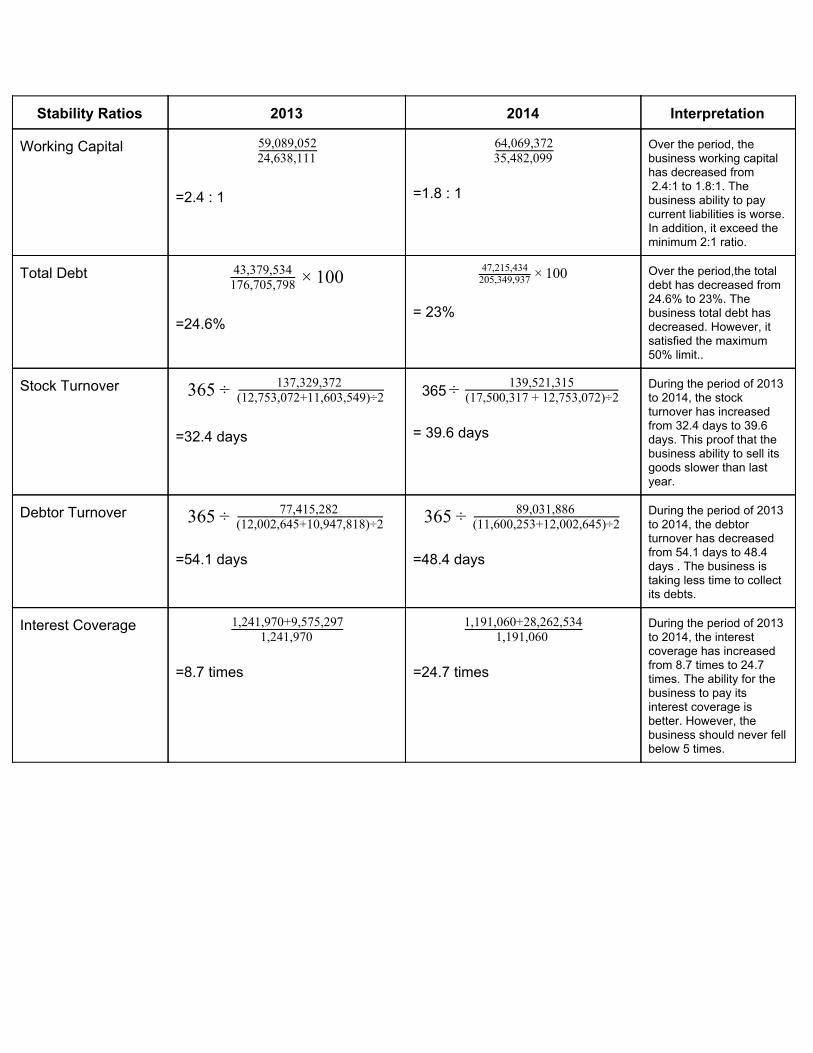
Stability Ratios 2013 2014 Interpretation
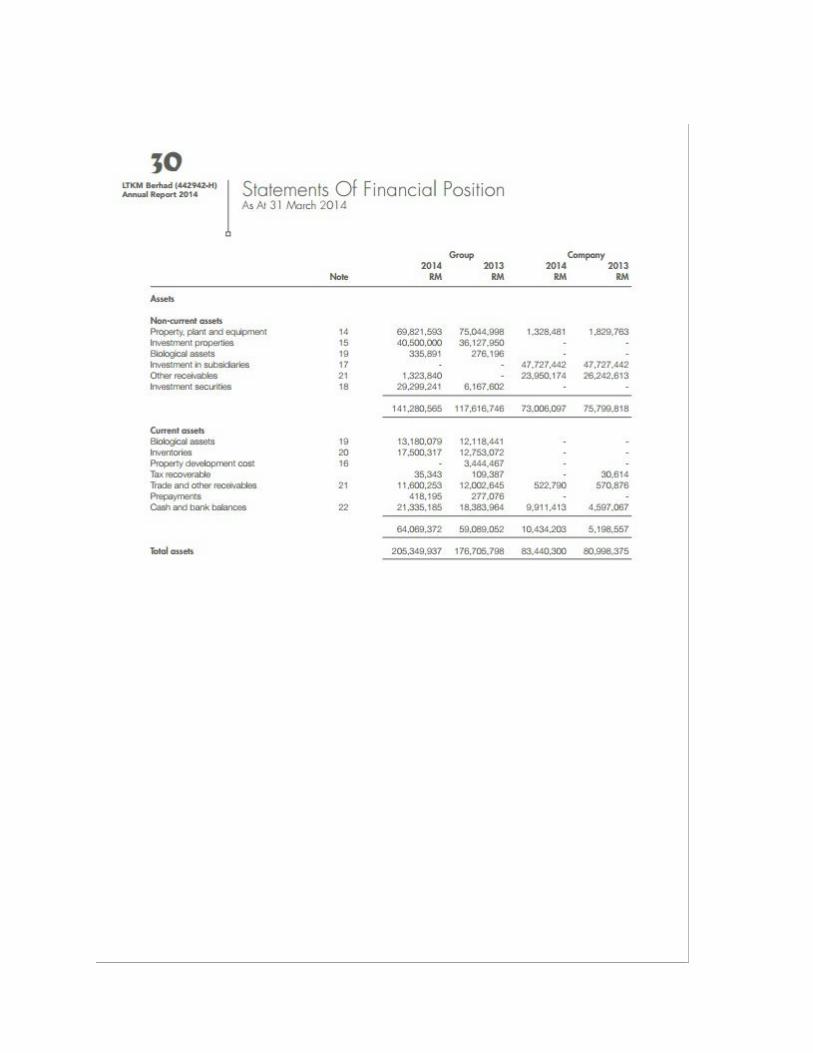
Working Capital 24,638,11159,089,052
=2.4 : 1
35,482,09964,069,372
=1.8 : 1
Over the period, the business working capital has decreased from 2.4:1 to 1.8:1. The business ability to pay current liabilities is worse. In addition, it exceed the minimum 2:1 ratio.
Total Debt 0043,379,534176,705,798 × 1
=24.6%
00 47,215,434205,349,937 × 1
= 23%
Over the period,the total debt has decreased from 24.6% to 23%. The business total debt has decreased. However, it satisfied the maximum 50% limit..
Stock Turnover 653 ÷ 137,329,372(12,753,072+11,603,549)÷2
=32.4 days
365÷ 139,521,315(17,500,317 + 12,753,072)÷2
= 39.6 days
During the period of 2013 to 2014, the stock turnover has increased from 32.4 days to 39.6 days. This proof that the business ability to sell its goods slower than last year.
Debtor Turnover 653 ÷ 77,415,282(12,002,645+10,947,818)÷2
=54.1 days
653 ÷ 89,031,886(11,600,253+12,002,645)÷2
=48.4 days
During the period of 2013 to 2014, the debtor turnover has decreased from 54.1 days to 48.4 days . The business is taking less time to collect its debts.
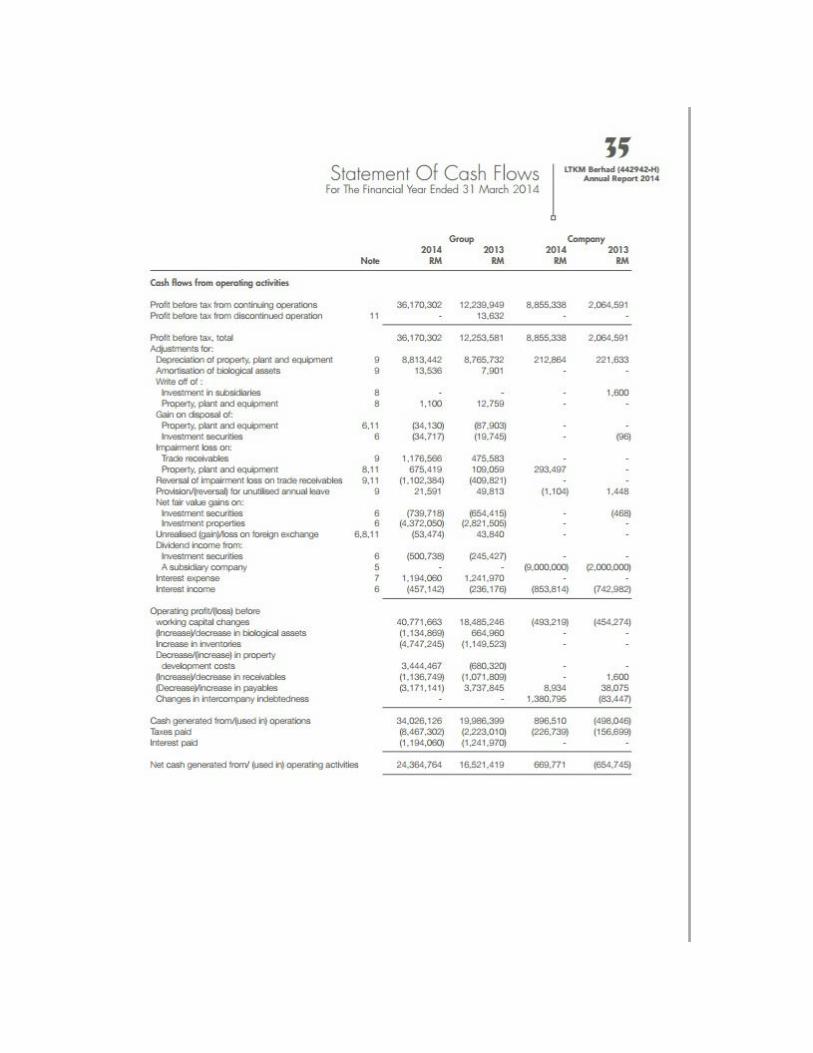
Interest Coverage 1,241,970
1,241,970+9,575,297
=8.7 times
1,191,0601,191,060+28,262,534
=24.7 times
During the period of 2013 to 2014, the interest coverage has increased from 8.7 times to 24.7 times. The ability for the business to pay its interest coverage is better. However, the business should never fell below 5 times.
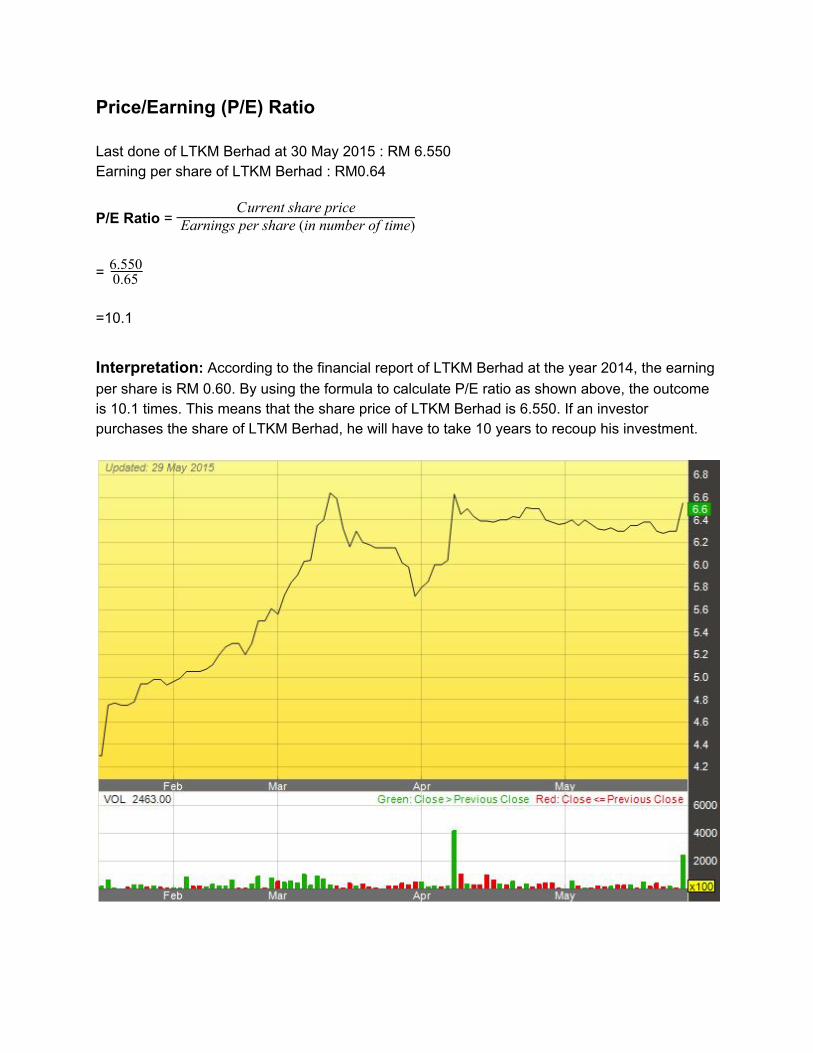
Price/Earning (P/E) Ratio Last done of LTKM Berhad at 30 May 2015 : RM 6.550 Earning per share of LTKM Berhad : RM0.64
P/E Ratio =Current share price
Earnings per share (in number of time)
= 0.656.550
=10.1
Interpretation: According to the financial report of LTKM Berhad at the year 2014, the earning per share is RM 0.60. By using the formula to calculate P/E ratio as shown above, the outcome is 10.1 times. This means that the share price of LTKM Berhad is 6.550. If an investor purchases the share of LTKM Berhad, he will have to take 10 years to recoup his investment.
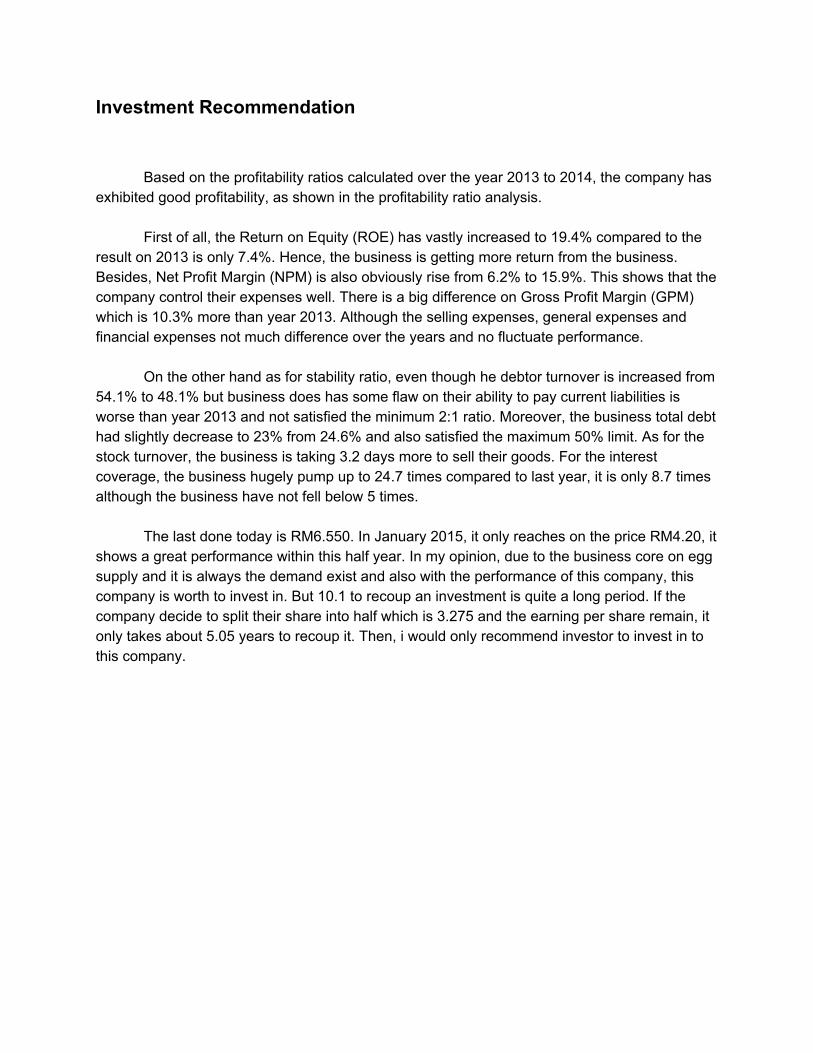
Investment Recommendation
Based on the profitability ratios calculated over the year 2013 to 2014, the company has exhibited good profitability, as shown in the profitability ratio analysis.
First of all, the Return on Equity (ROE) has vastly increased to 19.4% compared to the
result on 2013 is only 7.4%. Hence, the business is getting more return from the business. Besides, Net Profit Margin (NPM) is also obviously rise from 6.2% to 15.9%. This shows that the company control their expenses well. There is a big difference on Gross Profit Margin (GPM) which is 10.3% more than year 2013. Although the selling expenses, general expenses and financial expenses not much difference over the years and no fluctuate performance.
On the other hand as for stability ratio, even though he debtor turnover is increased from
54.1% to 48.1% but business does has some flaw on their ability to pay current liabilities is worse than year 2013 and not satisfied the minimum 2:1 ratio. Moreover, the business total debt had slightly decrease to 23% from 24.6% and also satisfied the maximum 50% limit. As for the stock turnover, the business is taking 3.2 days more to sell their goods. For the interest coverage, the business hugely pump up to 24.7 times compared to last year, it is only 8.7 times although the business have not fell below 5 times.
The last done today is RM6.550. In January 2015, it only reaches on the price RM4.20, it shows a great performance within this half year. In my opinion, due to the business core on egg supply and it is always the demand exist and also with the performance of this company, this company is worth to invest in. But 10.1 to recoup an investment is quite a long period. If the company decide to split their share into half which is 3.275 and the earning per share remain, it only takes about 5.05 years to recoup it. Then, i would only recommend investor to invest in to this company.


References Link: www.ltkm.com.my http://klse.i3investor.com/servlets/stk/7085.jsp http://www.bloomberg.com/research/stocks/snapshot/snapshot.asp?ticker=LTKM:MK http://mystarjob.com/job/company.aspx?eid=12593


![Ratio Analysis Assignment (1)[1]](https://img.dokumen.tips/doc/110x75/577d355e1a28ab3a6b9043d8/ratio-analysis-assignment-11.jpg)