Embed Size (px)
Citation preview
Company Details
Delta Corp is the largest gaming company in India and the only listed company in this space. It is an early
entrant in this space and has attained a leadership position in a short span of time. Delta Corp has acquired
51% stake in an existing Casino in Daman which will offer 1,000 gaming positions (100 table games and 300
slot machines). It also owns an in principle license to set up an additional Casino in Daman.
Over the past years, Delta has proved to be a significant player within the Indian Gaming and Entertainment
Industry. Going forward, the company intends on consolidating its respective position by adding casinos to
its existing portfolio in Goa, as well as expand its Gaming and Entertainment presence in other destinations
as and when they open up in the near future. Delta Corp has acquired 51% stake in Daman Hospitality Pvt.
Ltd. “DHPL”, which owns the largest contiguous integrated casino-resort convention complex in Daman. It
has also acquired 74% stake in Marvel Resorts Pvt. Ltd., which has a parcel of Land in Goa with all
necessary approval to build a 5 Star Hotel. The project will have 250 to 300 hotel keys with approximately
20,000 sq. ft land based casino and the Hotel project is expected to be completed by early 2014. Further,
Delta Corp holds an investment of approximately 34.9% of the equity share capital of Advani Hotels &
Resorts (India) Ltd. Advani Hotels owns & operates Ramada Caravela Beach Resort and a land based
Casino called “Goa nugget”.
The recent launch of The Deltin and the Offshore gaming vessel will give a boost to the companies
operations. The much awaited Horseshoe gaming zone has also started functioning in the end of 2013. The
company has also started consolidation by amalgamating its wholly owned subsidiaries.
The current market capitalization stands at Rs 2,278.71 crore. The company has reported a consolidatedsales of Rs 80.95 crore and a Net Loss of Rs -1.34 crore for the quarter ended Dec 2014.
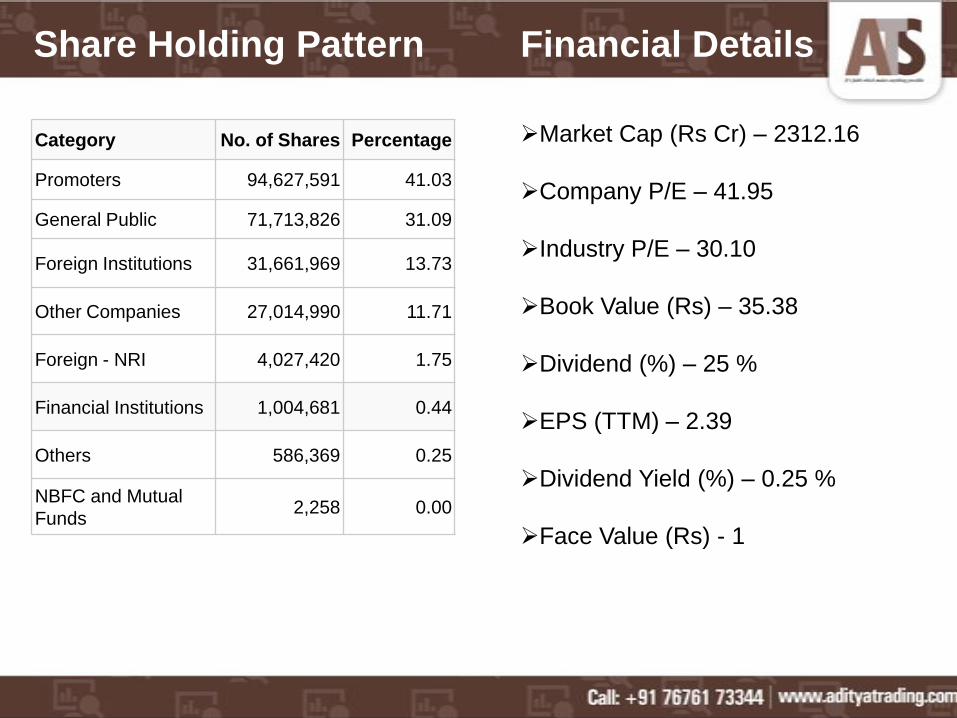
Category No. of Shares Percentage
Promoters 94,627,591 41.03
General Public 71,713,826 31.09
Foreign Institutions 31,661,969 13.73
Other Companies 27,014,990 11.71
Foreign - NRI 4,027,420 1.75
Financial Institutions 1,004,681 0.44
Others 586,369 0.25
NBFC and Mutual
Funds2,258 0.00
Market Cap (Rs Cr) – 2312.16
Company P/E – 41.95
Industry P/E – 30.10
Book Value (Rs) – 35.38
Dividend (%) – 25 %
EPS (TTM) – 2.39
Dividend Yield (%) – 0.25 %
Face Value (Rs) - 1
Share Holding Pattern Financial Details
Gaming is one of the oldest forms of entertainment and business. Today, gaming forms a unique source of
entertainment the world over, with centers like Las Vegas, Macau, and Singapore having emerged as
specialized gaming destinations. These gaming destinations have evolved as entertainment hubs, by adding
key elements of tourism and hospitality, so much so that each drives the other. For the consumer, gaming
and hospitality combine to create and deliver a holistic entertainment experience. This holistic experience
has contributed to the success of these gaming destinations. Asia Pacific region dominates USD183b global
gaming market.
Price Waterhouse Coopers (PWC) estimates the total global gaming casino market in 2015 at USD183b.
The market has grown at a CAGR of 7% over the last 10 years. The Asia Pacific region has led growth, with
a CAGR of 21.5%. With a share of 43%, the Asia Pacific region is now a larger market than the US, which
has 40% share. Centers in the US and Europe traditionally dominated the gaming industry. This changed
with the emergence of Macau and Singapore as popular gaming centers. In 2006, Macau surpassed Las
Vegas as the global gaming leader.
Other gaming destinations in countries like Philippines, Malaysia, Hong Kong, South Korea, Sri Lanka, and
Australia have added to this shifting momentum. In India, gaming is just emerging as an industry; given its
paltry size of ~USD100m, the growth potential is huge.
Though there is strong appetite for gaming in India, restrictive laws have curbed the growth of the industry.
Betting and gaming in India fall under the purview of state legislation, with high entry barriers, strict
regulations, and cap on the number of licenses. Casinos are legally allowed only in Goa, Daman and
Sikkim. The Goa, Daman and Diu Public Gambling Act, 1976 allows casinos to be set up only at five star
hotels or offshore vessels, with prior permission from the government. In general, casino licenses are
awarded for a term of five years, with fees payable annually.
Industry Details
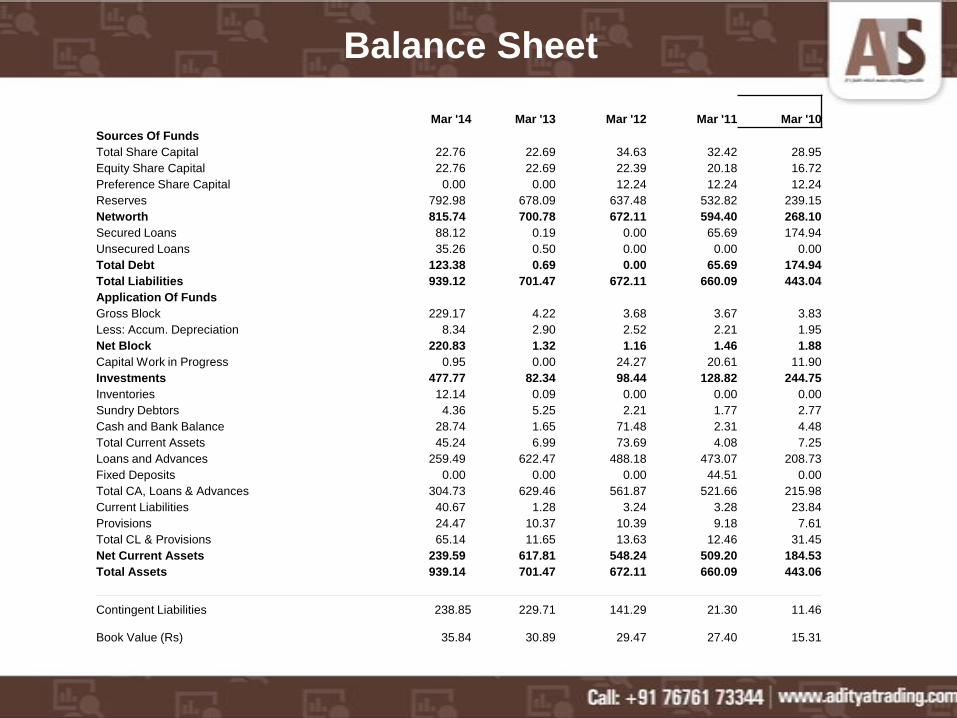
Balance Sheet
Mar '14 Mar '13 Mar '12 Mar '11 Mar '10
Sources Of Funds
Total Share Capital 22.76 22.69 34.63 32.42 28.95
Equity Share Capital 22.76 22.69 22.39 20.18 16.72
Preference Share Capital 0.00 0.00 12.24 12.24 12.24
Reserves 792.98 678.09 637.48 532.82 239.15
Networth 815.74 700.78 672.11 594.40 268.10
Secured Loans 88.12 0.19 0.00 65.69 174.94
Unsecured Loans 35.26 0.50 0.00 0.00 0.00
Total Debt 123.38 0.69 0.00 65.69 174.94
Total Liabilities 939.12 701.47 672.11 660.09 443.04
Application Of Funds
Gross Block 229.17 4.22 3.68 3.67 3.83
Less: Accum. Depreciation 8.34 2.90 2.52 2.21 1.95
Net Block 220.83 1.32 1.16 1.46 1.88
Capital Work in Progress 0.95 0.00 24.27 20.61 11.90
Investments 477.77 82.34 98.44 128.82 244.75
Inventories 12.14 0.09 0.00 0.00 0.00
Sundry Debtors 4.36 5.25 2.21 1.77 2.77
Cash and Bank Balance 28.74 1.65 71.48 2.31 4.48
Total Current Assets 45.24 6.99 73.69 4.08 7.25
Loans and Advances 259.49 622.47 488.18 473.07 208.73
Fixed Deposits 0.00 0.00 0.00 44.51 0.00
Total CA, Loans & Advances 304.73 629.46 561.87 521.66 215.98
Current Liabilities 40.67 1.28 3.24 3.28 23.84
Provisions 24.47 10.37 10.39 9.18 7.61
Total CL & Provisions 65.14 11.65 13.63 12.46 31.45
Net Current Assets 239.59 617.81 548.24 509.20 184.53
Total Assets 939.14 701.47 672.11 660.09 443.06
Contingent Liabilities 238.85 229.71 141.29 21.30 11.46
Book Value (Rs) 35.84 30.89 29.47 27.40 15.31
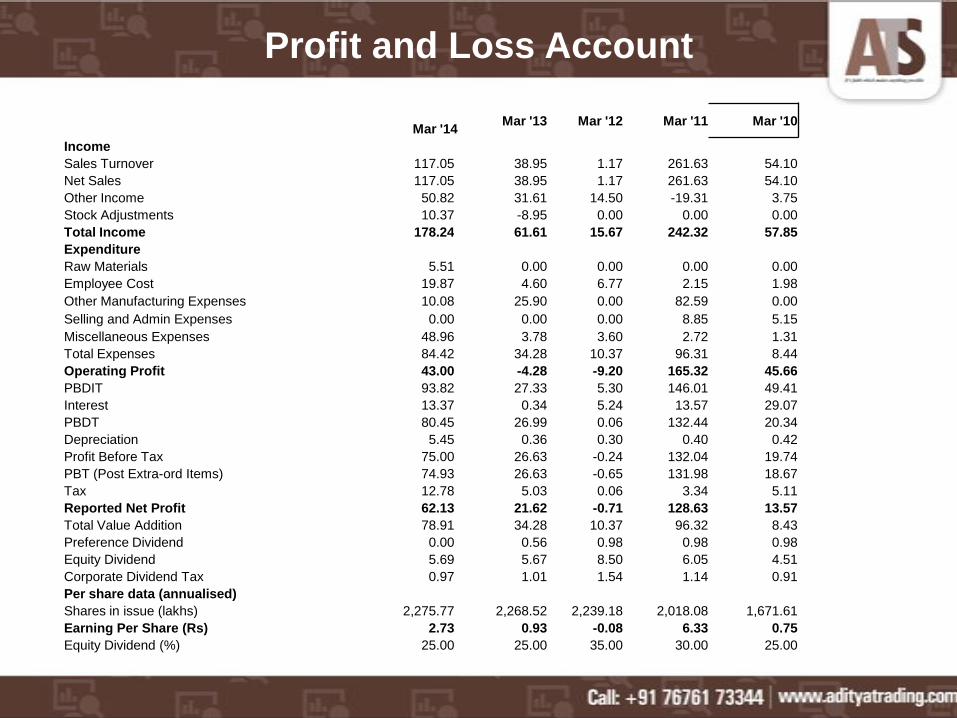
Profit and Loss Account
Mar '14Mar '13 Mar '12 Mar '11 Mar '10
Income
Sales Turnover 117.05 38.95 1.17 261.63 54.10
Net Sales 117.05 38.95 1.17 261.63 54.10
Other Income 50.82 31.61 14.50 -19.31 3.75
Stock Adjustments 10.37 -8.95 0.00 0.00 0.00
Total Income 178.24 61.61 15.67 242.32 57.85
Expenditure
Raw Materials 5.51 0.00 0.00 0.00 0.00
Employee Cost 19.87 4.60 6.77 2.15 1.98
Other Manufacturing Expenses 10.08 25.90 0.00 82.59 0.00
Selling and Admin Expenses 0.00 0.00 0.00 8.85 5.15
Miscellaneous Expenses 48.96 3.78 3.60 2.72 1.31
Total Expenses 84.42 34.28 10.37 96.31 8.44
Operating Profit 43.00 -4.28 -9.20 165.32 45.66
PBDIT 93.82 27.33 5.30 146.01 49.41
Interest 13.37 0.34 5.24 13.57 29.07
PBDT 80.45 26.99 0.06 132.44 20.34
Depreciation 5.45 0.36 0.30 0.40 0.42
Profit Before Tax 75.00 26.63 -0.24 132.04 19.74
PBT (Post Extra-ord Items) 74.93 26.63 -0.65 131.98 18.67
Tax 12.78 5.03 0.06 3.34 5.11
Reported Net Profit 62.13 21.62 -0.71 128.63 13.57
Total Value Addition 78.91 34.28 10.37 96.32 8.43
Preference Dividend 0.00 0.56 0.98 0.98 0.98
Equity Dividend 5.69 5.67 8.50 6.05 4.51
Corporate Dividend Tax 0.97 1.01 1.54 1.14 0.91
Per share data (annualised)
Shares in issue (lakhs) 2,275.77 2,268.52 2,239.18 2,018.08 1,671.61
Earning Per Share (Rs) 2.73 0.93 -0.08 6.33 0.75
Equity Dividend (%) 25.00 25.00 35.00 30.00 25.00
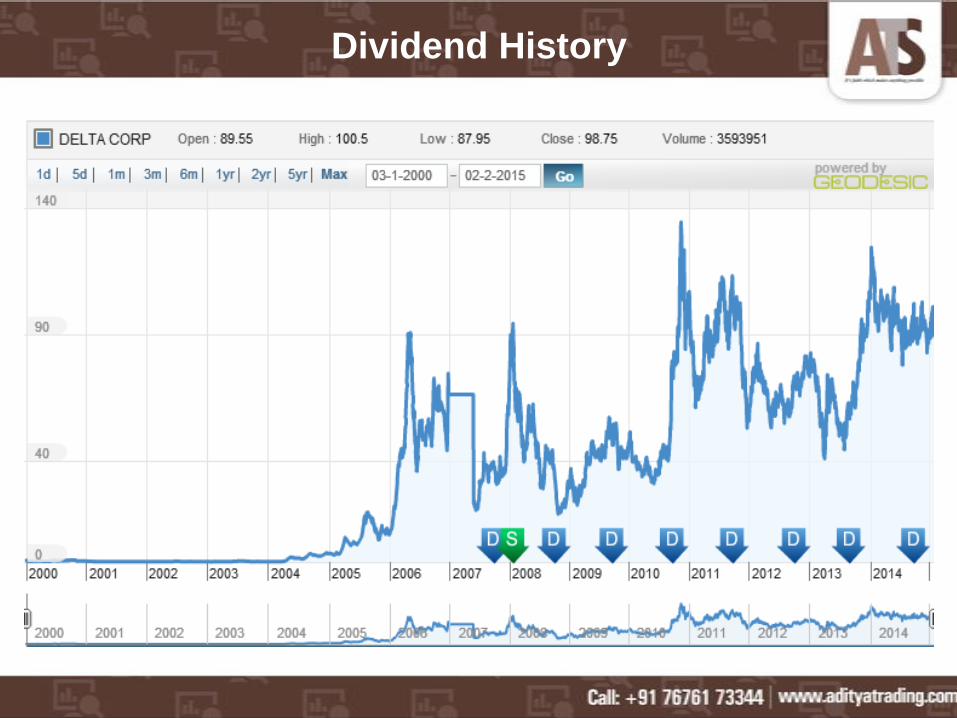
Dividend History
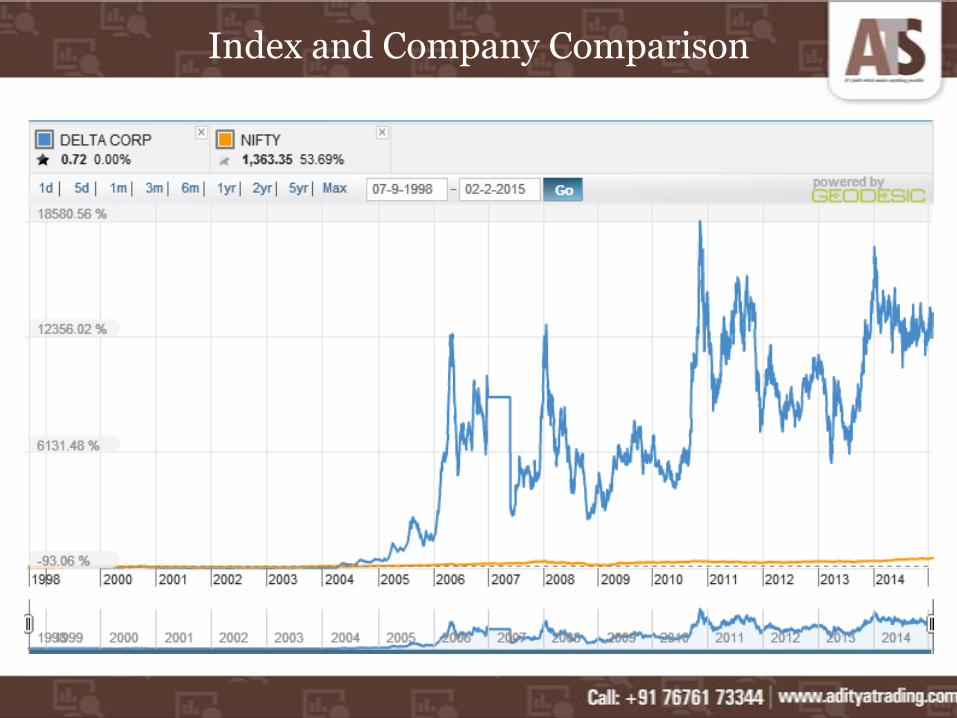
Index and Company Comparison
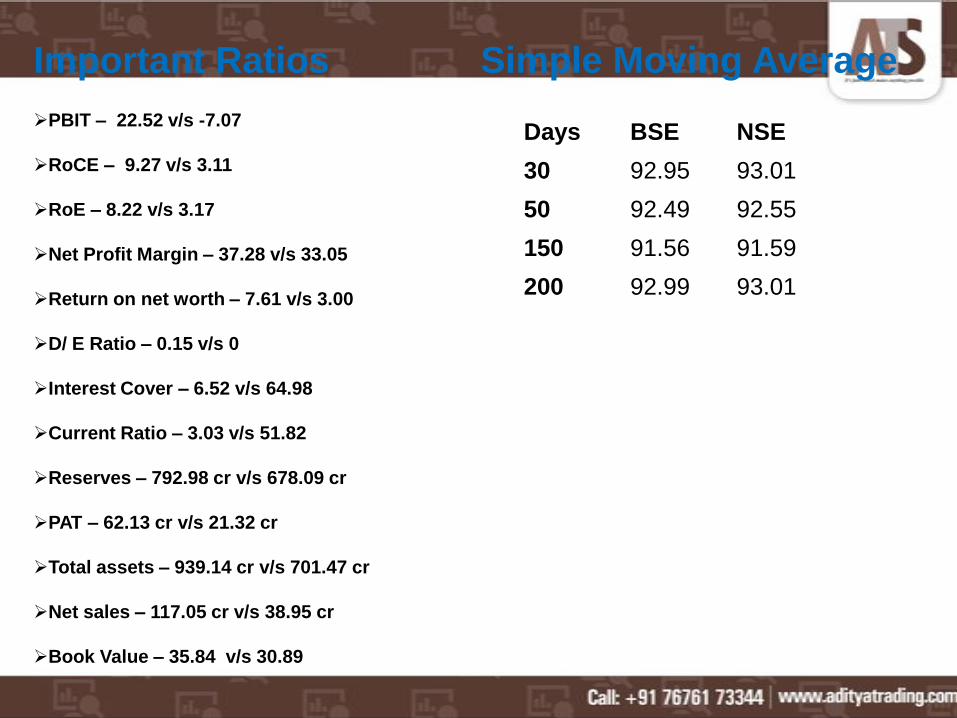
PBIT – 22.52 v/s -7.07
RoCE – 9.27 v/s 3.11
RoE – 8.22 v/s 3.17
Net Profit Margin – 37.28 v/s 33.05
Return on net worth – 7.61 v/s 3.00
D/ E Ratio – 0.15 v/s 0
Interest Cover – 6.52 v/s 64.98
Current Ratio – 3.03 v/s 51.82
Reserves – 792.98 cr v/s 678.09 cr
PAT – 62.13 cr v/s 21.32 cr
Total assets – 939.14 cr v/s 701.47 cr
Net sales – 117.05 cr v/s 38.95 cr
Book Value – 35.84 v/s 30.89
Days BSE NSE
30 92.95 93.01
50 92.49 92.55
150 91.56 91.59
200 92.99 93.01
Important Ratios Simple Moving Average
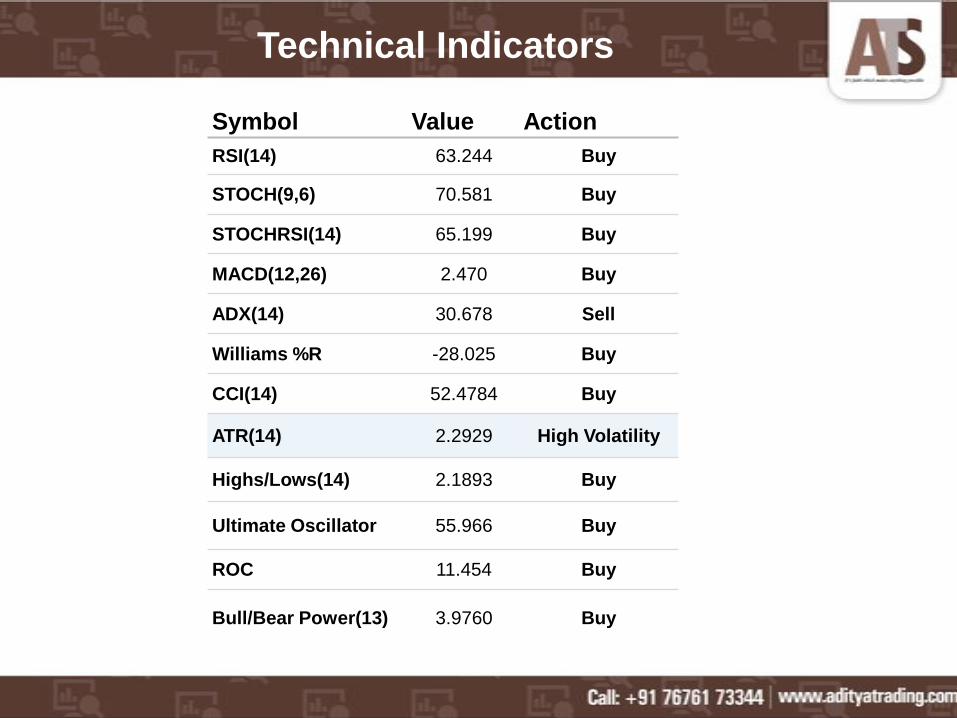
Symbol Value Action
RSI(14) 63.244 Buy
STOCH(9,6) 70.581 Buy
STOCHRSI(14) 65.199 Buy
MACD(12,26) 2.470 Buy
ADX(14) 30.678 Sell
Williams %R -28.025 Buy
CCI(14) 52.4784 Buy
ATR(14) 2.2929 High Volatility
Highs/Lows(14) 2.1893 Buy
Ultimate Oscillator 55.966 Buy
ROC 11.454 Buy
Bull/Bear Power(13) 3.9760 Buy
Technical Indicators
Recommendations
Buy Delta Corp Ltd. at current or lower
market levels
Reasons for the recommendations are :
Sound financial position of the company.
Increase in popularity and participation in gambling and casino.
No need for capex in current business.
Entry barriers into business for competitors because of license issues.
Establishing new projects in Sikkim will be a huge trigger for growth.
Steady CAGR in profits and revenue.
Income from other business such as hospitality and real estate in Kenya.