WHEN FIELD PERFORMANCE OF MASONRY DOES NOT
CORRELATE WITH LAB TEST RESULTS
Peter R. Meijer, AIAPeter Meijer Architect, PC
Outline
BackgroundHistory of DeficienciesBrick ManufacturingVisual Observation
Field TestingLab Testing
Background

Historic High School
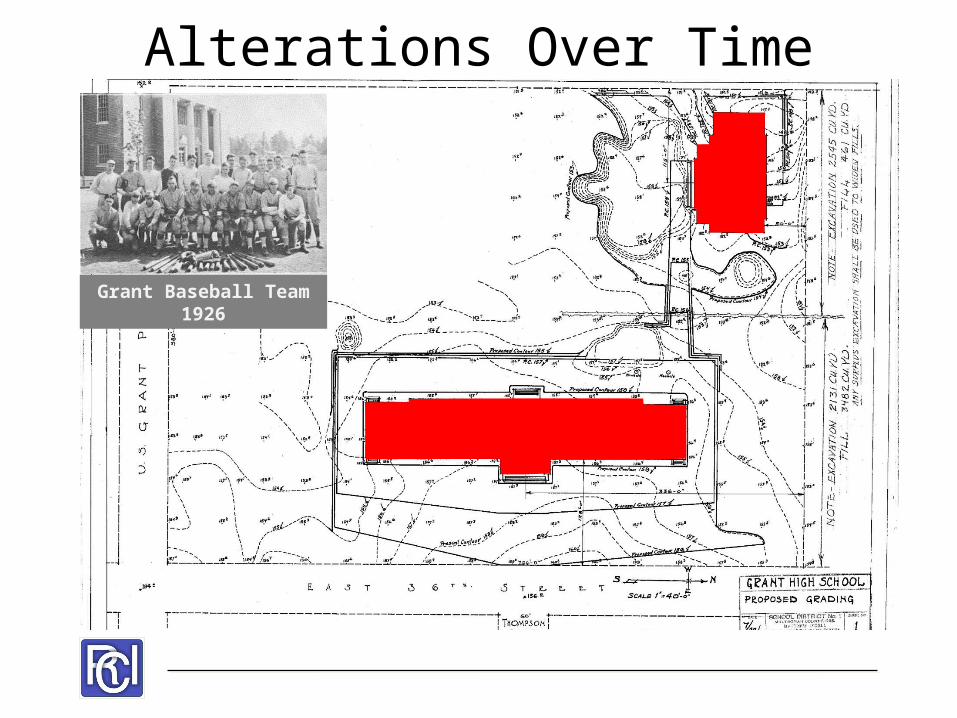
Grant Baseball Team 1926
Alterations Over Time
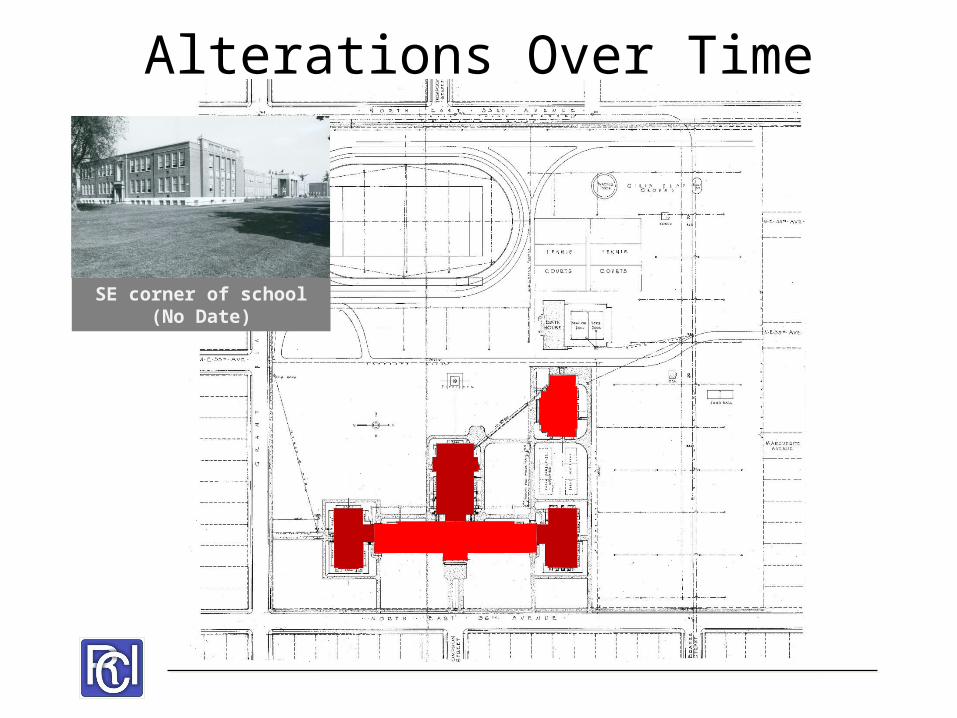
SE corner of school (No Date)
Alterations Over Time

Grant Baseball Team 1951
Alterations Over Time
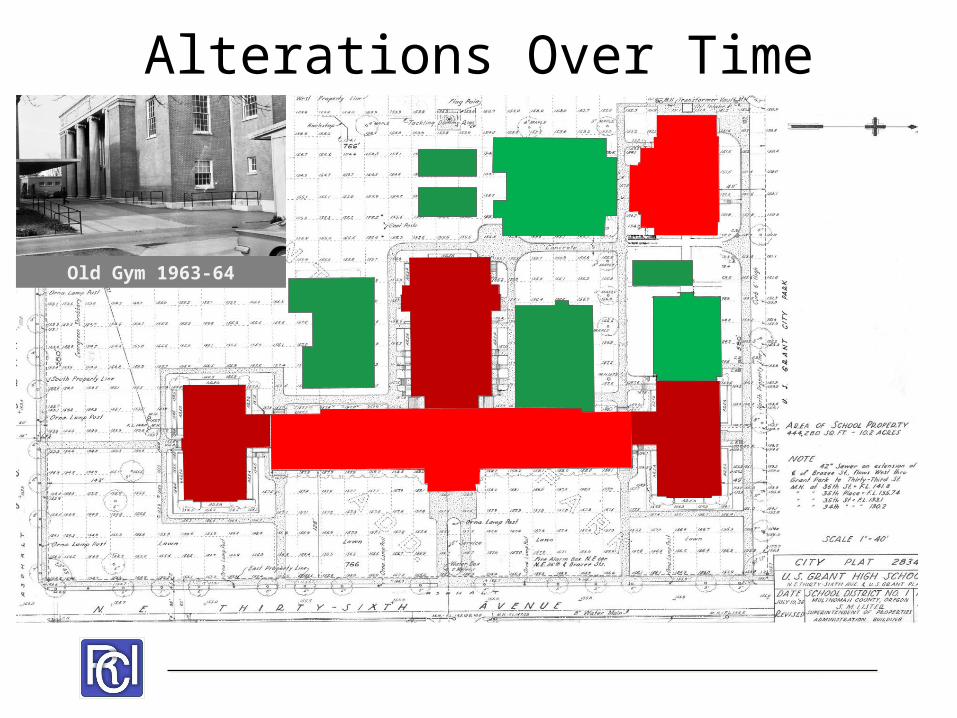
Old Gym 1963-64
Alterations Over Time
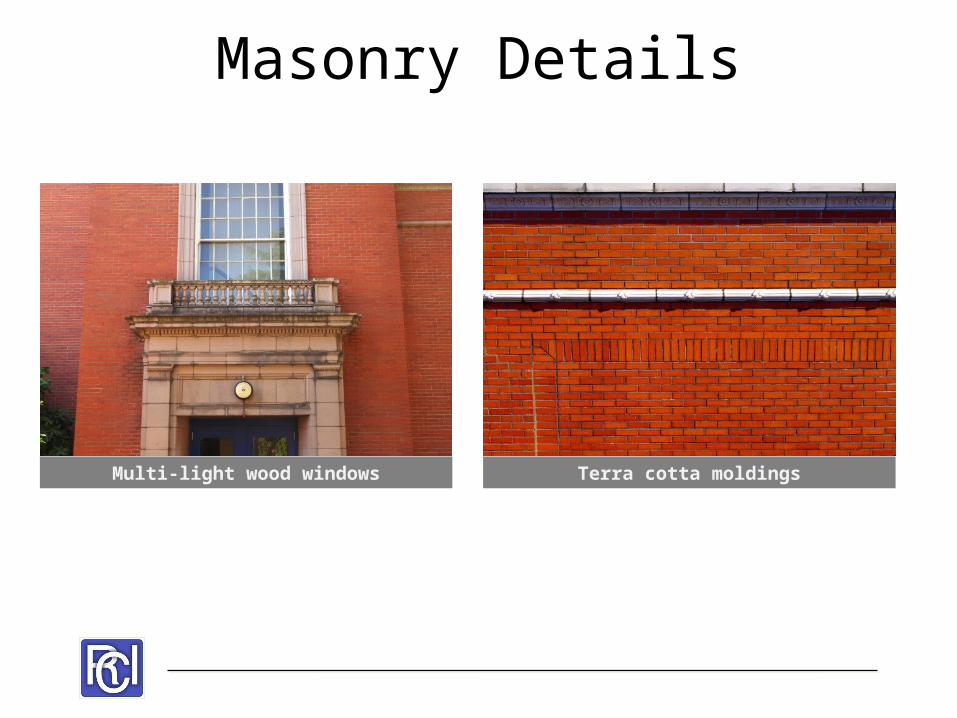
Multi-light wood windows Terra cotta moldings
Masonry Details
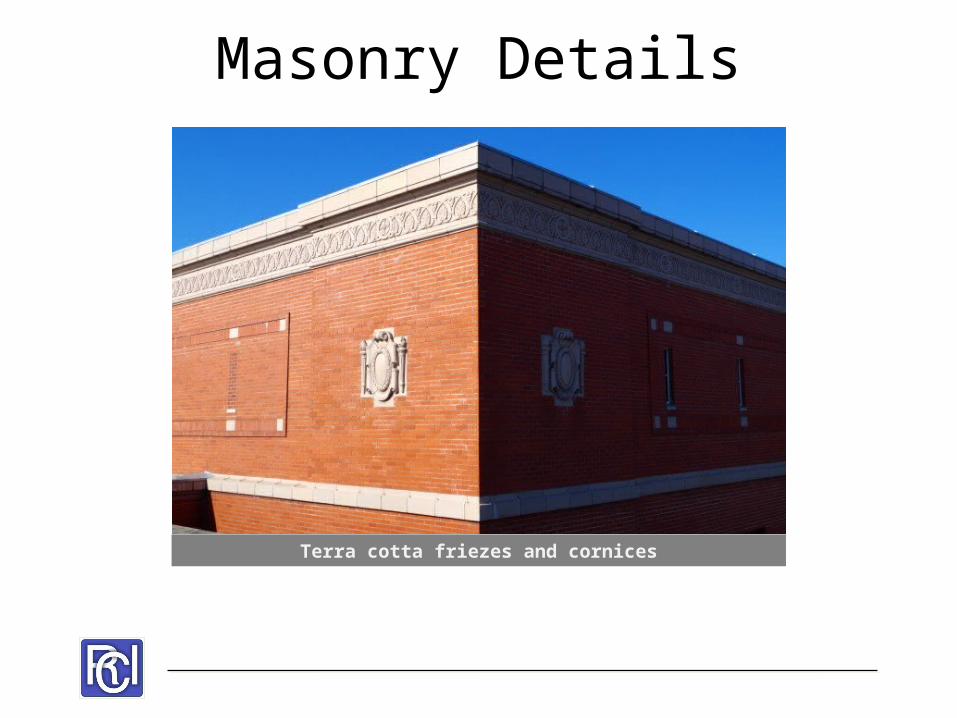
Terra cotta friezes and cornices
Masonry Details
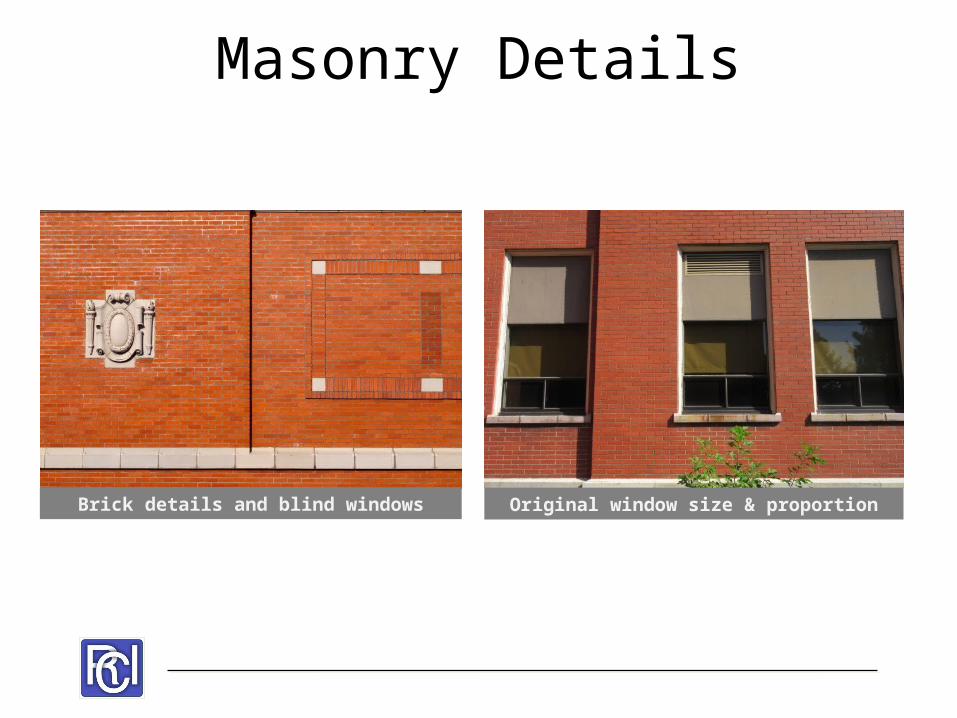
Brick details and blind windows Original window size & proportion
Masonry Details
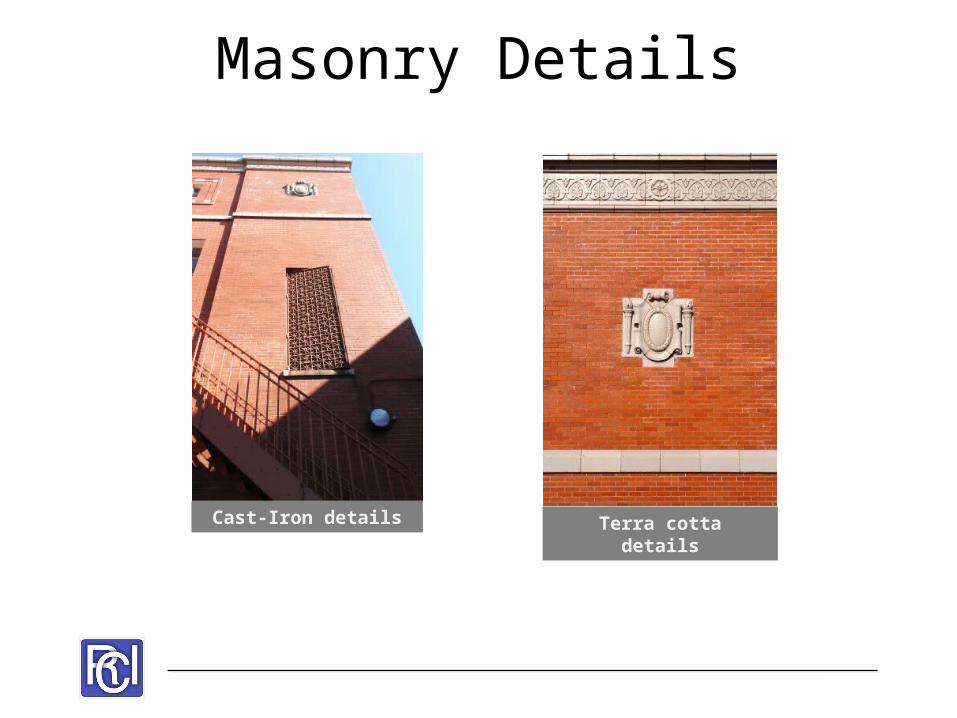
Cast-Iron details Terra cottadetails
Masonry Details
History of Deficiencies
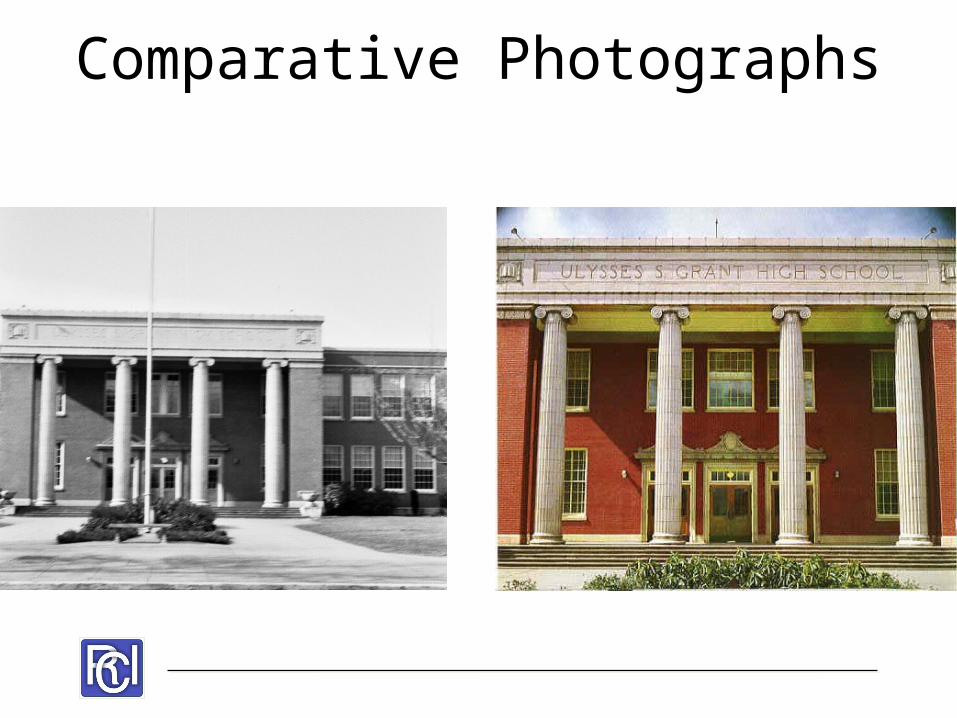
Comparative Photographs
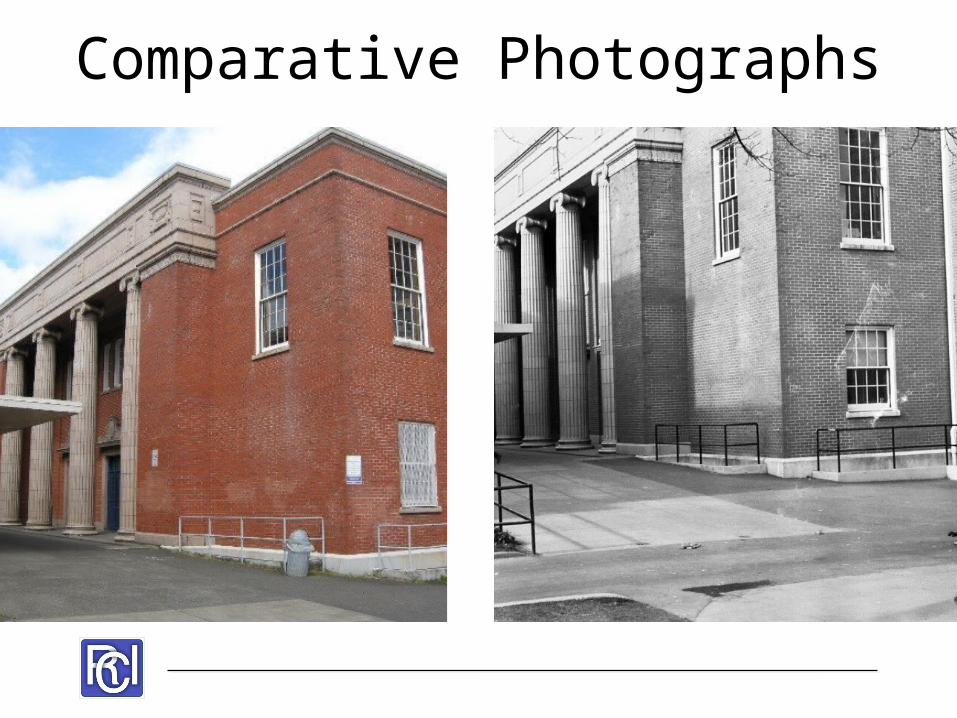
Comparative Photographs
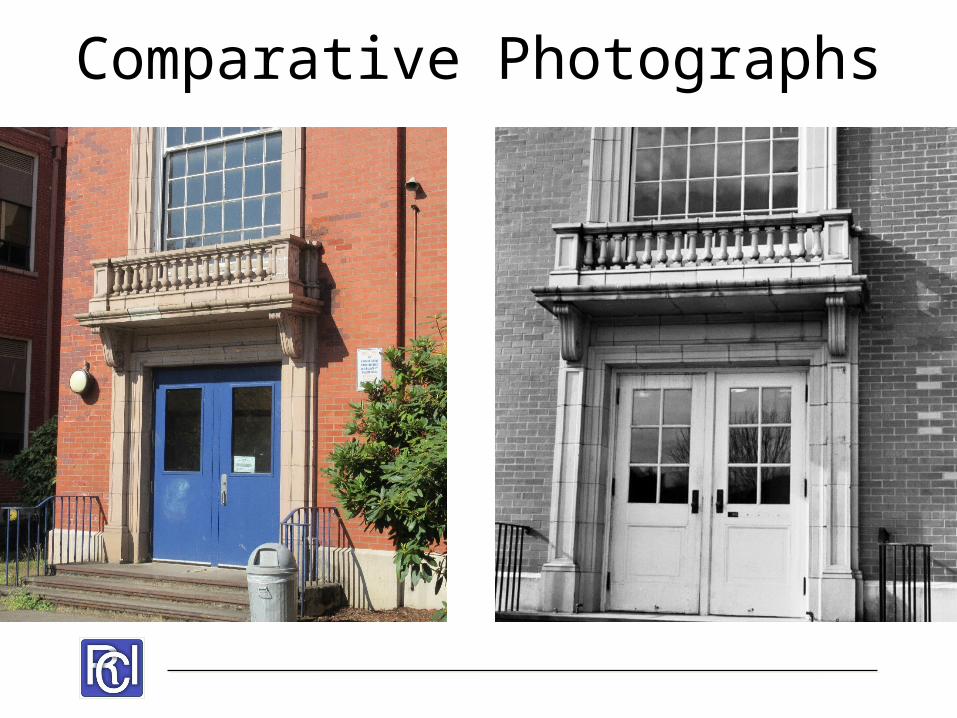
Comparative Photographs
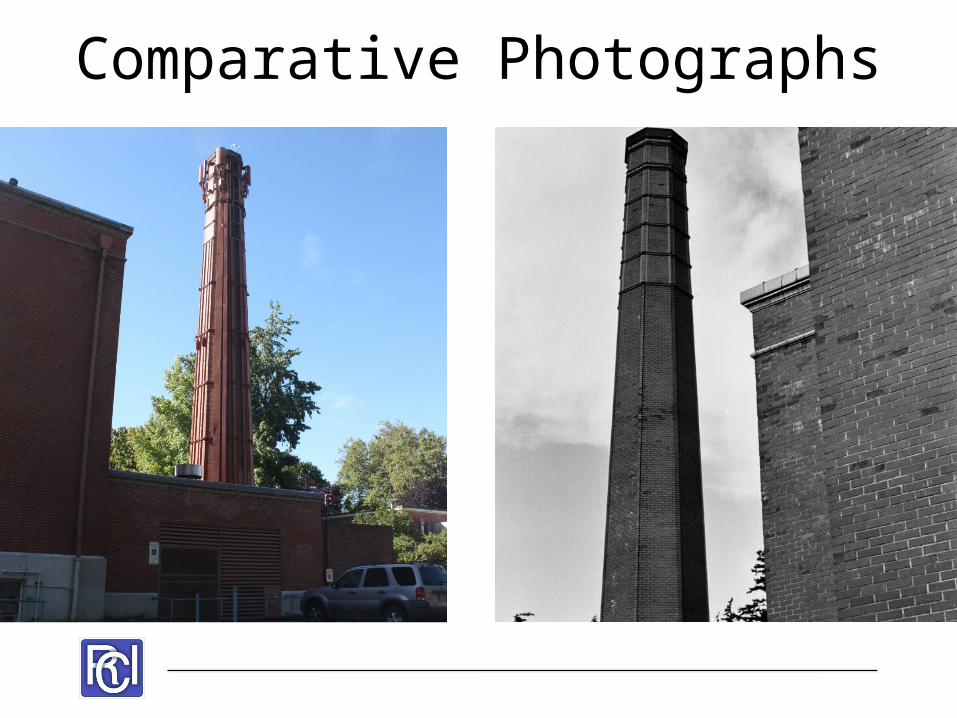
Comparative Photographs

Brick Manufacturing
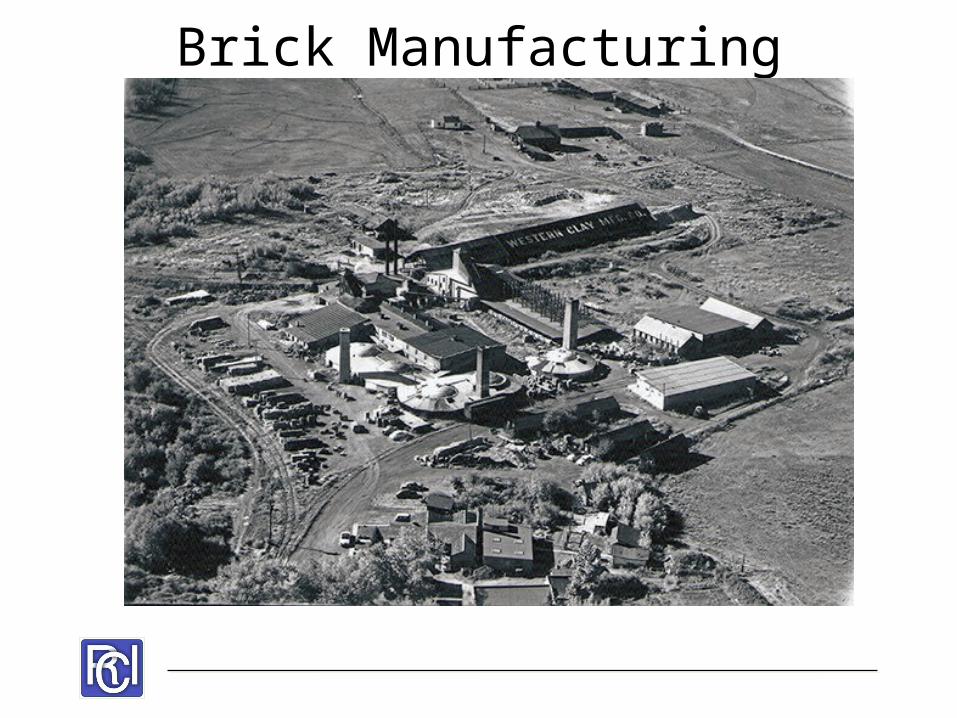
Brick Manufacturing
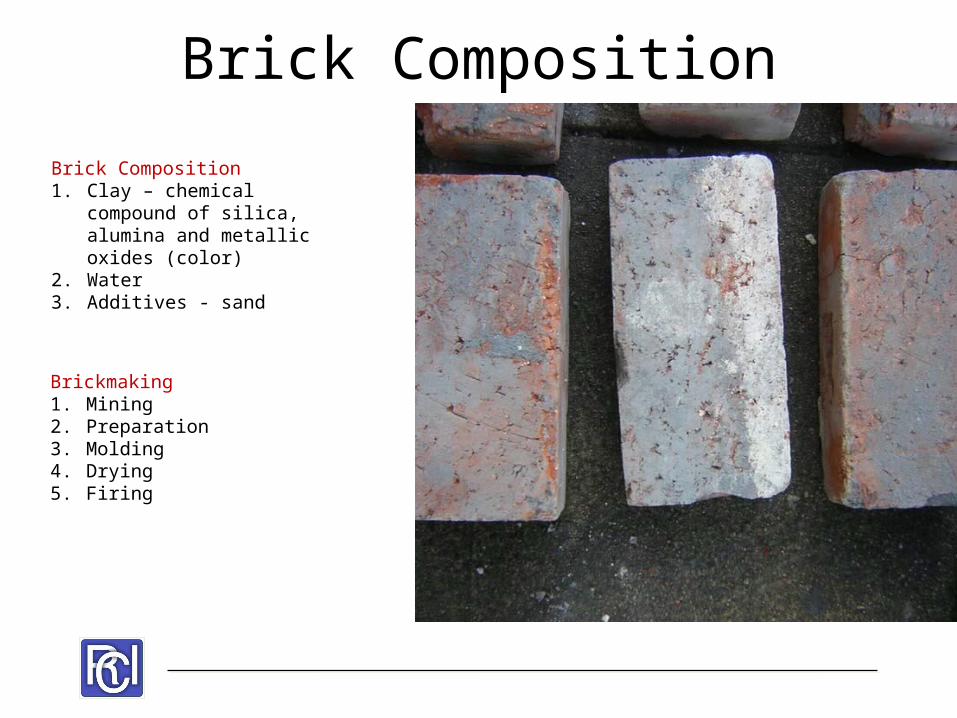
Brick Composition
Brickmaking1. Mining2. Preparation3. Molding4. Drying5. Firing
Brick Composition1. Clay – chemical compound
of silica, alumina and metallic oxides (color)
2. Water3. Additives - sand
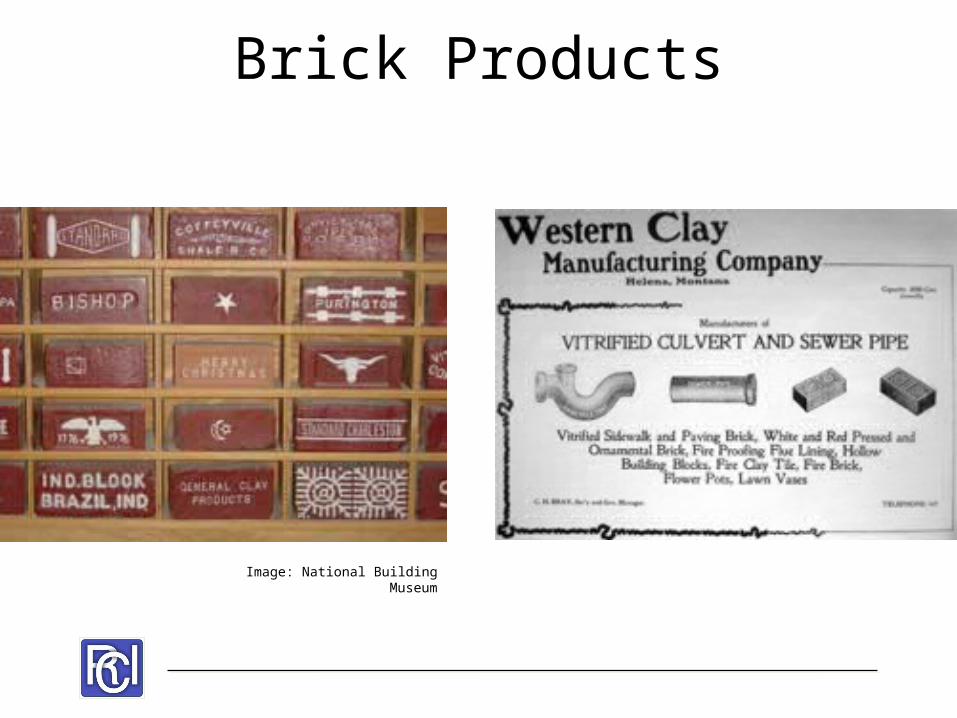
Brick Products
Image: National Building Museum
Common Deficiencies
Common Deficiencies
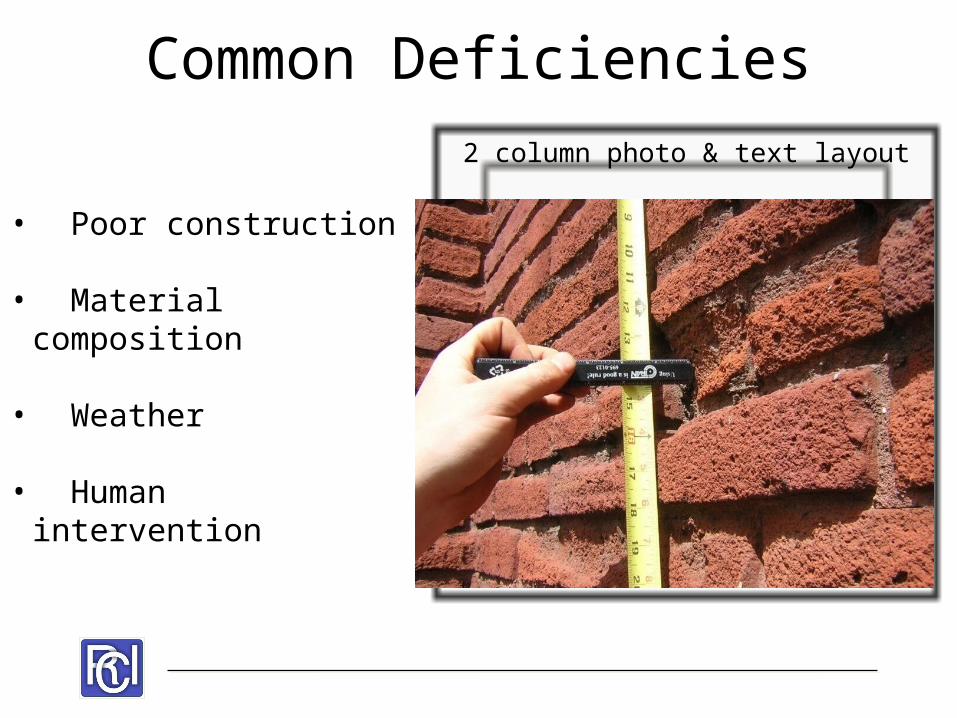
• Poor construction
• Material composition
• Weather
• Human intervention
2 column photo & text layout
Defined picture area
Common Deficiencies2 column photo & text layout
Defined picture area
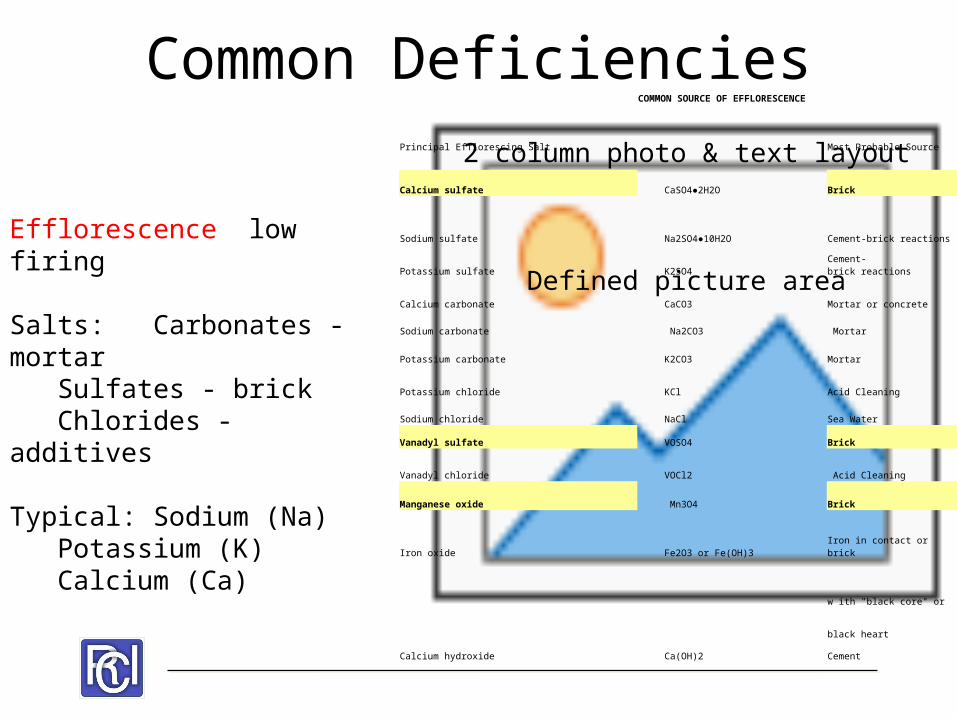
COMMON SOURCE OF EFFLORESCENCE
Principal Efflorescing Salt Most Probable Source
Calcium sulfate CaSO4●2H2O Brick
Sodium sulfate Na2SO4●10H2O Cement-brick reactions
Potassium sulfate K2SO4Cement-brick reactions
Calcium carbonate CaCO3 Mortar or concrete
Sodium carbonate Na2CO3 Mortar
Potassium carbonate K2CO3 Mortar
Potassium chloride KCl Acid Cleaning
Sodium chloride NaCl Sea Water
Vanadyl sulfate VOSO4 Brick
Vanadyl chloride VOCl2 Acid Cleaning
Manganese oxide Mn3O4 Brick
Iron oxide Fe2O3 or Fe(OH)3 Iron in contact or brick
w ith "black core" or
black heart
Calcium hydroxide Ca(OH)2 Cement
Efflorescence low firing
Salts: Carbonates - mortar
Sulfates - brickChlorides -
additives
Typical: Sodium (Na)
Potassium (K)Calcium (Ca)
Common Deficiencies
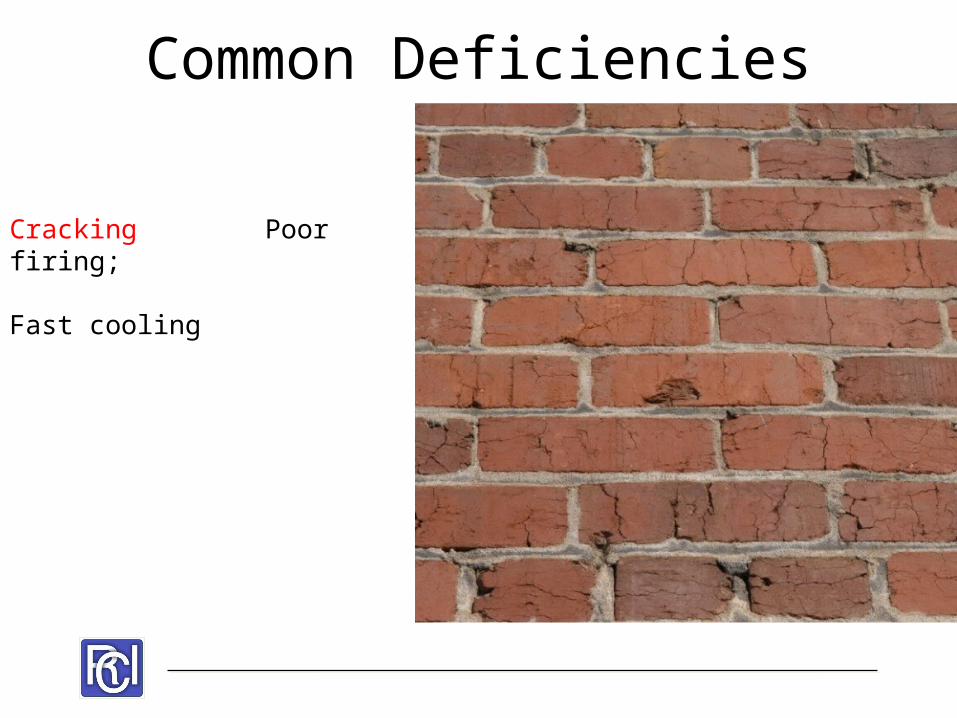
Cracking Poor firing; Fast cooling
Common Deficiencies
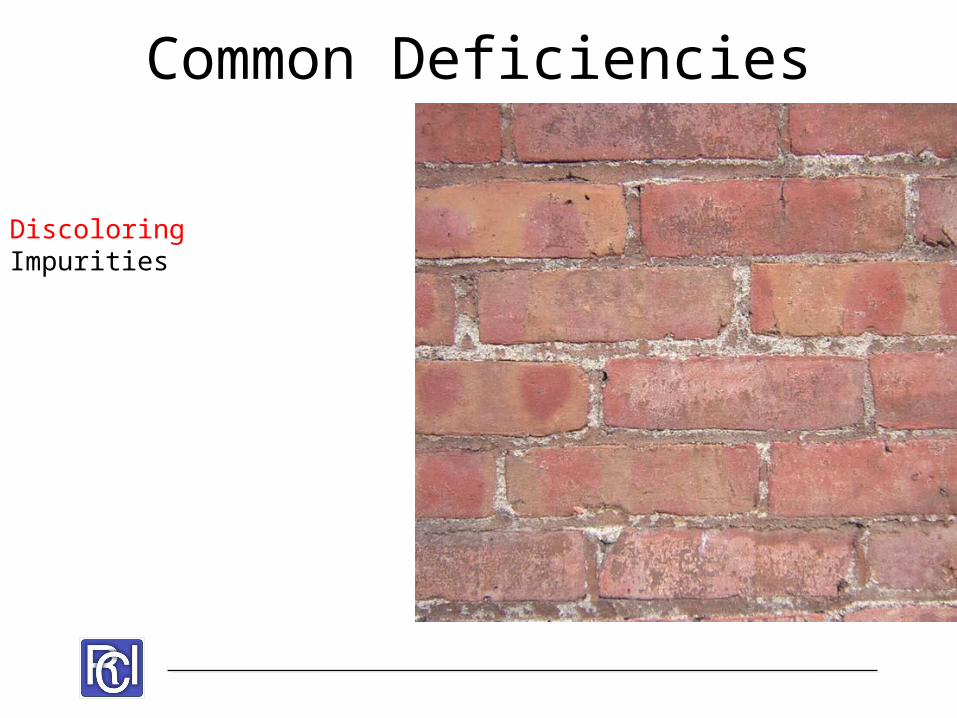
Discoloring Impurities
Common Deficiencies
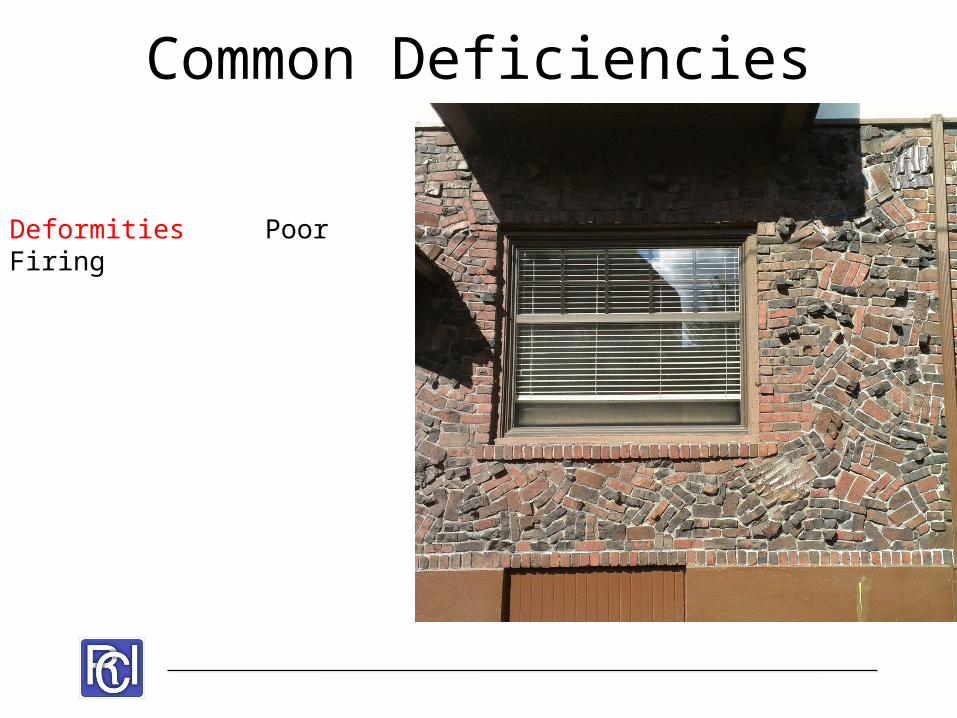
Deformities Poor Firing
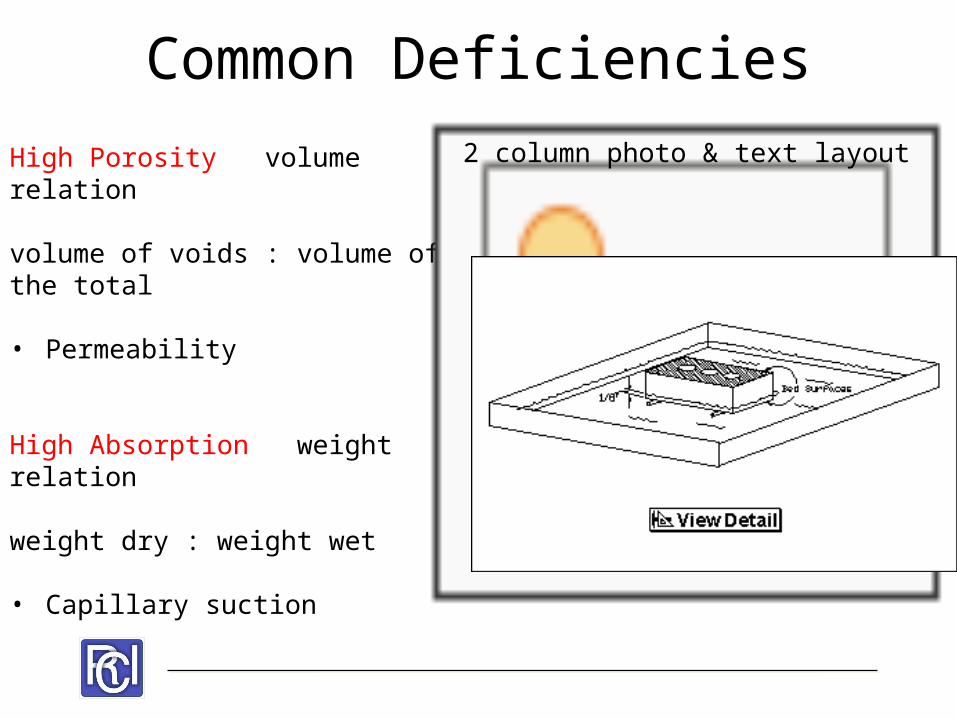
Common DeficienciesHigh Porosity volume relation
volume of voids : volume of the total
• Permeability
High Absorption weight relation
weight dry : weight wet
• Capillary suction
2 column photo & text layout
Defined picture area
Visual Observations
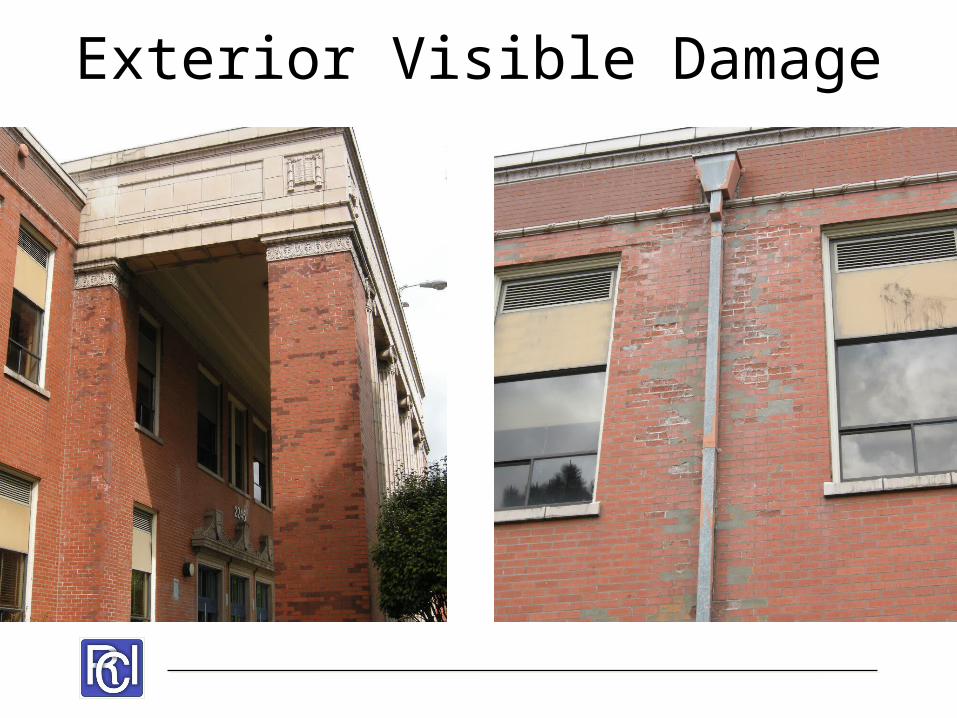
Exterior Visible Damage
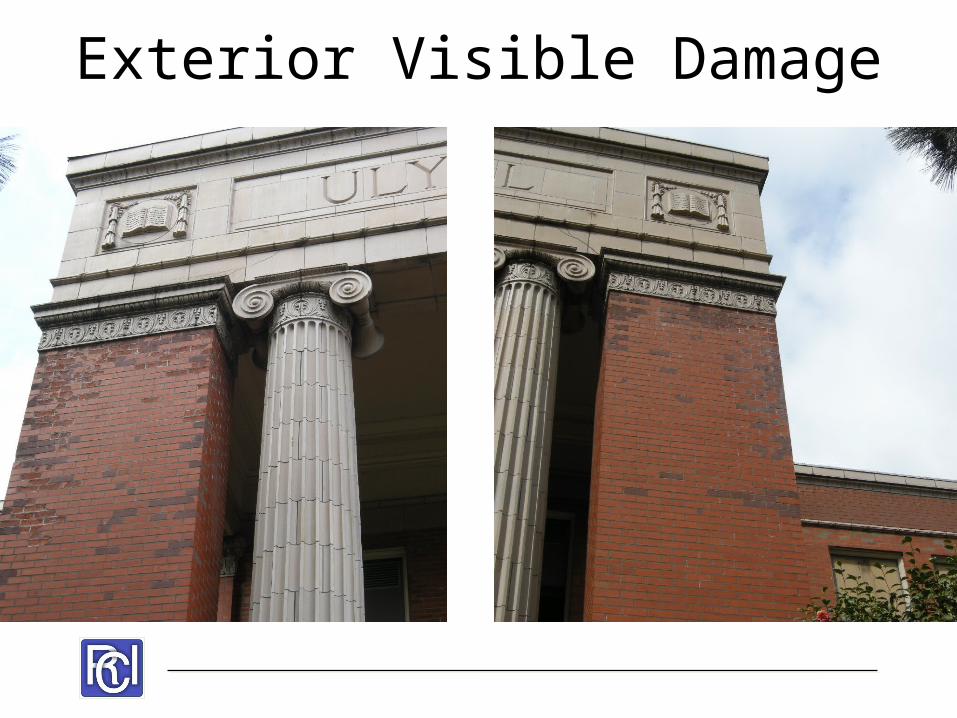
Exterior Visible Damage
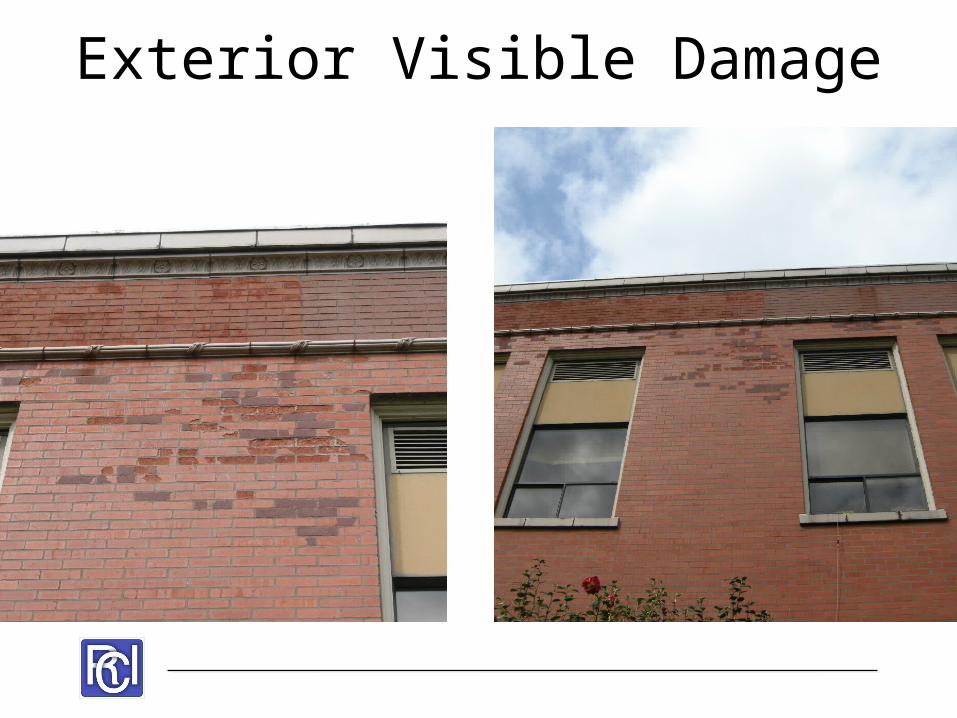
Exterior Visible Damage
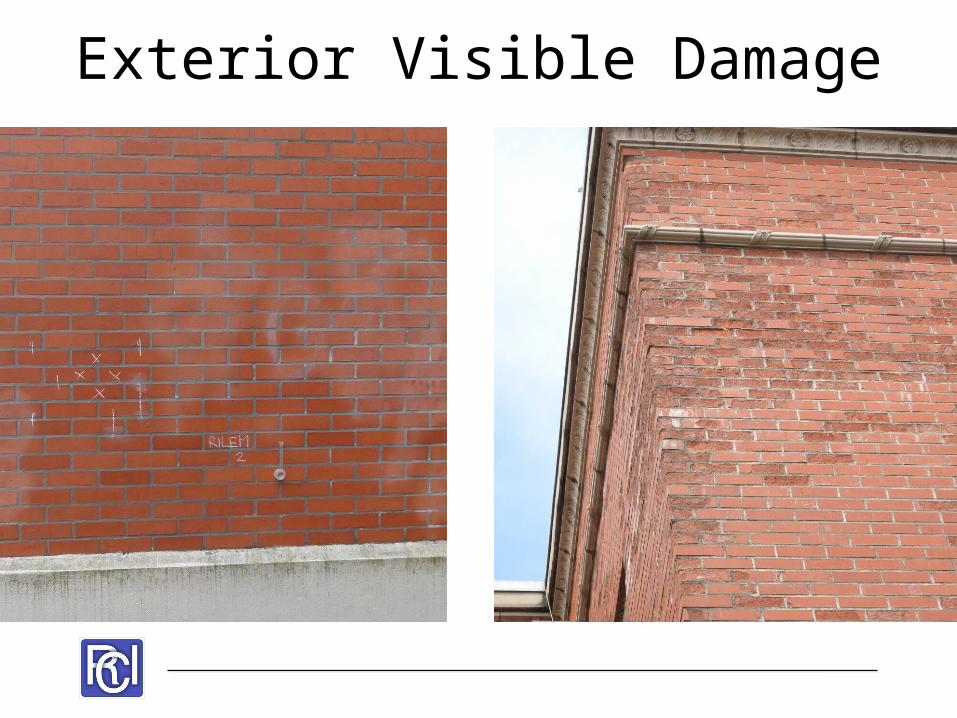
Exterior Visible Damage
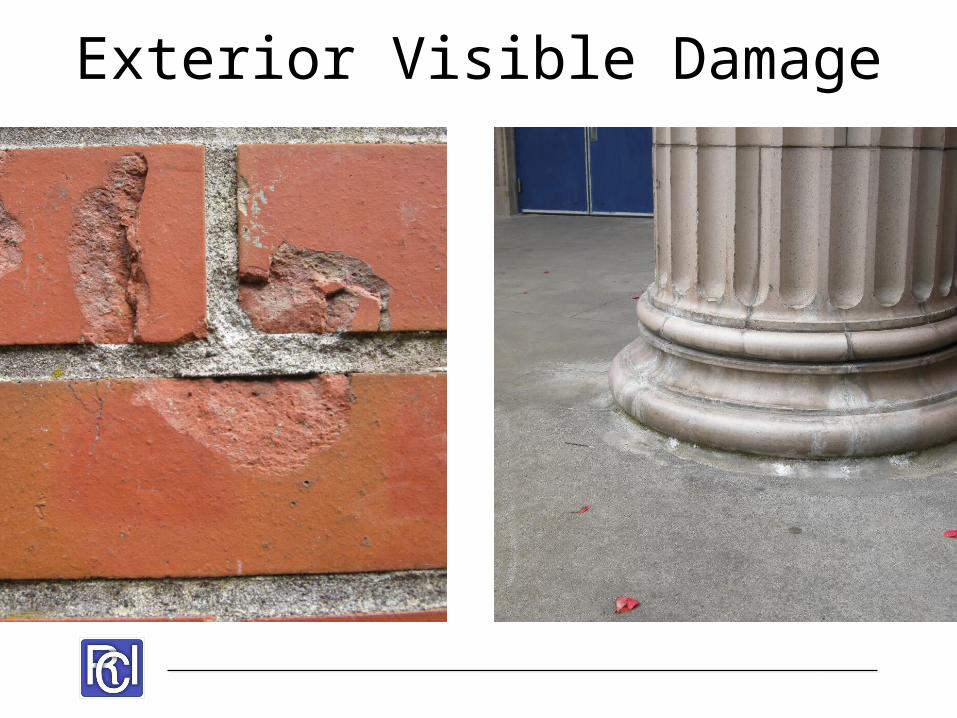
Exterior Visible Damage
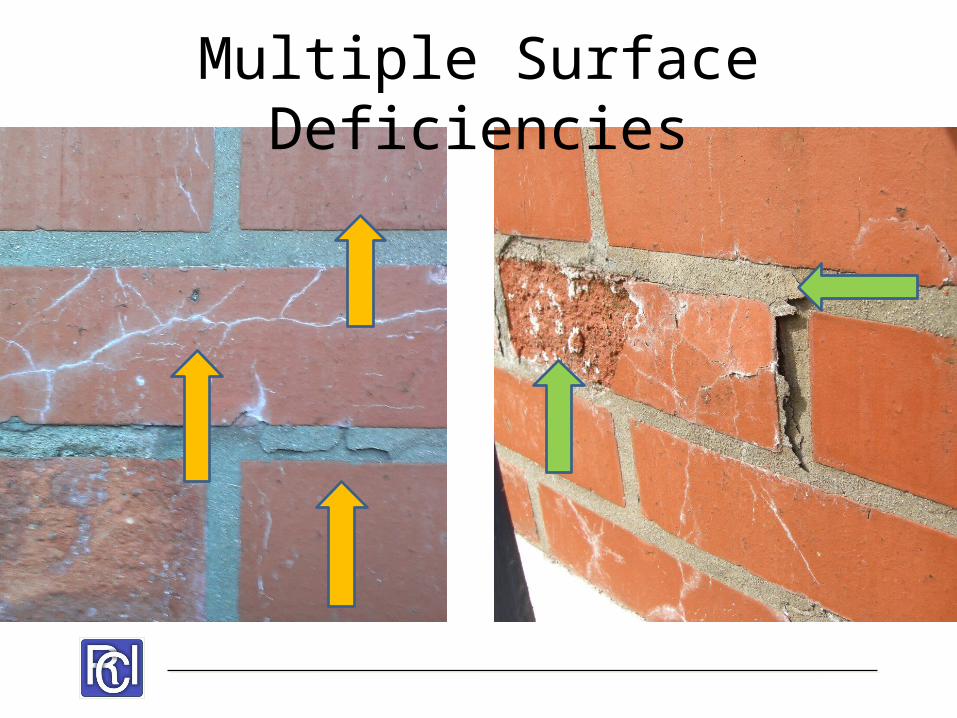
Multiple Surface Deficiencies
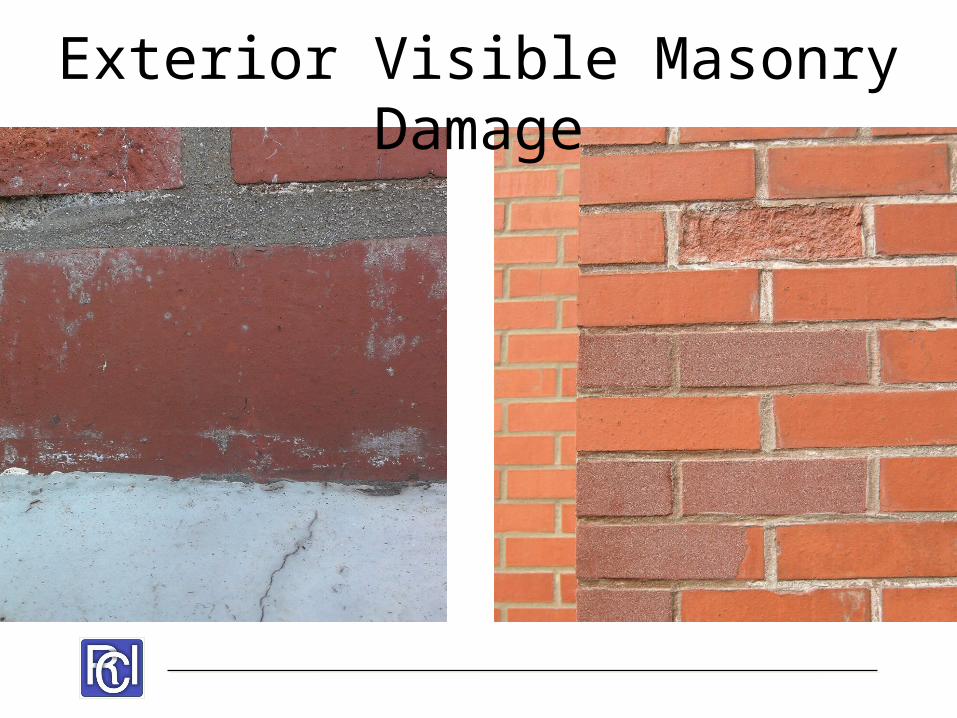
Exterior Visible Masonry Damage
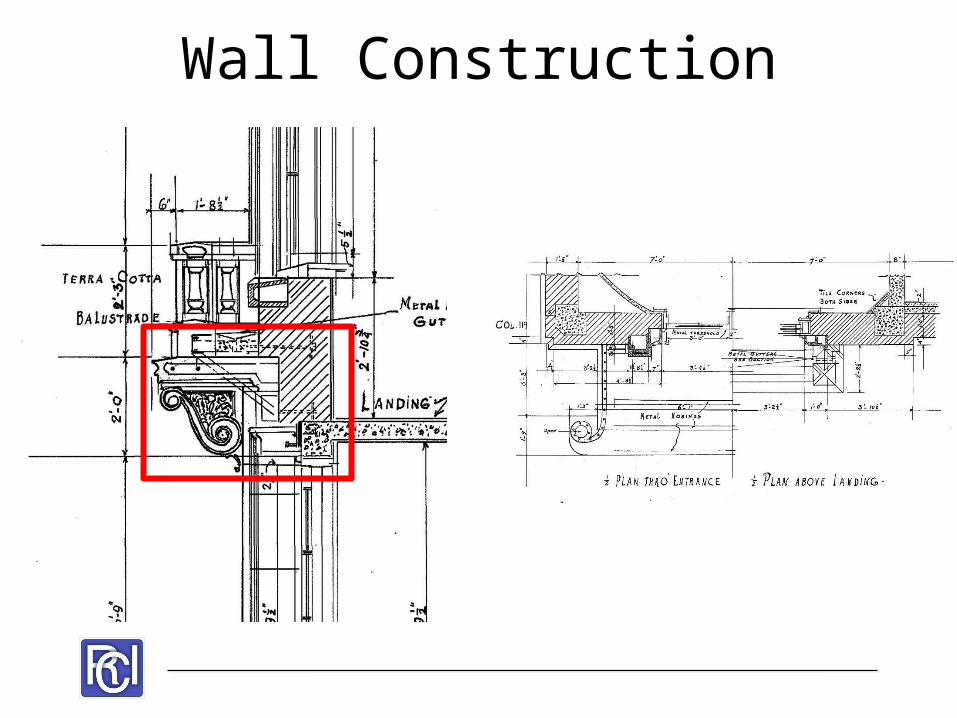
Historic Document Review:Wall Construction
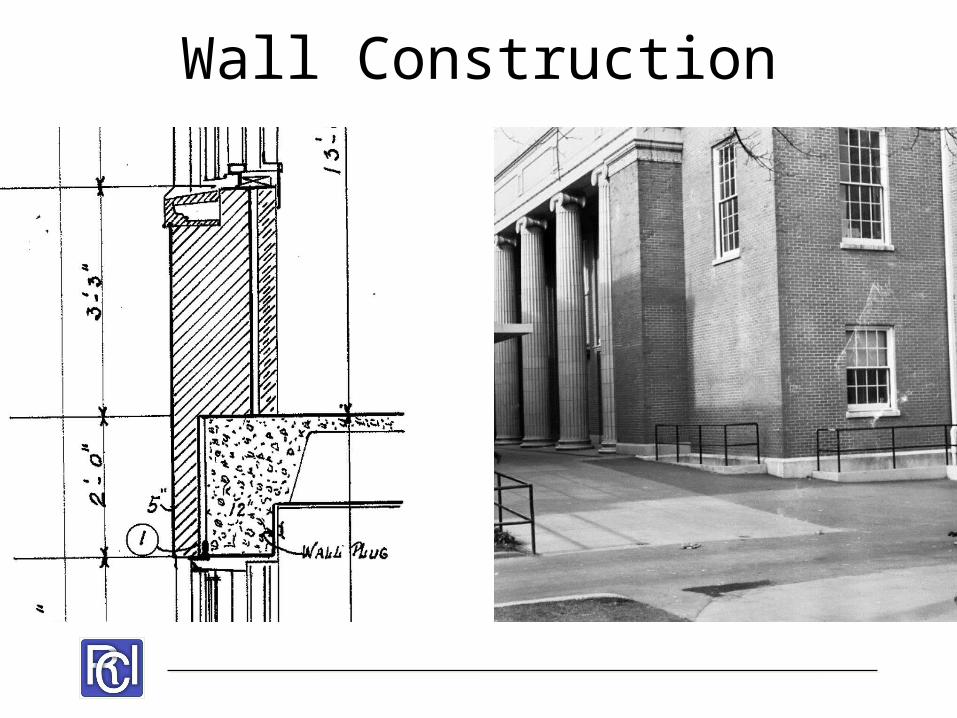
Wall Construction
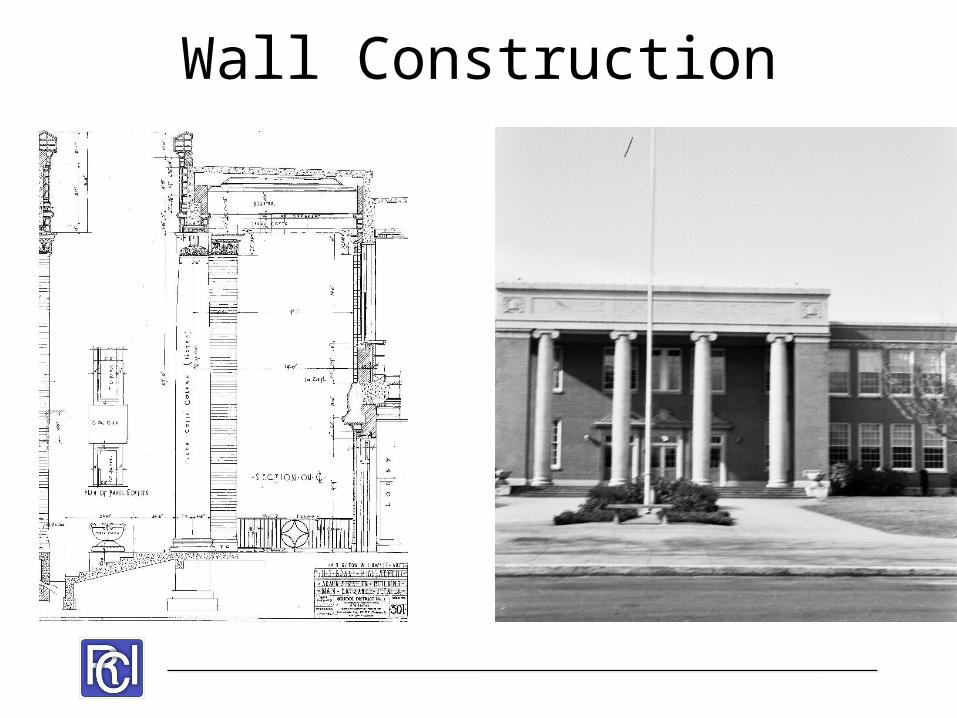
Wall Construction
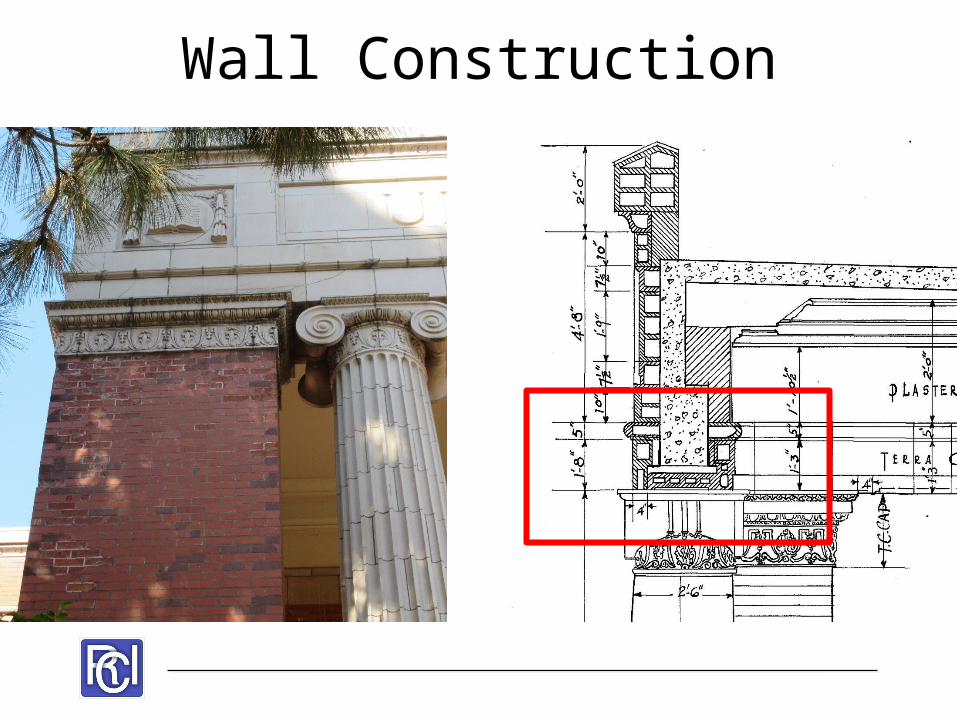
Wall Construction
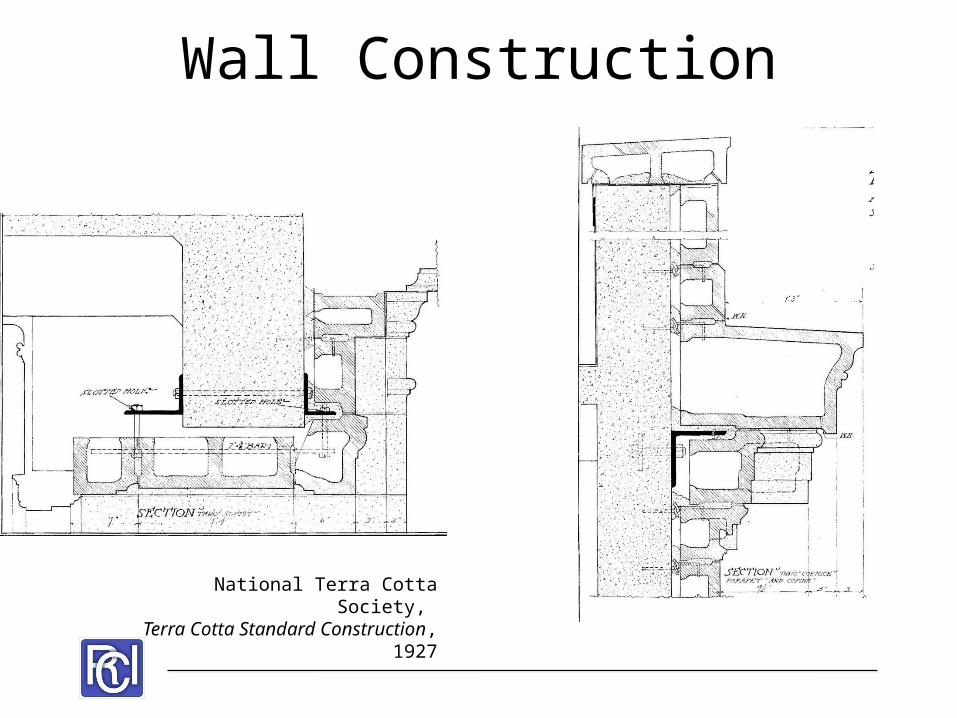
Wall Construction
National Terra Cotta Society, Terra Cotta Standard Construction,
1927
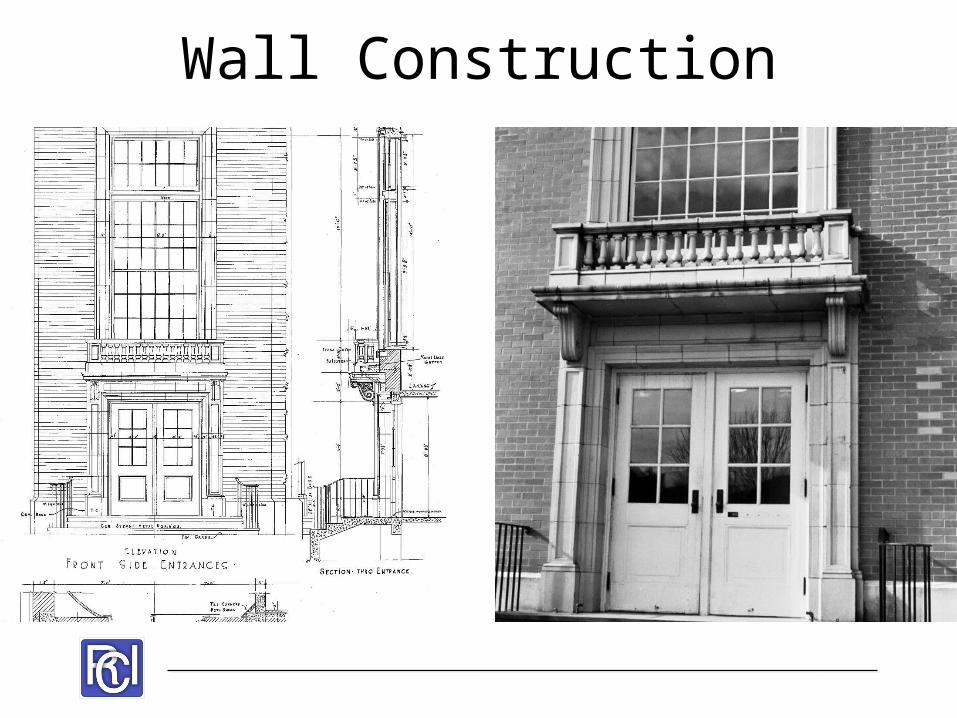
Wall Construction
Wall Construction
Field Testing
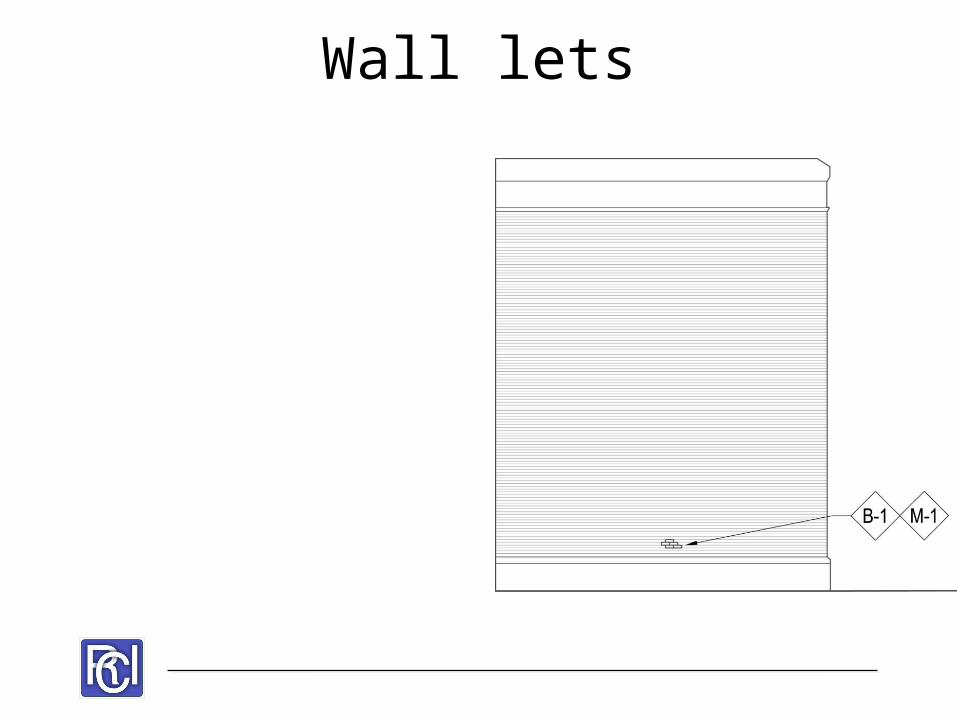
Wall lets
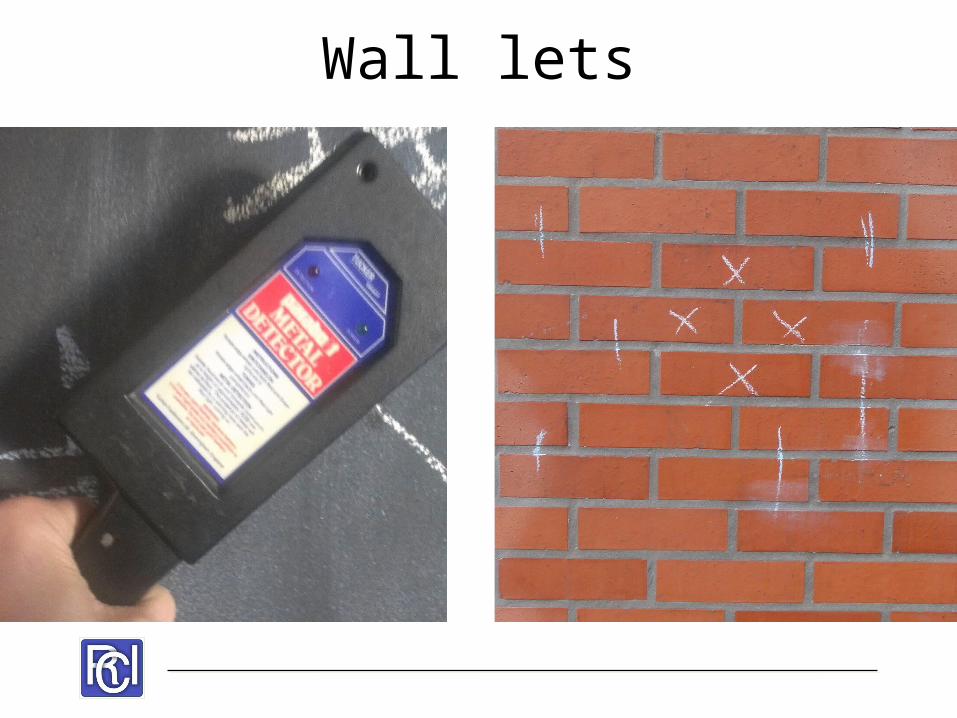
Wall lets
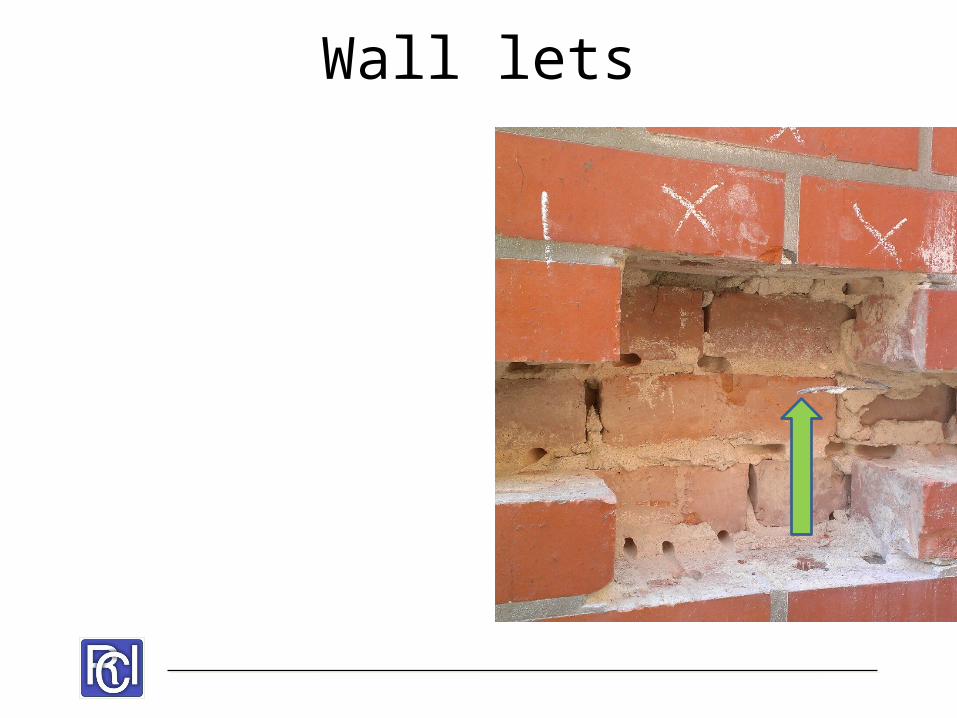
Wall lets
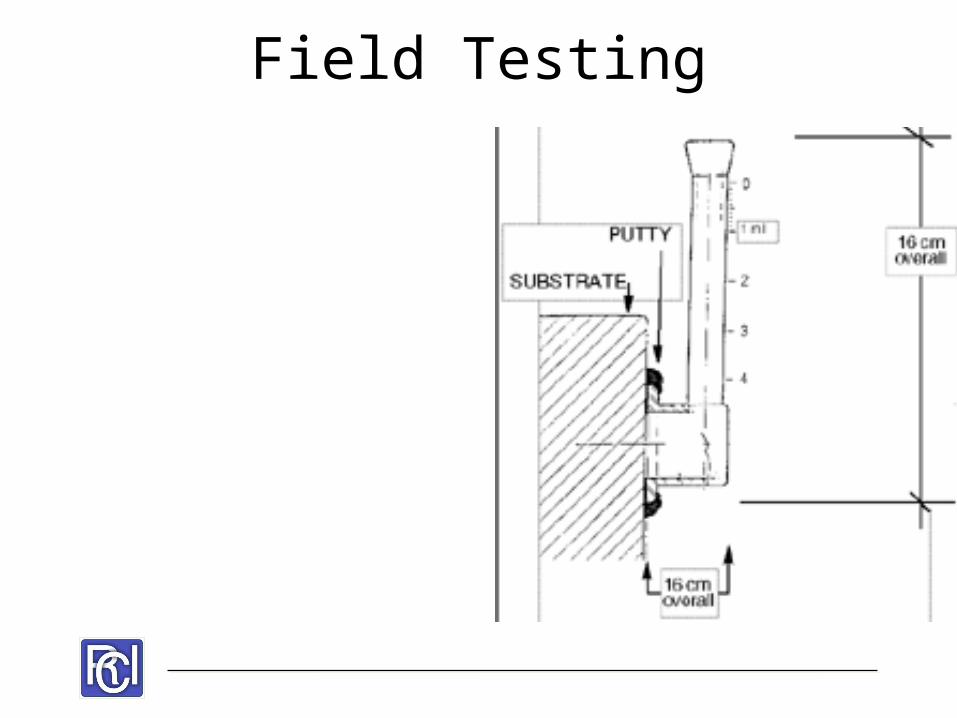
Field Testing
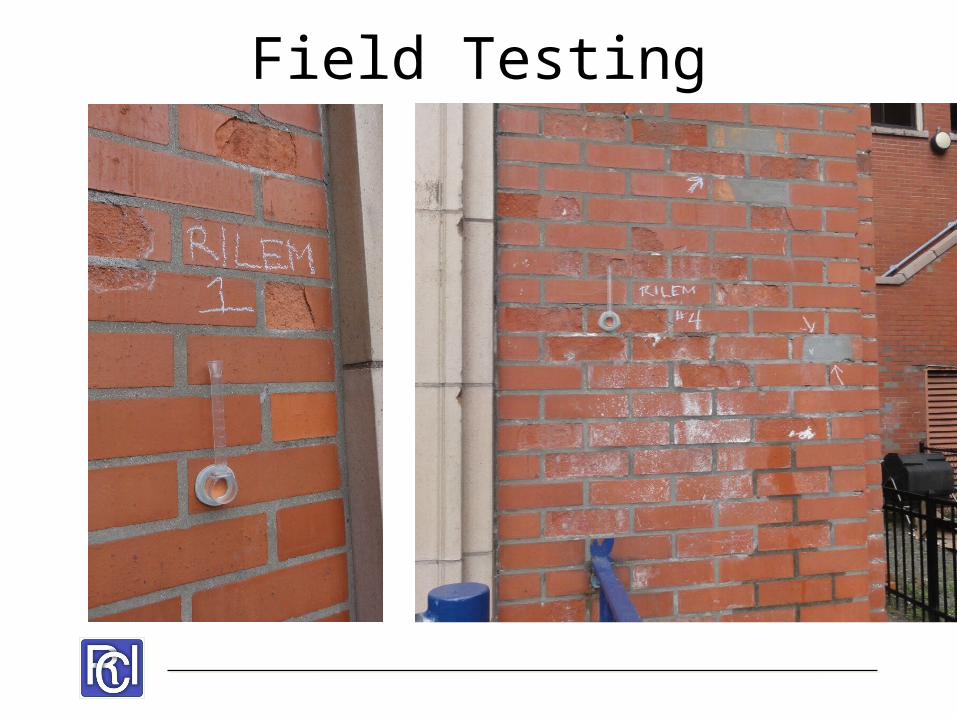
Field Testing
Lab Testing
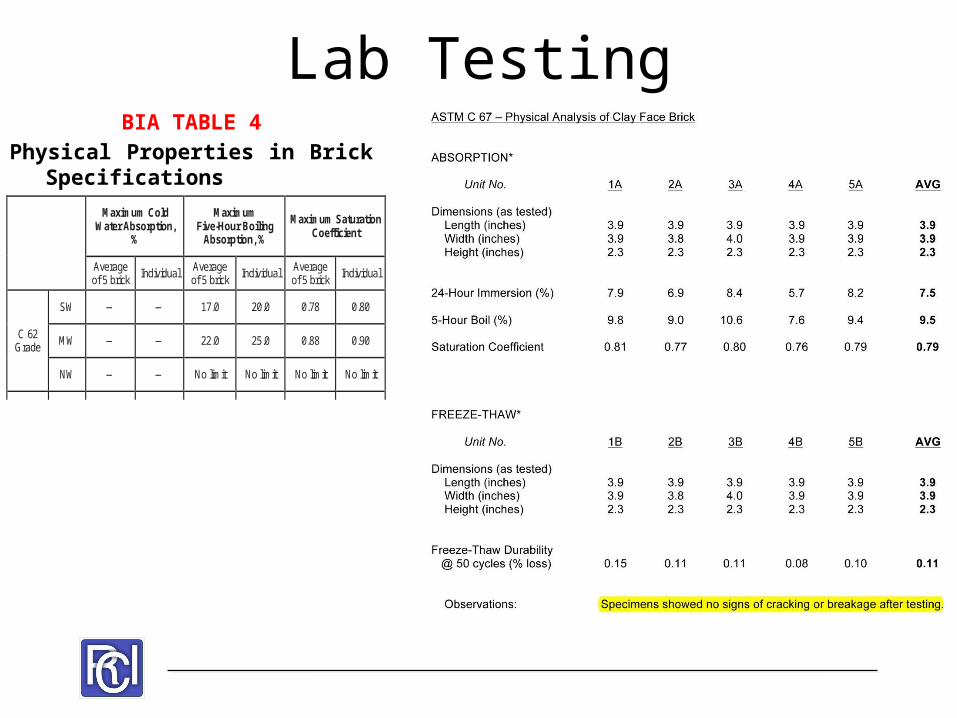
BIA TABLE 4Physical Properties in Brick Specifications
Maximum Cold
Water Absorption, %
Maximum
Five-Hour Boiling Absorption, %
Maximum Saturation
Coefficient
Average of 5 brick
Individual Average
of 5 brick
Individual Average
of 5 brick
Individual
C 62 Grade
SW
—
—
17.0
20.0
0.78
0.80
MW
—
—
22.0
25.0
0.88
0.90
NW
—
—
No limit
No limit
No limit
No limit
Lab Testing
Lab Testing
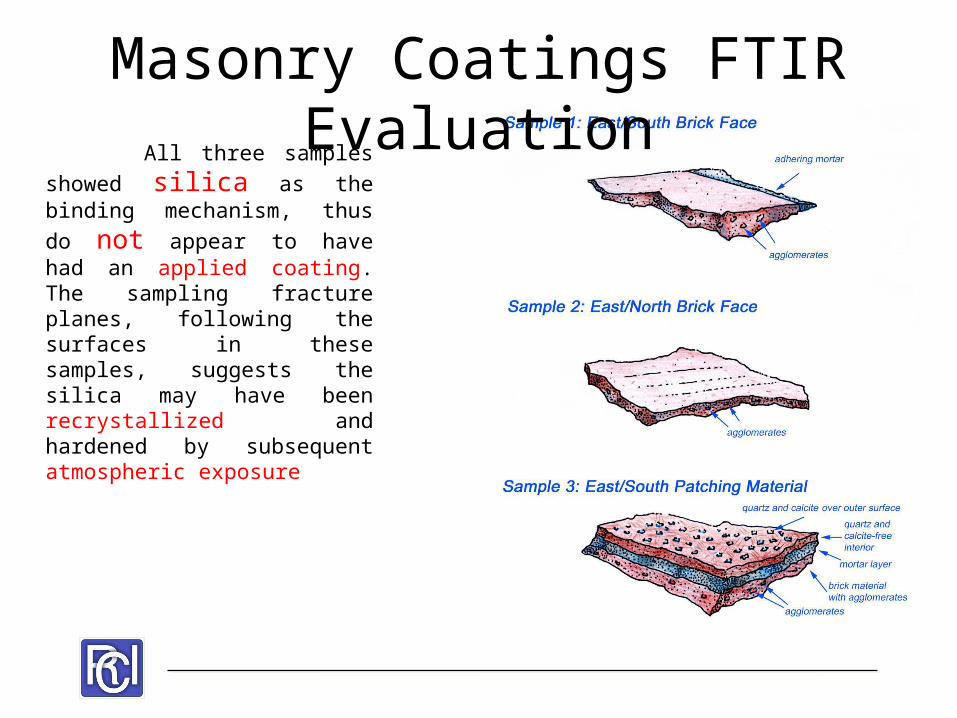
All three samples showed silica as the binding mechanism, thus do not appear to have had an applied coating. The sampling fracture planes, following the surfaces in these samples, suggests the silica may have been recrystallized and hardened by subsequent atmospheric exposure
Masonry Coatings FTIR Evaluation
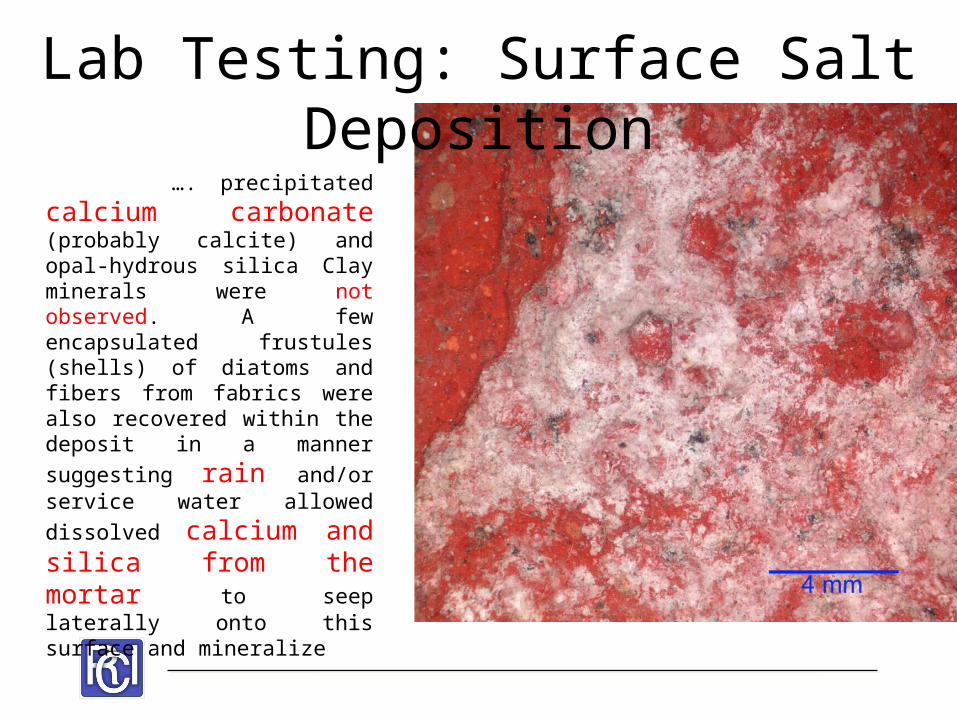
…. precipitated calcium carbonate (probably calcite) and opal-hydrous silica Clay minerals were not observed. A few encapsulated frustules (shells) of diatoms and fibers from fabrics were also recovered within the deposit in a manner suggesting rain and/or service water allowed dissolved calcium and silica from the mortar to seep laterally onto this surface and mineralize
Lab Testing: Surface Salt Deposition
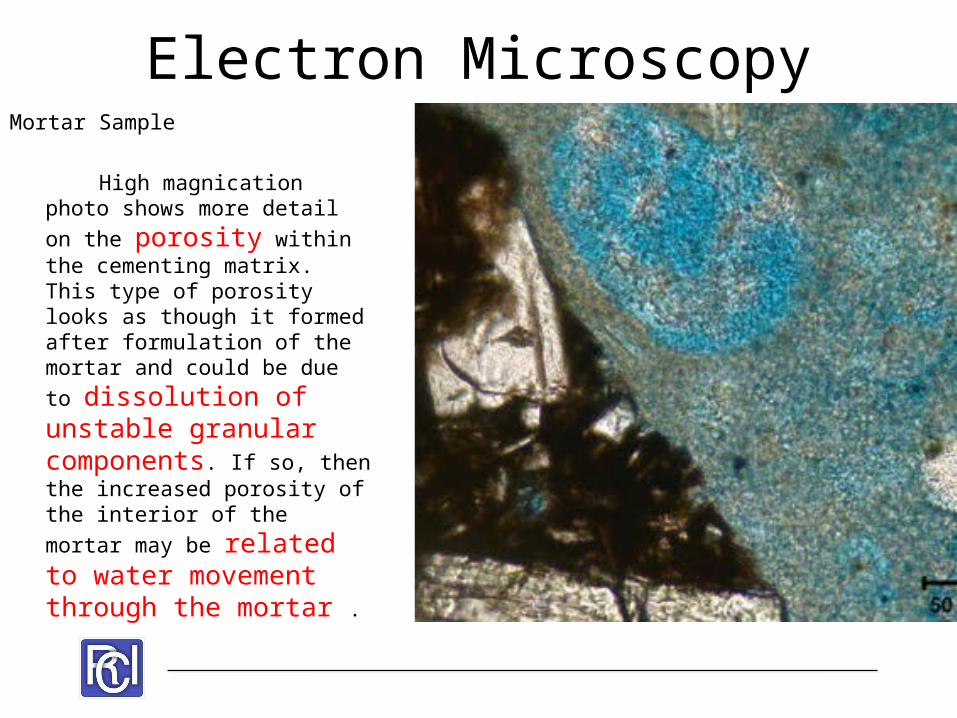
Mortar Sample
High magnication photo shows more detail on the porosity within the cementing matrix. This type of porosity looks as though it formed after formulation of the mortar and could be due to dissolution of unstable granular components. If so, then the increased porosity of the interior of the mortar may be related to water movement through the mortar .
Electron Microscopy
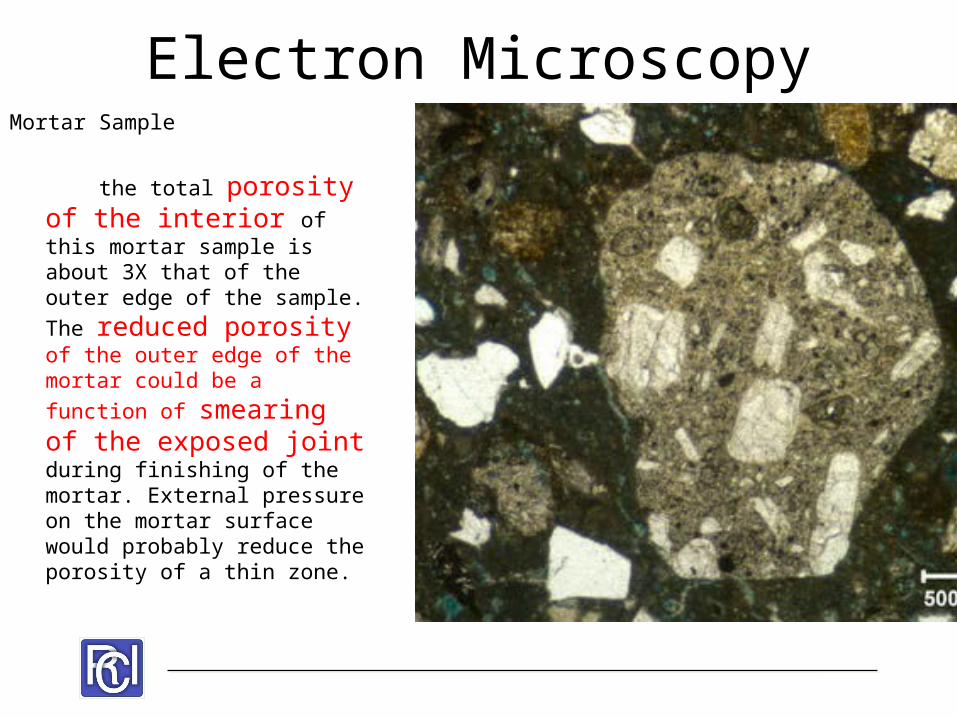
Mortar Sample
the total porosity of the interior of this mortar sample is about 3X that of the outer edge of the sample. The reduced porosity of the outer edge of the mortar could be a function of smearing of the exposed joint during finishing of the mortar. External pressure on the mortar surface would probably reduce the porosity of a thin zone.
Electron Microscopy
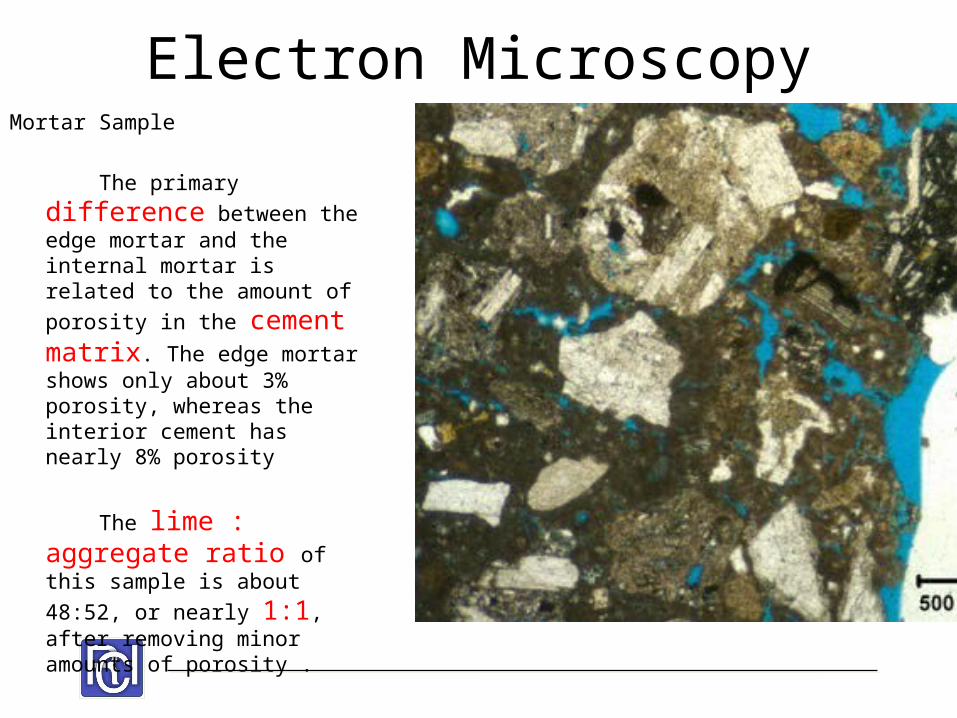
Mortar Sample
The primary difference between the edge mortar and the internal mortar is related to the amount of porosity in the cement matrix. The edge mortar shows only about 3% porosity, whereas the interior cement has nearly 8% porosity
The lime : aggregate ratio of this sample is about 48:52, or nearly 1:1, after removing minor amounts of porosity .
Electron Microscopy
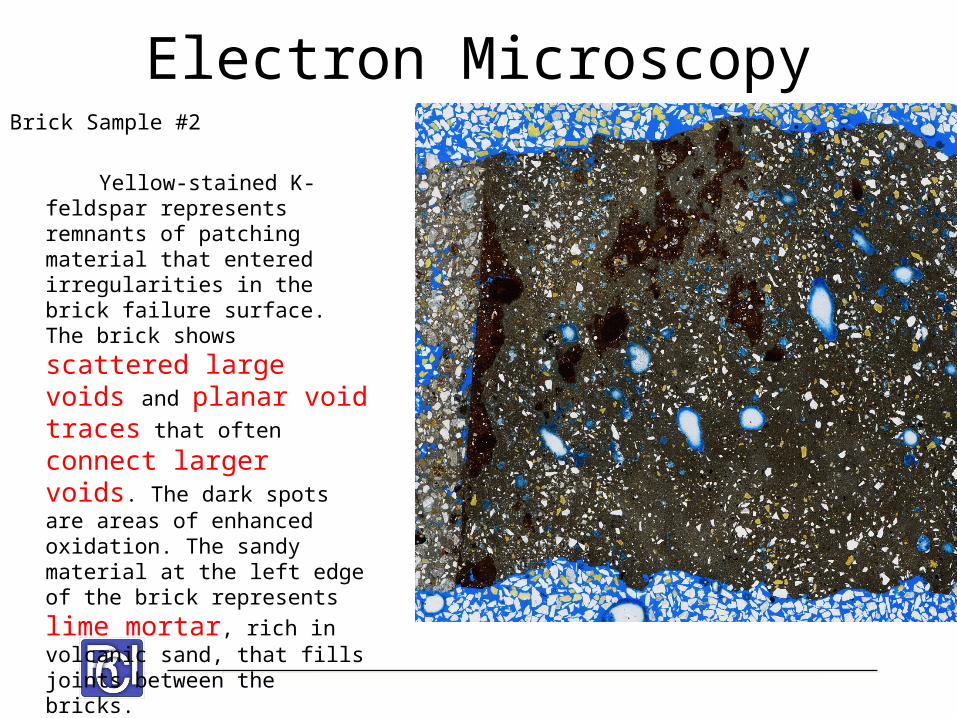
Brick Sample #2
Yellow-stained K-feldspar represents remnants of patching material that entered irregularities in the brick failure surface. The brick shows scattered large voids and planar void traces that often connect larger voids. The dark spots are areas of enhanced oxidation. The sandy material at the left edge of the brick represents lime mortar, rich in volcanic sand, that fills joints between the bricks.
Electron Microscopy
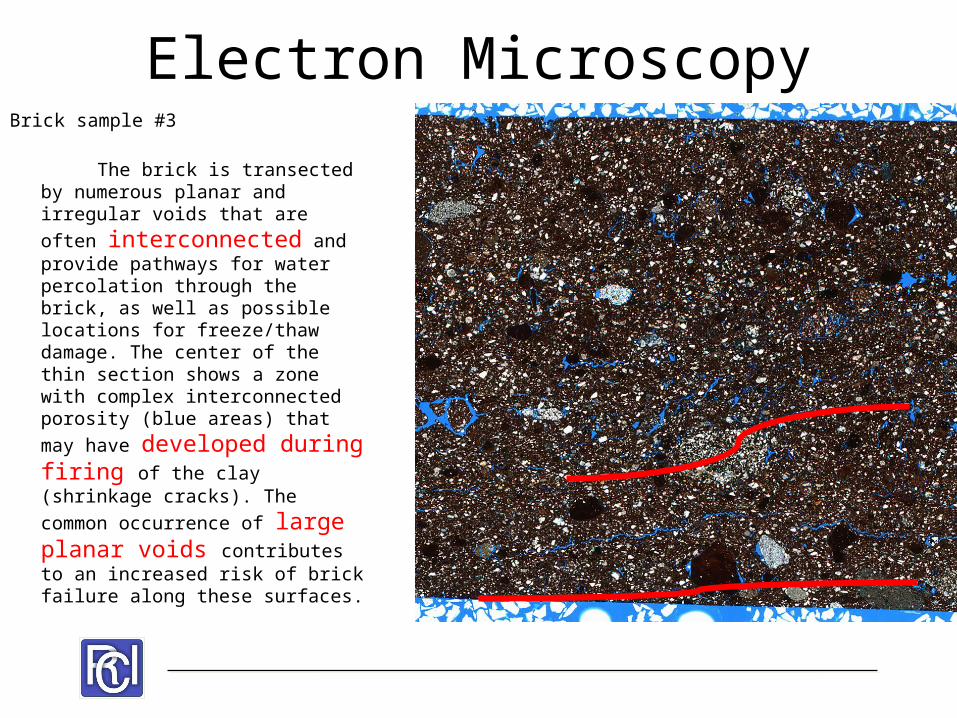
Electron MicroscopyBrick sample #3
The brick is transected by numerous planar and irregular voids that are often interconnected and provide pathways for water percolation through the brick, as well as possible locations for freeze/thaw damage. The center of the thin section shows a zone with complex interconnected porosity (blue areas) that may have developed during firing of the clay (shrinkage cracks). The common occurrence of large planar voids contributes to an increased risk of brick failure along these surfaces.
Conclusions
1. Failure mechanism inherent in manufacturing process. Likely due to poor bonding of clay during extrusion.
2. Low IRA is good and due to small diameter capillaries within brick. However, there is a correlation between small diameter capillary and susceptibility to expansion failures.
3. Salts in cement based mortars are leaching into the masonry over long periods of time. Upon drying, expansion of the salts within capillaries causing excessive force.
4. Some micro-climate freeze thaw may be occurring

Next Steps
Recommendations
1. Control water2. 100% repointing with lime based mortar3. Replace all failed brick units4. No sealers – due to high maintenance requirement5. Further invasive openings at structural steel locations
Key Points
• Use your knowledge and ALL the visual clues• AVOID leaping to a conclusion• Develop THEORIES for the damage• Systematically TEST the theories• Conduct FIELD evaluation• Conduct LAB tests• Are the RESULTS what you expected• It takes TIME
Thank You
Peter R. Meijer, AIAPeter Meijer Architect, PC
Recommended