8/20/2019 WB - India Discom Report - Feb15
http://slidepdf.com/reader/full/wb-india-discom-report-feb15 1/255
More Power to IndiaThe Challenge of Electricity Distribution
Sheoli Pargal and Sudeshna Ghosh Banerjee
D I R E C T I O N S I N D E V E L O P M E N T
Energy and Mining
P u b l i c
D i s c l o s u r e A u t h o r i z e d
P u b l i c D i s c l o s u r
e A u t h o r i z e d
P u b l i c D i s c l o s u r e A u t h o
r i z e d
P u b l i c D
i s c l o s u r e A u t h o r i z e d
P u b l i c
D i s c l o s u r e A u t h o r i z e d
P u b l i c D i s c l o s u r
e A u t h o r i z e d
P u b l i c D i s c l o s u r e A u t h o
r i z e d
P u b l i c D
i s c l o s u r e A u t h o r i z e d
88906

8/20/2019 WB - India Discom Report - Feb15
http://slidepdf.com/reader/full/wb-india-discom-report-feb15 2/255
8/20/2019 WB - India Discom Report - Feb15
http://slidepdf.com/reader/full/wb-india-discom-report-feb15 3/255
More Power to India

8/20/2019 WB - India Discom Report - Feb15
http://slidepdf.com/reader/full/wb-india-discom-report-feb15 4/255
8/20/2019 WB - India Discom Report - Feb15
http://slidepdf.com/reader/full/wb-india-discom-report-feb15 5/255
D I R E C T I O N S I N D E V E L O P M E N T
Energy and Mining
More Power to IndiaThe Challenge of Electricity Distribution
Sheoli Pargal and Sudeshna Ghosh Banerjee
8/20/2019 WB - India Discom Report - Feb15
http://slidepdf.com/reader/full/wb-india-discom-report-feb15 6/255
More Power to India • http://dx.doi.org/10.1596/978-1-4648-0233-1
© 2014 International Bank for Reconstruction and Development / The World Bank 1818 H Street NW, Washington DC 20433Telephone: 202-473-1000; Internet: www.worldbank.org
Some rights reserved
1 2 3 4 17 16 15 14
This work is a product of the staff of The World Bank with external contributions. The findings, interpreta-tions, and conclusions expressed in this work do not necessarily reflect the views of The World Bank, itsBoard of Executive Directors, or the governments they represent. The World Bank does not guarantee theaccuracy of the data included in this work. The boundaries, colors, denominations, and other informationshown on any map in this work do not imply any judgment on the part of The World Bank concerning thelegal status of any territory or the endorsement or acceptance of such boundaries.
Nothing herein shall constitute or be considered to be a limitation upon or waiver of the privileges andimmunities of The World Bank, all of which are specifically reserved. Nothing herein shall constitute or beconsidered to be a limitation upon or waiver of the privileges and immunities of The World Bank, all ofwhich are specifically reserved.
Rights and Permissions
This work is available under the Creative Commons Attribution 3.0 IGO license (CC BY 3.0 IGO) http://creativecommons.org/licenses/by/3.0/igo. Under the Creative Commons Attribution license, you are free tocopy, distribute, transmit, and adapt this work, including for commercial purposes, under the followingconditions:
Attribution—Please cite the work as follows: Pargal, Sheoli, and Sudeshna Ghosh Banerjee. 2014. MorePower to India: The Challenge of Electricity Distribution. Directions in Development . Washington, DC:
World Bank. doi: 10.1596/978-1-4648-0233-1. License: Creative Commons Attribution CC BY 3.0 IGO.
Translations—If you create a translation of this work, please add the following disclaimer along with theattribution: This translation was not created by The World Bank and should not be considered an officialWorld Bank translation. The World Bank shall not be liable for any content or error in this translation.
Third-party content—The World Bank does not necessarily own each component of the content containedwithin the work. The World Bank therefore does not warrant that the use of any third-party-ownedindividual component or part contained in the work will not infringe on the rights of those third parties.The risk of claims resulting from such infringement rests solely with you. If you wish to re-use a com-ponent of the work, it is your responsibility to determine whether permission is needed for that re-useand to obtain permission from the copyright owner. Examples of components can include, but are notlimited to, tables, figures, or images.
All queries on rights and licenses should be addressed to the Publishing and Knowledge Division, The World Bank, 1818 H Street NW, Washington, DC 20433, USA; fax: 202-522-2625; e-mail: [email protected].
ISBN (paper): 978-1-4648-0233-1ISBN (electronic): 978-1-4648-0234-8DOI: 10.1596/ 978-1-4648-0233-1
Cover photo: NOAA. This photograph is in the public domain and available for public use. Please creditNOAA.
Library of Congress Cataloging-in-Publication Data has been requested.
8/20/2019 WB - India Discom Report - Feb15
http://slidepdf.com/reader/full/wb-india-discom-report-feb15 7/255
vMore Power to India • http://dx.doi.org/10.1596/978-1-4648-0233-1
Foreword xiii Acknowledgments xv
About the Authors xvii Abbreviations xix
Overview 1
Evolution of Policies and Institutions 1
Impressive Achievements in Many Dimensions 2
The Agenda for Addressing Distribution Performance
Must Now Be a Priority 3
Analyzing Operational and Financial Performance of
Distribution 5
The Sector Operating Environment Has Contributed toDiscom Financial Difficulties 6
Institutional Factors and Governance Shortcomings
Are Other Contributors 8
Way Forward: Priority Areas for Action 11
Notes 14
References 17
Introduction 19
Note 20
References 20
Chapter 1 Evolution of Policies and Institutions 23
Policy Space Uneventful through 1991 25
Sector Restructuring and Independent Regulation
in the 1990s 26
The Lead-Up to the Electricity Act of 2003 27
Notes 31
References 32
Contents

8/20/2019 WB - India Discom Report - Feb15
http://slidepdf.com/reader/full/wb-india-discom-report-feb15 8/255
vi Contents
More Power to India • http://dx.doi.org/10.1596/978-1-4648-0233-1
Chapter 2 Impressive Achievements in Many Dimensions 33
A Tripling of Generation Capacity 33
Progress toward a Clean Energy Future 35
Creating a National Grid 37Developing Competitive Power Markets 40
Competitive Power Procurement 42
Massive Expansion of Access 45
Promising Examples in Distribution 48
Notes 51
References 52
Chapter 3 Deterioration of Distribution Finances 55
State Subsidies to the Sector Impose a Heavy
Opportunity Cost 55Rising Power Sector Debt Has Escalated the
Risk of Financial Contagion 61
The Central Government’s Response to the
Risk of Contagion 65
Projected Sector Finances at the End of the
12th Five-Year Plan 66
Notes 69
References 69
Chapter 4 Drivers of Losses 71
Rising Gap between Cost and Revenue 71
Inefficiencies in Distribution and Generation 74
Decomposition of Utility Losses 76
Tariff Performance on Equity 82
Benchmarking Utilities on Financial and
Operational Indicators 88
Notes 95
References 96
Chapter 5 Implementing Sector Reforms 97
Implementation of Reforms Index 97
Sector Outcomes Index 101
Relationship between Implementation of Reforms and
Sector Outcomes 103
Note 104
Reference 104
Chapter 6 The Role of Governance and Institutional Factors 105
Vertical Restructuring: Unbundling State ElectricityBoards 106
Corporate Governance 107

8/20/2019 WB - India Discom Report - Feb15
http://slidepdf.com/reader/full/wb-india-discom-report-feb15 9/255
Contents vii
More Power to India • http://dx.doi.org/10.1596/978-1-4648-0233-1
Regulatory Governance 115
Central Mandates 123
Notes 130
Bibliography 131
Chapter 7 Moving Toward Efficient and Effective Service Delivery 133
Align Stakeholder Incentives 134
Strengthen Regulatory Governance and Processes 134
Implement Key Regulatory Mandates 136
Improve Corporate Governance of State Utilities 137
Promote Responsible Lending to the Sector 138
Ensure Availability of High-Quality, Updated Data 138
Reinvigorate Planning and Coordination Mechanisms 139
Explore Different Models to Improve Distribution 140Promote Electrification in a Financially Responsible
Manner through Different Delivery Models 141
Notes 142
References 144
Appendix A Advantages of the Point of Connection Method in
Assessing Transmission Charges 145
References 147
Appendix B Measures to Overcome Barriers in Integrating Renewable
Energy into the Electricity Grid 149
References 151
Appendix C Considerations for Attracting Private Investment in
Hydropower 153
Note 155
References 155
Appendix D Experience with Multiple Transmission Owners 157References 161
Appendix E Maharashtra State Electricity Transmission
Company’s Strategic Alliance Model 163
Reference 165
Appendix F International Experience in Private Sector Participation
in Transmission and Distribution 167
Selected Country Experiences 168
Key Findings 170Notes 172
References 172
8/20/2019 WB - India Discom Report - Feb15
http://slidepdf.com/reader/full/wb-india-discom-report-feb15 10/255
viii Contents
More Power to India • http://dx.doi.org/10.1596/978-1-4648-0233-1
Appendix G International Experience in Open Access 173
Country Experiences 173
Key Considerations in Designing OA 175
Implementation Issues 176References 177
Appendix H Coal Sector Challenges and the Power Sector 179
International Experience with Coal for
Power Generation 184
References 188
Appendix I Best Practices in Electricity Theft Reduction 191
Notes 194
Reference 194
Appendix J Regulatory Assets: The Delhi Case 195
Notes 197
References 197
Appendix K A Strategic Model to Improve Distribution
Performance—Enersis in Chile 199
Note 201
Reference 201
Appendix L Separation of Carriage and Content in
Distribution—Potential Benefits and International
Experience 203
India 203
New Zealand 205
The United States 208
European Union 208
Concluding Observations 210
Notes 211References 212
Appendix M Productive Use of Electricity—Experience from
Indonesia and Peru 213
Reference 214
Appendix N Regression Results—Governance and Performance 215
Appendix O Overview of the India Power Sector Review Databases 219
Bibliography 227
Appendix P Background Papers 229
8/20/2019 WB - India Discom Report - Feb15
http://slidepdf.com/reader/full/wb-india-discom-report-feb15 11/255
Contents ix
More Power to India • http://dx.doi.org/10.1596/978-1-4648-0233-1
Boxes
1.1 Reform Areas of the Electricity Act of 2003 (and Subsequent
Policies): Objectives and Mandates 28
2.1 The Bhiwandi and Agra Distribution Franchises: A Success Story 494.1 Improving Rural Supply: Rural Feeder Segregation in Indian States 83
4.2 Kerala—A Successful State Electricity Board 91
4.3 Design of a State Performance Index Using the Analytic
Hierarchy Process 93
6.1 Good Practices in Corporate Governance for State Utilities 108
6.2 Corporate Governance in West Bengal 112
6.3 Organizational Transformation and a Turnaround in
Performance in Gujarat 113
6.4 Involving Consumers as Stakeholders: Selected State Electricity
Regulatory Commission Experiences 1196.5 Impact of Metering on Operational and Financial Efficiency
in Rural Haryana 129
Figures
1.1 Impact of Inadequate and Unreliable Electricity on Firms 24
1.2 Electricity Sector Policies and Schemes over Time 25
1.3 Timeline of Sector Unbundling and Establishment of
Regulatory Commissions 27
1.4 Power Sector Structure by State, 2013 30
2.1 Generation Capacity 342.2 Captive Generation 35
2.3 Renewable Energy Capacity 36
2.4 Plan-Wise Expansion of Transmission Lines 38
2.5 Industry Structure after 2003 40
2.6 Short-Term Market for Electricity 41
2.7 Number of People Gaining Access, 2000–10 46
2.8 Growth of Access and Population, 2000–10 46
2.9 Affordability and Reliability of Electricity 47
2.10 AT&C Losses, 2003/04–2010/11—Best and WorstPerformers by State 48
3.1 Accumulated Losses by Segment, 2003–11 56
3.2 Accumulated Losses by State, 2003–11 57
3.3 Annual Profit or Loss after Tax, 2003–11 58
3.4 Profit/Loss after Tax and Subsidies Booked, 2011 59
3.5 Subsidies Booked and Received, 2003–11 60
3.6 State Support to the Power Sector, 2011 61
3.7 Debt Owed by the Power Sector 62
3.8 Debt Owed by State Utilities, 2011 63
3.9 Outstanding Loans among Subsectors and by Creditors 643.10 Funded Loans to the Power Sector as Share of Net Worth
of 13 Major Banks, 2010 65
8/20/2019 WB - India Discom Report - Feb15
http://slidepdf.com/reader/full/wb-india-discom-report-feb15 12/255
x Contents
More Power to India • http://dx.doi.org/10.1596/978-1-4648-0233-1
3.11 Projected Change in Gap without Subsidy, 2011–17 67
3.12 Gap with and without Subsidy, 2013–17 68
4.1 Average Cost and Average Revenue, 2003–11 72
4.2 Gap between Average Cost and Average Revenue, 2011 724.3 Composition of Total Cost 73
4.4 Power Purchase Efficiency Scores Based on Stochastic
Frontier Analysis 74
4.5 Thermal Power Plant Status by State 75
4.6 Decomposition of Losses, 2003 and 2011 76
4.7 Decomposition of Losses, as Share of Revenue 77
4.8 Losses from Underpricing 78
4.9 Tariff Performance 79
4.10 Losses from Distribution 80
4.11 Losses from Collection 814.12 Effective Tariffs by Consumer Group, 2012 82
4.13 Consumer Mix Overview in 1991, 2001, and 2011 85
4.14 Subsidy Prevalence by State, 2010 86
4.15 Household Subsidy Coverage, 2010 87
4.16 Subsidies Leaking to Households above the Poverty Line, 2010 87
4.17 Evolution of Performance of Top and Bottom Discoms,
2003/04–2010/11 89
4.18 Best and Worst Performing States in the Analytic
Hierarchy Process Index, 2006–10 94
5.1 State Performance on Reform Areas 1005.2 Progress on Reform Implementation—Top Five and
Bottom Five States by Reform Area 100
5.3 State Progress on Expected Outcomes 102
5.4 State Performance on Sector Outcomes Subindexes 103
5.5 Relationship between Reform Implementation and Outcomes 104
6.1 Basic Index: Share of Utilities in Compliance with Key
Good Practices 110
6.2 Implementation of Key Regulatory Mandates Index Scores 118
6.3 Institutional Design Index Scores 1206.4 Transmission Company Costs Filed and Approved, 2010/11 122
6.5 Amount Disbursed, Sanctioned Cost, and Estimated
Final Cost, 2013 124
6.6 Financial Burden of Serving Rural Consumers, 2010 126
6.7 Implementation of Technical Solutions 128
H.1 Incremental Coal Requirement and Coal Production,
2007/08–2011/12 180
H.2 Proposed Coal Production and Linkages Granted 180
H.3 Captive Coal Blocks, Targets and Actual Production 182
L.1 Breakdown of New Zealanders’ Annual Expenditureon Electricity 207

8/20/2019 WB - India Discom Report - Feb15
http://slidepdf.com/reader/full/wb-india-discom-report-feb15 13/255
Contents xi
More Power to India • http://dx.doi.org/10.1596/978-1-4648-0233-1
Tables
2.1 National Solar Mission Targets, 2010–22 44
B2.1.1 Progress in Bhiwandi’s Power Sector over 2006–11 49
3.1 Status and Projections of Candidate States for FinancialRestructuring 68
4.1 Tariff Performance and Utility Losses, 2011 81
5.1 Implementation of Reforms Index 98
5.2 Sector Outcomes Index 101
6.1 The Basic Corporate Governance Index 109
6.2 Characteristics of Top Five Utilities Covered in the
Detailed Index 111
6.3 Correlation between Corporate Governance Variables and
Performance Measures 114
6.4 Indexes of Implementation of Key Regulatory Mandates andInstitutional Design 116
B6.5.1 Savings Achieved by Pilot Project in Singhran and
Chirod Villages 129
D.1 International Experiences with Market and Regulatory
Organizations with Multiple Grid Owners 158
H.1 Environmental Clearances and Increases in Production 181
H.2 Coal Production, Targets and Actual, 2011/12 182
H.3 Coal Production, Market Structure, and Regulation: Some
International Examples 185
N.1 Regression of Utility Performance on State, Utility,
and Corporate Governance Variables, 2010 216
N.2 Regression of Utility Performance on State, Utility,
and Corporate Governance Variables, 2011 217
N.3 Regression of Utility Performance on State, Utility,
and Regulatory Governance Variables, 2010 218
N.4 Regression of Utility Performance on State, Utility,
and Regulatory Governance Variables, 2011 218
O.1 Summary of India Power Sector Review Data 220
O.2 Utility-Level Data: Financial and Operational Performance 221O.3 Utility-Level Data: Corporate Governance 223
O.4 State-Level Data: Market Structure 224
O.5 State-Level Data: Rural Electrification and RGGVY 224
O.6 State-Level Data: Tariff and Subsidiaries 225
O.7 State-Level Data: Regulatory Governance 225

8/20/2019 WB - India Discom Report - Feb15
http://slidepdf.com/reader/full/wb-india-discom-report-feb15 14/255

8/20/2019 WB - India Discom Report - Feb15
http://slidepdf.com/reader/full/wb-india-discom-report-feb15 15/255
xiiiMore Power to India • http://dx.doi.org/10.1596/978-1-4648-0233-1
Foreword
Two decades after the liberalization of India’s economy and a decade after the
passage of the forward-looking Electricity Act of 2003, how has India’s power
sector done? This World Bank review of India’s power sector assesses progress inimplementing the government’s reform agenda and examines the sector along
different dimensions—achievements in access, financial and operational perfor-
mance of utilities, governance, private participation, and coverage and targeting
of domestic user subsidies.
The sector has come a long way, as shown in this report, with significant
achievements on many fronts: a tripling of conventional generation capacity with
active private participation, renewables increasing from zero to 12 percent of the
energy mix, the development of a state-of-the-art grid linking the entire country,
the transformation of market structure, and the extension of service to more
than 250 million users. Several states, programs, and utilities could indeed bebeacons for others and are worthy of emulation, including homegrown models
of distribution.
Overall, however, the potential of the sector remains unrealized. The lack of
reliable power is a leading concern for industry and a potential constraint to
growth. Annual per capita consumption is low by global standards and 300 million
people lack electricity while the peak deficit is more than 10 percent. Sector
finances are weak, with distribution utilities being the main contributors to sector
financial losses. Utilities in several states have taken on significant commercial
debt to finance their operation, which has led to concerns about poor power sec-
tor performance spilling over into the financial sector and broader economy. State
electricity boards and distribution utilities also continue to require government
support to stay in business, including transfers. This imposes a high opportunity
cost on the economy by preempting other development spending. A key message
of the report is thus that the distribution segment, still largely government owned
and run, will require the sustained attention of the authorities if sector perfor-
mance is to improve.
Unlike 10 years ago, today stakeholders outside of government, specifically the
regulator and commercial financial institutions, critically affect the operating
environment and thus power utility performance. The incentives of these playersand the government (both as policy maker and as owner) need to be aligned
to support utility performance. At the same time many factors that constrain
8/20/2019 WB - India Discom Report - Feb15
http://slidepdf.com/reader/full/wb-india-discom-report-feb15 16/255
xiv Foreword
More Power to India • http://dx.doi.org/10.1596/978-1-4648-0233-1
performance are under the control of the utilities themselves—underpricing,
physical losses, and inefficiencies in bill collection—underlining the importance
of limiting the government’s role, strengthening regulatory governance, and bol-
stering competition so that utilities are both pushed to be efficient and permittedto run on commercial lines. This agenda has to be carried forward by the states,
facilitated by the central government through technical assistance, knowledge
transfer, public information campaigns, and financing. Support from the center
for pilots and experimentation with different models of service improvement,
leveraging India’s diversity and size, can be an important contribution. The
Electricity Act of 2003 and associated policies constitute an enabling policy and
regulatory framework for the sector’s development—the focus now must be on
implementation.
The World Bank stands ready to partner with India on this journey.
Philippe H. Le Houérou
Vice President, South Asia RegionThe World Bank

8/20/2019 WB - India Discom Report - Feb15
http://slidepdf.com/reader/full/wb-india-discom-report-feb15 17/255
xvMore Power to India • http://dx.doi.org/10.1596/978-1-4648-0233-1
Acknowledgments
The India Power Sector Review was carried out at the request of the Department
of Economic Affairs in the Ministry of Finance and the Planning Commission of
India. Led by Sheoli Pargal and Sudeshna Ghosh Banerjee, the team comprisedMohua Mukherjee, Kristy Mayer, Mani Khurana, Amrita Kundu, Pranav Vaidya,
and Bartley Higgins. Arsh Sharma and Joeri de Wit provided research, economet-
ric analysis, and presentational assistance. Shaukat Javed, Harriette Peters, and
Vinod Ghosh provided able administrative support. The work was supervised by
Jyoti Shukla and Salman Zaheer.
The team is grateful to Ashish Khanna, Rohit Mittal, Kavita Saraswat, and
Kwawu Gaba for discussions and constructive ideas. Crucial analysis, inputs, and
insights were provided by consulting teams at Deloitte Touche Tohmatsu India
Pvt. Ltd. (Shubhranshu Patnaik and Anujesh Dwivedi), Mercados Energy
Markets India Pvt. Ltd. (Anish De, Puneet Chitkara, Anvesha Paresh, KumarSanchit, and Debadrita Dhara), and, PricewaterhouseCoopers Pvt. Ltd. (Ashok
Varma, Debasis Mohapatra, and S. Johnny Edward). The team thanks the peer
reviewers Vivien Foster, Lucio Monari, Sameer Shukla, and Luis Andres, as well
as Ashok Lavasa (former Additional Secretary, Ministry of Power) and Sushanta
Chatterjee (Deputy Chief [Regulatory Affairs], Central Electricity Regulatory
Commission) for substantive comments.
Finally, the team appreciates the advice and suggestions of the Technical
Advisory Panel constituted for this task:
Ms. Jyoti Arora Joint Secretary, Ministry of Power
Mr. J.L. Bajaj Former Chairman, Uttar Pradesh Electricity Regulatory
Commission
Mr. Shantanu Dixit Coordinator, Prayas Energy Group
Mr. Rajat Misra Senior Vice President, SBI Capital Markets
Mr. Sunil Mitra Former Power Secretary, Government of West Bengal
Dr. M. Govinda Rao Director, National Institute of Public Finance and Policy
Mr. Anil Sardana Managing Director, Tata Power
The team gratefully acknowledges the financial support of the EnergySector Management Assistance Program (ESMAP), the South Asia Poverty

8/20/2019 WB - India Discom Report - Feb15
http://slidepdf.com/reader/full/wb-india-discom-report-feb15 18/255
xvi Acknowledgments
More Power to India • http://dx.doi.org/10.1596/978-1-4648-0233-1
and Social Impact Analysis (PSIA) Trust Fund, the Australian Agency for
International Development, and the Asia Sustainable and Alternative Energy
Program (ASTAE).
Bruce Ross-Larson, Jonathan Aspin, and Jack Harlow at CommunicationsDevelopment Incorporated edited this report.

8/20/2019 WB - India Discom Report - Feb15
http://slidepdf.com/reader/full/wb-india-discom-report-feb15 19/255
xviiMore Power to India • http://dx.doi.org/10.1596/978-1-4648-0233-1
About the Authors
Sheoli Pargal is an Economic Adviser in the World Bank’s South Asia Sustainable
Development unit. She has worked across infrastructure sectors on a range of
topics including regulation and governance, private sector participation, public-private partnerships, and industrial pollution, with a focus on analytical and
technical advisory work. In twenty years at the World Bank she has had assign-
ments in the research department; the Latin America, Eastern Europe, and
South Asia regions; and corporate policy and operations units. She has also
worked in the Planning Commission in India. Ms. Pargal has a Ph.D in economics
from Northwestern University and B.A. and M.A. degrees in economics from
St. Stephen’s College and the Delhi School of Economics at Delhi University.
Sudeshna Ghosh Banerjee is a Senior Economist in the World Bank’s Sustainable
Energy department. She has worked on energy and infrastructure issues in theSouth Asia and Africa regions in both operations and analytic assignments.
She focuses on project economics, monitoring and evaluation, and on a broad
range of energy sector issues including energy access, energy subsidies, renewable
energy, and sector assessments. Ms. Banerjee holds a Ph.D in public policy from
the University of North Carolina at Chapel Hill and M.A. and B.A. degrees in
economics from Delhi University.

8/20/2019 WB - India Discom Report - Feb15
http://slidepdf.com/reader/full/wb-india-discom-report-feb15 20/255
8/20/2019 WB - India Discom Report - Feb15
http://slidepdf.com/reader/full/wb-india-discom-report-feb15 21/255
xixMore Power to India • http://dx.doi.org/10.1596/978-1-4648-0233-1
ABT availability-based tariff
AER Australian Energy Regulator
AHP analytic hierarchy processAMR automated meter reading
APDRP Accelerated Power Development and Reform Programme
ApTel Appellate Tribunal
AT&C aggregate technical and commercial
BDS Business Development Services
CAGR compound annual growth rate
CEA Central Electricity Authority
CERC Central Electricity Regulatory Commission
CMD chairman and managing director
CREST Commercial Reorientation of the Electricity Sector: Toolkit
DERC Delhi Electricity Regulatory Commission
DF distribution franchise
discom distribution company
DPE Department of Public Enterprises
EA Electricity Act
EPACT Electricity Policy Act
FERC Federal Energy Regulatory CommissionFoR Forum of Regulators
GDP gross domestic product
GEB Gujarat Electricity Board
GIS Geographic Information System
GUVNL Gujarat Urja Vikas Nigam
GW gigawatt
HCPTC high-capacity power transmission corridor
ID institutional design
IM implementation of key regulatory mandates
Abbreviations
8/20/2019 WB - India Discom Report - Feb15
http://slidepdf.com/reader/full/wb-india-discom-report-feb15 22/255
More Power to India • http://dx.doi.org/10.1596/978-1-4648-0233-1
xx Abbreviations
IPP independent power producer
ISO independent system operator
ISTS interstate transmission system
IT information technologykV kilovolt
kWh kilowatt-hour
MERC Maharashtra Electricity Regulatory Commission
MoU memorandum of understanding
MPERC Madhya Pradesh Electricity Regulatory Commission
MSETCL Maharashtra State Electricity Transmission Company
mtpa million tons per annum
MW megawatt NGO nongovernmental organization
NTPC National Thermal Power Corporation
OA open access
O&M operation and maintenance
PBR performance-based regulation
PFC Power Finance Corporation
PGCIL Power Grid Corporation of India Limited
POC point of connection
PPA power purchase agreement
PPP public-private partnership
PSP private sector participation
RA regulatory asset
R-APDRP Restructured Accelerated Power Development and
Reform Programme
REC Rural Electrification Corporation
RGGVY Rajiv Gandhi Grameen Vidyutikaran Yojana
Rs rupeesRTO regional transmission operator
SCADA supervisory control and data acquisition
SEB state electricity board
SERC state electricity regulatory commission
SLDC state load dispatch center
TSO transmission system operator
UI unscheduled interchange
UMPP ultra-mega power plant

8/20/2019 WB - India Discom Report - Feb15
http://slidepdf.com/reader/full/wb-india-discom-report-feb15 23/255
More Power to India • http://dx.doi.org/10.1596/978-1-4648-0233-1
Abbreviations xxi
All amounts are in Indian rupees unless otherwise indicated. All dollar
amounts are in U.S. dollars.
Indian rupees are converted to dollar amounts using the year-specific exchange
rates taken from the World Development Indicators.Year ranges with a slash (such as 2003/04) indicate fiscal years.

8/20/2019 WB - India Discom Report - Feb15
http://slidepdf.com/reader/full/wb-india-discom-report-feb15 24/255
8/20/2019 WB - India Discom Report - Feb15
http://slidepdf.com/reader/full/wb-india-discom-report-feb15 25/255
1More Power to India • http://dx.doi.org/10.1596/978-1-4648-0233-1
Overview
The government of India has emphasized that an efficient, resilient, and
financially robust power sector is essential for growth and poverty reduction
(Ministry of Power 2005). Almost all investment-climate surveys point to poor
availability and quality of power as critical constraints to commercial and manu-
facturing activity and national competitiveness. Further, more than 300 million
Indians live without electricity, and those with power must cope with unreliable
supply, pointing to huge unsatisfied demand and restricted consumer welfare.
This report reviews the evolution of the Indian power sector since the land-
mark Electricity Act of 2003 (EA 2003, or EA), with a focus on distribution as
key to the performance and viability of the sector. While all three segments ofthe power sector—generation, transmission, and distribution—are important,
revenues originate with the customer at distribution, so subpar performance
there hurts the entire value chain. Persistent operational and financial shortcom-
ings in distribution have repeatedly led to central bailouts for the whole sector,
even though power is a “concurrent”1 subject under the Indian constitution and
distribution is almost entirely under state control. Ominously, the recent sharp
increase in private investment and market borrowing means power sector diffi-
culties are more likely to spill over to lenders and affect the broader financial
sector. Government-initiated reform efforts first focused on the generation and
transmission segments, reflecting the urgent need for adding capacity and eva-cuating it and the complexity of issues to be addressed at the consumer interface.
Consequently, distribution improvements have lagged, but it is now clear that
they need to be a priority. This report thus analyzes the multiple sources of weak-
ness in distribution and identifies the key challenges to improving performance
in the short and medium term.
Evolution of Policies and Institutions
India implemented sweeping economic reforms in 1991 after a debilitating
balance-of-payments crisis. The state-dominated power sector was inefficient,hamstrung by undermaintenance and inadequate investment. The sector had
been directed to supply power below the cost of production to key consumer

8/20/2019 WB - India Discom Report - Feb15
http://slidepdf.com/reader/full/wb-india-discom-report-feb15 26/255
2 Overview
More Power to India • http://dx.doi.org/10.1596/978-1-4648-0233-1
groups, at a huge financial loss. And with only 70,000 megawatts (MW) installed,
it was short of generation capacity. With massive additions to capacity needed to
support growth, private sector participation was seen as a necessary complement
to public investment. Amendments in 1991 to the Electricity Supply Act openedthe sector to private participation in generation. As the country continued to
face crippling power shortages, states restructured their vertically integrated
state electricity boards (SEBs) and established state electricity regulatory
commissions (SERCs) under their own reform legislative initiatives to improve
performance. The Electricity Regulatory Commission Act of 1998 set up the
Central Electricity Regulatory Commission and brought regulatory consistency
to the states.
But the commercial performance of state utilities continued to deteriorate,
with losses mounting to Rs 250 billion ($6 billion, or 1.5 percent of gross domes-
tic product or GDP) in 2001/02. By 2002, a decade after the opening of thesector, total SEB debt to central public power suppliers had risen to Rs 400 billion
($8.5 billion), threatening their financial solvency and resulting in a central bail-
out of the state power utilities.
The EA 2003, responding to these developments, was designed as a forward-
looking, procompetitive policy and institutional framework for developing the
power sector. Superseding current legislation, it delicensed thermal generation,
set timelines for open access to transmission and distribution—providing choice
to power procurers and end-users—and introduced power trading as a licensed
activity to foster competition and encourage private sector entry into generation
and transmission. The EA mandated unbundling and corporatizing the SEBs,along with establishing independent central and state regulators and the
Appellate Tribunal, with the aim of creating a more accountable and commercial
performance culture.2 Subsidiary policies that followed laid the groundwork for
competitive bulk procurement of power, multiyear tariff frameworks, rural
electrification, and renewable energy expansion.
Impressive Achievements in Many Dimensions
Bolstered by a sound policy framework and a favorable economic environment,the sector has taken giant strides on many fronts. Generation capacity tripled
between 1991 and 2012, bringing installed capacity to 214 gigawatts (GW),
boosted by a surge in the share invested by the private sector, which increased
from 3 percent to 29 percent. Renewable energy generation capacity, both grid
and off-grid, increased sharply in response to government incentives such as
feed-in tariffs on the generation end and renewable purchase obligations on the
distribution end, as well as renewable energy certificates that have promoted
trade in renewables. From 18 MW in 1990, grid renewable energy capacity rose
to 25,856 MW in March 2013, or 12 percent of total capacity; off-grid renew-
able capacity stands at 825 MW.By recognizing trading as a licensed activity; opening entry into generation;
permitting multiple distribution licensees; introducing a “smart” transmission

8/20/2019 WB - India Discom Report - Feb15
http://slidepdf.com/reader/full/wb-india-discom-report-feb15 27/255
Overview 3
More Power to India • http://dx.doi.org/10.1596/978-1-4648-0233-1
tariff to relieve network congestion through point-of-connection pricing;
separating transmission from dispatch, trading, and generation; and promoting
open access, the EA has led to an active power market and power exchanges that
have eased the entry of latent (captive) capacity into the market. The move fromnegotiated memorandums of understanding with guaranteed rates of return to
investors to market-driven competitive procurement brought forth a huge pri-
vate response in generation and very low tariff bids (though recent experience
indicates that allocating fuel-price risk to bidders may have been unrealistic and
is now being adjusted). Subsequently, the shift from feed-in tariffs to reverse
auctions underpinned the expansion of solar capacity from 17.8 MW in 2010 to
1,440 MW in 2013; competitive bidding for projects under the National Solar
Mission drove down prices for grid-connected solar energy to as low as Rs 7.49
($0.15) per kilowatt-hour (kWh). A state-of-the-art integrated transmission grid
that can balance demand and load flows across the country has been realized—with the recent connection of the southern grid, all of India is now synchronously
connected in a single grid.
While achievements in distribution have been less widespread than those in
generation and transmission, a major success has been the sharp increase in
access to electricity. On the back of an ambitious central scheme, the Rajiv
Gandhi Grameen Vidyutikaran Yojana (RGGVY), access to electricity rose from
59 percent of the population in 2000 to 74 percent in 2010.
Promising models to obtain efficiencies from private participation in distribu-
tion have been developed but need to be scaled up for impact. Globally, private
participation has long been considered an effective way of resolving efficiencyissues in distribution. In India the “legacy” private distribution utilities in Kolkata,
Mumbai, Surat, and Ahmedabad, with their impressive efficiency and customer
service, are obvious examples of the potential gains from private participation.
They inspired the public-private joint ventures in power distribution taken for-
ward first in Orissa, with limited impact, then in Delhi (learning from Orissa’s
experience), with greater success. Recognizing the limited political space for such
“privatization,” the EA 2003 established the concept of “distribution franchises.”
With the success of the Bhiwandi franchise operation in Maharashtra, which
demonstrated the considerable efficiencies and reduction in losses that could beachieved, private participation through the franchise route is today being explored
in Bihar, Madhya Pradesh, Maharashtra, and Uttar Pradesh. A push toward rural
franchises has also occurred, to help state utilities manage (metering, billing, col-
lection, and operation and maintenance) low-income and low-consumption rural
distribution networks, which have expanded under the RGGVY program.
The Agenda for Addressing Distribution Performance Must NowBe a Priority
Despite considerable progress in implementing the EA mandates and associatedpolicies over the past decade, the distribution segment continues to post
significant losses. Utility finances—critical to realizing sector goals—deteriorated
8/20/2019 WB - India Discom Report - Feb15
http://slidepdf.com/reader/full/wb-india-discom-report-feb15 28/255
4 Overview
More Power to India • http://dx.doi.org/10.1596/978-1-4648-0233-1
sharply over 2003–11. Power sector after-tax losses, excluding state government
support (subsidies) to the sector, were Rs 618 billion ($14 billion) in 2011,
equivalent to nearly 17 percent of India’s gross fiscal deficit and around
0.7 percent of GDP. These losses are overwhelmingly concentrated among dis-tribution companies (discoms) in the unbundled states and among SEBs and
power departments in the states that have not unbundled. When subsidies3 are
included as revenue, losses fall by more than half, to Rs 295 billion ($6.5 billion).
Six states reported profits in 2011, but only three would have reported a
profit excluding subsidies: Delhi, Kerala, and West Bengal.
Aggregating profits and losses over time, sectorwide accumulated losses stood
at Rs 1,146 billion ($25 billion) in 2011, more than twice (in real terms) the
amount in 2003.4 Accumulated losses grew at a compound annual growth rate
of 9 percent in real terms from 2003, though the share of losses relative to GDP
remained stable at about 1.3 percent, largely because the economy also grewstrongly over this period. Discoms and bundled utilities (SEBs and power depart-
ments) are, once again, the largest contributors to accumulated losses,5 though
their share has fluctuated from 90 percent in 2003 down to 79 percent in 2008
and back up to 86 percent in 2011.
Sector losses have been financed by heavy borrowing by all sector segments,
with total debt growing to Rs 3.5 trillion ($77 billion) in 2011, or 5 percent of
GDP. Discoms are responsible for the largest share of this debt (36 percent in
2011), followed by generation companies, including independent power produc-
ers. Many discoms have relied on short-term loans to meet operating expenses in
recent years: long-term loans declined from 87 percent of total sector borrowingin 2007 to 77 percent in 2011. The interest burden on utilities from short-term
borrowing is onerous, with debt-heavy capital structures becoming more
common.6
Mounting debt and continuing losses have led to a precipitous decline in
discom creditworthiness. In Uttar Pradesh, Rajasthan, Meghalaya, and Haryana,
power sector debt exceeded 10 percent of state GDP in 2011. Facing the pros-
pect of huge and increasing nonperforming assets and approaching their sector
exposure limits, lenders pulled the plug on loss-making utilities by late 2011. As
credit dried up, these discoms were unable to pay for power purchases, with aknock-on effect on upstream (generation) investor sentiment. The absence of
alternative buyers for power has spelled trouble for power generation companies,
which are overly dependent on state discoms as customers. This, in turn, has
slowed investment in generation, resulting in difficulties in that segment as well,
as significant funds are locked up in delayed or mothballed generation projects.
Thus, at the end of 2011, just 10 years after being bailed out, the sector was look-
ing for another rescue from the center, four times larger than before.7
The 2011 crisis was different from that in 2001 because this time players
from outside the power sector and government were involved. Lending by banks
and financial institutions (to all sector segments) has relied on the quasi-guarantee of state governments in the face of the known insolvency of discoms,
the offtaker and source of revenues for the entire sector. In 2011 about half

8/20/2019 WB - India Discom Report - Feb15
http://slidepdf.com/reader/full/wb-india-discom-report-feb15 29/255
Overview 5
More Power to India • http://dx.doi.org/10.1596/978-1-4648-0233-1
the sector’s borrowing came from commercial banks. Additional amounts were
lent at concessional rates by financial institutions such as the Power Finance
Corporation (PFC), Rural Electrification Corporation (REC), and Infrastructure
Development Finance Company, to bring the total contribution of commercialbanks and financial institutions to 86 percent of power sector borrowing. The
flow of liquidity limited the pressure on discoms to improve performance and
on state governments to permit tariff increases. (It was only in 2011 when banks
were directed to stop lending to insolvent utilities that states pushed through
tariff increases [Unnikrishnan and Gadgil 2011].) Such profligate lending has
harmed banks’ capital adequacy and net worth. More than half of 13 major
state-owned banks have funded loans to the power sector of 50 percent or more
of net worth. At the extreme, the funded exposure of some smaller banks
exceeds their net worth, raising concerns over how poor power sector perfor-
mance and difficulties for some or all of these financial institutions could spreadto the financial sector and, possibly, other parts of the economy.
Thus, two decades after the initiation of power sector reforms, an inefficient,
loss-making distribution segment and inadequate and unreliable supply have
become major constraints to India’s growth, inclusion, job creation, and aspira-
tions for middle-income country status.8 The peak deficit today is 10.5 percent,
and the energy deficit is 7.5 percent. More than 300 million people remain
without electricity, and per capita annual consumption at 780 kWh is among the
world’s lowest levels (Press Information Bureau 2011). Despite the low tariff
bids from competitive procurement, the cost of power purchased by utilities has
been increasing. And while the private sector has enthusiastically participatedin building power plants, there has been less of an interest in inviting private
participation into distribution, where its expertise in raising efficiency is most
needed.
Analyzing Operational and Financial Performance of Distribution
Aggregate technical and commercial (AT&C) losses, which measure utility
operational and financial performance, have fallen from 38 percent to (a still-
high) 26 percent over 2003–11. AT&C losses consist of distribution losses,
9
which comprise losses due to both technical and nontechnical factors, and losses
from collection inefficiency. Distribution losses have dropped from 32 percent in
2003 to around 21 percent on average in 2011—so, despite the encouraging
trend, utilities still have not been paid for more than a fifth of power they pur-
chased and supplied. In 2011 the lowest distribution losses were in Kerala, at
about 12 percent, similar to international best practice.
To understand the relative contribution of different factors, distribution-
utility revenue losses10 can be decomposed by source: from underpricing
(average billed tariffs below cost-recovery tariff levels), from undercollection
(not collecting the full amount billed), and from physical losses of energy (lossesabove international norms due to technical reasons or due to nontechnical fac-
tors, such as theft). In 2011 the absolute amount lost was highest in Tamil Nadu,
8/20/2019 WB - India Discom Report - Feb15
http://slidepdf.com/reader/full/wb-india-discom-report-feb15 30/255
6 Overview
More Power to India • http://dx.doi.org/10.1596/978-1-4648-0233-1
followed by Rajasthan and Andhra Pradesh; losses in five states were more
than 100 percent of distribution revenues earned.
Collection efficiency has generally remained stable, rising from 89 percent in
2003 to 94 percent in 2011.11
Most states are above 90 percent, though perfor-mance declined in about half the states over 2003–11.
The time taken to collect payments—debtor days—is another operational
inefficiency that has contributed, through the collection rate, to the poor finan-
cial performance of distribution utilities. Average debtor days have come down
from 213 days to around 170 over 2003–11 with the 10 best performers averag-
ing 21 days in 2011 but the 10 worst 489 days, indicating gross mismanagement
of cash flow.
In 2003, in aggregate, states were charging an average billed tariff 12 well above
cost recovery,13 and losses that year were overwhelmingly driven by distribution
losses—that is, above the normal physical losses of energy. By contrast, in 2011,in aggregate, states were charging an average billed tariff below cost recovery.
Thus, underpricing emerged as an important contributor to losses, though distri-
bution inefficiencies, while smaller than in 2003, continued to be the largest
contributor to total losses.
Calculated across all states, the margin of cost recovery declined over 2003–11
because tariff increases failed to keep pace with cost increases. Although the
average billed tariff in 2011 was higher than cost recovery in 15 states, technical
losses, theft, and undercollection can (and often do) lead to no revenue from a
significant amount of power supplied by utilities. The fact that most utilities still
make losses despite having tariffs at or above cost-recovery levels reinforces howmuch operational inefficiencies contribute to utility losses. Only Delhi, Kerala,
and West Bengal had tariffs that covered costs in 2011 and made a profit without
requiring a subsidy.
The Sector Operating Environment Has Contributed to DiscomFinancial Difficulties
On the cost side, unforeseen shortages of fuel (mainly coal) and poor planning
by discoms have led to a steep rise in the price of bulk power—the main reasonfor the widening gap between discom costs and revenues. While average revenue
grew at a real compound annual growth rate of 6 percent over 2003–11, the
average cost of supply rose at about 7 percent, growing by 70 percent in real
terms over the period. The share of power purchases in total costs rose from
56 percent in 2003 to 74 percent in 2011. Power has become more expensive
because of a decline in domestic fuel availability, resulting in an acute increase in
the price of fuel used in generation, and because of poor procurement planning
by discoms, which leads to last-minute purchases of power to supply end-con-
sumers. Such purchases must be procured from the spot market and tend to be
more expensive than power contracted for longer periods. A sharp increase in theuse of imported coal, which is often two to three times as expensive as domestic
coal, and power producers’ increased use of e-auctions (typically expensive) to
8/20/2019 WB - India Discom Report - Feb15
http://slidepdf.com/reader/full/wb-india-discom-report-feb15 31/255
Overview 7
More Power to India • http://dx.doi.org/10.1596/978-1-4648-0233-1
purchase coal have further pushed up the cost of power generation. Rising inter-
est expenses, driven by discoms’ increased borrowing to meet cash-flow needs
(often due to inadequate revisions in tariffs), have also contributed to escalating
costs. The escalation in cost is also not always permitted to be a pass-through,adding to the pressure on discoms.14
Inefficiencies and lack of coordination among the ministries and agencies
responsible have resulted in coal production and supply well below projections.15
About 76 percent of the coal consumed in India is used by the power sector, and
58 percent of electricity generated comes from coal. Coal India’s monopoly on
coal production and sales, coupled with its inefficiency, has led to consistent
shortfalls in coal availability against official estimates over the past two Five-Year
Plans (2002–07 and 2007–12). Targets for coal production have been overly
optimistic considering the volume of exploration undertaken in earlier years.
Poor coordination among the multiple agencies that need to provide clearanceshas added long delays to mine development. Infrastructure for evacuation of coal
produced has not kept up with production, either. The gap between the amount
of coal required (for plants awarded coal linkages and to be commissioned during
the Plan period) and the actual increase in coal production, particularly over
2010–12, points to an urgent need for harmonization between the concerned
ministries. In fact, a considerable volume of investment in thermal power plants,
with power purchase agreements (PPAs) based on the projected availability of
cheap, domestic coal, is now likely to remain stranded.
The expense of providing below-cost power to key consumer groups, such as
agricultural and rural consumers (a political decision in many states) has alsoweakened utility finances. The health of distribution is closely linked to the share
of agricultural consumers in total consumers. Not only are these consumers
heavily cross-subsidized by industrial and commercial consumers as part of
government policy, but they also usually require an additional explicit subsidy
contribution from the state—the share of agriculture in total electricity con-
sumption was 23 percent in 2011, while revenues from agriculture were only
7 percent of the total. Thus compensation from the state budget to cover the
cost of supply to agriculture is critical to utility financial viability.
The problem for utility finances arises because there is often a gap betweenthe volume of subsidies booked by utilities as compensation and the amount
received from the government. This worsens the economics of already struggling
utilities, undermining their creditworthiness and preventing them from investing
to improve service delivery. The gap was Rs 119 billion ($2.6 billion) for all
states in 2011. Since 2003 subsidies booked have grown 12 percent a year and
subsidies received by 7 percent a year; the cumulative gap between them was
$10 billion for 2003–11.16
State support to the power sector includes explicit fiscal transfers in the form
of subsidy payments as well as subsidized loans and contributions of equity to
utilities. Fiscal transfers to the power sector account for a significant share of statebudgetary spending. State support to the power sector averaged 1.3 percent of
state GDP in 2011 across the 16 Indian states in which distribution utilities
8/20/2019 WB - India Discom Report - Feb15
http://slidepdf.com/reader/full/wb-india-discom-report-feb15 32/255
8 Overview
More Power to India • http://dx.doi.org/10.1596/978-1-4648-0233-1
received support, and was as high as 6 percent in Punjab and 5 percent in
Uttarakhand. As a share of the state budget in 2011, state support averaged about
2 percent but was 15 percent in Bihar and 22 percent in Uttarakhand.
Most states also subsidize a substantial portion of domestic consumption. Ofall electricity consumed by domestic consumers in India, 87 percent was subsi-
dized in 2010. As the domestic sector consumes almost a quarter of electricity
sold, this is equivalent to 21 percent of all electricity consumed, with the average
subsidy being Rs 1.5 per kWh. While 25 percent of households lack access to
electricity and therefore receive no subsidy, more than half of subsidy payments
(52 percent) India-wide went to the richest 40 percent of households in 2010,
underlining the potential gain to utility revenues from better targeting that
would reduce household subsidies.
Institutional Factors and Governance Shortcomings Are OtherContributors
Key reforms mandated by the EA have still not been implemented in full. EA
mandates in six areas—access, quality and affordability, cost recovery, account-
ability and transparency, renewable energy, and competition—have been carried
out unevenly.17 An index that measures the actions taken by state-level actors
(that is, governments, regulatory commissions, and utilities) to realize the objec-
tives of the EA and its associated policies indicates that most states have com-
pleted only half the reform actions envisaged. Among the reform areas, statewide
performance was worst on promoting competition. Service quality and afford-ability has seen the most progress, closely followed by access.
In fact, open access, a key enabler of competition under the EA, has still not
been implemented in a manner such that a robust merchant market could com-
pensate for a decline in sales to state discoms and thus balance supply and
demand. Of the five indicators used in this report to assess progress in promoting
competition, only notification of open access regulations and unbundling have
been completed by almost all states. Most state regulators have notified wheeling
and transmission charges and the cross-subsidy surcharge, but only one has speci-
fied a path for the cross-subsidy reductions necessary for open access to takeeffect.18 Implementing open access and ensuring the availability of adequate
evacuation capacity are necessary to permit third-party sales and deepen compe-
tition in the sector. With regard to the states, Delhi has progressed the most in
implementing EA mandates, followed by Gujarat, Maharashtra, Madhya Pradesh,
and Andhra Pradesh.
Analysis for this report shows that achieving sector outcomes is linked closely
to the degree to which each state has implemented the EA, so this is a critical
area for follow-through. An index of outcomes on objectives ranging from power
availability and affordability, to access and reduction of fiscal burden, to openness
and sector financial viability was used to measure overall sector performance. Itshows that sector outcomes, in line with the implementation of reforms, have
8/20/2019 WB - India Discom Report - Feb15
http://slidepdf.com/reader/full/wb-india-discom-report-feb15 33/255
Overview 9
More Power to India • http://dx.doi.org/10.1596/978-1-4648-0233-1
been uneven across states, with Gujarat and Punjab ranking highest in achieve-
ment of outcomes.
Continued state interference in utilities weakens incentives for commercial
operation. The EA’s requirement for unbundling and corporatization of utilitieswas intended to limit state involvement in their operations, increase transparency
and accountability, and bring a commercial orientation to their operations. But
while unbundling the SEBs has progressed quite well on paper, actual separation
and functional independence of the unbundled entities is considerably less than
it appears—and clearly identifying the contributions of individual entities in the
service value chain and holding them accountable for their performance remains
difficult.
Corporatization has also been unable to insulate utilities from state interfer-
ence because boards remain state dominated, lack sufficient decision-making
authority, and are rarely evaluated on performance. Utility boards tend to havemore government and executive directors than recommended under the corpo-
rate governance guidelines issued by the Department of Public Enterprises and
fewer independent directors.19 Only 16 percent of 69 utilities studied have the
recommended share of independent directors, and several entirely lack indepen-
dent directors. Further constraining the boards’ autonomy and management’s
ability to operate on a commercial basis is the state government’s involvement in
recruitment, personnel, procurement, and enforcement decisions.
The regulatory environment has not sufficiently pushed utilities to improve
performance. A lack of accountability, limited autonomy, and constrained techni-
cal capacity have restricted the ability of SERCs to create an independent, trans-parent, and unbiased governance framework for the sector that balances
consumer and investor or utility interests. SERCs have been established in all
states but have generally struggled to achieve true autonomy from state govern-
ments, partly because of relationships built into the EA. In addition, many
SERCs lack the resources, such as adequate numbers of professional staff and
appropriate information technology (IT) systems, to perform their functions.
Most SERCs are nominally promoting consumer empowerment and increasing
transparency but need to do far more to promote consumer engagement and
ensure that high-quality information is publicly available. Perhaps most impor-tant, there is no clear accountability mechanism to hold SERCs responsible for
implementing their mandates.
SERCs face an enormous challenge in carrying out their mandates because the
utilities they regulate are almost all state owned. As a result, although most
SERCs have notified20 the key regulations necessary to enact the EA 2003 man-
dates, many have yet to implement them fully. The regulatory mandates reviewed
in this study relate to tariffs, protection of consumers, standards of performance,
open access, renewable energy, and regulations in selected other areas.21 On aver-
age, states score 74 percent on an index measuring implementation of regulatory
mandates. Andhra Pradesh, Himachal Pradesh, and Karnataka are the highestranking SERCs.
8/20/2019 WB - India Discom Report - Feb15
http://slidepdf.com/reader/full/wb-india-discom-report-feb15 34/255
10 Overview
More Power to India • http://dx.doi.org/10.1596/978-1-4648-0233-1
Examining implementation more closely is instructive. For example, while
tariffs cover average cost in most states, very few states issue multiyear tariffs
that incentivize efficient operations and enable utilities to plan long term. On
average, states increased tariffs at least once every two years from 2008 to2013. Three states increased tariffs each year while Sikkim did not revise tariffs
at all in the six-year period. The frequency of tariff increases varied from year
to year—for instance, in 2008/09 only 13 states reported tariff increases, com-
pared with 2012/13 when about 26 states issued orders to raise tariffs. Goa—
one of the best performers—did not issue a tariff order for the first five years
in this period, finally raising tariffs only in 2012/13. Steady revisions in tariffs
avoid the shock to consumers from having to adjust to a sudden large jump in
the tariff. And they enhance the general acceptability of tariff increases and
help prevent receivables, such as “regulatory assets,” from building up in utility
accounts.22
Mounting regulatory assets have added to the discoms’ cash-flow problems,
jeopardizing routine operations.23 In Tamil Nadu, Rajasthan, Punjab,
Uttar Pradesh, Haryana, Delhi, and West Bengal, utilities have had to borrow
heavily to fund the deficit of revenues over costs. Although the Appellate
Tribunal has ruled that regulatory assets must be recovered over three years, the
sheer magnitude of current regulatory assets means this would cause a major
tariff shock. So, recovery has been spread over a longer period with no relief to
utility finances. Exacerbating the problem are delays in “truing up,”24 regulators
assigning lower power-purchase costs than used by discoms in their projected
revenue requirements to keep starting tariffs low, and the interest burden oncash-strapped discoms that have to borrow to purchase power.
Another source of pressure on utility finances is the mandate to build and
“power up” the vast network of lines laid across the country under the central
government’s flagship access program, RGGVY. Structural disincentives to sup-
ply power in rural areas include low demand (per consumer and also overall),
high cost of service provision, and low (frequently below-cost) tariffs. In 2011
utilities lost Rs 3 ($0.06)–Rs 4 ($0.08) per unit of power sold to rural consum-
ers; the aggregate burden of serving rural consumers in 2010 was around
Rs 200 billion ($4.4 billion) in 12 large states studied. RGGVY-related losseshave also placed a heavy weight on distribution utilities’ finances that state
subsidies do not always cover, as estimating the cost of rural service delivery is
very difficult. Under RGGVY, the REC provides a 90 percent subsidy for the
capital cost of grid extension. But by January 2013 the amount sanctioned by
the REC for all RGGVY projects, Rs 342 billion ($8 billion), covered only
58 percent of the estimated actual cost of Rs 590 billion ($13 billion), and the
government had only disbursed 84 percent of the sanctioned amount. The rea-
sons for this misalignment are inadequate and unrealistic state estimates of the
funding required to meet RGGVY goals; the REC’s application of standard cost
norms that do not consider geography, cost of living, or other significant factors;a long and unwieldy revisions process, which has deterred states from requesting
revisions to approved amounts; and RGGVY’s provision of free connections
8/20/2019 WB - India Discom Report - Feb15
http://slidepdf.com/reader/full/wb-india-discom-report-feb15 35/255
Overview 11
More Power to India • http://dx.doi.org/10.1596/978-1-4648-0233-1
only to households below the poverty line, which restricts potential aggregate
demand to a small group with low consumption levels.25
A potentially transformative two-part central scheme to increase distribution
efficiency, the Restructured Accelerated Power Development and ReformProgramme (R-APDRP), has not yet realized its potential. The R-APDRP aims
to reduce AT&C losses (to 15 percent) in selected urban areas by supporting
baseline data collection and the adoption of IT applications and by providing
grant funding to renovate, strengthen, and modernize operational, technical, and
service delivery mechanisms for distribution.26 But no state has completed even
the first part of the scheme, largely because utilities were not informed of the
extensive change management needed for implementation; this was made worse
by limited resources, a lack of appropriate capacity, and the absence of a sup-
portive IT ecosystem in the broader economy.
In sum, multiple institutions with diffuse accountability have undermined thesector’s commercial orientation. The EA 2003 sought to limit government inter-
ference in utility operations, yet state governments are still a major presence with
a generally detrimental impact on utility operations. They have exacerbated dis-
coms’ financial difficulties by compelling them to borrow to cover operational
expenses (given the revenue shortfalls due to under-recovery of power purchase
costs and incomplete or late subsidy payments by state governments), by apply-
ing political pressure to keep tariffs low, and by pressuring discoms to purchase
power during elections to keep voters happy. Irregular and inadequate tariff
increases over the past decade, despite state regulators’ ability to act on their own
initiative, have lowered cost recovery and increased regulatory assets.27 Banks andfinancial institutions continued financing insolvent discoms through 2011, ignor-
ing due diligence and prudential norms as lending to unbundled discoms grew
35 percent a year over the previous five years. This flow of liquidity limited the
pressure on discoms to improve performance and on state governments to allow
tariff increases.
Way Forward: Priority Areas for Action
Poor power sector performance has its roots in distribution inefficiencies andlimited accountability, so fixing them will help improve service delivery and
other metrics of sector performance, put the sector on a financially sustainable
path, and ensure that power is no longer a bottleneck for growth.
Priorities for action are as follows:
Implement fully the key EA mandates, especially those on competition and distri-bution (tariffs, open access, and standards of performance). This will incentivize
loss reduction, modernize operations, and improve service delivery and cost
recovery, thus bringing distribution performance up to international benchmarks
of quality.
Ensure regulatory autonomy, effectiveness, and accountability. Widespread con-cerns about objectivity of decisions and autonomy of decision making arise from
the revolving door among the regulator, utility, and government, which results
8/20/2019 WB - India Discom Report - Feb15
http://slidepdf.com/reader/full/wb-india-discom-report-feb15 36/255
12 Overview
More Power to India • http://dx.doi.org/10.1596/978-1-4648-0233-1
from the sector’s limited pool of qualified staff. One option would be to establish
a common pool of regulatory staff working across states and regulatory commis-
sions. Financial autonomy could be enhanced by charging regulatory expenses to
the state’s consolidated fund so that the SERC has a dedicated, independentsource of funding.
Most critically, safeguards need to be developed against the misuse of section
108 of the EA, which permits states to “direct” SERCs. The limited ability of
SERCs to penalize state-owned utilities and to overcome state political consid-
erations (on tariff increases, for example) highlights the need to weaken the con-
nection among a state government, its utilities, and the state electricity regulator.
Establishing four or five regional regulators responsible for regulating the sector
in a group of states is an option. An overarching issue is enhancing the account-
ability of regulators. Given the general lack of involvement of the state legisla-
tures, alternatives include reporting every six months, possibly through theForum of Regulators, to a standing Parliamentary Committee.
Ensuring that high-quality, updated data are publicly available and that thesedata are used for monitoring and benchmarking performance and for planning
and decision making is key to incentivizing improved utility performance.28 The
current dearth of consistent, reliable, updated data hampers sound management.
The regulator can also bring greater transparency and accountability to sector
institutions by regularly collecting and publishing data on performance targets
and achievements. A statutory requirement for utilities to regularly collect pri-
mary data is advisable, including data on customer satisfaction and state perfor-
mance with respect to subsidy commitments. Third-party monitoring should beencouraged.
Insulate utilities from state government to prevent interference with internaloperations. State utilities should comply with corporate governance guidelines
from the Department of Public Enterprises on including independent direc-
tors on boards and limiting the share of executive directors on them.
Independent directors should be appointed by a committee with members
from entities like the Central Electricity Authority or other representatives of
the public interest. An arm’s-length relationship between government and
utility can be institutionalized more easily if utilities’ articles of associationspecify a limited role for the government. Using compliance with listing
requirements (“shadow” listing) as a precondition for central or other support
can bring greater accountability to utility boards, while limiting state interfer-
ence. Divesting an ownership share to central public sector undertakings such
as the National Thermal Power Corporation (NTPC) or Power Grid
Corporation of India, which are recognized for strong results, may also limit
state government influence because, as equity owners, these undertakings
would have the ability to push for better performance. Utility performance
can be strengthened through memorandums of understanding, following the
practice of central public sector undertakings, many with exemplary perfor-mance records. States also need to be held responsible for making timely and
complete subsidy payments when they mandate below-cost supply of power
8/20/2019 WB - India Discom Report - Feb15
http://slidepdf.com/reader/full/wb-india-discom-report-feb15 37/255
Overview 13
More Power to India • http://dx.doi.org/10.1596/978-1-4648-0233-1
to certain consumer groups. The central government’s budgetary transfer to
the states could be a potential source for making up the shortfall if the state
government does not make the payments due.
Use central programs and other support to incentivize operational and financialefficiency. The central government and its agencies have immense financial lever-
age. The large centrally sponsored programs (such as RGGVY and R-APDRP)
can be used to promote responsible utility and state government behavior, par-
ticularly if program implementation is coordinated and if disbursements are tied
to reaching operational and financial performance targets.29 Another promising
approach would be consistent use by the PFC and REC of ratings recently devel-
oped by the Ministry of Power as a core input in lending decisions (Ministry of
Power 2013). As PFC and REC are the leading lenders to the sector, this would
emphasize the need to achieve and maintain strong operational and financial
performance. Make better use of India’s size and diversity to experiment with and learn from
different models of service provision, including private sector participation through
joint ventures (Delhi), franchising (Bhiwandi), management contracts, and so on.
Attracting outside expertise and investment for improving distribution faces
issues such as a lack of reliable information on asset quality; very different
demand, needs, and ability to pay of rural and urban consumers that the same
utility serves; long-lived assets that require heavy upfront investment; and gov-
ernment sensitivity to potential for “extra” profits being earned by private inves-
tors leading to excessive conditionality (damping interest in the newer franchises
offered).On these factors, potential approaches include:
• Support learning by doing, with management contracts or franchises that per-
mit the discovery of the true state of assets and that bring basic efficiencies to
operations before specifying investment requirements over the longer term.30
• Ring-fence urban and rural customers and consider license, franchise, or
public-private partnership (PPP) models31 only in urban areas, while letting
state discoms remain responsible for rural supply (or separately contractingout specific functions like revenue collection to a rural franchisee) and assign-
ing low-cost public sector generation (such as NTPC PPAs) to state discoms
serving rural areas. The private urban operators would be responsible for pro-
curing power for their own consumers, and could contribute transparently to
a universal service fund that would cross-subsidize rural supply.
• Establish urban franchises and encourage the franchisees to gradually expand
their services to cover rural areas (through a series of concentric circles, for
example) so that learning consolidates over time. Variants of this basic approach
could include permitting private entrants to offer greater service reliability(than the standard mandated) upon payment of fees on top of the basic,
regulated tariff.
8/20/2019 WB - India Discom Report - Feb15
http://slidepdf.com/reader/full/wb-india-discom-report-feb15 38/255
14 Overview
More Power to India • http://dx.doi.org/10.1596/978-1-4648-0233-1
Promote electrification in a financially responsible manner and support diversedelivery models. Rural service delivery will become viable only if discoms are
compensated fully for supplying power to rural consumers. Supporting produc-
tive uses of power (through capacity building, provision of information, comple-mentary microfinance, and technical support) is critical for aggregating the rural
load and improving the commercial viability of rural service delivery. Beyond
this, funding needs to be allocated in the state budget to make up the shortfall in
discom revenues from serving rural consumers. While increasing rural loads will
make it cost-effective to meter, bill, and collect, technology innovations and rural
collection franchisees can help reduce the associated transaction costs. Prepaid
meters would lower commercial risks to utilities and grant rural households more
control over their consumption.32 State utilities may also benefit from exploring
management contracts with private operators who can deploy new metering
technology. Using own-state funds to extend free connections to householdsabove the poverty line can raise community support and improve sustainability
of the access expansion achieved.
A single central agency for planning and monitoring grid and off-grid invest-
ments can promote coordination by leading the development and regular
updating of state rural electrification plans and providing a countrywide picture
of the rollout of grid and off-grid facilities. Coordination would require more
reliable information on populations without electricity, both in villages with
electricity (important for state utilities) and in villages without power (impor-
tant for off-grid programs and providers).
Rationalize domestic tariff structures to improve targeting and reduce the fiscalburden. An accurate system of identifying households below the poverty line can
better target subsidies to the poor. Until such a system is functional, it would be
useful to work toward rationalizing tariff structures through:
• Volume-differentiated tariffs instead of incremental block tariffs. In volume-
differentiated tariffs, households are grouped by total monthly consumption,
and each household in a group pays the same (constant) tariff for every unit of
power it consumes.
•
Tariff block cutoffs that better match the electricity consumption patterns ofhouseholds at different incomes.
• Charging above cost-recovery tariffs to higher consuming households. States
with fairly low fiscal costs of subsidies achieve this by limiting the subsidy,
restricting how many households receive the subsidy, and charging a cross-
subsidy to some households.
Notes
1. Both central and state legislatures have a role in developing policy.
2. The sector has moved away from vertically integrated SEBs. Nineteen of India’s 29 states now have unbundled generation, transmission, and distribution entities. As of 2013, 28 regulatory commissions have been established.
8/20/2019 WB - India Discom Report - Feb15
http://slidepdf.com/reader/full/wb-india-discom-report-feb15 39/255
Overview 15
More Power to India • http://dx.doi.org/10.1596/978-1-4648-0233-1
3. Such subsidies are primarily given to discoms to compensate for below-cost tariffs charged to agriculture and domestic consumers on equity and political grounds.
4. This figure includes subsidies (booked) from state governments as revenue.
5. Among states with the highest level of accumulated losses are Uttar Pradesh, Madhya Pradesh, Tamil Nadu, and Jharkhand. Five states together account for 75 percent of the total. By contrast, Kerala, Gujarat, Andhra Pradesh, Goa, and West Bengal had accumulated profits in 2003–11.
6. The balance sheets of distribution companies have grown, fueled mainly by debt, but these financial liabilities have not created assets.
7. In October 2012 the government announced a Scheme for Financial Restructuring of State Distribution Companies, available to all loss-making discoms that wish to participate, which potentially amounts to a bailout of about Rs 1.9 trillion.
8. The Integrated Energy Policy of 2006 forecasts that generation capacity will need to increase to about 800 GW by 2031 to meet predicted demand and sustain growth of 8 percent a year—four times current generation capacity.
9. That is, the difference between input energy (which is paid for by the utility) and energy sold (which generates revenues for the utility).
10. That is, the difference between total revenues accrued and total costs = profit before tax.
11. Collection efficiency is the proportion of energy realized (as revenue) to energy billed; anything less than 100 percent is inefficient.
12. The average billed tariff is revenues billed/energy sold.
13. While cost recovery basically requires the tariff to equal or exceed average cost, a
more stringent requirement is used in this report. Cost recovery is the tariff level that covers (equals) average cost plus a premium to account for “normal” distribution losses, which are set at 10 percent for India in this analysis. Thus, an efficiently operat-ing utility (with normal distribution losses and 100 percent collection) that has a tariffequal to cost recovery, as defined above, would break even.
14. There are also significant inefficiencies in fuel use by generation that feed into end-user tariffs. While an important area for immediate action by regulators to capture possible savings, over the medium term, as existing power purchase agreements wind down and all new power is procured through competitive bidding, this source of inef-ficiency can be expected to decline.
15. While beyond this report’s scope, a considerable body of work has analyzed the options for moving India to a lower carbon growth path and increasing the share of renewable energy in India’s generation mix. See, for example, the World Bank studies Unleashing the Potential of Renewable Energy in India (Sargsyan and others 2011), Energy Intensive Sectors of the Indian Economy: Path to Low Carbon Development (Gaba, Cormier, and Rogers 2011), and Development of Local Supply Chain: A Critical Link for Concentrated Solar Power in India (Kulichenko and Khanna 2013).
16. Between 2003 and 2011 cumulative subsidies booked were Rs 1,496 billion ($32 billion)and received were Rs 1,044 billion ($22 billion).
17. Delhi has progressed the most by far in implementing EA mandates, followed by
Gujarat, Maharashtra, Madhya Pradesh, and Andhra Pradesh. Sector outcomes, which are highly correlated with implementation of EA mandates, have also been uneven across states, with Gujarat and Punjab ranking highest.
8/20/2019 WB - India Discom Report - Feb15
http://slidepdf.com/reader/full/wb-india-discom-report-feb15 40/255
16 Overview
More Power to India • http://dx.doi.org/10.1596/978-1-4648-0233-1
18. All but two states have notified open access regulations, and 13 states have reduced cross-subsidy surcharges over the last five years. Only 10 states have initiated competi-tive power procurement, and only 8 have begun implementation of an availability-based tariff (ABT) beyond notifying ABT regulations. The regulator in Madhya
Pradesh notified a cross-subsidy reduction roadmap in 2007, but the state has not been able to achieve the targets set. Kerala notified “Principles for determination of road map for cross subsidy reduction for Distribution Licensees” in 2012, while Maharashtra and Goa have issued draft regulations for “Principles for determination of road map for cross subsidy reduction for Distribution Licensees” in 2010 and 2012, respectively.
19. While most utilities comply with the mandated corporate governance require-ments of the Companies Act, far fewer follow the recommended guidelines of the Department of Public Enterprises, and very few support their boards with information-driven processes and robust performance management systems, which would boost accountability and profitability.
20. In India “notifying” a regulation means the regulation has been published in the neces-sary channels and is enforceable.
21. Specifically, regulations related to the supply code, power trading, metering, multiyear tariffs, and intra-state ABTs.
22. Regulatory assets are dues to the discoms, typically from tariff increases that the regu-lator accepts as justified but does not allow in the year they are incurred to avoid a sudden jump in tariffs, on the presumption that they will be recovered through gradual tariff increases in the future.
23. Borrowing against regulatory assets is becoming less feasible. Because commercial
banks are unsure how to value regulatory assets that may not be worth their face value, discoms can no longer borrow up to the full amount of the regulatory assets they own.
24. In other words, adjusting the value (for example, of costs, revenues, and tariffs) approved by the regulator in advance (when passing a tariff order) against what was actually achieved. In this instance, actual costs are used to update the cost estimates provided by utilities in their tariff petitions.
25. Increasing both the consumer base and per consumer consumption levels will address low load, and for this it will be critical to improve the quality of supply so that there is greater consumer interest in connecting to the grid, thus generating effective demand.
26. The program requires participating utilities to demonstrate performance improve-ments (sustained loss reduction) to obtain financial assistance. Thus utilities need to collect accurate baseline data and measure performance. To ensure data integrity, reliable and “no manual touch” systems need to be established for data collection, while adopting IT for energy accounting. Under the program, there is support for both aspects, recognizing that they are preconditions for successful distribution- strengthening projects.
27. Nationwide it is estimated that regulatory assets are more than Rs 700 billion ($15 billion) and that the interest cost alone adds up to around Rs 95 billion ($2 billion) a year.
28. The Implementation of Reforms Index, Sector Outcomes Index, and the Analytic Hierarchy Process Index illustrate the potential options that can be considered (see chapters 4 and 5).

8/20/2019 WB - India Discom Report - Feb15
http://slidepdf.com/reader/full/wb-india-discom-report-feb15 41/255
Overview 17
More Power to India • http://dx.doi.org/10.1596/978-1-4648-0233-1
29. Payment release could be conditional on concurrence with the performance report by lenders’ representatives on utility boards.
30. “Try before you buy.” Operating the system will give the incumbent franchisee an information advantage when bidding for concessions or privatizing the utility (if that is envisaged in the next stage). Appropriate mechanisms for capturing this knowledge and handling the information advantage will need to be developed and will need to provide incentives for franchisee performance but also allow for an open competitive procurement process.
31. Delhi utilities are technically PPPs as they are joint ventures between the government of Delhi and the different licensees.
32. Because many rural dwellers in India already use prepaid cards for mobile-phone airtime, mobile phones could be trialed to pay electricity bills, similar to M-Pesa in Kenya.
References
Gaba, Kwawu M., Charles J. Cormier, and John A. Rogers. 2011. Energy Intensive Sectorsof the Indian Economy: Path to Low Carbon Development. Washington, DC:
World Bank.
Kulichenko, Nataliya, and Ashish Khanna. 2013. Development of Local Supply Chain: A Critical Link for Concentrated Solar Power in India.New Delhi: World Bank.
Ministry of Power. 2005. National Electricity Policy. New Delhi: Government of India.
———. 2013. State Distribution Utilities First Annual Integrated Rating. New Delhi:Government of India.
Press Information Bureau. 2011. Per Capita Power Consumption. New Delhi: Governmentof India.
Sargsyan, Gevorg, Mikul Bhatia, Sudeshna G. Banerjee, Krishnan Raghunathan, and RuchiSoni. 2011. Unleashing the Potential of Renewable Energy in India. Washington, DC:
World Bank.
Unnikrishnan, Dinesh, and Makarand Gadgil. 2011. “State-Run Banks Stop Fresh Loansto Loss-Making Power Utilities.” Live Mint , October 24. http://www.livemint.com
/Companies/Le7TRnX7unqQ9DLCByz0qM/Staterun-banks-stop-fresh-loans-to-lossmaking-power-utilit.html.

8/20/2019 WB - India Discom Report - Feb15
http://slidepdf.com/reader/full/wb-india-discom-report-feb15 42/255
8/20/2019 WB - India Discom Report - Feb15
http://slidepdf.com/reader/full/wb-india-discom-report-feb15 43/255
19More Power to India • http://dx.doi.org/10.1596/978-1-4648-0233-1
Introduction
Two decades after the government initiated reforms designed to bring about a
commercial orientation in the power sector and to improve service delivery,
India’s power sector has made major strides in extending access, adding generat-
ing capacity, and developing competitive power markets and a national transmis-
sion network, to name but a few. But inadequate and unreliable power supply
continues to constrain India’s growth, inclusion, job creation, and aspirations for
middle-income-country status. Despite significant achievements in the policy
and regulatory space, much of the government’s power sector reform agenda has
yet to be accomplished. A comprehensive analysis of these achievements and the
remaining challenges, particularly since the passage of the landmark ElectricityAct of 2003, forms the core of this report.
The report reviews the evolution of the power sector since 2003 through the
lens of distribution. The fortunes of the whole sector are closely intertwined with
the distribution business segment because it is the link between the sector and
consumers: it is where revenues are generated that feed back to the upstream
generation and transmission segments. The continuing underperformance of dis-
tribution has prevented the sector from providing adequate and reliable power
to consumers. Several outside stakeholders—from central and state governments
and regulators to lenders—affect distribution performance. At the same time,
inefficiencies and lack of coordination in the upstream segments1 add to the costof power purchased by distribution companies, which is passed on to consumers.
This report also highlights successful cases from different parts of India that may
warrant adaptation and adoption elsewhere, as well as provides some lessons
learned.
Underpinning this report are five standalone background papers, each exploring
an issue in depth (see appendix P). These issues include access to electricity,
domestic tariff subsidies, sector and utility governance, private sector participation,
and the operational and financial performance of utilities. These papers inform the
report’s analysis of different dimensions of distribution sector performance at the
state level.

8/20/2019 WB - India Discom Report - Feb15
http://slidepdf.com/reader/full/wb-india-discom-report-feb15 44/255
20 Introduction
More Power to India • http://dx.doi.org/10.1596/978-1-4648-0233-1
A key contribution of this sector work is a comprehensive, user-friendly
utility- and state-level dataset that has provided the information base for the
analysis in the background papers and this report (see appendix O). Information
has been collated from a wide array of publicly available data sources augmentedwith data obtained through primary research, including interviews with repre-
sentatives of utilities and regulators. The main public data sources accessed
include the Power Finance Corporation reports on “Performance of State Power
Utilities” covering 2003–11 (PFC 2006, 2007, 2008, 2009, 2010, 2011, 2012);
the state electricity regulatory commission (SERC) and utility annual reports,
annual accounts, and websites; and the National Sample Survey in various years.
The dataset covers 116 power utilities and 28 SERCs across all 29 states from
2003 to 2011. In addition, customized questionnaires were used to understand
reform implementation, corporate governance in utilities, and regulatory perfor-
mance. Finally, a detailed field study was carried out in 2012 to understand theperformance and challenges faced in implementing the government’s rural elec-
trification program, the Rajiv Gandhi Grameen Vidyutikaran Yojana. The dataset
will be made publicly available to academics, students, researchers, and others
through the World Bank’s Open Data platform.
This report is divided into seven chapters. Chapter 1 reviews the evolution of
sector policies and institutions since the start of sector reforms in the early 1990s.
Chapter 2 lays out the sector’s achievements—contrasted in chapter 3 by the
deterioration of distribution finances, the drivers of which are detailed in
chapter 4. Chapter 5 presents the implementation status of sector reforms and
the impact on sector outcomes, while chapter 6 discusses the governance andinstitutional factors that circumscribe utility operations and thus affect perfor-
mance. Chapter 7 presents a succinct set of suggestions to support the sector’s
pursuit of a commercial orientation and efficient service delivery.
One of this report’s objectives has been to showcase the diversity of experi-
ences in India—the heterogeneity among states ensures that they have many
opportunities to learn from each other. More widely, wherever relevant, the
report presents lessons from global experience.
Note
1. While beyond this report’s scope, a considerable body of work has analyzed the options for moving India to a lower carbon growth path and increasing the share of renewable energy in India’s generation mix. See, for example, World Bank studies on Unleashing the Potential of Renewable Energy in India (Sargsyan and others 2011); Energy Intensive Sectors of the Indian Economy: Path to Low Carbon Development (Gaba, Cormier, and Rogers 2011); and Development of Local Supply Chain: A Critical Link for Concentrated Solar Power in India (Kulichenko and Khanna 2013).
ReferencesGaba, Kwawu M., Charles J. Cormier, and John A. Rogers. 2011. Energy Intensive Sectors
of the Indian Economy: Path to Low Carbon Development. Washington, DC: World Bank.
8/20/2019 WB - India Discom Report - Feb15
http://slidepdf.com/reader/full/wb-india-discom-report-feb15 45/255
Introduction 21
More Power to India • http://dx.doi.org/10.1596/978-1-4648-0233-1
Kulichenko, Nataliya, and Ashish Khanna. 2013. Development of Local Supply Chain: A Critical Link for Concentrated Solar Power in India.New Delhi: World Bank.
PFC (Power Finance Corporation). 2006. The Performance of State Power Utilities for theYears 2002–03 to 2004–05. New Delhi.
———. 2007. The Performance of State Power Utilities for the Years 2003–04 to 2005–06.New Delhi.
———. 2008. The Performance of State Power Utilities for the Years 2004–05 to 2006–07.New Delhi.
———. 2009. The Performance of State Power Utilities for the Years 2005–06 to 2007–08.New Delhi.
———. 2010. The Performance of State Power Utilities for the Years 2006–07 to 2008–09.New Delhi.
———. 2011. The Performance of State Power Utilities for the Years 2007–08 to 2009–10.
New Delhi.———. 2012. The Performance of State Power Utilities for the Years 2008–09 to 2010–11.
New Delhi.
Sargsyan, Gevorg, Mikul Bhatia, Sudeshna G. Banerjee, Krishnan Raghunathan, and RuchiSoni. 2011. Unleashing the Potential of Renewable Energy in India. Washington, DC:
World Bank.

8/20/2019 WB - India Discom Report - Feb15
http://slidepdf.com/reader/full/wb-india-discom-report-feb15 46/255

8/20/2019 WB - India Discom Report - Feb15
http://slidepdf.com/reader/full/wb-india-discom-report-feb15 47/255
23More Power to India • http://dx.doi.org/10.1596/978-1-4648-0233-1
Evolution of Policies and Institutions
The importance of reliable electricity for economic development is most
apparent when it is absent—and so becomes a constraint. Inadequate and
unreliable power supply can result in lost revenues for enterprises and reduce
the welfare of household consumers. That power quality affects economic
development is supported by recent literature.1
For India a 2012 survey by the Federation of Indian Chambers of
Commerce and Industry found that the lack of affordable and quality power
has been a serious detriment to the health and stability of Indian industry,
especially small and medium enterprises. The most likely source of backup
power is a generator, for which enterprises pay Rs 12–16 ($0.22–0.30)per kilowatt-hour (kWh)—far more than they pay for grid electricity,
Rs 5.0–8.5/kWh ($0.09–0.16/kWh). The costs incurred to mitigate the
impact of power outages range from around Rs 1,000 ($18.70) to more than
Rs 40,000 ($749) a day for each firm. Of surveyed firms, 61 percent said
that they were willing to pay more for reliable and uninterrupted power
(FICCI 2012). A 2006 World Bank investment climate assessment indi-
cated an almost 7 percent loss in production or merchandise value due to
power outages or surges from the public grid (World Bank 2006). Forty-one
percent of surveyed firms owned generators (figure 1.1), which supplied
around 10 percent of their electricity. Thirty-two percent of firms identifiedelectricity as a major constraint to their business operation.
On a different dimension, India ranks 99th in the world on the ease of getting
a connection for a typical commercial establishment. On average, it requires
seven different procedures spanning 67 days—against 28 days in China, 35 in
Thailand, 36 in Singapore, and 41 in Hong Kong SAR, China (World Bank
2013a). For households, not only do 300 million Indians live without electricity
but those who do have power receive an inadequate and unreliable supply, espe-
cially in rural areas. India’s per capita annual consumption, 780 kWh, is among
the world’s lowest, and far below that in other emerging economies.
The power sector will need to develop consistent with the demands placedon it by the country’s growth trajectory, urbanization patterns over time, and
C H A P T E R 1

8/20/2019 WB - India Discom Report - Feb15
http://slidepdf.com/reader/full/wb-india-discom-report-feb15 48/255
24 Evolution of Policies and Institutions
More Power to India • http://dx.doi.org/10.1596/978-1-4648-0233-1
consumer aspirations. In the next two decades India will face immense
challenges if it is to sustain the 8–10 percent economic growth required to
end poverty and achieve human development goals. According to the
Planning Commission, by 2032 India will require a total primary energy
supply of some 80 million terajoules, meaning the country will have to almost
triple its 2010 supply of 29 million terajoules—a compound annual growth
rate of 4.7 percent. India will also need to raise installed electricity capacity
by at least five or six times 2003–04 levels to meet demand in 2031–32(Planning Commission 2006). Powering India will thus require the emergence
of a commercially viable sector.
Figure 1.1 Impact of Inadequate and Unreliable Electricity on Firms
Source: World Bank 2013b.
Note: All surveys are for latest available year; India’s enterprise survey is for 2006.
0
1
2
3
4
5
6
7
8
9
10
World South Asia India
a. Losses due to
electrical outages
% o
f a n n u a l s a l e s
0
5
10
15
20
25
30
35
40
45
World South Asia India
b. Share of firms owning or
sharing a generator
P e r c e n t
0
10
20
30
40
50
60
World South Asia India
c. Share of firms identifying
electricity as a major constraint
P e r c e n t
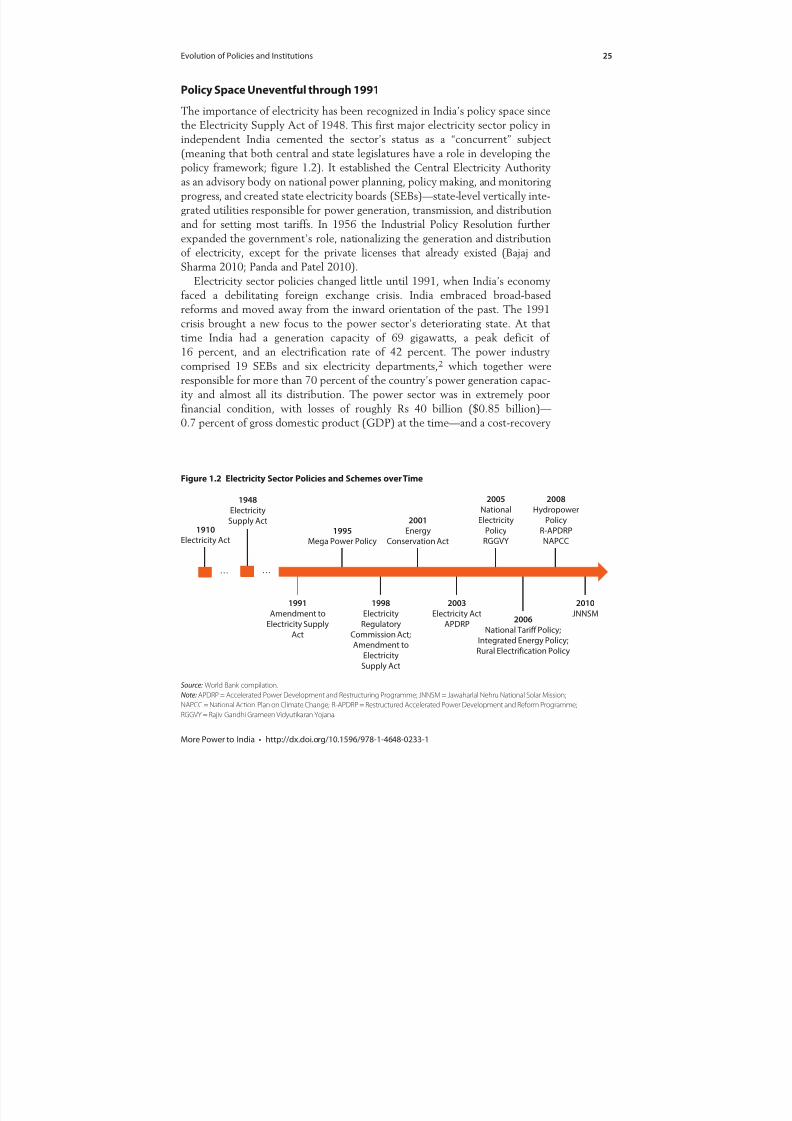
8/20/2019 WB - India Discom Report - Feb15
http://slidepdf.com/reader/full/wb-india-discom-report-feb15 49/255
Evolution of Policies and Institutions 25
More Power to India • http://dx.doi.org/10.1596/978-1-4648-0233-1
Policy Space Uneventful through 1991
The importance of electricity has been recognized in India’s policy space since
the Electricity Supply Act of 1948. This first major electricity sector policy in
independent India cemented the sector’s status as a “concurrent” subject(meaning that both central and state legislatures have a role in developing the
policy framework; figure 1.2). It established the Central Electricity Authority
as an advisory body on national power planning, policy making, and monitoring
progress, and created state electricity boards (SEBs)—state-level vertically inte-
grated utilities responsible for power generation, transmission, and distribution
and for setting most tariffs. In 1956 the Industrial Policy Resolution further
expanded the government’s role, nationalizing the generation and distribution
of electricity, except for the private licenses that already existed (Bajaj and
Sharma 2010; Panda and Patel 2010).
Electricity sector policies changed little until 1991, when India’s economy
faced a debilitating foreign exchange crisis. India embraced broad-based
reforms and moved away from the inward orientation of the past. The 1991
crisis brought a new focus to the power sector’s deteriorating state. At that
time India had a generation capacity of 69 gigawatts, a peak deficit of
16 percent, and an electrification rate of 42 percent. The power industry
comprised 19 SEBs and six electricity departments,2 which together were
responsible for more than 70 percent of the country’s power generation capac-
ity and almost all its distribution. The power sector was in extremely poor
financial condition, with losses of roughly Rs 40 billion ($0.85 billion)—0.7 percent of gross domestic product (GDP) at the time—and a cost-recovery
Figure 1.2 Electricity Sector Policies and Schemes over Time
Source: World Bank compilation.Note: APDRP = Accelerated Power Development and Restructuring Programme; JNNSM = Jawaharlal Nehru National Solar Mission;
NAPCC = National Action Plan on Climate Change; R-APDRP = Restructured Accelerated Power Development and Reform Programme;
RGGVY = Rajiv Gandhi Grameen Vidyutikaran Yojana.
1948
Electricity
Supply Act
1991
Amendment to
Electricity Supply
Act
1995
Mega Power Policy
1998
Electricity
Regulatory
Commission Act;
Amendment to
Electricity
Supply Act
2003
Electricity Act
APDRP
2005
National
Electricity
Policy
RGGVY
2006
National Tariff Policy;
Integrated Energy Policy;
Rural Electrification Policy
2008
Hydropower
Policy
R-APDRP
NAPCC
2010
JNNSM
…
2001
Energy
Conservation Act
1910
Electricity Act
…
8/20/2019 WB - India Discom Report - Feb15
http://slidepdf.com/reader/full/wb-india-discom-report-feb15 50/255
26 Evolution of Policies and Institutions
More Power to India • http://dx.doi.org/10.1596/978-1-4648-0233-1
rate of only 79 percent. It also suffered from high technical inefficiencies,
including transmission and distribution losses of around 23 percent and a plant
load factor of only 54 percent. Peak and energy deficits were 18.8 percent and
7.7 percent, respectively.The crisis brought home the importance of power sector development,
setting in motion the first phase of a power sector reform agenda. The agenda
initially focused on boosting generation capacity, notably by opening the
sector to foreign and private investment. Amendments to the Electricity
Supply Act, passed in 1991, allowed private players, including foreign inves-
tors, to come in as independent power producers and enter into long-term
supply contracts—power purchase agreements—with utilities. But the reform
agenda stopped there, doing nothing to address the underlying drivers of the
sector’s poor performance or to dilute state government control over the
politically sensitive distribution sector.
Sector Restructuring and Independent Regulation in the 1990s
Against this background, in 1996 Orissa became the first state to embrace what
was then a new, and bold, power sector restructuring model for India. At the time
the Orissa State Electricity Board was the worst performing SEB of any major
state. Blackouts and brownouts were common, and only about 20 percent of the
state’s households were connected to the grid.
Orissa vertically restructured and privatized its power sector—unbundling
its SEB into private companies each responsible for one of generation, trans-mission, or distribution—and created an independent body for regulating
and determining tariffs for the electricity sector.3 In many ways the forma-
tion of successor utilities, in part through the government’s statutory finan-
cial and employee transfer schemes, and the creation of the Orissa Electricity
Regulatory Commission were significant contributions to the Indian power
sector.
As India’s economy continued to face crippling power shortages, states started
restructuring their SEBs and establishing state electricity regulatory commissions
(SERCs) under their own state reform legislative initiatives.
4
The ElectricityRegulatory Commission Act of 1998 set up the Central Electricity Regulatory
Commission (CERC) and brought regulatory consistency to the states
(figure 1.3).
The government also implemented measures to address the frequent grid
disruptions and low voltage that had resulted in suboptimal operations and wors-
ened the quality of service delivery. In 2000 the CERC announced a new system
of scheduling and dispatch of power based on an availability-based tariff (ABT).
The system was designed to bring about grid discipline and promote scientific
settling for contracted sale and purchase of power. The ABT has three charges: a
fixed charge; an energy charge linked to day-ahead injection and overdrawal ofpower; and a penalty—the unscheduled interchange charge—for deviation from
day-ahead commitments that could disturb the grid frequency.5

8/20/2019 WB - India Discom Report - Feb15
http://slidepdf.com/reader/full/wb-india-discom-report-feb15 51/255
Evolution of Policies and Institutions 27
More Power to India • http://dx.doi.org/10.1596/978-1-4648-0233-1
The Lead-Up to the Electricity Act of 2003
Despite significant reform and restructuring during the 1990s, state utilities
continued to underperform commercially. By 2001/02 power sector commercial
losses had risen to about Rs 250 billion ($6 billion, or 1.5 percent of GDP).
Technical and operational indicators had deteriorated, and cost recovery had
actually declined. Energy and peak deficits remained substantial despite
impressive additions to capacity, because demand growth outstripped growth in
supply.6
Payment arrears to the central public sector undertakings, such as the NationalThermal Power Corporation, Power Grid Corporation of India, and others,
mounted. To avoid hurting the creditworthiness of these undertakings, in 2001
Figure 1.3 Timeline of Sector Unbundling and Establishment of Regulatory Commissions
Source: Pargal and Mayer 2013.
Unbundling date
State electricity regulatory
commission creation date
Both
1996
Orissa
1998
GujaratHaryana
Madhya Pradesh
Uttar Pradesh
1999
Andhra Pradesh
Delhi
KarnatakaMaharashtra
Punjab
Tamil Nadu
West Bengal
2000
Andhra Pradesh
Rajasthan
Uttar Pradesh
2002
Chhattisgarh
DelhiKerala
Other
2003
Jharkhand
2004
AssamMeghalaya
Uttarakhand Tripura
2005
Bihar
Gujarat
Madhya Pradesh
Maharashtra
Manipur/Mizoram
2009
Chhattisgarh
2010
Himachal PradeshMeghalaya
Punjab
Tamil Nadu
2007
West Bengal
2001
Assam
Himachal Pradesh
Uttarakhand
2006
2008
Goa
Nagaland
2011
Other
Sikkim
1997
2012
Bihar
8/20/2019 WB - India Discom Report - Feb15
http://slidepdf.com/reader/full/wb-india-discom-report-feb15 52/255
28 Evolution of Policies and Institutions
More Power to India • http://dx.doi.org/10.1596/978-1-4648-0233-1
an expert committee under the leadership of M.S. Ahluwalia, Deputy Chairman
of the Planning Commission, recommended and implemented a bailout plan for
the sector. To restore the sector to financial solvency, the bailout converted Rs
350 billion ($7.4 billion) of debt (outstanding arrears of the SEBs) into stategovernment bonds and waived 50 percent of the interest outstanding. Thus a
number of states began 2002/03 with accumulated losses that were lower than
in the previous fiscal year: 2002/03 served as the starting point for the reforms
that followed.
In 2003 the central government consolidated the piecemeal reforms and
state initiatives of the 1990s into the Electricity Act of 2003 (EA 2003, or
EA)—a single, progressive, market-oriented framework. The EA 2003 aimed
to move the sector toward enhanced competition, accountability, and com-
mercial viability. Several policy measures followed the EA and elaborated on
its provisions, including the National Electricity Policy, 2005; the NationalTariff Policy, 2006; the Integrated Energy Policy, 2006; and the Hydropower
Policy, 2008.
Notable initiatives were the delicensing of thermal generation, the introduc-
tion of power trading as a licensed activity, the strong emphasis on competition,
the adoption of multiyear tariff frameworks, and the promotion of rural electri-
fication and renewable energy (box 1.1). Most important, the EA was predicated
on open access for transmission and distribution with the aim of creating an
environment in which generators could sell to the highest bidder and consumers
could buy power from the most economical source.7
The EA mandated unbundling and corporatizing utilities and establishingindependent regulators as steps that would increase utility accountability for
performance to external stakeholders, limit state government control, and create
internal accountability for results. The EA thus paved the way for a fundamental
Box 1.1 Reform Areas of the Electricity Act of 2003 (and Subsequent Policies):
Objectives and Mandates
Introduction of Competition• Unbundle state electricity boards. The distribution, generation, transmission, and dispatch
functions are required to be independently operated.
• Delicense generation. The requirement for a license from the Central Electricity Authority to
build and operate generation plants was removed (except for hydropower projects above a
given investment threshold, of Rs 25 billion [$0.4 billion] as of April 2012; CEA 2012), making
it easier for any generation company to enter the market.
• Move to open access. The state electricity regulatory commission (SERC) is required to pro-
vide notification of nondiscriminatory open access that permits the sale of electricity directly
to consumers outside power purchase agreements with distributors, providing choice and
network access to power procurers and end-users.
box continues next page
8/20/2019 WB - India Discom Report - Feb15
http://slidepdf.com/reader/full/wb-india-discom-report-feb15 53/255
Evolution of Policies and Institutions 29
More Power to India • http://dx.doi.org/10.1596/978-1-4648-0233-1
• Introduce power trading. Specify regulations (such as fixed ceilings on trading margins) to
allow trading of electricity. SERCs issue trading licenses for intrastate trade, while interstate
trading is licensed by the Central Electricity Regulatory Commission. SERCs also introduce
scheduling discipline into this multiseller market by establishing intrastate availability-
based tariffs.
Enhanced Accountability and Transparency
• Establish the SERC. State power sectors are required to be independent and regulated by
SERCs, whose powers and responsibilities include setting tariffs and passing (and in
some cases implementing) regulations. SERCs are meant to be independent from the
state and central governments, though the center still directs the national electricity and
tariff policy.• Establish a national Appellate Tribunal. The central government established this entity to
oversee reform implementation throughout the country and address any disputes or
appeals against regulators.
• Corporatize utilities. Utilities are required to register as corporate entities, thus becoming
subject to the requirements of the Companies Act of 1956.
Cost Recovery and Commercial Viability
• Improve operational efficiency. State utilities are required to achieve 100 percent metering
within two years, adopt stringent measures to deter electricity theft, and reduce cross-
subsidies in a phased manner.• Ensure competitive procurement. The National Tariff Policy (2006) specified that distribution
licensees should procure long-term power through tariff-based bids under a multiyear
tariff framework with a control period of three to five years. Two different procurement
modes (Case 1 and Case 2) were developed.
• Move to cost recovery. SERCs are required to establish progressive tariff-setting mechanisms
to bring tariffs to cost-recovery levels. SERCs should also issue multiyear tariffs to increase
pricing certainty.
Access to Electricity and Rural Electrification
• Ensure universal access. The Rural Electrification Policy (2006) set an ambitious goal of provid-
ing electricity for all by 2009, and required state governments to formulate a Rural
Electrification Plan within six months of passing the policy.
• Affordability and availability. The Rural Electrification Policy also aimed for quality and reli-
able power at reasonable rates and provision of a minimum lifeline consumption of
1 kilowatt-hour a day per household by 2012.
Improved Customer Service and Affordability of Supply
• Reduce losses. Meet aggregate technical and commercial loss reduction targets set by the
SERCs.
• Establish service standards. Establish and enforce standards of performance; establish a
consumer grievance redressal forum and appoint an ombudsman.
Box 1.1 Reform Areas of the Electricity Act of 2003 (and Subsequent Policies): Objectives
and Mandates (continued)
box continues next page
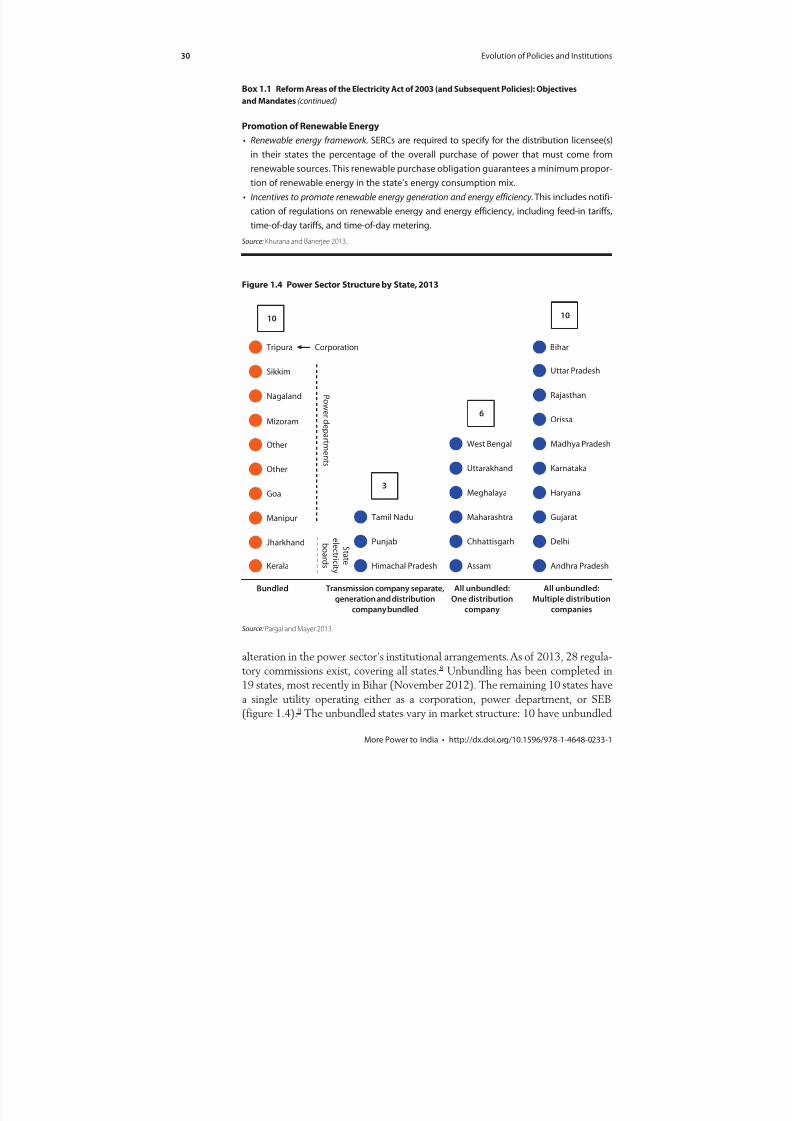
8/20/2019 WB - India Discom Report - Feb15
http://slidepdf.com/reader/full/wb-india-discom-report-feb15 54/255
30 Evolution of Policies and Institutions
More Power to India • http://dx.doi.org/10.1596/978-1-4648-0233-1
alteration in the power sector’s institutional arrangements. As of 2013, 28 regula-
tory commissions exist, covering all states.8 Unbundling has been completed in
19 states, most recently in Bihar (November 2012). The remaining 10 states havea single utility operating either as a corporation, power department, or SEB
(figure 1.4).9 The unbundled states vary in market structure: 10 have unbundled
Promotion of Renewable Energy
• Renewable energy framework. SERCs are required to specify for the distribution licensee(s)
in their states the percentage of the overall purchase of power that must come from
renewable sources. This renewable purchase obligation guarantees a minimum propor-
tion of renewable energy in the state’s energy consumption mix.
• Incentives to promote renewable energy generation and energy efficiency. This includes notifi-
cation of regulations on renewable energy and energy efficiency, including feed-in tariffs,
time-of-day tariffs, and time-of-day metering.
Source: Khurana and Banerjee 2013.
Box 1.1 Reform Areas of the Electricity Act of 2003 (and Subsequent Policies): Objectives
and Mandates (continued)
Source: Pargal and Mayer 2013.
Figure 1.4 Power Sector Structure by State, 2013
Bundled Transmission company separate,
generation and distribution
company bundled
All unbundled:
One distribution
company
All unbundled:
Multiple distribution
companies
Himachal Pradesh
Punjab
Tamil Nadu
Assam
Chhattisgarh
Maharashtra
Meghalaya
Uttarakhand
West Bengal
Andhra Pradesh
Delhi
Gujarat
Haryana
Karnataka
Madhya Pradesh
Orissa
Rajasthan
Uttar Pradesh
10
3
6
10
Kerala
Jharkhand
Manipur
Goa
Other
Other
Mizoram
Nagaland
Sikkim
Tripura
P ow er d e p a r t m en t s
S t a t e
e
l e c t r i c i t y
b o a r d s
Corporation Bihar

8/20/2019 WB - India Discom Report - Feb15
http://slidepdf.com/reader/full/wb-india-discom-report-feb15 55/255
Evolution of Policies and Institutions 31
More Power to India • http://dx.doi.org/10.1596/978-1-4648-0233-1
into multiple distribution companies (discoms), 6 have unbundled into only one
discom, and 3 have separated transmission but kept generation and distribution
as one company.
An important milestone has been the development of interstate transmis-sion regulations. A robust transmission system is needed for the seamless flow
of electricity across regions and states. The EA has thus mandated the CERC
to regulate interstate transmission to serve the emerging needs of competition
and a multiple player regime in the sector. In 2010 the CERC introduced the
“smart transmission tariff,” a point-of-connection system to replace the
regional “postage stamp” method of allocating transmission charges among
different users, with the added objective of relieving grid congestion (see
appendix A).
Sustainability and energy security have been spotlighted through India’s
National Action Plan on Climate Change, released in 2008. The action plancomprises eight national missions to enable progress on various fronts, with
several goals relevant to the electricity sector, such as increasing the share of
solar energy in the generation mix and raising energy efficiency through indus-
trial energy savings, greater adoption of efficient appliances, and demand-side
management.
Notes
1. Much recent work has focused on Africa: Calderón and Servén (2010) report that the quality of and access to electricity services promote growth and reduce inequality in Africa. Andersen and Dalgaard (2013) conclude that power outages have a debili-tating impact on an economy, lowering long-run gross domestic product per capita by 2.86 percent in Africa. Further, Dinkelman (2013) presents evidence supporting electrification and employment, suggesting that South Africa’s massive rollout of electrification in rural areas had a positive impact on female employment.
2. SEBs and power departments fulfill similar roles, but an SEB is a government-owned company, while a power department is a department of the state government.
3. The World Bank supported Orissa’s reform process through a $350 million assistance package.
4. Delhi, Rajasthan, Haryana, Uttar Pradesh, Karnataka, Gujarat, Assam, and Madhya Pradesh adopted state-level legislation to reform their power sectors, with Delhi, notably, succeeding in privatizing distribution. These early cases informed the design of the Electricity Act of 2003.
5. The unscheduled interchange mechanism is part of the short-term market, along with bilateral trading and power exchanges.
6. The share of the power sector in national plan outlays declined, despite rising power sector investments, due to larger government budgets.
7. The EA defines open access as the “nondiscriminatory provision for the use of trans-mission lines or distribution system or associated facilities with such lines or system
by any licensee or consumer or a person engaged in generation in accordance with the regulation specified by the Appropriate [electricity regulatory] Commission” (Ministryof Law and Justice 2003).

8/20/2019 WB - India Discom Report - Feb15
http://slidepdf.com/reader/full/wb-india-discom-report-feb15 56/255
32 Evolution of Policies and Institutions
More Power to India • http://dx.doi.org/10.1596/978-1-4648-0233-1
8. Manipur and Mizoram share a single SERC, as do Goa and the union territories.
9. The EA does not require state power departments to unbundle.
References
Andersen, Thomas B., and Carl-Johan Dalgaard. 2013. “Power Outages and EconomicGrowth in Africa.” Energy Economics 38 (C): 19–23.
Bajaj, H. L., and D. Sharma. 2010. Power Sector Reforms in India. New Delhi. http://www.researchgate.net/publication/224694683_Power_Sector_Reforms_in_India.
Calderón, César, and Luis Servén. 2010. “Infrastructure and Economic Development in Sub-Saharan Africa.” Policy Research Working Paper 4712, World Bank, Washington, DC.
CEA (Central Electricity Authority). 2012. Guidelines for Formulation of Detailed ProjectReports for Hydro Electric Schemes, Their Acceptance and Examination for Concurrence.
New Delhi.Dinkelman, Taryn. 2013. The Effects of Rural Electrification on Employment: New Evidence
from South Africa. Princeton, NJ: Princeton University.
FICCI (Federation of Indian Chambers of Commerce and Industry). 2012. Lack of Affordable and Quality Power: Shackling India’s Growth Story. New Delhi.
Khurana, Mani, and Sudeshna G. Banerjee. 2013. “Beyond Crisis: Financial andOperational Performance of India’s Power Sector.” Background paper for this report.
World Bank, Washington, DC.
Ministry of Law and Justice. 2003. The Electricity Act, 2003. New Delhi: Government ofIndia.
Panda, Aurobinda, and Atul Patel. 2010. “Competition Law and Competition IssuesAffecting the Energy Sector in India.” Journal of Infrastructure Development 3 (2).
Pargal, Sheoli, and Kristy Mayer. 2013. “Governance of Indian Power Sector Utilities: AnOngoing Journey.” Background paper for this report. World Bank, Washington, DC.
Planning Commission. 2006. Integrated Energy Policy—Report of the Expert Committee.New Delhi: Government of India.
World Bank. 2006. The Investment Climate in South Asia. Washington, DC.
———. 2013a. Doing Business 2014: Understanding Regulations for Small and Medium-SizeEnterprises. Washington, DC.
———. 2013b. World Bank Enterprise Surveys. Washington, DC. http://data.worldbank.org/data-catalog/enterprise-surveys.
8/20/2019 WB - India Discom Report - Feb15
http://slidepdf.com/reader/full/wb-india-discom-report-feb15 57/255
33More Power to India • http://dx.doi.org/10.1596/978-1-4648-0233-1
Impressive Achievements in Many
Dimensions
Enabled by the Electricity Act of 2003 (EA 2003, or EA) and a favorable
economic environment, India’s power sector has progressed immensely since
2003, with major achievements in all segments. And India’s successes and experi-
ence are likely to be of interest to other developing countries, mainly because its
approach has emphasized learning by doing, adaptation, and “localization” of
solutions.
Access to electricity expanded rapidly over the last decade, with an emphasis
on connecting poor and rural households to the power grid. An ambitious
program of capacity development in generation and transmission was imple-
mented and an enabling environment developed for the private sector.
A wholesale market for power was created, riding on open access and licensed
trading activities. Competitive procurement of new thermal and solar generation
capacity was a departure from the prior practice of procurement through memo-
randums of understanding (MoUs) for thermal power and predetermined feed-in
tariffs for solar power. Competition among bidders quickly led to steep price
reductions. Distribution, too, saw notable successes through experimentation
with innovative models that have improved efficiency and that point to ways to
harness the private sector for cutting losses and improving service delivery.
A Tripling of Generation Capacity
The policy focus on ramping up generation capacity to power India’s growth
took on added emphasis in the 1990s with an amendment to the Electricity
Supply Act in 1991 and the introduction in 1995 of the Mega Power Policy.
Generation capacity grew threefold between 1992 and 2012. Today, installed
capacity stands at 214 gigawatts (GW), making India’s the fifth-largest power
system in the world after China, the United States, Japan, and the Russian
Federation. Recent capacity addition, particularly in the 11th Five-Year Plan(2007–12) at 54 GW, has been the highest in the country’s history (figure 2.1),
but even then, it was only 69 percent of the 78 GW target set at the beginning
C H A P T E R 2

8/20/2019 WB - India Discom Report - Feb15
http://slidepdf.com/reader/full/wb-india-discom-report-feb15 58/255
34 Impressive Achievements in Many Dimensions
More Power to India • http://dx.doi.org/10.1596/978-1-4648-0233-1
of the plan period. The best implementation performance, by far, was in the 7th
Plan, when 96 percent of the target was met.
The private sector has emerged as a major driver of generation growth,
responsible for installed generation capacity in 1991–92 of 2.5 GW (3 percent
of total generating capacity), which grew to 62.5 GW by the end of 2012
(29 percent of the total)—a 17 percent compound annual growth rate. This rate
of increase is likely to continue in the near future, given the stock under construc-
tion and development. In the 12th Plan (2012–17) the private sector is expected
to play an even more important role, contributing half the targeted capacity of
88 GW.The generation segment has attracted the most interest from private players,
largely Indian companies. Over the years a solid private developer base has
Figure 2.1 Generation Capacity
Source: Mukherjee 2013.
b. Generation capacity added over time
0 50,000 100,000 150,000 200,000 250,000
2012
2006
2001
1992
MW
Private State Central
P e r c e n t a g e o f t a r g e t m e t
a. Incremental capacity in each plan period
0
10
20
30
40
50
60
70
80
90
100
0
10
20
30
40
50
60
70
80
90
1st 2nd 3rd 4th 5th 6th 7th 8th 9th 10th 11th
G W
Installed Target Achievement
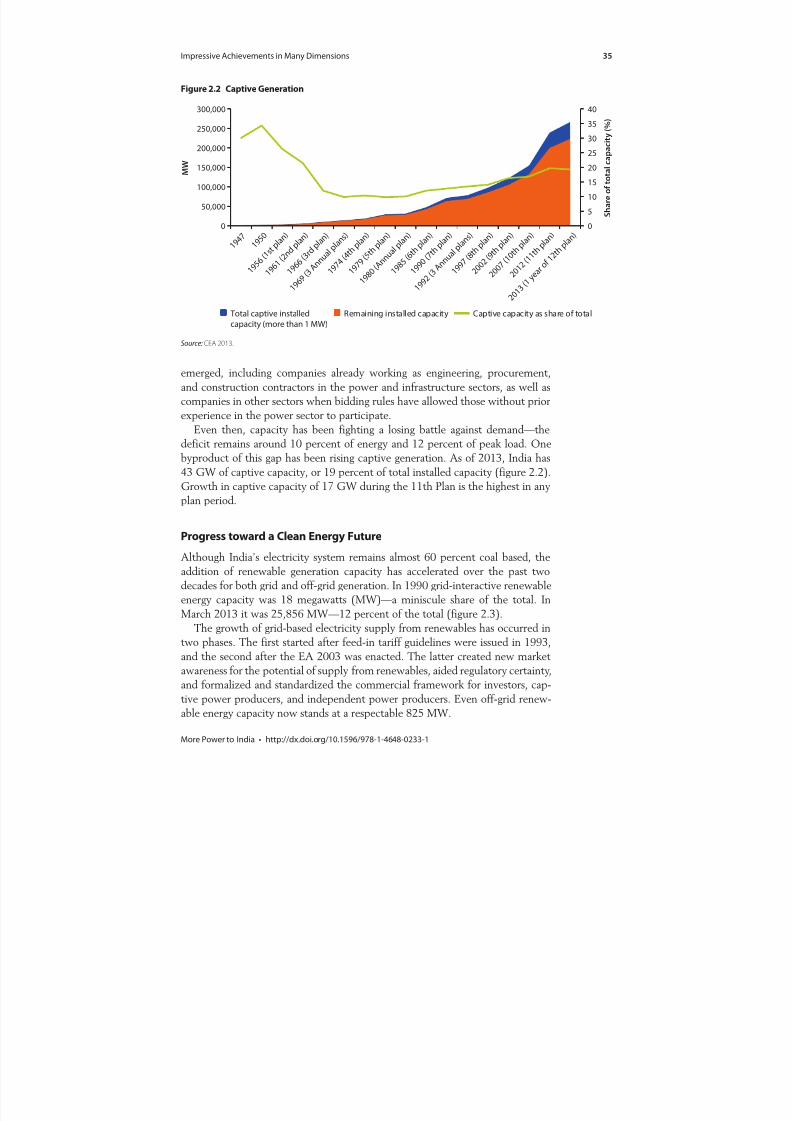
8/20/2019 WB - India Discom Report - Feb15
http://slidepdf.com/reader/full/wb-india-discom-report-feb15 59/255
Impressive Achievements in Many Dimensions 35
More Power to India • http://dx.doi.org/10.1596/978-1-4648-0233-1
emerged, including companies already working as engineering, procurement,
and construction contractors in the power and infrastructure sectors, as well as
companies in other sectors when bidding rules have allowed those without prior
experience in the power sector to participate.Even then, capacity has been fighting a losing battle against demand—the
deficit remains around 10 percent of energy and 12 percent of peak load. One
byproduct of this gap has been rising captive generation. As of 2013, India has
43 GW of captive capacity, or 19 percent of total installed capacity (figure 2.2).
Growth in captive capacity of 17 GW during the 11th Plan is the highest in any
plan period.
Progress toward a Clean Energy Future
Although India’s electricity system remains almost 60 percent coal based, the
addition of renewable generation capacity has accelerated over the past two
decades for both grid and off-grid generation. In 1990 grid-interactive renewable
energy capacity was 18 megawatts (MW)—a miniscule share of the total. In
March 2013 it was 25,856 MW—12 percent of the total (figure 2.3).
The growth of grid-based electricity supply from renewables has occurred in
two phases. The first started after feed-in tariff guidelines were issued in 1993,
and the second after the EA 2003 was enacted. The latter created new market
awareness for the potential of supply from renewables, aided regulatory certainty,
and formalized and standardized the commercial framework for investors, cap-tive power producers, and independent power producers. Even off-grid renew-
able energy capacity now stands at a respectable 825 MW.
Figure 2.2 Captive Generation
Source: CEA 2013.
0
5
10
15
20
25
30
35
40
0
50,000
100,000
150,000
200,000
250,000
300,000
S h a r e o f t o t a l c a p a c i t y
( % )
M W
Total captive installed
capacity (more than 1 MW)
Remaining installed capacity Captive capacity as share of total
1 9 4 7
1 9 5 0
1
9 5 6 ( 1
s t p l a
n )
1 9 6
1 ( 2
n d p l a
n )
1 9 6
6 ( 3
r d p l a
n )
1 9 6 9 ( 3
A n n
u a l p
l a n s )
1 9 8 0 ( A n n
u a l p
l a n )
1 9 9 2 ( 3
A n n
u a l p
l a n s )
1 9 8
5 ( 6 t h
p l a
n )
1 9 9
0 ( 7 t h
p l a
n )
1 9 9
7 ( 8 t h
p l a
n )
2 0 0
2 ( 9 t h
p l a
n )
2 0 0 7
( 1 0 t h
p l a n )
2 0 1 2
( 1 1 t h
p l a n )
2 0 1 3
( 1 y e a
r o f 1
2 t h
p l a n )
1 9 7
4 ( 4 t h
p l a
n )
1 9 7
9 ( 5 t h
p l a
n )
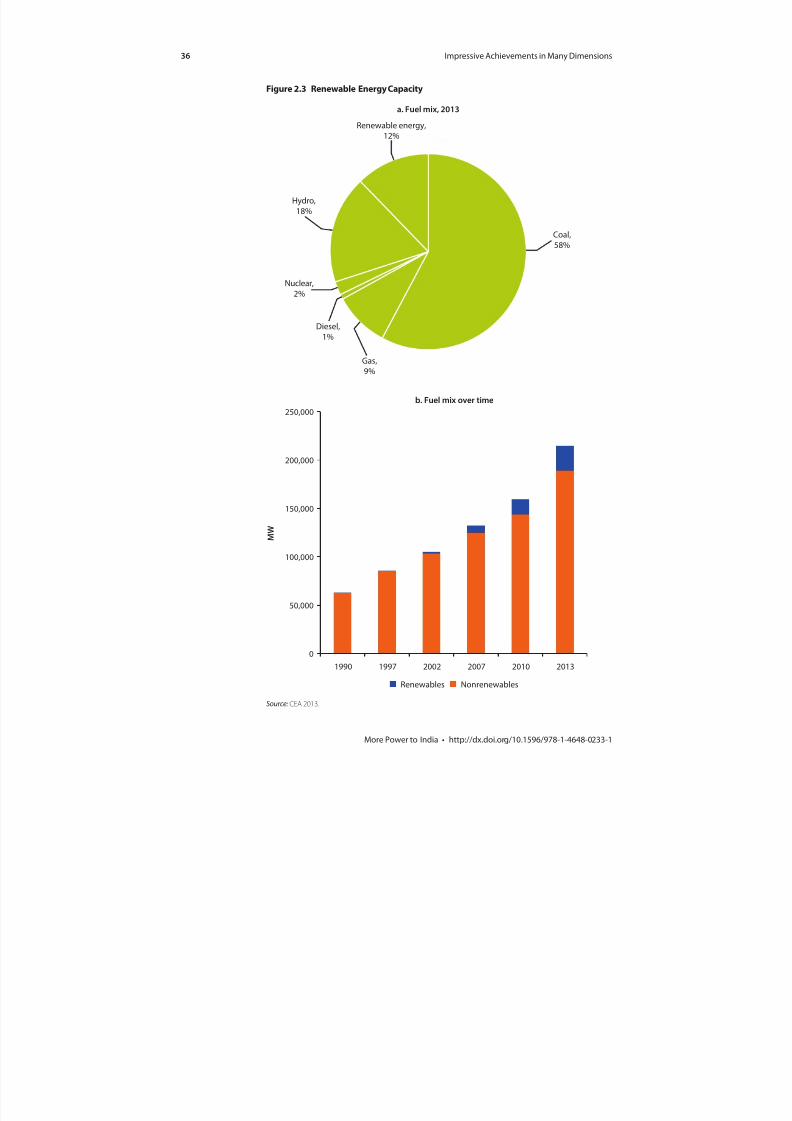
8/20/2019 WB - India Discom Report - Feb15
http://slidepdf.com/reader/full/wb-india-discom-report-feb15 60/255
36 Impressive Achievements in Many Dimensions
More Power to India • http://dx.doi.org/10.1596/978-1-4648-0233-1
Figure 2.3 Renewable Energy Capacity
Source: CEA 2013.
a. Fuel mix, 2013
Renewable energy,
12%
Coal,
58%
Gas,
9%
Diesel,
1%
Nuclear,
2%
Hydro,
18%
b. Fuel mix over time
0
50,000
100,000
150,000
200,000
250,000
1990 1997 2002 2007 2010 2013
M W
NonrenewablesRenewables
8/20/2019 WB - India Discom Report - Feb15
http://slidepdf.com/reader/full/wb-india-discom-report-feb15 61/255
Impressive Achievements in Many Dimensions 37
More Power to India • http://dx.doi.org/10.1596/978-1-4648-0233-1
On a broader scale the ability of transmission systems to support the ramp-up
in generation capacity remains to be seen, as does its adeptness in ensuring evacu-
ation from new renewable energy facilities (see appendix B).
India has immense hydropower potential, but 68 percent of this potential hasyet to be fully harnessed. In fact, the share of hydropower in the generation mix
has actually dropped from 44 percent in 1970 to about 18 percent in 2012. Only
5.5 GW of hydropower, of a targeted 15.0 GW, was added during the 11th Plan,
with most projects delayed three years or more. The 12th Plan ambitiously aims
to add 9 GW of hydropower capacity, 28 percent of it by the private sector.
A recent report prepared for the World Bank elaborates on the opportunities and
challenges in attracting private sector participation to hydropower (Mercados
EMI 2012; see appendix C).
The focus on clean energy includes energy efficiency. A major milestone
was the Energy Conservation Act of 2001 and its amendment in 2010, whichmandated building codes, standards, and labels for appliances and stipulated
industry norms. The government estimates that the energy efficiency market
has an investment potential of $10 billion and that improving energy
efficiency could save up to 184 billion kilowatt-hours (kWh) and 149 mil-
lion tons of carbon dioxide in just five years (Delio, Lall, and Singh 2009).
Industry is expected to account for more than 25 percent of these estimated
savings. Under the Bureau of Energy Efficiency, India became the first devel-
oping country to adopt an energy efficiency trading scheme that uses mar-
ket-based mechanisms (Singh 2013). The largest of these mechanisms was
the Perform, Achieve and Trade program, started in 2012. It mandatesenergy-intensity targets for the most energy-intensive industrial sectors, cov-
ering 478 large firms in eight industries and aiming to save an estimated
24 million tons of oil equivalent by 2020, or 6 percent of today’s energy
consumption.
Bachat Lamp Yojana, another initiative, involves replacing incandescent lamps
with subsidized compact fluorescent lamps. The target is to distribute 400 million
compact fluorescent lamps for an estimated saving of 6,000 MW. However, the
Bachat Lamp Yojana has moved forward only in Andhra Pradesh, Delhi,
Karnataka, Kerala, and Punjab, with just Kerala achieving its target (Hector andAnand 2012). The crash of the carbon market has made it difficult to subsidize
the initiative under the Clean Development Mechanism.
Creating a National Grid
India’s transmission system has come a long way since the mid-1960s when it
consisted of five separate regional grids. It was not until the 1998 amendment to
the Electricity Supply Act that the basic framework for coordinated planning and
development was established and private participation in transmission was
allowed. India has since moved toward establishing a nationally synchronizedgrid to smooth variations in regional demand and supply and building interre-
gional links. All five regional grids—Northern, Eastern, Southern, Western, and
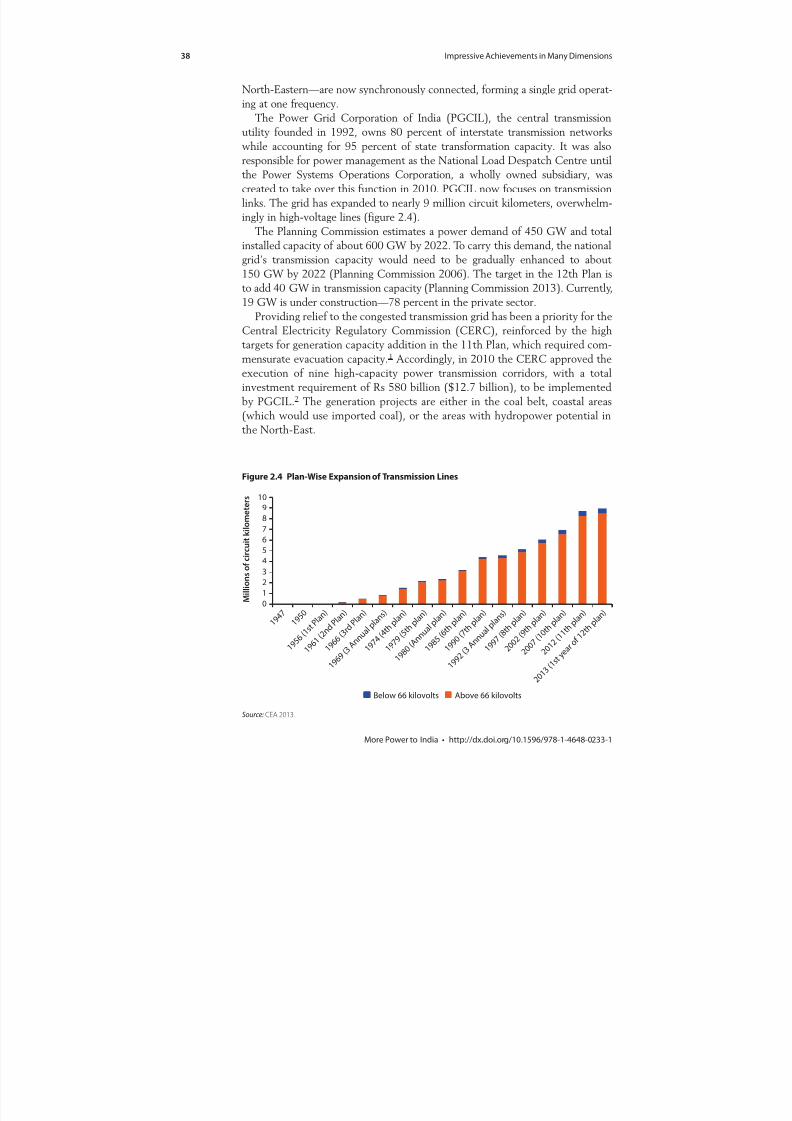
8/20/2019 WB - India Discom Report - Feb15
http://slidepdf.com/reader/full/wb-india-discom-report-feb15 62/255
38 Impressive Achievements in Many Dimensions
More Power to India • http://dx.doi.org/10.1596/978-1-4648-0233-1
North-Eastern—are now synchronously connected, forming a single grid operat-
ing at one frequency.
The Power Grid Corporation of India (PGCIL), the central transmission
utility founded in 1992, owns 80 percent of interstate transmission networkswhile accounting for 95 percent of state transformation capacity. It was also
responsible for power management as the National Load Despatch Centre until
the Power Systems Operations Corporation, a wholly owned subsidiary, was
created to take over this function in 2010. PGCIL now focuses on transmission
links. The grid has expanded to nearly 9 million circuit kilometers, overwhelm-
ingly in high-voltage lines (figure 2.4).
The Planning Commission estimates a power demand of 450 GW and total
installed capacity of about 600 GW by 2022. To carry this demand, the national
grid’s transmission capacity would need to be gradually enhanced to about
150 GW by 2022 (Planning Commission 2006). The target in the 12th Plan isto add 40 GW in transmission capacity (Planning Commission 2013). Currently,
19 GW is under construction—78 percent in the private sector.
Providing relief to the congested transmission grid has been a priority for the
Central Electricity Regulatory Commission (CERC), reinforced by the high
targets for generation capacity addition in the 11th Plan, which required com-
mensurate evacuation capacity.1 Accordingly, in 2010 the CERC approved the
execution of nine high-capacity power transmission corridors, with a total
investment requirement of Rs 580 billion ($12.7 billion), to be implemented
by PGCIL.2 The generation projects are either in the coal belt, coastal areas
(which would use imported coal), or the areas with hydropower potential inthe North-East.
Figure 2.4 Plan-Wise Expansion of Transmission Lines
Source: CEA 2013.
0
1
2
3
4
5
6
7
8
9
10
1 9 4 7
1 9 5 0
1 9 5 6
( 1 s t
P l a
n )
1 9 6 1
( 2 n d
P l a
n )
1 9 6 6
( 3 r d
P l a
n )
1 9 6 9
( 3 A n n
u a l p
l a n s )
1 9 7 4
( 4 t h
p l a
n )
1 9 7 9
( 5 t h
p l a
n )
1 9 8 0
( A n n
u a l p
l a n )
1 9 8 5
( 6 t h
p l a
n )
1 9 9 0
( 7 t h
p l a
n )
1 9 9 2
( 3 A n n
u a l p
l a n s )
1 9 9 7
( 8 t h
p l a
n )
2 0 0 2
( 9 t h
p l a
n )
2 0 0 7
( 1 0 t h
p l a n )
2 0 1 2
( 1 1 t h
p l a n )
2 0 1 3
( 1 s t
y e a r
o f 1
2 t h
p l a n )
M i l l i o n s o f c i r c u i t k i l o m e t e r s
Above 66 kilovoltsBelow 66 kilovolts
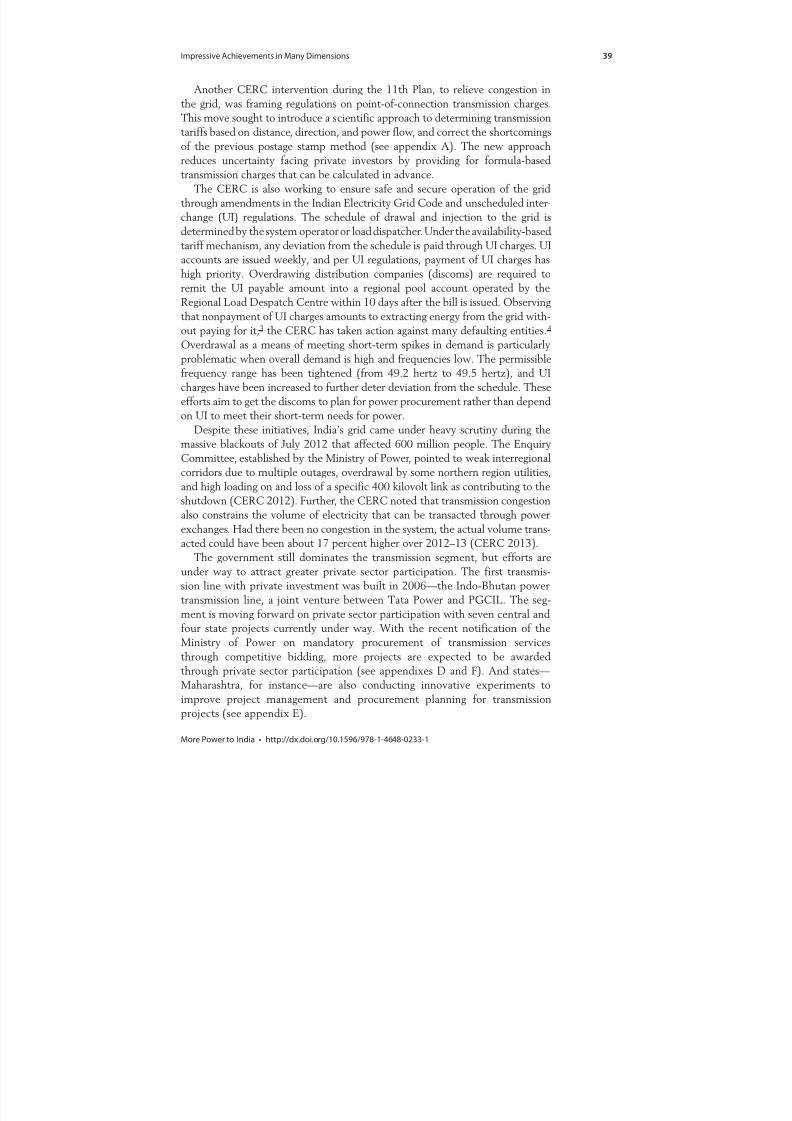
8/20/2019 WB - India Discom Report - Feb15
http://slidepdf.com/reader/full/wb-india-discom-report-feb15 63/255
Impressive Achievements in Many Dimensions 39
More Power to India • http://dx.doi.org/10.1596/978-1-4648-0233-1
Another CERC intervention during the 11th Plan, to relieve congestion in
the grid, was framing regulations on point-of-connection transmission charges.
This move sought to introduce a scientific approach to determining transmission
tariffs based on distance, direction, and power flow, and correct the shortcomingsof the previous postage stamp method (see appendix A). The new approach
reduces uncertainty facing private investors by providing for formula-based
transmission charges that can be calculated in advance.
The CERC is also working to ensure safe and secure operation of the grid
through amendments in the Indian Electricity Grid Code and unscheduled inter-
change (UI) regulations. The schedule of drawal and injection to the grid is
determined by the system operator or load dispatcher. Under the availability-based
tariff mechanism, any deviation from the schedule is paid through UI charges. UI
accounts are issued weekly, and per UI regulations, payment of UI charges has
high priority. Overdrawing distribution companies (discoms) are required toremit the UI payable amount into a regional pool account operated by the
Regional Load Despatch Centre within 10 days after the bill is issued. Observing
that nonpayment of UI charges amounts to extracting energy from the grid with-
out paying for it,3 the CERC has taken action against many defaulting entities.4
Overdrawal as a means of meeting short-term spikes in demand is particularly
problematic when overall demand is high and frequencies low. The permissible
frequency range has been tightened (from 49.2 hertz to 49.5 hertz), and UI
charges have been increased to further deter deviation from the schedule. These
efforts aim to get the discoms to plan for power procurement rather than depend
on UI to meet their short-term needs for power.Despite these initiatives, India’s grid came under heavy scrutiny during the
massive blackouts of July 2012 that affected 600 million people. The Enquiry
Committee, established by the Ministry of Power, pointed to weak interregional
corridors due to multiple outages, overdrawal by some northern region utilities,
and high loading on and loss of a specific 400 kilovolt link as contributing to the
shutdown (CERC 2012). Further, the CERC noted that transmission congestion
also constrains the volume of electricity that can be transacted through power
exchanges. Had there been no congestion in the system, the actual volume trans-
acted could have been about 17 percent higher over 2012–13 (CERC 2013).The government still dominates the transmission segment, but efforts are
under way to attract greater private sector participation. The first transmis-
sion line with private investment was built in 2006—the Indo-Bhutan power
transmission line, a joint venture between Tata Power and PGCIL. The seg-
ment is moving forward on private sector participation with seven central and
four state projects currently under way. With the recent notification of the
Ministry of Power on mandatory procurement of transmission services
through competitive bidding, more projects are expected to be awarded
through private sector participation (see appendixes D and F). And states—
Maharashtra, for instance—are also conducting innovative experiments toimprove project management and procurement planning for transmission
projects (see appendix E).
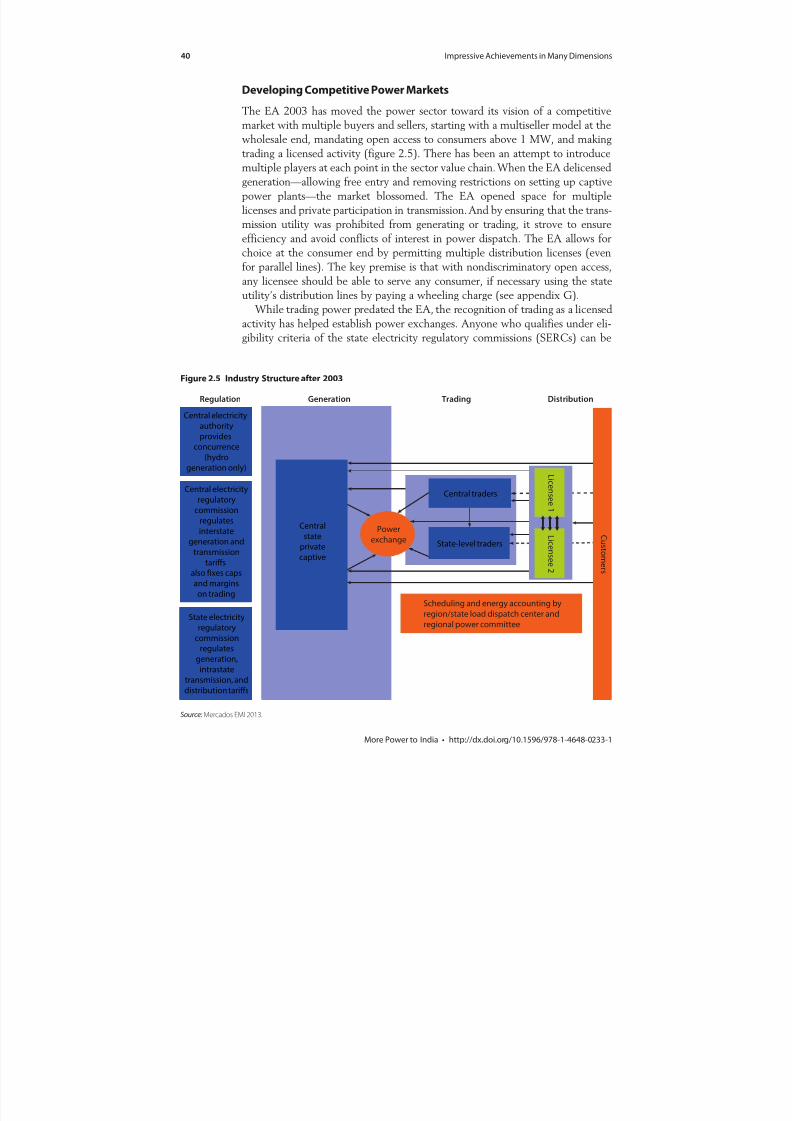
8/20/2019 WB - India Discom Report - Feb15
http://slidepdf.com/reader/full/wb-india-discom-report-feb15 64/255
40 Impressive Achievements in Many Dimensions
More Power to India • http://dx.doi.org/10.1596/978-1-4648-0233-1
Developing Competitive Power Markets
The EA 2003 has moved the power sector toward its vision of a competitive
market with multiple buyers and sellers, starting with a multiseller model at the
wholesale end, mandating open access to consumers above 1 MW, and makingtrading a licensed activity (figure 2.5). There has been an attempt to introduce
multiple players at each point in the sector value chain. When the EA delicensed
generation—allowing free entry and removing restrictions on setting up captive
power plants—the market blossomed. The EA opened space for multiple
licenses and private participation in transmission. And by ensuring that the trans-
mission utility was prohibited from generating or trading, it strove to ensure
efficiency and avoid conflicts of interest in power dispatch. The EA allows for
choice at the consumer end by permitting multiple distribution licenses (even
for parallel lines). The key premise is that with nondiscriminatory open access,
any licensee should be able to serve any consumer, if necessary using the state
utility’s distribution lines by paying a wheeling charge (see appendix G).
While trading power predated the EA, the recognition of trading as a licensed
activity has helped establish power exchanges. Anyone who qualifies under eli-
gibility criteria of the state electricity regulatory commissions (SERCs) can be
Figure 2.5 Industry Structure after 2003
Source: Mercados EMI 2013.
Generation Trading DistributionRegulation
Central electricity
authority
provides
concurrence
(hydro
generation only)
Central electricity
regulatory
commission
regulates
interstate
generation and
transmission
tariffs
also fixes caps
and margins
on trading
State electricity
regulatory
commission
regulates
generation,
intrastate
transmission, and
distribution tariffs
Central
state
privatecaptive
Central traders
Power
exchange
Scheduling and energy accounting by
region/state load dispatch center and
regional power committee
L i c en s e e1
C u
s t om er s
L i c en s e e2
State-level traders
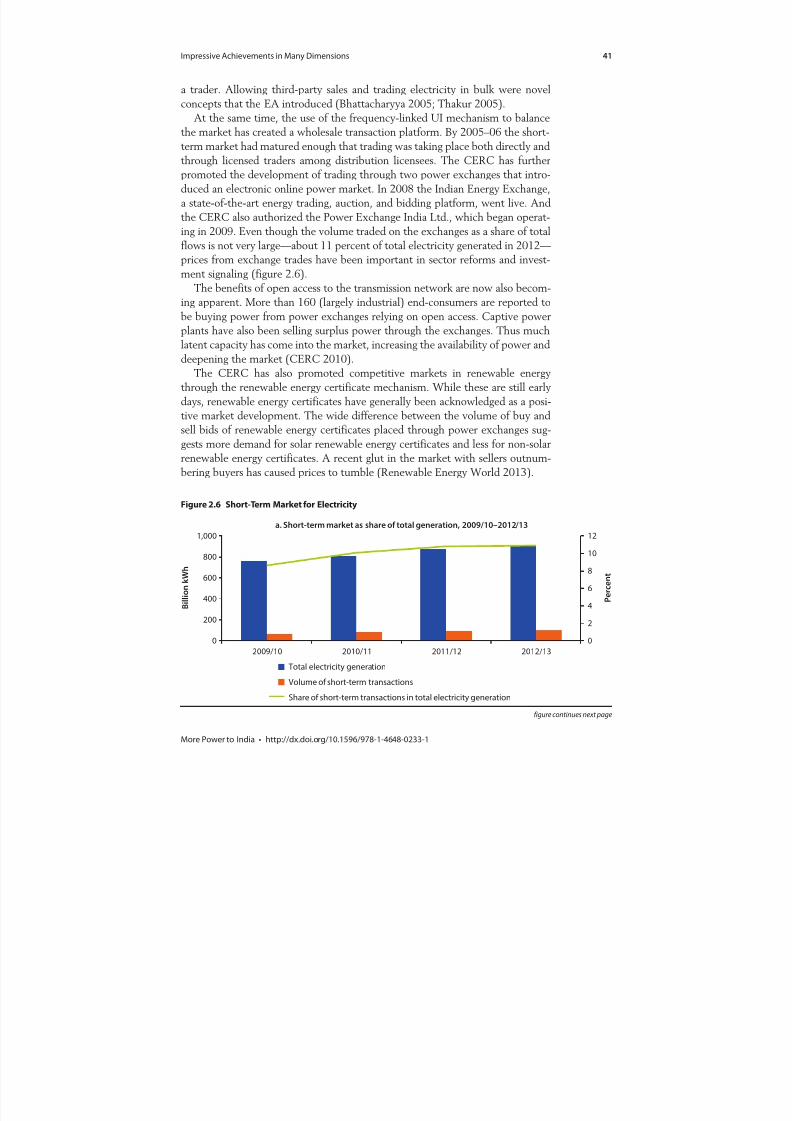
8/20/2019 WB - India Discom Report - Feb15
http://slidepdf.com/reader/full/wb-india-discom-report-feb15 65/255
Impressive Achievements in Many Dimensions 41
More Power to India • http://dx.doi.org/10.1596/978-1-4648-0233-1
a trader. Allowing third-party sales and trading electricity in bulk were novel
concepts that the EA introduced (Bhattacharyya 2005; Thakur 2005).
At the same time, the use of the frequency-linked UI mechanism to balance
the market has created a wholesale transaction platform. By 2005–06 the short-term market had matured enough that trading was taking place both directly and
through licensed traders among distribution licensees. The CERC has further
promoted the development of trading through two power exchanges that intro-
duced an electronic online power market. In 2008 the Indian Energy Exchange,
a state-of-the-art energy trading, auction, and bidding platform, went live. And
the CERC also authorized the Power Exchange India Ltd., which began operat-
ing in 2009. Even though the volume traded on the exchanges as a share of total
flows is not very large—about 11 percent of total electricity generated in 2012—
prices from exchange trades have been important in sector reforms and invest-
ment signaling (figure 2.6).The benefits of open access to the transmission network are now also becom-
ing apparent. More than 160 (largely industrial) end-consumers are reported to
be buying power from power exchanges relying on open access. Captive power
plants have also been selling surplus power through the exchanges. Thus much
latent capacity has come into the market, increasing the availability of power and
deepening the market (CERC 2010).
The CERC has also promoted competitive markets in renewable energy
through the renewable energy certificate mechanism. While these are still early
days, renewable energy certificates have generally been acknowledged as a posi-
tive market development. The wide difference between the volume of buy andsell bids of renewable energy certificates placed through power exchanges sug-
gests more demand for solar renewable energy certificates and less for non-solar
renewable energy certificates. A recent glut in the market with sellers outnum-
bering buyers has caused prices to tumble (Renewable Energy World 2013).
Figure 2.6 Short-Term Market for Electricity
0
2
4
6
8
10
12
0
200
400
600
800
1,000
2009/10 2010/11 2011/12 2012/13
P e r c e n t
B i l l i o n k W h
Total electricity generation
Volume of short-term transactionsShare of short-term transactions in total electricity generation
a. Short-term market as share of total generation, 2009/10–2012/13
figure continues next page

8/20/2019 WB - India Discom Report - Feb15
http://slidepdf.com/reader/full/wb-india-discom-report-feb15 66/255
42 Impressive Achievements in Many Dimensions
More Power to India • http://dx.doi.org/10.1596/978-1-4648-0233-1
Competitive Power Procurement
Thermal Capacity AdditionIn 2005 the government issued tariff-based competitive-bidding guidelines
under Section 63 of the EA 2003 to create competition in generation and to helpreduce the cost of supplied power. Earlier, discoms (and state electricity boards)
had purchased power under negotiated contracts or MoUs with independent
power producers, ensuring the producers a 16 percent return on equity. Now,
competitive bidding became the norm for medium-term procurement (one to
seven years) and long-term procurement (seven years and more) of base-load,
peak-load, and seasonal power requirements.
For ultra-mega power plants (UMPPs) with a capacity of at least 4,000 MW,
India adopted a novel approach. The Power Finance Corporation was appointed
the nodal agency to conduct the competitive bidding for selecting a developer
for each project through tariff-based competitive bidding. Twelve proposedUMPPs were identified, of which four projects were awarded to developers
based on a two-stage competitive-bidding process. The private sector’s response
Source: CERC 2013.
b. Composition of short-term market, 2012/13
Bilateral between
distribution companies,15%
Power exchange
transactions,
24%
Unscheduled interchangetransactions,
25%
Bilateral through
traders, 36%
Figure 2.6 Short-Term Market for Electricity (continued)
8/20/2019 WB - India Discom Report - Feb15
http://slidepdf.com/reader/full/wb-india-discom-report-feb15 67/255
Impressive Achievements in Many Dimensions 43
More Power to India • http://dx.doi.org/10.1596/978-1-4648-0233-1
to UMPP projects has been excellent, both in participating and in bringing
down the overall tariff. Reliance Power has won major UMPP projects, with
Sasan UMPP having the lowest bid of all (Rs 1.19/kWh, $0.025/kWh), while the
highest bid was for the imported-coal-fueled Mundra UMPP (Rs 2.26/kWh,$0.048/kWh).
Apart from UMPPs, two routes are open for competitive procurement of
power by discoms—Case 1 and Case 2, depending on whether the state utility
procuring the power also specifies the location of the plant and the fuel source.5
The bidder takes on greater risk under Case 1 because the responsibility for
technology, fuel, and land, as well as necessary clearances, is retained, unlike
under Case 2. As expected, Case 2 bids have generally been lower than Case 1
bids. Almost 20 GW of thermal power has been procured through the Case 1
route (though only two Case 1 projects have so far been commissioned). Gujarat
and Maharashtra are the leading states, having procured 5.8 GW and 5.1 GW ofpower, respectively, over 2007–10. Seven state bids have been made for power
procurement through the Case 2 route, at 10.4 GW of power procured. The
major procuring states under Case 2 are Uttar Pradesh (4.5 GW) and Punjab
(3.3 GW).
In 2011 the CERC issued statutory advice to initiate the transition of public
sector projects to tariff-based competitive bidding. Before deciding, it carried out
a detailed exercise comparing the tariffs from competitively bid projects with
those from a hypothetical equivalent plant contracted under a MoU and operat-
ing at the same efficiency as a National Thermal Power Corporation plant
(CERC 2010). In most cases the competitively bid Case 1 tariff was much lowerthan the tariff that would have come in under the MoU. For Case 2 bids all the
competitively bid tariffs were far lower than under the MoU.
The steep rise in fuel (imported coal) prices starting in 2011/12 brought to
the fore key weaknesses of competitive procurement. In hindsight, bidders alone
were never going to be able to assume fuel (particularly coal) price risks fully, and
a more balanced risk allocation ought to have been put in place. Celebrations
about competitively bid tariffs emerging around Rs 1.50 ($0.03) per kWh were
premature, as these very contracts are now seeking regulatory relief to retroac-
tively adopt a pass-through clause for fuel costs. The government is amending thestandard-bidding documents for Case 2 power procurement, asking bidders to
quote only the capacity charge for a station heat rate of 2,300 kilocalories per
unit (which will be verified by an independent engineer), and allowing all other
charges to be passed through. This shared-risk approach is believed to put a
lower burden on consumers than the previous model.
Thermal capacity addition has been handicapped by a lack of coordination
between the ministries of coal and power. There are large gaps between the
required (for plants commissioned during the 11th plan that had been awarded
domestic coal linkages by Coal India) and the available coal supply. Coal India’s
inability to supply the amount required implies a need to review and re-optimizethe allocation of coal linkages and rely on imports in the interim. In July 2012,
Coal India reported plans to import up to 30 million metric tons of coal to meet
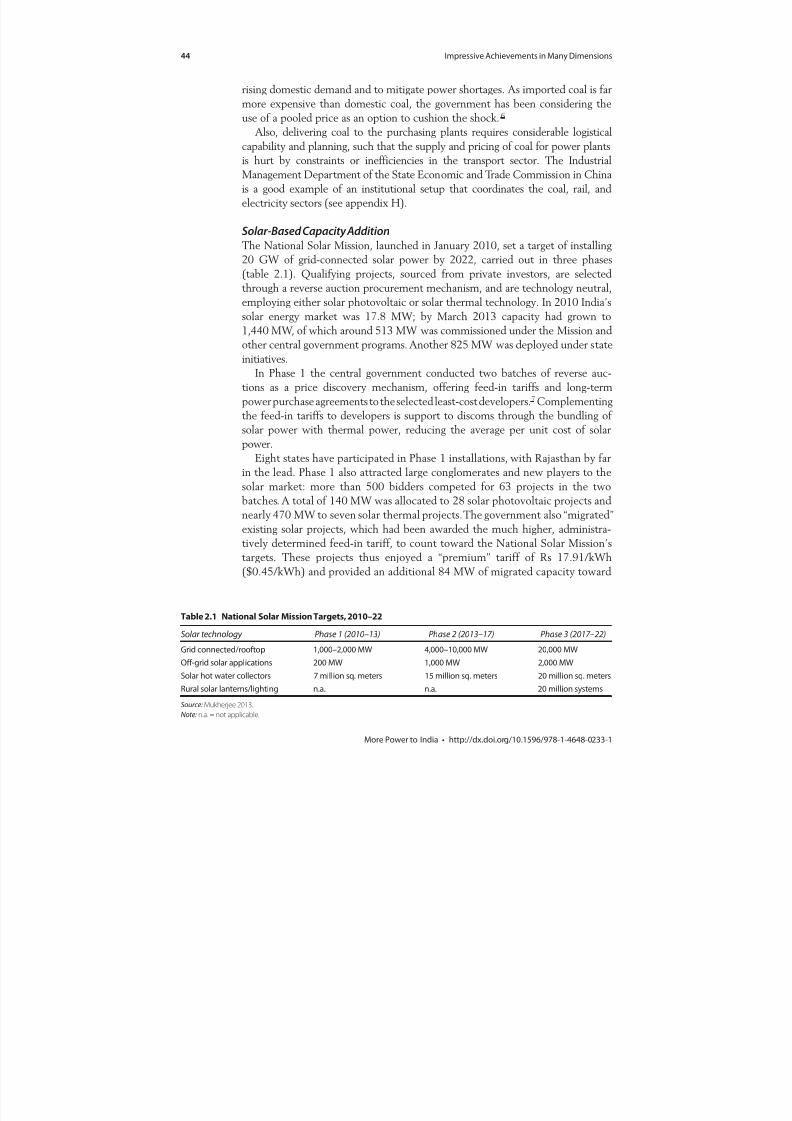
8/20/2019 WB - India Discom Report - Feb15
http://slidepdf.com/reader/full/wb-india-discom-report-feb15 68/255
44 Impressive Achievements in Many Dimensions
More Power to India • http://dx.doi.org/10.1596/978-1-4648-0233-1
rising domestic demand and to mitigate power shortages. As imported coal is far
more expensive than domestic coal, the government has been considering the
use of a pooled price as an option to cushion the shock.6
Also, delivering coal to the purchasing plants requires considerable logisticalcapability and planning, such that the supply and pricing of coal for power plants
is hurt by constraints or inefficiencies in the transport sector. The Industrial
Management Department of the State Economic and Trade Commission in China
is a good example of an institutional setup that coordinates the coal, rail, and
electricity sectors (see appendix H).
Solar-Based Capacity AdditionThe National Solar Mission, launched in January 2010, set a target of installing
20 GW of grid-connected solar power by 2022, carried out in three phases
(table 2.1). Qualifying projects, sourced from private investors, are selectedthrough a reverse auction procurement mechanism, and are technology neutral,
employing either solar photovoltaic or solar thermal technology. In 2010 India’s
solar energy market was 17.8 MW; by March 2013 capacity had grown to
1,440 MW, of which around 513 MW was commissioned under the Mission and
other central government programs. Another 825 MW was deployed under state
initiatives.
In Phase 1 the central government conducted two batches of reverse auc-
tions as a price discovery mechanism, offering feed-in tariffs and long-term
power purchase agreements to the selected least-cost developers.7 Complementing
the feed-in tariffs to developers is support to discoms through the bundling ofsolar power with thermal power, reducing the average per unit cost of solar
power.
Eight states have participated in Phase 1 installations, with Rajasthan by far
in the lead. Phase 1 also attracted large conglomerates and new players to the
solar market: more than 500 bidders competed for 63 projects in the two
batches. A total of 140 MW was allocated to 28 solar photovoltaic projects and
nearly 470 MW to seven solar thermal projects. The government also “migrated”
existing solar projects, which had been awarded the much higher, administra-
tively determined feed-in tariff, to count toward the National Solar Mission’stargets. These projects thus enjoyed a “premium” tariff of Rs 17.91/kWh
($0.45/kWh) and provided an additional 84 MW of migrated capacity toward
Table 2.1 National Solar Mission Targets, 2010–22
Solar technology Phase 1 (2010–13) Phase 2 (2013–17) Phase 3 (2017–22)
Grid connected/rooftop 1,000–2,000 MW 4,000–10,000 MW 20,000 MW
Off-grid solar applications 200 MW 1,000 MW 2,000 MW
Solar hot water collectors 7 million sq. meters 15 million sq. meters 20 million sq. meters
Rural solar lanterns/lighting n.a. n.a. 20 million systems
Source: Mukherjee 2013.
Note: n.a. = not applicable.
8/20/2019 WB - India Discom Report - Feb15
http://slidepdf.com/reader/full/wb-india-discom-report-feb15 69/255
Impressive Achievements in Many Dimensions 45
More Power to India • http://dx.doi.org/10.1596/978-1-4648-0233-1
the overall Mission targets. As the lowest bid price was Rs 12/kWh ($0.32/
kWh), the migrated projects cost the government an additional Rs 5 ($0.10)
per kWh relative to price discovery through the bidding process. Making
headlines in late 2011, competitive bidding for the Mission’s second batch ofprojects in Phase 1 drove down prices for grid-connected solar energy to as low
as Rs 7.49 ($0.15) per kWh, approaching grid parity with fossil-fuel-powered
electricity.
Massive Expansion of Access
Since the late 1960s India has prioritized electrification through the Rural
Electrification Corporation (REC) and new funding initiatives. Under each five-
year plan the government has strived to ensure appreciable investments in elec-
trification through appropriate national initiatives and programs. In 2004 itannounced a goal of universal electricity access within the following five years
as part of the National Electricity Policy. Progress toward these goals gained
momentum with the 2005 launch of a flagship program, the Rajiv Gandhi
Grameen Vidyutikaran Yojana (RGGVY), consolidating all ongoing rural electri-
fication programs. The Ministry of Power retained the REC as the nodal agency
for implementing RGGVY, while the Rural Electrification Policy of 2006 laid
out the guidelines, definitions, and institutional structure of RGGVY.
RGGVY aims to create a rural electricity backbone, electrifying all villages
and habitations of more than 100 people, installing small generators and distribu-
tion networks where extending the grid is not cost-effective, and providing freeelectricity connections to households below the poverty line. India has spent
almost Rs 50 billion (around $1 billion) a year on RGGVY since its inception,
and the program is now continuing into the 12th Plan. Today, 92 percent of
villages are connected to the electric grid, and the goal is to be close to universal
village electrification by 2017.
The program’s performance in expanding connections has been impressive.
The electrification rate rose 15 percentage points in 10 years to 74 percent in
2010. New consumers were mainly in rural areas, where electricity access rates
jumped 18 percentage points to 66 percent. About 28 million people a yearstarted to use electricity over the decade (2000–10). Of these new users,
70 percent live in rural areas (figure 2.7a) and the gains were distributed fairly
evenly across the income ladder (figure 2.7b).
The growth in the electrification rate was moderated by an annual population
increase of about 1.5 percent during the decade: about 65 percent of the incre-
mental increase in access was just to keep up with population growth. But India
still added 99 million electricity users above the population increase, and the
access rate rose by 2.4 percent of the population each year over the period.
This growth rate was similar across geographic areas and income quintiles
(figure 2.8). In most states the electrified population grew 2–4 percent annually.Access growth in the large states of Uttar Pradesh and Bihar was the lowest
among all states, at just about 1 percent, below the rate of population growth.

8/20/2019 WB - India Discom Report - Feb15
http://slidepdf.com/reader/full/wb-india-discom-report-feb15 70/255
46 Impressive Achievements in Many Dimensions
More Power to India • http://dx.doi.org/10.1596/978-1-4648-0233-1
As a result the absolute numbers of nonelectrified people in these states increased
in 2000–10.
Despite this huge increase in electrification, India is home to the world’s largest
access deficit. The rural and poorest consumers constitute the bulk of India’s
311 million people without electricity. About 93 percent of India’s nonelectrified
population—289 million people—lives in rural areas. More than two-thirds of the
nonelectrified population is also among the poorest 40 percent of the population,
depending on alternative lighting fuels, primarily kerosene and candles, which
have potentially harmful safety, environmental, and health effects.The overall electrification rate, 74 percent, trails the village electrification rate,
92 percent. Disaggregation of this gap suggests that both demand- and supply-side
Figure 2.7 Number of People Gaining Access, 2000–10
Source: Banerjee and others 2013.
Note: Numbers in parentheses are number of people (in millions).
a. By location
Rural
(199)
Urban
(82)
b. By income quintile
Second
quintile
(59)
Richest
quintile(47)
Fourth
quintile
(61)
Third
quintile
(66)
Poorest
quintile
(49)
Figure 2.8 Growth of Access and Population, 2000–10
Source: Banerjee and others 2013.
0
0.5
1.0
1.5
2.0
2.5
3.0
0
50
100
150
200
250
300
Total Urban Rural Poorest
quintile
Second
quintile
Third
quintile
Fourth
quintile
Richest
quintile
P e r c e n
t
M i l l i o n s o f p e o p l e
Population growth Access growth Annual growth in access

8/20/2019 WB - India Discom Report - Feb15
http://slidepdf.com/reader/full/wb-india-discom-report-feb15 71/255
Impressive Achievements in Many Dimensions 47
More Power to India • http://dx.doi.org/10.1596/978-1-4648-0233-1
factors are important in rural areas compared with only demand-side factors in
urban areas. While RGGVY is working toward making electricity available to the
entire population by 2017, the poor quality of electricity available and the inabil-
ity to pay can cause households to choose not to connect to electricity—evenwhen it is available. Rural electricity service is generally unreliable, with three-
fourths of rural households facing outages of up to four hours a day. This means
continued use of kerosene even for electrified households—70 percent also use
kerosene for lighting.
There is also a direct correlation between the frequency and duration of power
outages and the rate of household adoption of grid electricity in a community.
Communities with a service outage of 21 hours a day or more in 2005 had an
adoption rate of just 38 percent, against more than 80 percent for those with few
or no outages (figure 2.9a).
The affordability of a subsistence level of electricity consumption appears to beless of an issue.8 In 2010 about 90 percent of rural consumers and 82 percent of
the poorest income quintile could afford to pay Rs 90 ($2) a month for electricity,
which is typically what the connected population in the lowest quintile pays.
Figure 2.9 Affordability and Reliability of Electricity
Source: Banerjee and others 2013.
Note: 0 (no outage) = 3.4 percent of villages; 1–5 = 19.3 percent of villages, 6–10 = 26.2 percent of villages, 11–15 = 23.7 percent of villages,
16–20 = 25.0 percent of villages, and 21–24 = 2.4 percent of villages.
0
10
20
30
40
50
60
70
80
90
0 1–5 6–10 11–15 1 6–20 2 1–24
H o u s e h o l d a d o p t i o n r a t e o f e l e c t r i c i t y ( % )
Hours of outages a day
a. Adoption of electricity
versus outages
0
20
40
60
80
100
120
90 180 270 360 450
S h a
r e o f h o u s e h o l d s f o r w h o m
m o n t h l y u t i l i t y b i l l i s a ff o r d a b l e ( % )
Hypothetical monthly utility bill
(Rs per month)
b. Affordability of indicative
monthly electricity bill
Total
Urban
Rural
Richest quintile
Poorest quintile
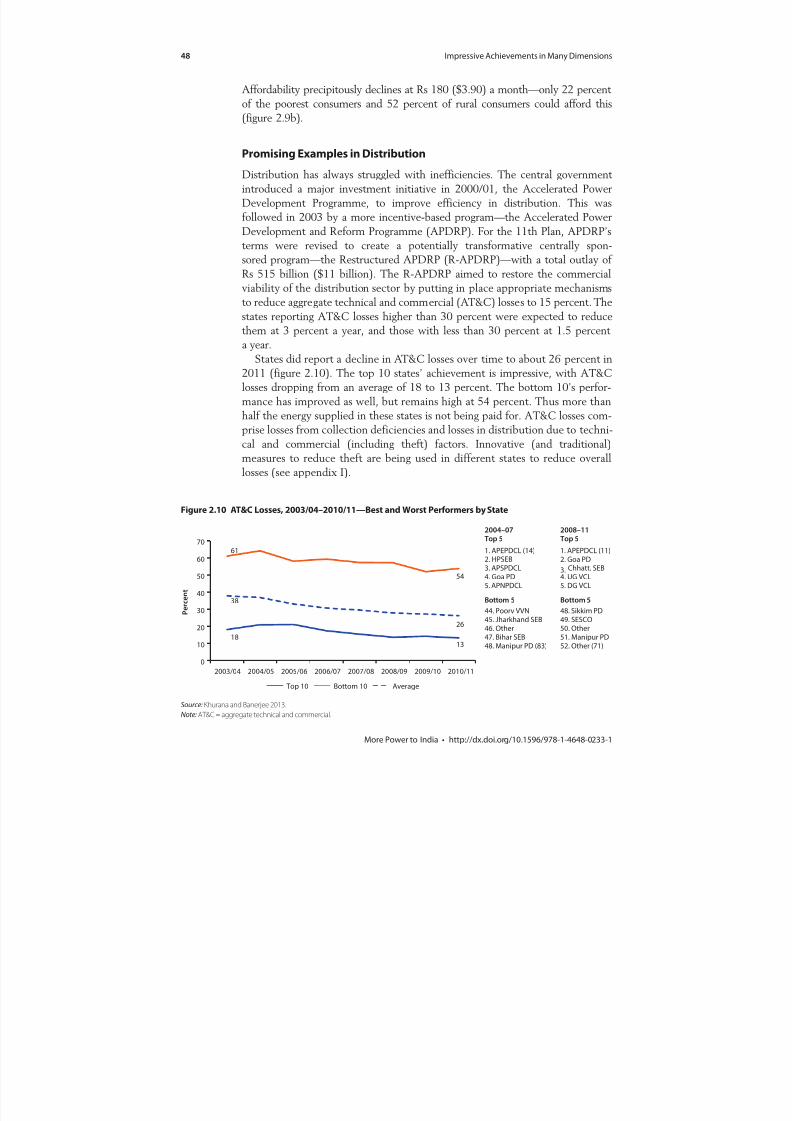
8/20/2019 WB - India Discom Report - Feb15
http://slidepdf.com/reader/full/wb-india-discom-report-feb15 72/255
48 Impressive Achievements in Many Dimensions
More Power to India • http://dx.doi.org/10.1596/978-1-4648-0233-1
Affordability precipitously declines at Rs 180 ($3.90) a month—only 22 percent
of the poorest consumers and 52 percent of rural consumers could afford this
(figure 2.9b).
Promising Examples in Distribution
Distribution has always struggled with inefficiencies. The central government
introduced a major investment initiative in 2000/01, the Accelerated Power
Development Programme, to improve efficiency in distribution. This was
followed in 2003 by a more incentive-based program—the Accelerated Power
Development and Reform Programme (APDRP). For the 11th Plan, APDRP’s
terms were revised to create a potentially transformative centrally spon-
sored program—the Restructured APDRP (R-APDRP)—with a total outlay of
Rs 515 billion ($11 billion). The R-APDRP aimed to restore the commercialviability of the distribution sector by putting in place appropriate mechanisms
to reduce aggregate technical and commercial (AT&C) losses to 15 percent. The
states reporting AT&C losses higher than 30 percent were expected to reduce
them at 3 percent a year, and those with less than 30 percent at 1.5 percent
a year.
States did report a decline in AT&C losses over time to about 26 percent in
2011 (figure 2.10). The top 10 states’ achievement is impressive, with AT&C
losses dropping from an average of 18 to 13 percent. The bottom 10’s perfor-
mance has improved as well, but remains high at 54 percent. Thus more than
half the energy supplied in these states is not being paid for. AT&C losses com-prise losses from collection deficiencies and losses in distribution due to techni-
cal and commercial (including theft) factors. Innovative (and traditional)
measures to reduce theft are being used in different states to reduce overall
losses (see appendix I).
Figure 2.10 AT&C Losses, 2003/04–2010/11—Best and Worst Performers by State
Source: Khurana and Banerjee 2013.
Note: AT&C = aggregate technical and commercial.
3.
2008–11
Top 5
1. APEPDCL (11)2. Goa PD
Chhatt. SEB4. UG VCL5. DG VCL
Bottom 5
48. Sikkim PD49. SESCO50. Other51. Manipur PD52. Other (71)
2004–07
Top 5
1. APEPDCL (14)61
38
18
26
13
54
2. HPSEB3. APSPDCL4. Goa PD5. APNPDCL
Bottom 5
44. Poorv VVN45. Jharkhand SEB46. Other47. Bihar SEB48. Manipur PD (83)
0
10
20
30
40
50
60
70
2003/04 2004/05 2005/06 2006/07 2007/08 2008/09 2009/10 2010/11
P e r c e n t
Top 10 Bottom 10 Average
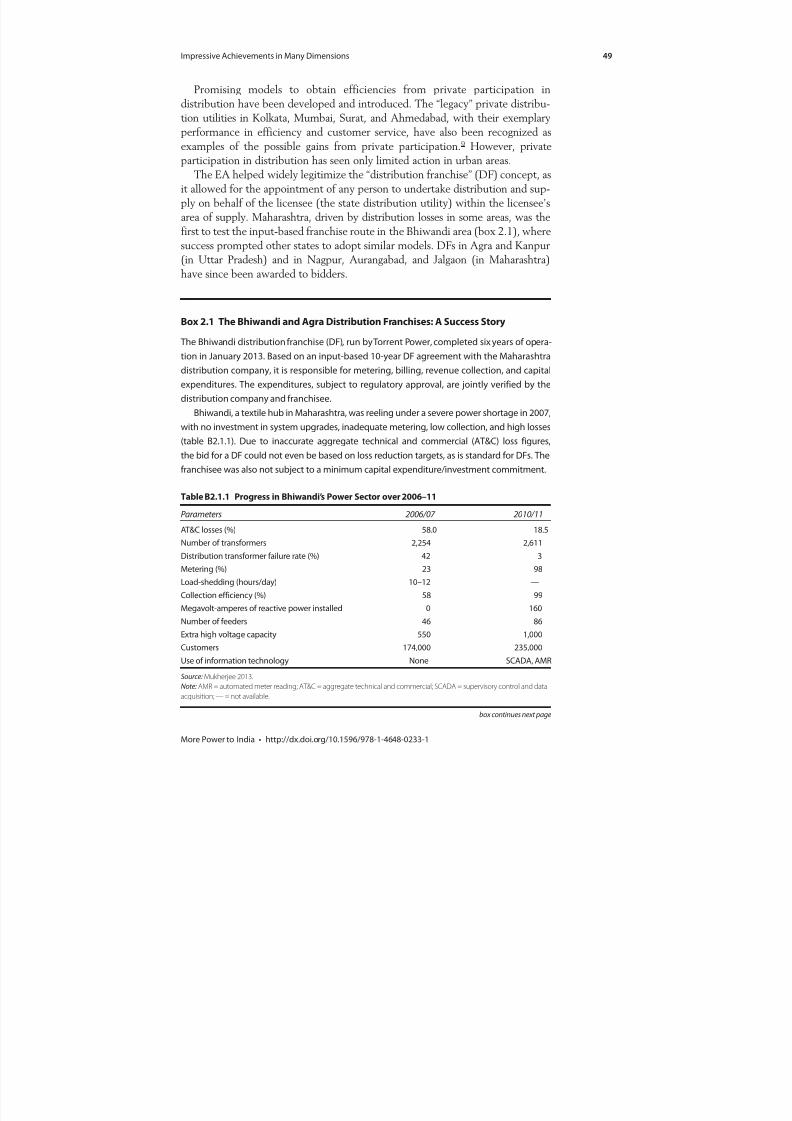
8/20/2019 WB - India Discom Report - Feb15
http://slidepdf.com/reader/full/wb-india-discom-report-feb15 73/255
Impressive Achievements in Many Dimensions 49
More Power to India • http://dx.doi.org/10.1596/978-1-4648-0233-1
Promising models to obtain efficiencies from private participation in
distribution have been developed and introduced. The “legacy” private distribu-
tion utilities in Kolkata, Mumbai, Surat, and Ahmedabad, with their exemplary
performance in efficiency and customer service, have also been recognized asexamples of the possible gains from private participation.9 However, private
participation in distribution has seen only limited action in urban areas.
The EA helped widely legitimize the “distribution franchise” (DF) concept, as
it allowed for the appointment of any person to undertake distribution and sup-
ply on behalf of the licensee (the state distribution utility) within the licensee’s
area of supply. Maharashtra, driven by distribution losses in some areas, was the
first to test the input-based franchise route in the Bhiwandi area (box 2.1), where
success prompted other states to adopt similar models. DFs in Agra and Kanpur
(in Uttar Pradesh) and in Nagpur, Aurangabad, and Jalgaon (in Maharashtra)
have since been awarded to bidders.
Box 2.1 The Bhiwandi and Agra Distribution Franchises: A Success Story
The Bhiwandi distribution franchise (DF), run by Torrent Power, completed six years of opera-
tion in January 2013. Based on an input-based 10-year DF agreement with the Maharashtra
distribution company, it is responsible for metering, billing, revenue collection, and capital
expenditures. The expenditures, subject to regulatory approval, are jointly verified by the
distribution company and franchisee.
Bhiwandi, a textile hub in Maharashtra, was reeling under a severe power shortage in 2007,with no investment in system upgrades, inadequate metering, low collection, and high losses
(table B2.1.1). Due to inaccurate aggregate technical and commercial (AT&C) loss figures,
the bid for a DF could not even be based on loss reduction targets, as is standard for DFs. The
franchisee was also not subject to a minimum capital expenditure/investment commitment.
Table B2.1.1 Progress in Bhiwandi’s Power Sector over 2006–11
Parameters 2006/07 2010/11
AT&C losses (%) 58.0 18.5
Number of transformers 2,254 2,611
Distribution transformer failure rate (%) 42 3
Metering (%) 23 98
Load-shedding (hours/day) 10–12 —
Collection efficiency (%) 58 99
Megavolt-amperes of reactive power installed 0 160
Number of feeders 46 86
Extra high voltage capacity 550 1,000
Customers 174,000 235,000
Use of information technology None SCADA, AMR
Source: Mukherjee 2013.
Note: AMR = automated meter reading; AT&C = aggregate technical and commercial; SCADA = supervisory control and dataacquisition; — = not available.
box continues next page
8/20/2019 WB - India Discom Report - Feb15
http://slidepdf.com/reader/full/wb-india-discom-report-feb15 74/255
50 Impressive Achievements in Many Dimensions
More Power to India • http://dx.doi.org/10.1596/978-1-4648-0233-1
Since 2006 Bhiwandi has made notable progress. The franchisee reduced technical losses
by revamping the low-tension network, maintenance and addition of high-tension networks,
and reactive power management. It introduced information technology applications, such as
supervisory control and data acquisition (SCADA) and automated meter reading. It regular-
ized 38,000 unauthorized connections, particularly in slum areas, and provided 17,000 new
connections. It replaced more than 80 percent of old meters with electronic meters, opened
two new customer service centers, and introduced a 24/7 call center and mobile van to
decrease complaint-resolution times. By 2013 AT&C losses had fallen to 16 percent, the distri-
bution transformer failure rate was 1 percent, and metering had increased to 99 percent.
There is no longer any load-shedding.
In 2009 Torrent Power was selected as the franchisee for the Agra urban area in Uttar
Pradesh. As in Bhiwandi, franchisee selection was based on the price bid for input energy(to be paid to the distribution utility for power supplied by it to the franchisee). Uttar Pradesh’s
distribution sector is extremely inefficient, with high AT&C losses and daily power cuts. The
entire distribution network is riddled with theft and pilferage, pervasive illegal connections,
inadequate metering, low collection efficiency, and an aging network. At the time Torrent
Power was awarded the DF, Agra’s network suffered from inadequate investment and lack of
maintenance over many years. The city had frequent and widespread power cuts, and the util-
ity was known for poor customer service.
Torrent Power took over operations as a complete transfer in 2010. Poor record keep-
ing by the incumbent utility meant almost no technical and commercial information was
available, forcing Torrent Power to reconstruct circuit diagrams and re-create system maps.
This permitted systemwide real-time information collection on electricity supply (through
SCADA) and faster fault identification and restoration. Torrent Power also invested
heavily in substations, moved the low-tension network underground, and established
24/7 customer service centers. Despite strong opposition, illegal connections were discon-
nected and new methods of revenue collection, such as online payment and mobile vans,
introduced. The operational efficiency of the utility improved considerably between 2010
and 2013. The failure rate of distribution transformers fell from 31 percent to 4 percent,
metering rose from 23 percent to 98 percent, and AT&C losses dropped from 70 percent to
41 percent. A promising first few years.
Source: Mukherjee 2013.
Box 2.1 The Bhiwandi and Agra Distribution Franchises: A Success Story (continued)
The urban DF model is structured so that the successful bidder offers maxi-
mum efficiency improvement (loss reduction, cost optimization, and so forth)
at tariff rates set by the SERC. The model ensures that the front-loaded capital
spending required is fully recovered from the incremental revenues generated
by the franchisee. None of this burden for increased upfront investment is
passed on to the licensee. Therefore, the utility must carefully identify potentialareas for implementing DFs. So far, heavily populated areas, requiring an energy
input of around 500 million kWh and above, with high losses have been the
8/20/2019 WB - India Discom Report - Feb15
http://slidepdf.com/reader/full/wb-india-discom-report-feb15 75/255
Impressive Achievements in Many Dimensions 51
More Power to India • http://dx.doi.org/10.1596/978-1-4648-0233-1
most successful. Prospective bidders generally see low-load areas requiring low
energy input as unattractive, and the DF process for most such areas has been
cancelled by the distribution utilities.
While the competitive-bidding mechanism for appointing a franchisee ensuresthat the intended efficiency benefits are passed on to the licensee, licensees have
started to put additional clauses in such agreements, giving specific targets to the
franchisee on AT&C losses, minimum capital investment, metering levels, and
call center and complaint management systems. But this “micromanagement” by
the licensee may dampen the enthusiasm of participants in later bidding rounds.
In rural areas, private participation remains nascent. A decisive push toward
rural franchises was achieved because of their inclusion in the RGGVY
program—rural franchises are to ensure revenue sustainability and to help state
utilities in managing rural distribution networks that have expanded hugely
under the program. In fact, utilities in rural areas need and welcome thefranchises, primarily as an instrument to help the utility with metering, billing,
and collection. The approach creates scope for involving village or town interme-
diaries as partners in metering, billing, and collection as well as in operation and
maintenance, in cases where the required numbers of skilled workers and
community structures are available.
More than 37,000 rural franchises are operating, covering more than 216,000
villages across 18 states. Most of these franchises are collection based, where the
franchisee either takes a part of the revenue or earns an incentive up to a preset
collection-efficiency target, depending on the contract. Contracts are usually
annual with flexibility to grant extensions. There is also a group of “input-based”franchises, where the franchisee buys the energy input in the franchise area, and
then resells it to consumers (similar to the input-based model used for some
urban DFs). About 1,600 rural franchises are input based, the most notable being
the single point power supply system, which sells power to consumers at tariffs
approved by the SERC and pays a fixed fee to the distribution licensee. Rural
franchisees have yet to invest in the network.
Notes
1. Congested transmission lines hurt not only generators but also the retail customers at the distribution end of the value chain. Because wholesale power purchasers typically seek to buy the least expensive electricity, if transmission constraints frequently limit the amount of electricity that can be delivered into an area where demand is high, the power purchasers (distribution companies) must buy more often from higher cost (spot market) suppliers, and the result is higher electricity costs for consumers. When there is very severe congestion, transmission constraints can also impair grid reliability by reducing the diversity of available electricity supplies and by rendering the area more vulnerable to unanticipated outages of major generators or transmission lines.
2. The nine high-capacity power transmission corridors (HCPTCs) are HCPTC I
(Transmission System Associated with Phase I Generation Projects in Orissa) for Rs 87.53 billion ($1.9 billion); HCPTC II (Transmission System Associated with inde-pendent power producer [IPP] projects in Jharkhand), Rs 57 billion ($1.2 billion);

8/20/2019 WB - India Discom Report - Feb15
http://slidepdf.com/reader/full/wb-india-discom-report-feb15 76/255
52 Impressive Achievements in Many Dimensions
More Power to India • http://dx.doi.org/10.1596/978-1-4648-0233-1
HCPTC III (Transmission System Associated with IPP projects in Sikkim), Rs 13 billion($0.03 billion); HCPTC IV (Transmission System Associated with IPP projects in Bilaspur complex, Chhattisgarh, and IPPs in Madhya Pradesh), Rs 12.43 billion ($0.26 billion); HCPTC V (Transmission System Associated with IPP projects in
Chhattisgarh), Rs 288 billion ($6 billion); HCPTC VI (Transmission System Associatedwith IPP projects in Krishnapatnam Area, Andhra Pradesh), Rs 20 billion ($0.4 billion);HCPTC VII (Transmission System Associated with IPP projects in Tuticorin Area, Andhra Pradesh), Rs 23 billion ($0.5 billion); HCPTC VIII (Transmission System Associated with IPP projects in Srikakulam Area, Andhra Pradesh), Rs 29 billion ($0.62 billion); and HCPTC IX (Transmission System Associated with IPP projects in Southern Region for transfer of power to other regions), Rs 48 billion ($1 billion; CERC 2012).
3. Many discoms lost their planning function after unbundling. Without the benefit of demand-growth analysis or load-flow studies, they cannot submit long-term power procurement plans to the state regulator for approval and simply overdraw when the need arises.
4. The system operator does not have the authority to immediately disconnect any dis-com seen to be engaging in overdrawal.
5. Case 1 is an open-bidding system in which the developer chooses its own fuel, loca-tion, and technology and bids to generate and supply a specific amount of power. In Case 2 the central or state government specifies the fuel and location, and the devel-opers bid based on those specifications. See chapter 2 of Mukherjee (2013) for more details.
6. As the imported coal price would be based on gross calorific value, per international trading practice, and the domestic coal price would be based on useful heat value, it
can be assumed that a combined or pooled price would be higher than the current price that thermal power plants pay for domestic coal.
7. Reverse auctions have two main benefits. First, they allow government procurers to select projects based on the lowest cost; second, they ensure that a price-based selec-tion process is fair and transparent.
8. Affordability is defined as the ability to pay a monthly electricity bill that is less than 5 percent of household income.
9. These utilities and a few others were originally set up under private ownership aroundthe start of the 20th century and have remained privately managed ever since. They buy power from state-owned generators, with few exceptions (for example, Tata in
Mumbai is a private discom and has its own generation facility). Legacy private power companies are well managed but are few, predating the reforms discussed in this report by almost a century.
References
Banerjee, Sudeshna G., Doug Barnes, Bipul Singh, Kristy Mayer, and Hussain Samad.2013. “Power for All: Electricity Access Challenge in India.” Background paper for thisreport. World Bank, Washington, DC.
Bhattacharyya, Subhes C. 2005. “The Electricity Act 2003: Will It Transform the Indian
Power Sector?” Utilities Policy 13 (3): 260–72.CEA (Central Electricity Authority). 2013. Growth of Electricity Sector in India from
1947–2013. New Delhi.
8/20/2019 WB - India Discom Report - Feb15
http://slidepdf.com/reader/full/wb-india-discom-report-feb15 77/255
Impressive Achievements in Many Dimensions 53
More Power to India • http://dx.doi.org/10.1596/978-1-4648-0233-1
CERC (Central Electricity Regulatory Commission). 2010. Statutory Advice of CERCRegarding Time Frame for Tariff Based Competitive Bidding . New Delhi.
———. 2012. Report of the Enquiry Committee on Grid Disturbance in Northern Regionon 30th July 2012 and in Northern, Eastern & North-Eastern Region on 31st July 2012.New Delhi.
———. 2013. Report on Short-Term Power Market in India: 2012–13. New Delhi.
Delio, Ella A., Saurab Lall, and Chandan Singh. 2009. Powering Up: The InvestmentPotential of Energy Service Companies in India. Washington, DC: World ResourcesInstitute.
Hector, Dearton T., and Anand J. 2012. “Flickering Hope.” Business Today, February 19,2013. http://businesstoday.intoday.in/story/fluorescent-lamps-demand-fluorescent-lamps/1/21982.html.
Khurana, Mani, and Sudeshna G. Banerjee. 2013. “Beyond Crisis: Financial and
Operational Performance of India’s Power Sector.” Background paper for this report. World Bank, Washington, DC.
Mercados EMI. 2012. India: Understanding Private Sector Participation in HydropowerDevelopment . New Delhi.
———. 2013. India Power Sector Financial Review. New Delhi.
Mukherjee, Mohua. 2013. “Private Sector Participation in the Indian Power Sector:Lessons from Two Decades of Experience.” Background paper for this report. WorldBank, Washington, DC.
Planning Commission. 2006. Integrated Energy Policy—Report of the Expert Committee.New Delhi: Government of India.
———. 2013. Twelfth Five Year Plan (2012–2017) Economic Sectors—Chapter 14: Energy.New Delhi: Government of India.
Renewable Energy World. 2013. “India’s REC Market Crashes.” July 4. http://www.renewableenergyworld.com/rea/news/article/2013/07/indias-rec-market-crashes.
Singh, Neelam. 2013. Creating Market Support for Energy Efficiency: India’s Perform, Achieve, and Trade Scheme. London: Climate & Development Knowledge Network.
Thakur, Tripta. 2005. “Distribution Sector Reforms in India: The Tasks Ahead.”International Journal of Global Energy Issues 23 (2/3): 196–217.

8/20/2019 WB - India Discom Report - Feb15
http://slidepdf.com/reader/full/wb-india-discom-report-feb15 78/255
8/20/2019 WB - India Discom Report - Feb15
http://slidepdf.com/reader/full/wb-india-discom-report-feb15 79/255
55More Power to India • http://dx.doi.org/10.1596/978-1-4648-0233-1
Deterioration of Distribution
Finances
Power sector finances—critical to realizing sector goals—have been trending
downward, especially from 2009 onward, and reached crisis proportions in
2011. The increase in sector losses has been largely plugged by substantial state
subsidies and heavy borrowing by all segments of the value chain. Subsidies
received by state utilities over 2003–11 totaled Rs 1.3 trillion ($28 billion), or
2 percent of gross domestic product (GDP) in 2011. And total debt stood at
Rs 3.5 trillion ($77 billion) in 2011, equivalent to 5 percent of GDP that year.
About a decade after the first bailout in 2001, the sector was again offered a
financial restructuring plan in 2012. Once more, the crisis had roots in the lack
of creditworthiness of state power distribution utilities, which were unable to
pay their bills or repay their debts. This chapter elaborates on the evolution of
sector finances since 2003 and the impact on various stakeholders.
State Subsidies to the Sector Impose a Heavy Opportunity Cost
Sectorwide accumulated losses stood at Rs 1,146 billion ($25 billion) in 2011,
more than twice (in real terms) that in 2003 (figure 3.1).1 Accumulated losses
grew at a compound annual growth rate (CAGR) of 9 percent in real terms from2003, though the share of losses relative to GDP remained stable at about
1.3 percent. Distribution companies (discoms) and bundled utilities (state elec-
tricity boards and power departments) are by far the largest contributors to
accumulated losses, though their share has fluctuated from 90 percent in 2003
to 73 percent in 2006 and back up to 81 percent in 2011. Transmission compa-
nies account for most of the rest. Generation companies, on the other hand, have
collectively made profits since 2008.
Accumulated losses are concentrated in a few states: Uttar Pradesh,
Madhya Pradesh, Tamil Nadu, and Jharkhand among them (figure 3.2a).
Uttar Pradesh has seen steadily accumulating losses since 2003 andalone accounted for 40 percent of the total in 2011. Together, five poor-performing
states account for three-quarters of the power sector’s accumulated losses.
C H A P T E R 3
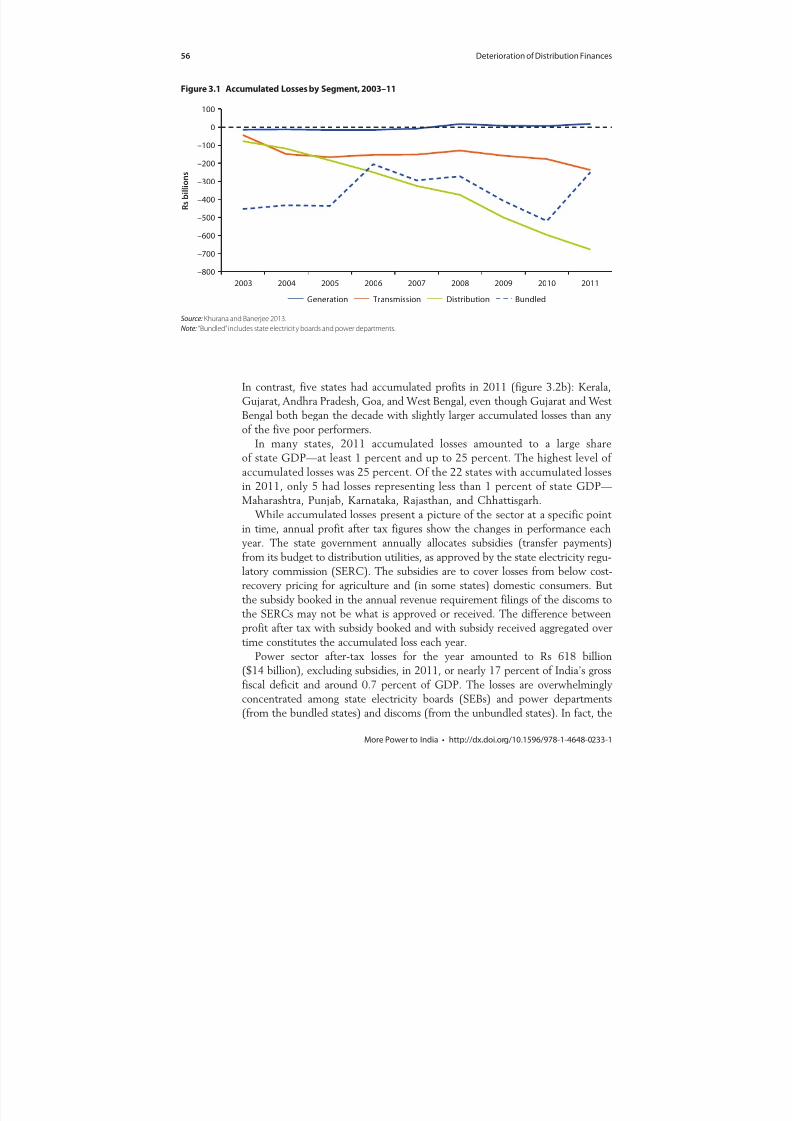
8/20/2019 WB - India Discom Report - Feb15
http://slidepdf.com/reader/full/wb-india-discom-report-feb15 80/255
56 Deterioration of Distribution Finances
More Power to India • http://dx.doi.org/10.1596/978-1-4648-0233-1
In contrast, five states had accumulated profits in 2011 (figure 3.2b): Kerala,
Gujarat, Andhra Pradesh, Goa, and West Bengal, even though Gujarat and West
Bengal both began the decade with slightly larger accumulated losses than anyof the five poor performers.
In many states, 2011 accumulated losses amounted to a large share
of state GDP—at least 1 percent and up to 25 percent. The highest level of
accumulated losses was 25 percent. Of the 22 states with accumulated losses
in 2011, only 5 had losses representing less than 1 percent of state GDP—
Maharashtra, Punjab, Karnataka, Rajasthan, and Chhattisgarh.
While accumulated losses present a picture of the sector at a specific point
in time, annual profit after tax figures show the changes in performance each
year. The state government annually allocates subsidies (transfer payments)from its budget to distribution utilities, as approved by the state electricity regu-
latory commission (SERC). The subsidies are to cover losses from below cost-
recovery pricing for agriculture and (in some states) domestic consumers. But
the subsidy booked in the annual revenue requirement filings of the discoms to
the SERCs may not be what is approved or received. The difference between
profit after tax with subsidy booked and with subsidy received aggregated over
time constitutes the accumulated loss each year.
Power sector after-tax losses for the year amounted to Rs 618 billion
($14 billion), excluding subsidies, in 2011, or nearly 17 percent of India’s gross
fiscal deficit and around 0.7 percent of GDP. The losses are overwhelminglyconcentrated among state electricity boards (SEBs) and power departments
(from the bundled states) and discoms (from the unbundled states). In fact, the
Figure 3.1 Accumulated Losses by Segment, 2003–11
Source: Khurana and Banerjee 2013.
Note: “Bundled” includes state electricity boards and power departments.
–800
–700
–600
–500
–400
–300
–200
–100
0
100
2003 2004 2005 2006 2007 2008 2009 2010 2011
R s b i l l i o n s
Generation Transmission Distribution Bundled

8/20/2019 WB - India Discom Report - Feb15
http://slidepdf.com/reader/full/wb-india-discom-report-feb15 81/255
Deterioration of Distribution Finances 57
More Power to India • http://dx.doi.org/10.1596/978-1-4648-0233-1
upstream generation segment actually recorded a small profit of Rs 15 billion
($344 million) in 2011 (figure 3.3a).
Since 2003 total sector losses have grown 133 percent. Losses among SEBs
and discoms (in unbundled states) have largely driven that trend, together
growing 134 percent. There is periodic good news, however—distribution sawa modest drop in annual losses in 2011. Generation registered a growth in
profits over the period, with a profit every year other than 2009, which saw
Figure 3.2 Accumulated Losses by State, 2003–11
Source: Khurana and Banerjee 2013.
a. Poorest performers
–500
–400
–300
–200
–100
0
100
20062003 2004 2005 2007 2008 2009 2010 2011
R s b i l l i o n s
Uttar PradeshOther Madhya PradeshJharkhand Tamil Nadu
b. Best performers
–140
–120
–100
–80
–60
–40
–20
0
20
40
2003 2004 2005 2006 2007 2008 2009 2010 2011
R s b i l l i o n s
Andhra PradeshGoa GujaratKerala West Bengal
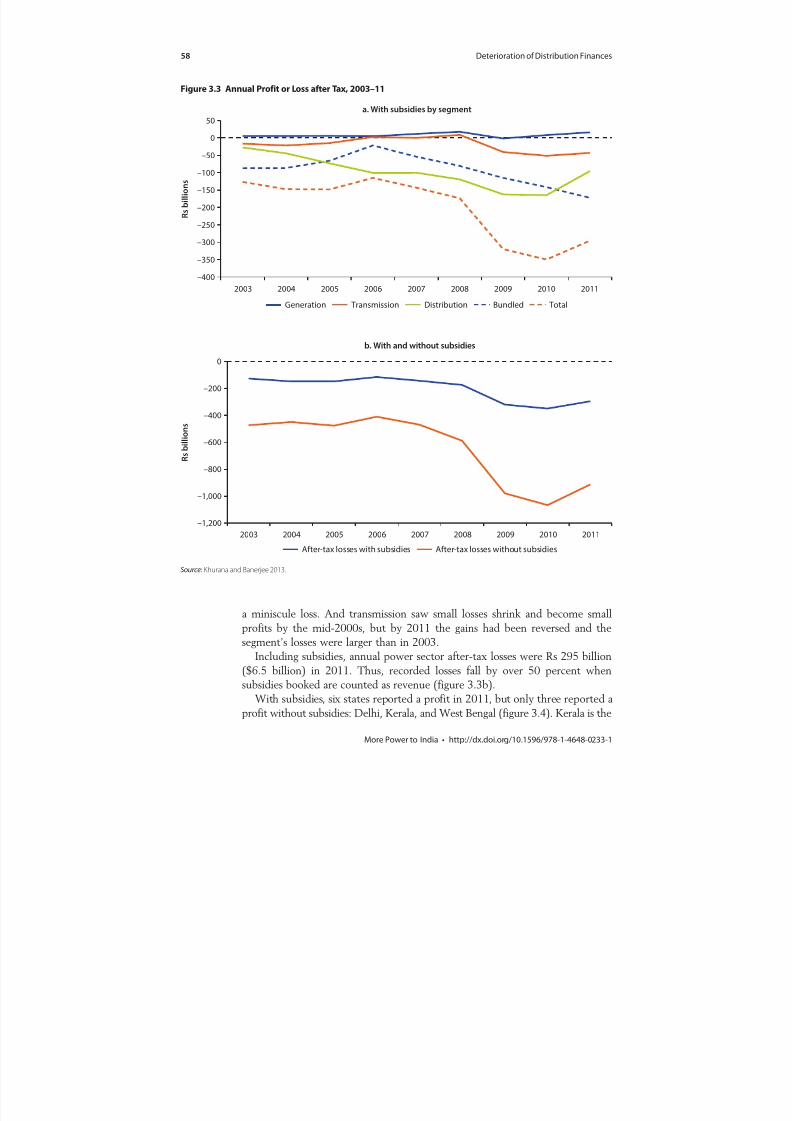
8/20/2019 WB - India Discom Report - Feb15
http://slidepdf.com/reader/full/wb-india-discom-report-feb15 82/255
58 Deterioration of Distribution Finances
More Power to India • http://dx.doi.org/10.1596/978-1-4648-0233-1
a miniscule loss. And transmission saw small losses shrink and become small
profits by the mid-2000s, but by 2011 the gains had been reversed and the
segment’s losses were larger than in 2003.
Including subsidies, annual power sector after-tax losses were Rs 295 billion
($6.5 billion) in 2011. Thus, recorded losses fall by over 50 percent when
subsidies booked are counted as revenue (figure 3.3b). With subsidies, six states reported a profit in 2011, but only three reported a
profit without subsidies: Delhi, Kerala, and West Bengal (figure 3.4). Kerala is the
Figure 3.3 Annual Profit or Loss after Tax, 2003–11
Source: Khurana and Banerjee 2013.
–400
–350
–300
–250
–200
–150
–100
–50
0
50
2003 2004 2005 2006 2007 2008 2009 2010 2011
R s b i l l i o n s
a. With subsidies by segment
BundledDistributionGeneration Transmission Total
–1,200
–1,000
–800
–600
–400
–200
0
2003 2004 2005 2006 2007 2008 2009 2010 2011
R s b i l l i o n s
b. With and without subsidies
After-tax losses with subsidies After-tax losses without subsidies
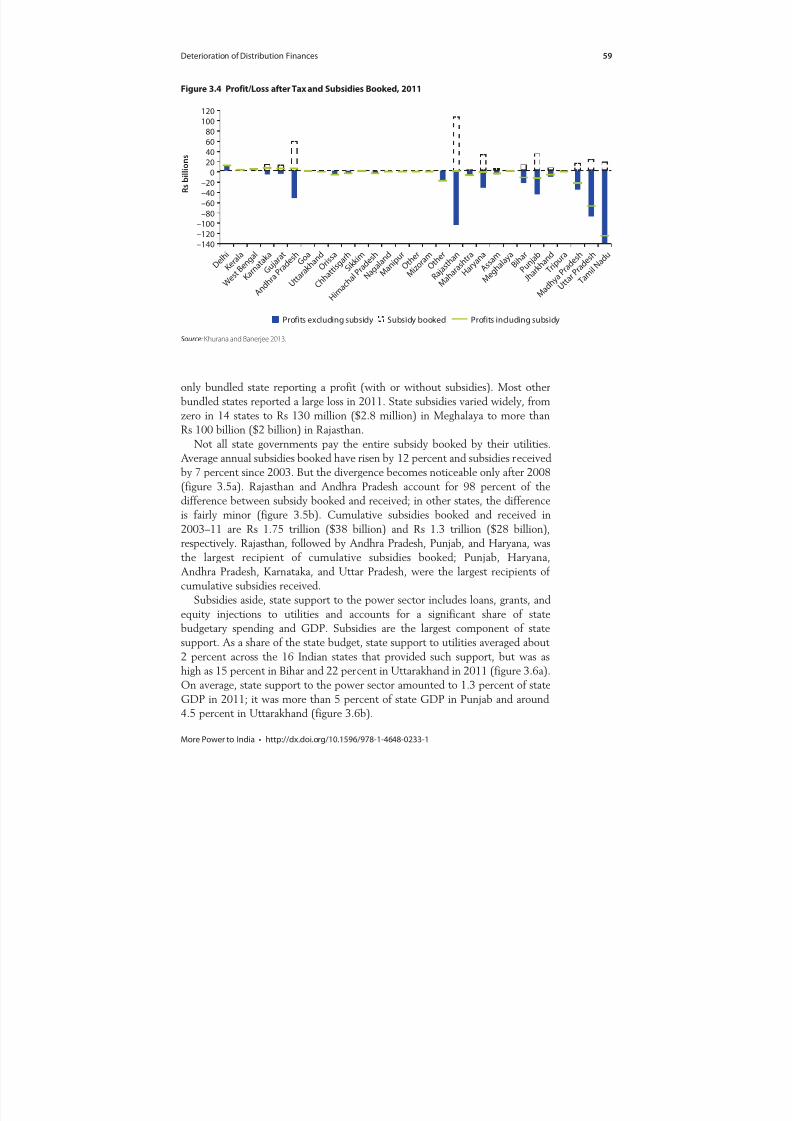
8/20/2019 WB - India Discom Report - Feb15
http://slidepdf.com/reader/full/wb-india-discom-report-feb15 83/255
Deterioration of Distribution Finances 59
More Power to India • http://dx.doi.org/10.1596/978-1-4648-0233-1
only bundled state reporting a profit (with or without subsidies). Most other
bundled states reported a large loss in 2011. State subsidies varied widely, from
zero in 14 states to Rs 130 million ($2.8 million) in Meghalaya to more thanRs 100 billion ($2 billion) in Rajasthan.
Not all state governments pay the entire subsidy booked by their utilities.
Average annual subsidies booked have risen by 12 percent and subsidies received
by 7 percent since 2003. But the divergence becomes noticeable only after 2008
(figure 3.5a). Rajasthan and Andhra Pradesh account for 98 percent of the
difference between subsidy booked and received; in other states, the difference
is fairly minor (figure 3.5b). Cumulative subsidies booked and received in
2003–11 are Rs 1.75 trillion ($38 billion) and Rs 1.3 trillion ($28 billion),
respectively. Rajasthan, followed by Andhra Pradesh, Punjab, and Haryana, wasthe largest recipient of cumulative subsidies booked; Punjab, Haryana,
Andhra Pradesh, Karnataka, and Uttar Pradesh, were the largest recipients of
cumulative subsidies received.
Subsidies aside, state support to the power sector includes loans, grants, and
equity injections to utilities and accounts for a significant share of state
budgetary spending and GDP. Subsidies are the largest component of state
support. As a share of the state budget, state support to utilities averaged about
2 percent across the 16 Indian states that provided such support, but was as
high as 15 percent in Bihar and 22 percent in Uttarakhand in 2011 (figure 3.6a).
On average, state support to the power sector amounted to 1.3 percent of stateGDP in 2011; it was more than 5 percent of state GDP in Punjab and around
4.5 percent in Uttarakhand (figure 3.6b).
Figure 3.4 Profit/Loss after Tax and Subsidies Booked, 2011
Source: Khurana and Banerjee 2013.
–140–120–100
–80
–60–40–20
020406080
100120
D e l h i
K e r a l a
W e s t B e
n g a l
K a r n a t a k
a
G
u j a r a t
A n d h r a P
r a d e s h G o
a
U t t a r a k h a
n d O r i s s
a
C h h a t t i s g
a r h S i k k i m
H i m a
c h a l P r a d
e s h
N a g
a l a n d
M a n i p u
r O t h e
r
M i z o
r a m O t h e
r
R a j a s t h a n
M a h a r a s h
t r a
H a r y
a n a
A s s a m
M e g h a l a y
a B i h
a r
P
u n j a b
J h a r k h a
n d
T r i p
u r a
M a d h y a P
r a d e s h
U t t a r P
r a d e s h
T a m i l N
a d u
R s b i l l i o n s
Profits excluding subsidy Subsidy booked Profits including subsidy

8/20/2019 WB - India Discom Report - Feb15
http://slidepdf.com/reader/full/wb-india-discom-report-feb15 84/255
60 Deterioration of Distribution Finances
More Power to India • http://dx.doi.org/10.1596/978-1-4648-0233-1
Figure 3.5 Subsidies Booked and Received, 2003–11
Source: Khurana and Banerjee 2013.
0
50
100
150
200
250
300
350
2003 2004 2005 2006 2007 2008 2009 2010 2011
R s b i l l i o n s
a. Subsidies booked and subsidies received (real)
Subsidies booked Subsidies received
b. States contributing to difference between subsidies
booked and subsidies received
Andhra
Pradesh,
27%
Other
states,
2%
Rajasthan,
71%
Such budgetary resources granted to the power sector are an opportunity cost
to the economy. Back-of-the-envelope calculations, assuming the cost of a hospi-
tal is Rs 28 million ($0.6 million) and a school is Rs 4 million ($0.08 million),suggest that about 15,000 hospitals and 123,000 schools could have been built
in 2011 if the power sector had not preempted these funds.

8/20/2019 WB - India Discom Report - Feb15
http://slidepdf.com/reader/full/wb-india-discom-report-feb15 85/255
Deterioration of Distribution Finances 61
More Power to India • http://dx.doi.org/10.1596/978-1-4648-0233-1
Rising Power Sector Debt Has Escalated the Risk of Financial Contagion
The power sector has also been supported by substantial borrowing by all
segments, with total debt growing to Rs 3.5 trillion ($77 billion) in 2011,equivalent to 5 percent of GDP (figure 3.7a). The debt in distribution grew
the fastest over 2003–11—at a CAGR of 23 percent in real terms—and
expanded as a share of total debt from 9 percent in 2003 to 36 percent in
2011. Transmission and generation debt grew at real CAGRs of 10 percent
and 9 percent, respectively. Bundled utilities’ debt has fallen sharply in recent
years, though largely because states that unbundled transferred their SEB or
power department debt to the newly created utilities.
Worryingly, the tenor of the debt profile has changed. Many discoms have
recently relied on short-term loans to meet operating expenses, with their share
of total sector borrowing rising from 11 percent (which amounted to Rs 184 billion
[$4.5 billion]) in 2007 to 22 percent (Rs 583 billion [$12.7 billion]) in 2010
(figure 3.7b).2 By contrast, long-term loans declined from 87 percent in 2007 to
77 percent in 2010. The interest burden on utilities from short-term borrowing
is heavy.
Total sector debt is concentrated among a few large states, where it represents
a hefty share of state GDP (figure 3.8). In Rajasthan, Meghalaya, and Haryana,
power sector debt is more than 10 percent of state GDP, and in Uttar Pradesh, a
startling 43 percent. The 10 states with the largest power sector debt together
accounted for 78 percent of India’s total sector debt in 2011. Rajasthan had thelargest absolute debt, and its borrowing grew at a massive 15 percent a year in
real terms in 2003–11. Only Bihar’s debt grew faster, but from a far lower base.
Figure 3.6 State Support to the Power Sector, 2011
Source: Khurana and Banerjee 2013.
Note: GDP = gross domestic product.
–5 0 5 10 15 20 25
Tamil NaduGujarat
Assam
Maharashtra
Madhya Pradesh
Meghalaya
Rajasthan
Kerala
Uttar Pradesh
Haryana
Karnataka
Jharkhand
Andhra Pradesh
PunjabBihar
Uttarakhand
a. As a share of budget b. As a share of state GDP
–2 0 2 4 6 8
Tamil NaduGujarat
Maharashtra
Madhya Pradesh
Assam
Meghalaya
Karnataka
Rajasthan
Kerala
Andhra Pradesh
Uttar Pradesh
Haryana
Bihar
JharkhandUttarakhand
Punjab
Percent Percent
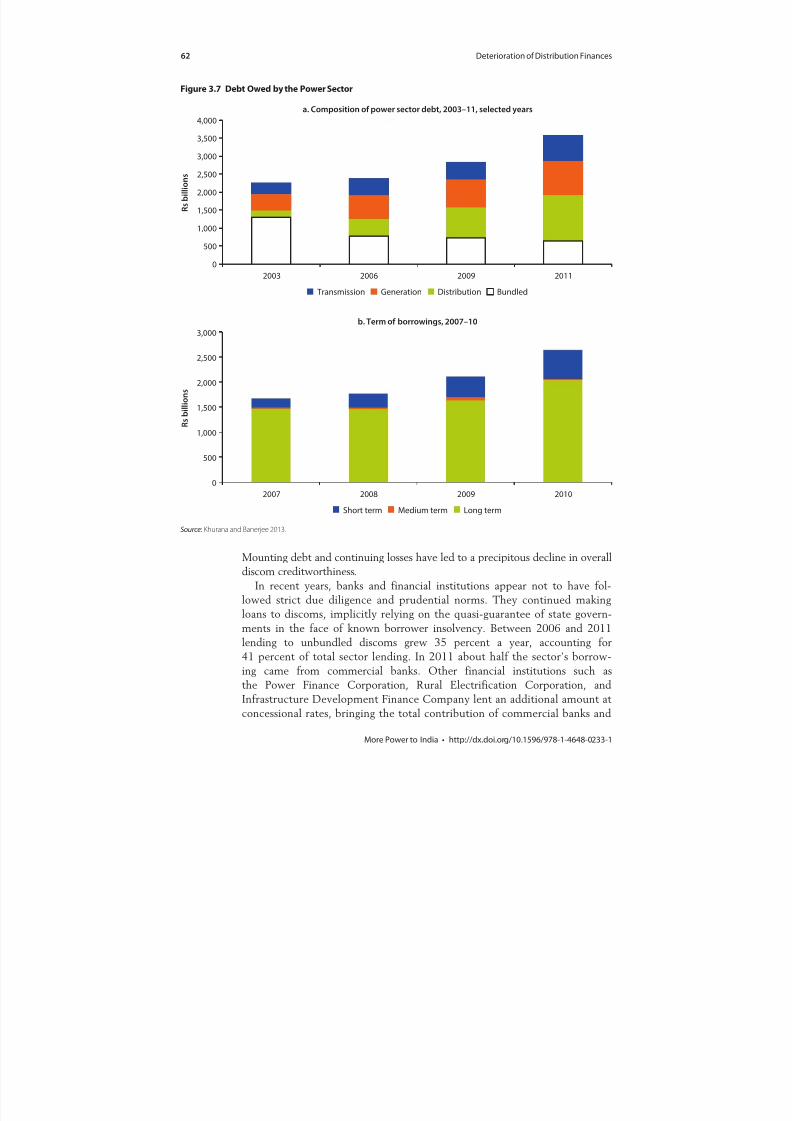
8/20/2019 WB - India Discom Report - Feb15
http://slidepdf.com/reader/full/wb-india-discom-report-feb15 86/255
62 Deterioration of Distribution Finances
More Power to India • http://dx.doi.org/10.1596/978-1-4648-0233-1
Figure 3.7 Debt Owed by the Power Sector
Source: Khurana and Banerjee 2013.
0
500
1,000
1,500
2,000
2,500
3,000
3,500
4,000
2003 2006 2009 2011
R s b i l l i o n s
a. Composition of power sector debt, 2003–11, selected years
BundledDistributionGeneration Transmission
0
500
1,000
1,500
2,000
2,500
3,000
2007 2008 2009 2010
R s b i l l i o n s
b. Term of borrowings, 2007–10
Long termMedium termShort term
Mounting debt and continuing losses have led to a precipitous decline in overall
discom creditworthiness.
In recent years, banks and financial institutions appear not to have fol-
lowed strict due diligence and prudential norms. They continued making
loans to discoms, implicitly relying on the quasi-guarantee of state govern-
ments in the face of known borrower insolvency. Between 2006 and 2011
lending to unbundled discoms grew 35 percent a year, accounting for
41 percent of total sector lending. In 2011 about half the sector’s borrow-
ing came from commercial banks. Other financial institutions such as
the Power Finance Corporation, Rural Electrification Corporation, andInfrastructure Development Finance Company lent an additional amount at
concessional rates, bringing the total contribution of commercial banks and

8/20/2019 WB - India Discom Report - Feb15
http://slidepdf.com/reader/full/wb-india-discom-report-feb15 87/255
6 3
Figure 3.8 Debt Owed by State Utilities, 2011
Source: Khurana and Banerjee 2013.
Note: The size of the bubble indicates debt as a percentage of state gross domestic product in 2011.
Kerala0.5
Assam1
Other1
Manipur1
Orissa5
Gujrat2
Nagaland2
Punjab8
WestBengal
3 Goa0.3
Other 8
HimachalPradesh
8Meghalaya12
Karnataka 5
Jharkhand 7
Andhra Pradesh 5
Madhya Pradesh 8
Maharashtra 3
Delhi5
Uttarakhand1
Tamil Nadu 5
Haryan10
Uttar Prades43
Chha
Raj
–50
50
150
250
350
450
550
650
–30 –20 –10 0 10
D e
b t o w e d ,
2 0 1 1 ( R s b i l l i o n s )
Compound annual growth rate of debt, 2003–11 (%)
Size of bubble = Debt as a share of state GDP, 2011 (%)
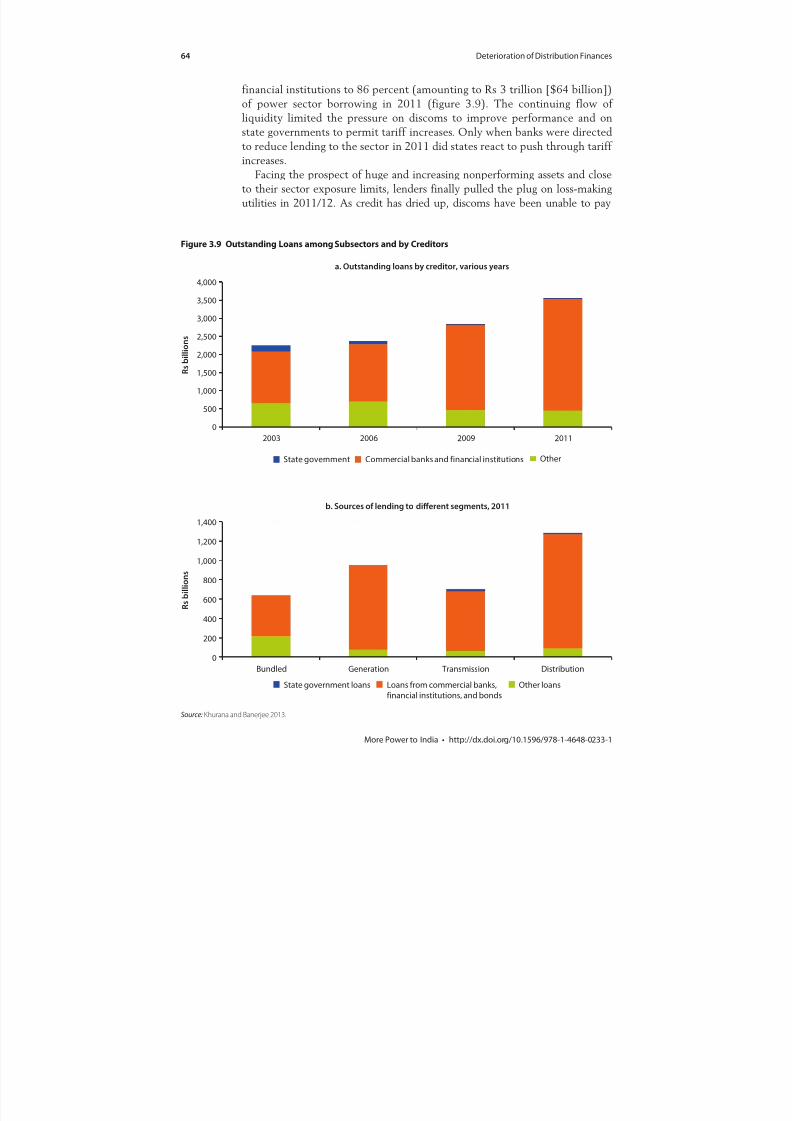
8/20/2019 WB - India Discom Report - Feb15
http://slidepdf.com/reader/full/wb-india-discom-report-feb15 88/255
64 Deterioration of Distribution Finances
More Power to India • http://dx.doi.org/10.1596/978-1-4648-0233-1
financial institutions to 86 percent (amounting to Rs 3 trillion [$64 billion])
of power sector borrowing in 2011 (figure 3.9). The continuing flow of
liquidity limited the pressure on discoms to improve performance and on
state governments to permit tariff increases. Only when banks were directedto reduce lending to the sector in 2011 did states react to push through tariff
increases.
Facing the prospect of huge and increasing nonperforming assets and close
to their sector exposure limits, lenders finally pulled the plug on loss-making
utilities in 2011/12. As credit has dried up, discoms have been unable to pay
Figure 3.9 Outstanding Loans among Subsectors and by Creditors
Source: Khurana and Banerjee 2013.
a. Outstanding loans by creditor, various years
0
500
1,000
1,500
2,000
2,500
3,000
3,500
4,000
2003 2006 2009 2011
R s b i l l i o n s
State government Commercial banks and financial institutions Other
b. Sources of lending to different segments, 2011
0
200
400
600
800
1,000
1,200
1,400
Bundled Generation Transmission Distribution
R s b i l l i o n s
Other loansLoans from commercial banks,financial institutions, and bonds
State government loans
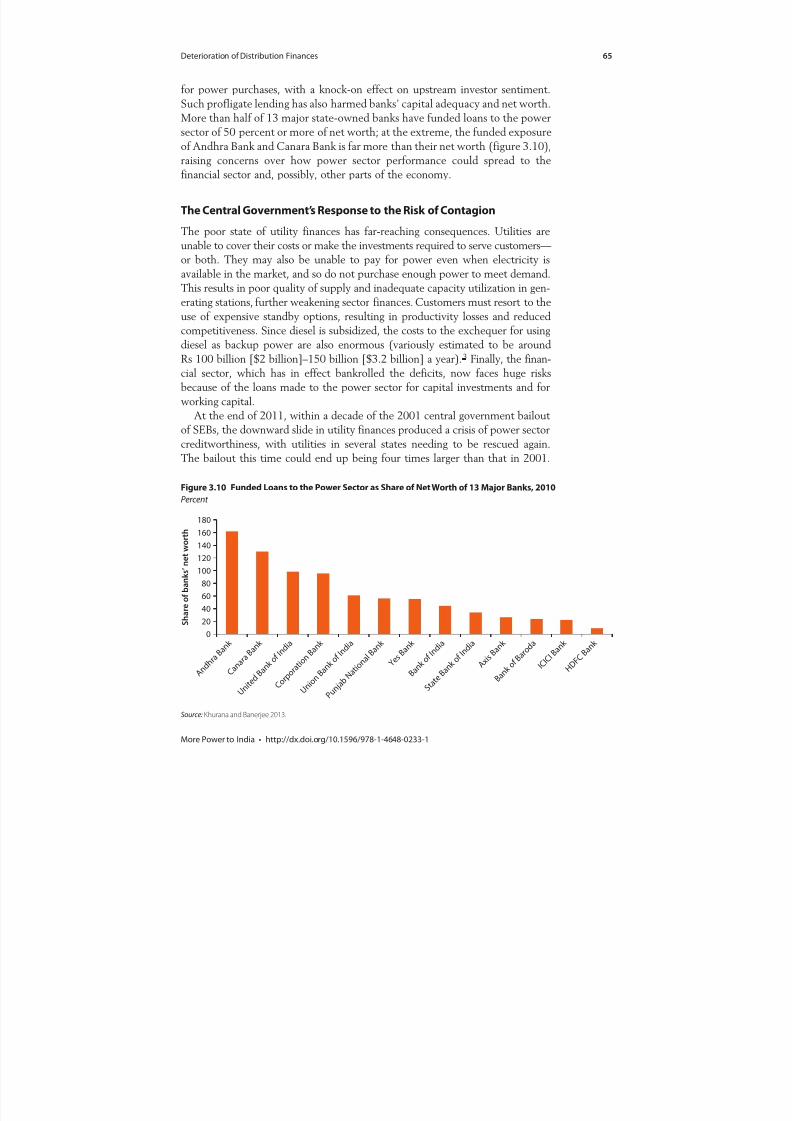
8/20/2019 WB - India Discom Report - Feb15
http://slidepdf.com/reader/full/wb-india-discom-report-feb15 89/255
Deterioration of Distribution Finances 65
More Power to India • http://dx.doi.org/10.1596/978-1-4648-0233-1
for power purchases, with a knock-on effect on upstream investor sentiment.
Such profligate lending has also harmed banks’ capital adequacy and net worth.
More than half of 13 major state-owned banks have funded loans to the power
sector of 50 percent or more of net worth; at the extreme, the funded exposureof Andhra Bank and Canara Bank is far more than their net worth (figure 3.10),
raising concerns over how power sector performance could spread to the
financial sector and, possibly, other parts of the economy.
The Central Government’s Response to the Risk of Contagion
The poor state of utility finances has far-reaching consequences. Utilities are
unable to cover their costs or make the investments required to serve customers—
or both. They may also be unable to pay for power even when electricity is
available in the market, and so do not purchase enough power to meet demand.This results in poor quality of supply and inadequate capacity utilization in gen-
erating stations, further weakening sector finances. Customers must resort to the
use of expensive standby options, resulting in productivity losses and reduced
competitiveness. Since diesel is subsidized, the costs to the exchequer for using
diesel as backup power are also enormous (variously estimated to be around
Rs 100 billion [$2 billion]–150 billion [$3.2 billion] a year).3 Finally, the finan-
cial sector, which has in effect bankrolled the deficits, now faces huge risks
because of the loans made to the power sector for capital investments and for
working capital.
At the end of 2011, within a decade of the 2001 central government bailoutof SEBs, the downward slide in utility finances produced a crisis of power sector
creditworthiness, with utilities in several states needing to be rescued again.
The bailout this time could end up being four times larger than that in 2001.
Figure 3.10 Funded Loans to the Power Sector as Share of Net Worth of 13 Major Banks, 2010
Percent
Source: Khurana and Banerjee 2013.
0
20
40
60
80
100
120
140
160
180
A n d h
r a B a
n k
C a n a
r a B a
n k
U n i t e
d B a n k o
f I n d i
a
C o
r p o r
a t i o
n B a n k
U n i o
n B a n k o
f I n d i
a
P u n j a
b N a t i o
n a l B a
n k
Y e s B a
n k
B a n k o
f I n d i
a
S t a t e
B a n k o
f I n d i
a
A x i s B a
n k
B a n k o
f B a r o
d a
I C I C I
B a n k
H D F C
B a n k
S h a r e o f b a n k s ’ n e t w
o r t h
8/20/2019 WB - India Discom Report - Feb15
http://slidepdf.com/reader/full/wb-india-discom-report-feb15 90/255
66 Deterioration of Distribution Finances
More Power to India • http://dx.doi.org/10.1596/978-1-4648-0233-1
In October 2012 the government announced a Scheme for Financial
Restructuring of State Distribution Companies, available to all loss-making
discoms, that may total Rs 1.9 trillion ($18.7 billion; Ministry of Power 2012).
Under the initiative, state governments would take over 50 percent of the short-term liabilities of distribution utilities outstanding as of March 31, 2012, and
convert it into bonds to be issued by discoms to participating lenders, with
the backing of state governments. The banks would restructure the other
50 percent, with a three-year moratorium on repayment. The restructured debt,
too, would be guaranteed by state governments.
State governments are part of a tripartite agreement to implement the restruc-
turing, in which discoms promise to regularly file petitions for tariff revisions
with their respective SERCs, in line with costs, and reduce aggregate technical
and commercial losses. The central government is making available conditional
transitional financing to support the effort. Two committees, one each at the stateand the central levels, are monitoring the plan’s progress. Discom performance is
to be verified annually through a third party appointed by the Central Electricity
Authority.
But bailouts limit the incentives of utilities, lenders, and others to work to
achieve financial sustainability because they insulate sector participants from the
consequences of their choices. Banks with high exposure to poorly performing
utilities are among the biggest beneficiaries of the bailout, since a large share of
their loans would arguably have turned bad otherwise. While utilities have to
meet certain conditions to benefit from the October 2012 plan, the conditions
appear unlikely to remove moral hazard.
Projected Sector Finances at the End of the 12th Five-Year Plan
Projections for 2012–17, prepared individually for the distribution, transmission,
and generation segments in each state and for bundled utilities, indicate that
sector finances will continue trending downward in the near future. Sector prof-
its after tax (excluding subsidies) are projected to amount to a loss of
Rs 2,013 billion ($43 billion) in 2017 if there are no tariff increases (up from a
loss of Rs 618 billion [$14 billion] in 2011). While the generation and transmis-sion companies are projected to earn profits in 2017, discoms and bundled utili-
ties will continue incurring heavy losses. Even if tariffs rise 6 percent a year to
keep up with the cost of supply, sector annual losses in 2017 are projected to be
Rs 1,253 billion ($27 billion), which will largely need to be met by the govern-
ment because the recent crisis has increased sector risk and made banks and
financial institutions wary of lending to the sector.
The gap between average cost and average revenue is the main driver of high
financial losses. States can address the gap by investing in efficiency improve-
ments and tariff increases. Even then, there will be a rising need for state support.
Over 2013–17, 14 states are forecast to reduce the gap, but only 5 will fully coverthe cost of supply in 2017 (Goa, Himachal Pradesh, Kerala, Maharashtra, and
West Bengal). Himachal Pradesh is likely to go from a moderate loss to profit,
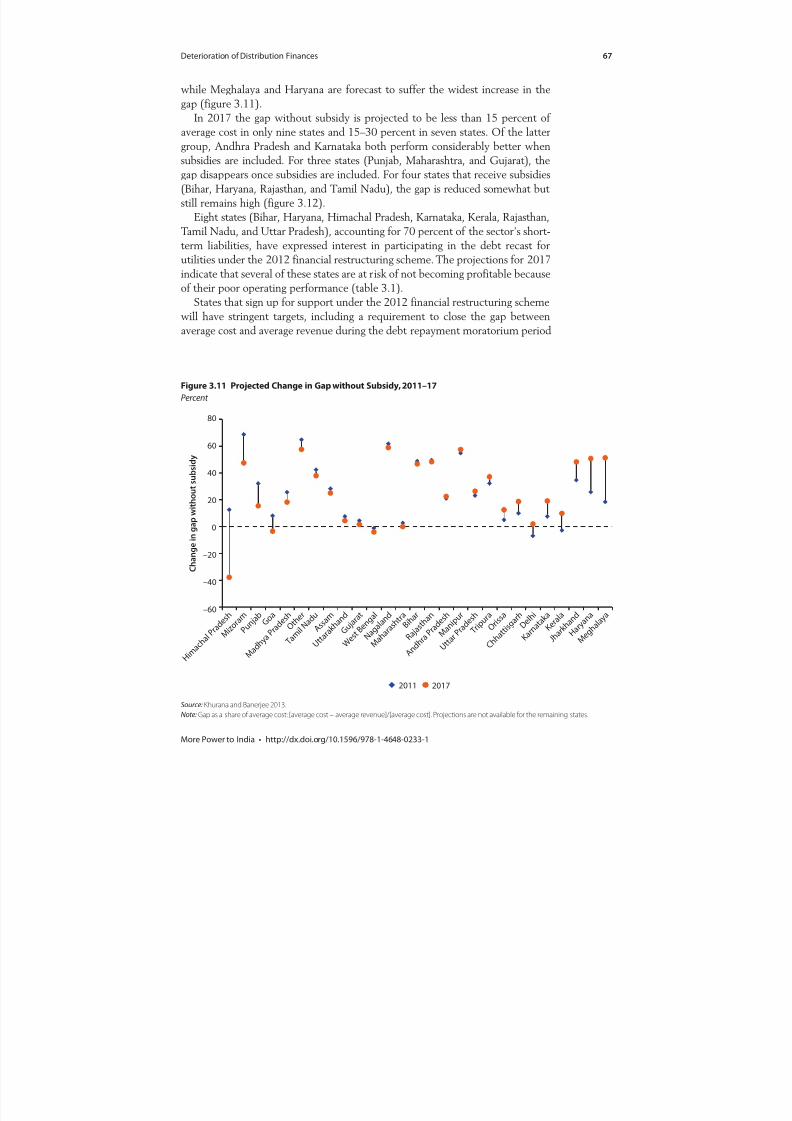
8/20/2019 WB - India Discom Report - Feb15
http://slidepdf.com/reader/full/wb-india-discom-report-feb15 91/255
Deterioration of Distribution Finances 67
More Power to India • http://dx.doi.org/10.1596/978-1-4648-0233-1
while Meghalaya and Haryana are forecast to suffer the widest increase in the
gap (figure 3.11).
In 2017 the gap without subsidy is projected to be less than 15 percent of
average cost in only nine states and 15–30 percent in seven states. Of the lattergroup, Andhra Pradesh and Karnataka both perform considerably better when
subsidies are included. For three states (Punjab, Maharashtra, and Gujarat), the
gap disappears once subsidies are included. For four states that receive subsidies
(Bihar, Haryana, Rajasthan, and Tamil Nadu), the gap is reduced somewhat but
still remains high (figure 3.12).
Eight states (Bihar, Haryana, Himachal Pradesh, Karnataka, Kerala, Rajasthan,
Tamil Nadu, and Uttar Pradesh), accounting for 70 percent of the sector’s short-
term liabilities, have expressed interest in participating in the debt recast for
utilities under the 2012 financial restructuring scheme. The projections for 2017
indicate that several of these states are at risk of not becoming profitable becauseof their poor operating performance (table 3.1).
States that sign up for support under the 2012 financial restructuring scheme
will have stringent targets, including a requirement to close the gap between
average cost and average revenue during the debt repayment moratorium period
Figure 3.11 Projected Change in Gap without Subsidy, 2011–17
Percent
Source: Khurana and Banerjee 2013.
Note: Gap as a share of average cost: [average cost – average revenue]/[average cost]. Projections are not available for the remaining states.
–60
–40
–20
0
20
40
60
80
H i m a
c h a l P r a
d e s h
M i z o
r a m P u
n j a b
G o a
M a d h y a
P r a d e s h O t h e
r
T a m i l N
a d u A s s a m
U t t a r
a k h a
n d
G u j a r
a t
W e s t B e
n g a l
N a g a l a n
d
M a h a
r a s h t
r a B i h
a r
R a j a s t h a n
A n d h r a P r a
d e s h
M a n i p
u r
U t t a r
P r a d e s h
T r i p u r a O r i s s
a
C h h a
t t i s g a r h D e
l h i
K a r n a t a k a K e
r a l a
J h a r k h a
n d
H a r y a
n a
M e g h a
l a y a
C h a n g e i n g a p w i t h o u t s u b s i d y
2011 2017
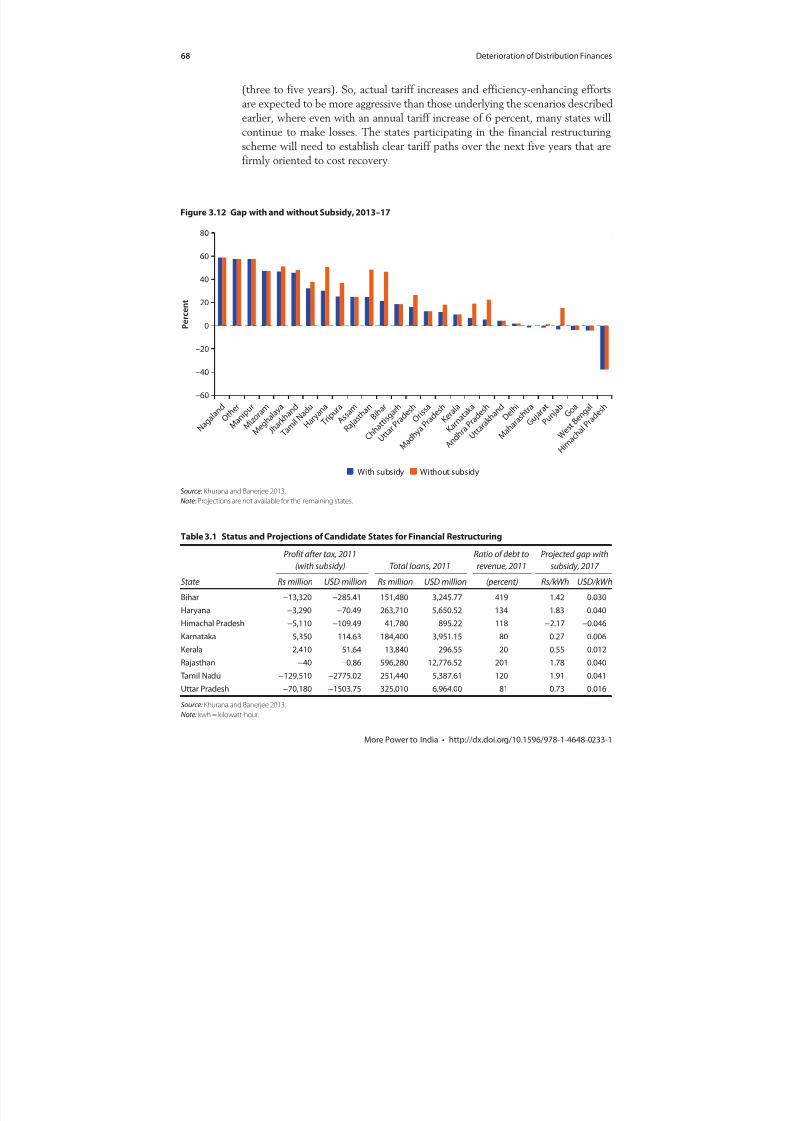
8/20/2019 WB - India Discom Report - Feb15
http://slidepdf.com/reader/full/wb-india-discom-report-feb15 92/255
68 Deterioration of Distribution Finances
More Power to India • http://dx.doi.org/10.1596/978-1-4648-0233-1
Figure 3.12 Gap with and without Subsidy, 2013–17
Source: Khurana and Banerjee 2013.
Note: Projections are not available for the remaining states.
–60
–40
–20
0
20
40
60
80
P e r c e n t
N a g a l a n d O t h e
r
M a n i p u
r
M i z o r a m
M e g h a l a y a J h a r k h a n d
T a m i l N a d u H a
r y a n a T r i p u r a A s s a m R a j a s t h a n B i h a
r
C h h a
t t i s g a r h
U t t a r
P r a d e s h O r i s s a
M a d h y a
P r a d e s h K e r a l a
K a r n a t a k a
A n d h r a P r a
d e s h
U t t a r
a k h a n d D e l h
i
M a h a
r a s h t r a G u j a r a t
P u n j a b G o a
W e s t B e n g a
l
H i m a
c h a l P r a
d e s h
With subsidy Without subsidy
(three to five years). So, actual tariff increases and efficiency-enhancing efforts
are expected to be more aggressive than those underlying the scenarios described
earlier, where even with an annual tariff increase of 6 percent, many states will
continue to make losses. The states participating in the financial restructuringscheme will need to establish clear tariff paths over the next five years that are
firmly oriented to cost recovery.
Table 3.1 Status and Projections of Candidate States for Financial Restructuring
State
Profit after tax, 2011
(with subsidy) Total loans, 2011
Ratio of debt to
revenue, 2011
Projected gap with
subsidy, 2017
Rs million USD million Rs million USD million (percent) Rs/kWh USD/kWh
Bihar −13,320 −285.41 151,480 3,245.77 419 1.42 0.030
Haryana −3,290 −70.49 263,710 5,650.52 134 1.83 0.040
Himachal Pradesh −5,110 −109.49 41,780 895.22 118 −2.17 −0.046
Karnataka 5,350 114.63 184,400 3,951.15 80 0.27 0.006
Kerala 2,410 51.64 13,840 296.55 20 0.55 0.012
Rajasthan −40 −0.86 596,280 12,776.52 201 1.78 0.040
Tamil Nadu −129,510 −2775.02 251,440 5,387.61 120 1.91 0.041
Uttar Pradesh −70,180 −1503.75 325,010 6,964.00 81 0.73 0.016
Source: Khurana and Banerjee 2013.
Note: kwh = kilowatt-hour.

8/20/2019 WB - India Discom Report - Feb15
http://slidepdf.com/reader/full/wb-india-discom-report-feb15 93/255
Deterioration of Distribution Finances 69
More Power to India • http://dx.doi.org/10.1596/978-1-4648-0233-1
Notes
1. This figure includes state subsidies as revenue.
2. The balance sheets of distribution companies have grown, fueled mainly by debt, but
these financial liabilities have not created assets. 3. The diesel subsidy in current crude prices is around Rs 12 ($0.25) per liter. Converted
to per kilowatt-hour (kWh) costs of electricity, this means an imputed subsidy of Rs 1.5 ($0.03) per kWh of electricity generated through diesel. At hours of operation varying between two and three a day, the diesel subsidies provided by the central government to back up power users would be between Rs 88 billion ($1.9 billion) and Rs 131 billion ($2.8 billion). These subsidies are effectively being paid out by the central government in cash to diesel backup users.
References
Khurana, Mani, and Sudeshna G. Banerjee. 2013. “Beyond Crisis: Financial andOperational Performance of India’s Power Sector.” Background paper for this report.
World Bank, Washington, DC.
Ministry of Power. 2012. Scheme for Financial Restructuring of State Distribution Companies(Discoms). Office Memorandum, Government of India, New Delhi. http://powermin.nic.in/whats_new/pdf/Financial_restructuring_of_State_Distribution_Companies_discoms_Oct2012.pdf.

8/20/2019 WB - India Discom Report - Feb15
http://slidepdf.com/reader/full/wb-india-discom-report-feb15 94/255
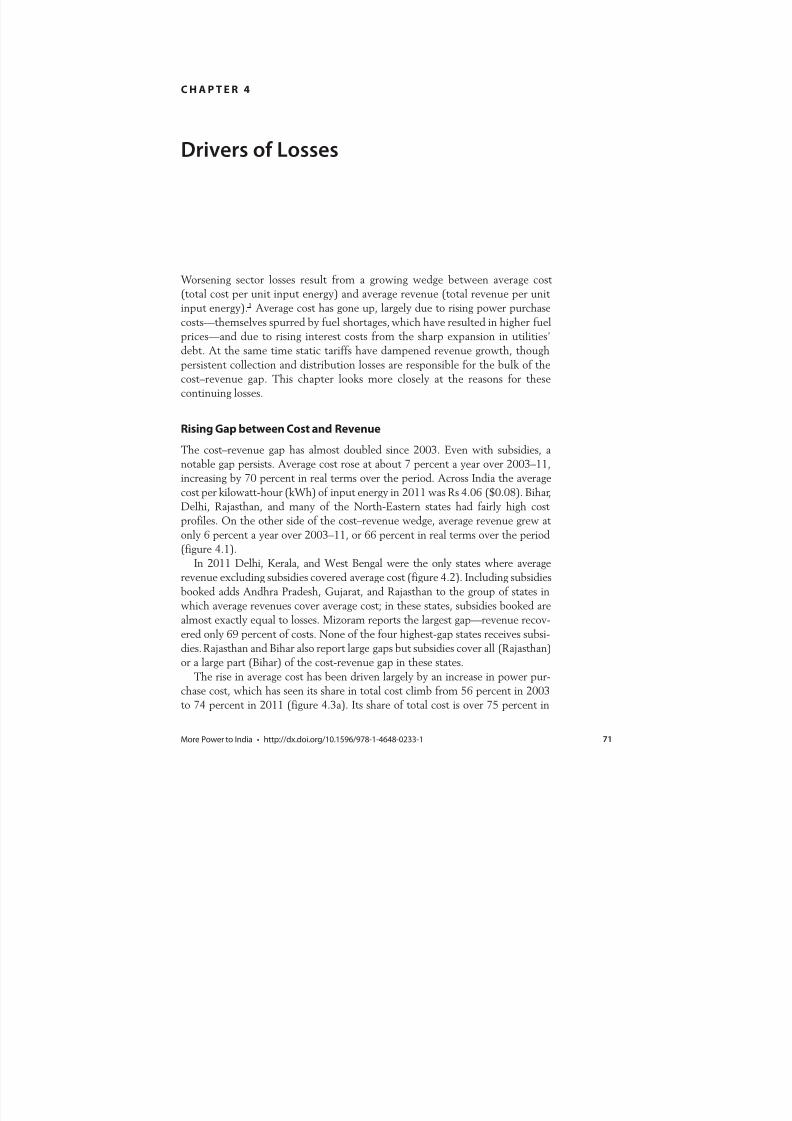
8/20/2019 WB - India Discom Report - Feb15
http://slidepdf.com/reader/full/wb-india-discom-report-feb15 95/255
71More Power to India • http://dx.doi.org/10.1596/978-1-4648-0233-1
Drivers of Losses
Worsening sector losses result from a growing wedge between average cost
(total cost per unit input energy) and average revenue (total revenue per unit
input energy).1 Average cost has gone up, largely due to rising power purchase
costs—themselves spurred by fuel shortages, which have resulted in higher fuel
prices—and due to rising interest costs from the sharp expansion in utilities’
debt. At the same time static tariffs have dampened revenue growth, though
persistent collection and distribution losses are responsible for the bulk of the
cost–revenue gap. This chapter looks more closely at the reasons for these
continuing losses.
Rising Gap between Cost and Revenue
The cost–revenue gap has almost doubled since 2003. Even with subsidies, a
notable gap persists. Average cost rose at about 7 percent a year over 2003–11,
increasing by 70 percent in real terms over the period. Across India the average
cost per kilowatt-hour (kWh) of input energy in 2011 was Rs 4.06 ($0.08). Bihar,
Delhi, Rajasthan, and many of the North-Eastern states had fairly high cost
profiles. On the other side of the cost–revenue wedge, average revenue grew at
only 6 percent a year over 2003–11, or 66 percent in real terms over the period
(figure 4.1).In 2011 Delhi, Kerala, and West Bengal were the only states where average
revenue excluding subsidies covered average cost (figure 4.2). Including subsidies
booked adds Andhra Pradesh, Gujarat, and Rajasthan to the group of states in
which average revenues cover average cost; in these states, subsidies booked are
almost exactly equal to losses. Mizoram reports the largest gap—revenue recov-
ered only 69 percent of costs. None of the four highest-gap states receives subsi-
dies. Rajasthan and Bihar also report large gaps but subsidies cover all (Rajasthan)
or a large part (Bihar) of the cost-revenue gap in these states.
The rise in average cost has been driven largely by an increase in power pur-
chase cost, which has seen its share in total cost climb from 56 percent in 2003
to 74 percent in 2011 (figure 4.3a). Its share of total cost is over 75 percent in
C H A P T E R 4
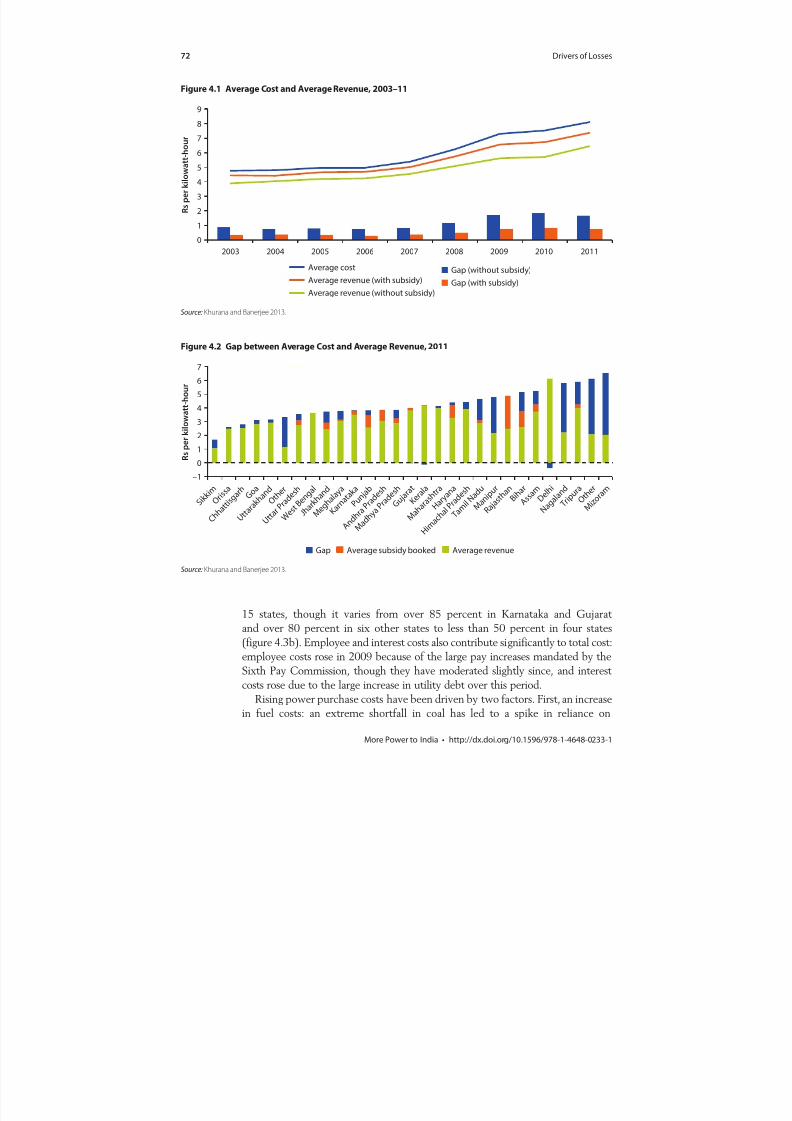
8/20/2019 WB - India Discom Report - Feb15
http://slidepdf.com/reader/full/wb-india-discom-report-feb15 96/255
72 Drivers of Losses
More Power to India • http://dx.doi.org/10.1596/978-1-4648-0233-1
Figure 4.1 Average Cost and Average Revenue, 2003–11
Source: Khurana and Banerjee 2013.
0
1
2
3
4
5
6
7
8
9
2003 2004 2005 2006 2007 2008 2009 2010 2011
R s p e r k i l o w a t t - h o u r
Gap (without subsidy)Gap (with subsidy)
Average revenue (without subsidy)
Average revenue (with subsidy)
Average cost
Figure 4.2 Gap between Average Cost and Average Revenue, 2011
Source: Khurana and Banerjee 2013.
–1
0
1
2
34
5
6
7
S i k k i m
O r i s s
a
C h h a
t t i s g a r h G o
a
U t t a r
a k h a
n d O t h e
r
U t t a r
P r a d e s h
W e s t B e
n g a l
J h a r k h a
n d
M e g h a
l a y a
K a r n a t a k a
P u n j a b
A n d h
r a P r a
d e s h
M a d h y a
P r a d e s h
G u j a r
a t
K e r a l a
M a h a
r a s h t r
a
H a r y a
n a
H i m a
c h a l P r a
d e s h
T a m i l N
a d u
M a n i p
u r
R a j a s t h a n B i h
a r
A s s a m D e
l h i
N a g a l a n
d
T r i p u
r a O t h e
r
M i z o
r a m
R s p e r k i l o w a t t - h o u r
Average revenueAverage subsidy bookedGap
15 states, though it varies from over 85 percent in Karnataka and Gujarat
and over 80 percent in six other states to less than 50 percent in four states
(figure 4.3b). Employee and interest costs also contribute significantly to total cost:
employee costs rose in 2009 because of the large pay increases mandated by the
Sixth Pay Commission, though they have moderated slightly since, and interest
costs rose due to the large increase in utility debt over this period.Rising power purchase costs have been driven by two factors. First, an increase
in fuel costs: an extreme shortfall in coal has led to a spike in reliance on
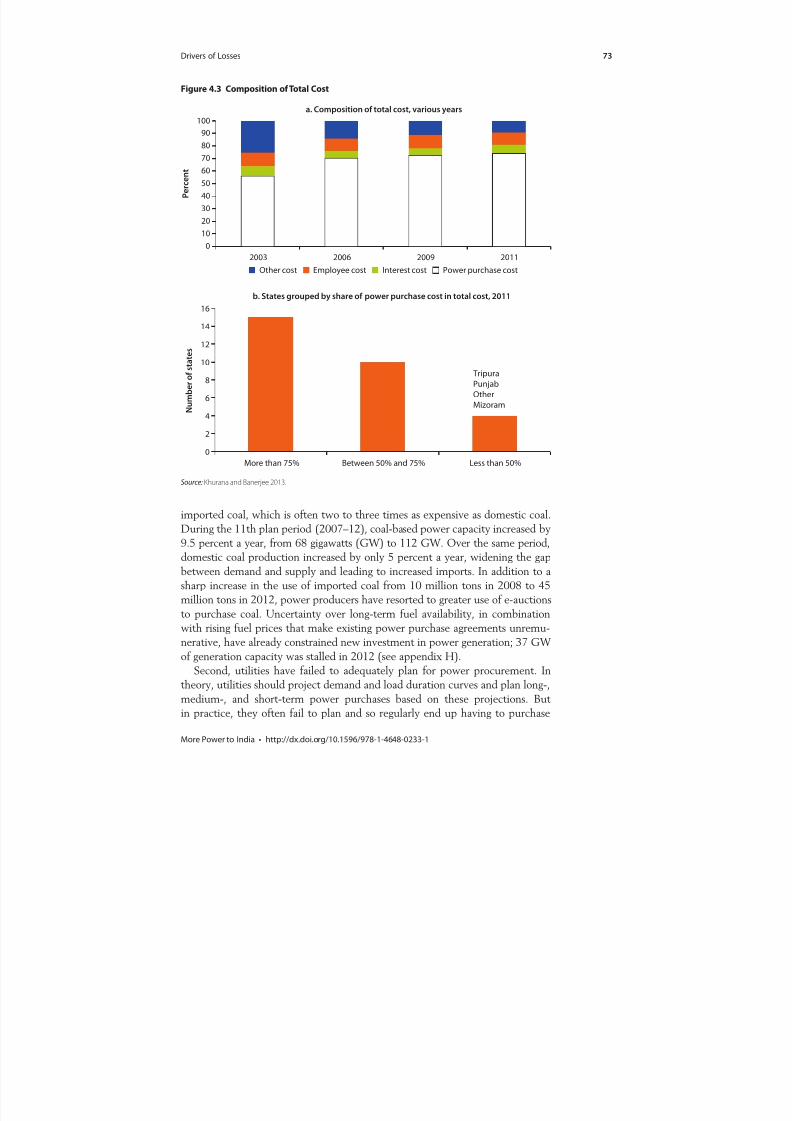
8/20/2019 WB - India Discom Report - Feb15
http://slidepdf.com/reader/full/wb-india-discom-report-feb15 97/255
Drivers of Losses 73
More Power to India • http://dx.doi.org/10.1596/978-1-4648-0233-1
imported coal, which is often two to three times as expensive as domestic coal.
During the 11th plan period (2007–12), coal-based power capacity increased by
9.5 percent a year, from 68 gigawatts (GW) to 112 GW. Over the same period,domestic coal production increased by only 5 percent a year, widening the gap
between demand and supply and leading to increased imports. In addition to a
sharp increase in the use of imported coal from 10 million tons in 2008 to 45
million tons in 2012, power producers have resorted to greater use of e-auctions
to purchase coal. Uncertainty over long-term fuel availability, in combination
with rising fuel prices that make existing power purchase agreements unremu-
nerative, have already constrained new investment in power generation; 37 GW
of generation capacity was stalled in 2012 (see appendix H).
Second, utilities have failed to adequately plan for power procurement. In
theory, utilities should project demand and load duration curves and plan long-,medium-, and short-term power purchases based on these projections. But
in practice, they often fail to plan and so regularly end up having to purchase
Figure 4.3 Composition of Total Cost
0
10
20
30
40
50
60
70
8090
100
a. Composition of total cost, various years
2003 2006 2009 2011
P e r c e n t
Power purchase costInterest costEmployee costOther cost
0
2
4
6
8
10
12
14
16
More than 75% Between 50% and 75% Less than 50%
N
u m b e r o f s t a t e s
Tripura
Punjab
Other
Mizoram
b. States grouped by share of power purchase cost in total cost, 2011
Source: Khurana and Banerjee 2013.

8/20/2019 WB - India Discom Report - Feb15
http://slidepdf.com/reader/full/wb-india-discom-report-feb15 98/255
74 Drivers of Losses
More Power to India • http://dx.doi.org/10.1596/978-1-4648-0233-1
expensive electricity in the short-term markets or through unscheduled inter-
change (or, alternatively, resort to load shedding). Andhra Pradesh is known to
rely on load shedding, while Haryana, Punjab, Uttarakhand, and Uttar Pradesh
resort to heavy use of the unscheduled interchange mechanism.Rising interest costs, driven by distribution companies’ (discoms’) increased
borrowing, have also put upward pressure on utility cost profiles. In recent years,
with the limited revisions of retail tariffs, discoms have had to borrow to meet
operating expenses. If there is no relief on the revenue side (through tariff
changes and efficiency improvements), this initiates a vicious circle, in which
interest costs grow and utilities end up taking fresh short-term loans to repay
earlier loans.
Inefficiencies in Distribution and Generation
Power purchase costs differ widely across states, driven by a variety of
fundamentals2 and, as noted, by the effectiveness of a state’s power procure-
ment planning (or lack thereof). Stochastic frontier analysis3 can be used to
control for the variations in those fundamentals and estimate how far each
state is from its cost-efficiency frontier (figure 4.4).
By efficiency score, Assam, Himachal Pradesh, Uttarakhand, Jharkhand, and
Bihar are the least-efficient states in power purchase. Bihar and Jharkhand are
inefficient largely because their state-owned generation plants have very low
plant load factors; thus, they rely heavily on out-of-state power purchases despite
having in-state generation capacity. By contrast, Assam, with an 8 percent energydeficit, has not secured adequate supply through long-term contracts. To meet its
demand shortage, it buys large amounts of power (24 percent in 2010) through
expensive bilateral transactions and on power exchanges. Himachal Pradesh and
Figure 4.4 Power Purchase Efficiency Scores Based on Stochastic Frontier Analysis
Source: Khurana and Banerjee 2013.
Note: Unity represents efficiency, and higher scores indicate greater inefficiency.
1.0
1.1
1.2
1.3
1.4
1.5
A n d h r a P r a
d e s h
T a m i l N
a d u
M a h a
r a s h t
r a
W e s t B e
n g a l
U t t a r
P r a d e s h
G u j a r
a t
R a j a s
t h a n
K a r n a t a k a
H a r y a
n a
M
a d h y
a P r a d
e s h
P u n j a b
C h h a
t t i s g a r h
K e r a l a
B i h a r
J h a r k h a
n d
U t t a r
a k h a
n d
H i m a
c h a l P r a
d e s h
A s s a m
E f f i c i e n c y
s c o r e
Less
efficient

8/20/2019 WB - India Discom Report - Feb15
http://slidepdf.com/reader/full/wb-india-discom-report-feb15 99/255
Drivers of Losses 75
More Power to India • http://dx.doi.org/10.1596/978-1-4648-0233-1
Uttarakhand rely heavily on in-state hydro resources that, while inexpensive, are
not reliable in the winter—or in the summer if the monsoon is delayed. In such
cases these states have had to sign short-term power contracts to make up the
deficit, driving up their power purchase costs.Inefficiencies in distribution also reflect inefficiencies in the upstream gen-
eration segment. Substantial cost savings are possible by using fuel resources
efficiently. Background analysis for this report has used data envelopment
analysis to identify chronic underperformers in generation (Khurana and
Banerjee 2013).4 In these cases, shutting down the plants and using the fuel in
efficient plants would serve both utility finances and the sector much better. It
would also allow the use of efficient generation capacity currently stranded due
to a shortage of fuel.
In a group of 80 thermal plants selected for this analysis (out of the 107 in the
2010 Central Electricity Authority review; CEA 2011), representing 91 percentof total thermal capacity in India, the data envelopment analysis score ranges
from 0 to 1, with 1 being the most efficient (within the sample). Based on the
analysis, of 69 state-owned thermal plants, more than half need either to be shut
down or to be renovated and modernized. All the plants in Bihar and Jharkhand
fall into these two categories (figure 4.5).
If the six worst-performing power plants had been operating at the
national average station heat rate,5 more than 2,750 million kWh of additional
electricity could have been generated, saving the generation companies about
Rs 9 billion ($0.2 billion). This would also have enabled the states to reduce
their reliance on short-term purchases, further saving about Rs 9 billion($0.2 billion) for the discoms. Uttar Pradesh and Bihar would particularly
have benefited; the two states accounted for more than 30 percent of total
short-term purchases in 2011.
Figure 4.5 Thermal Power Plant Status by State
Source: Khurana and Banerjee 2013.
0
2
4
6
8
10
12
D e l h i
H a r y a
n a
R a j a s
t h a n
K a r n
a t a k a
J h a r k h a
n d B i h a
r
P u n j a
b
T a m i l N
a d u
O r i s s
a
G u j a r
a t
U t t a r
P r a d
e s h
C h h a
t t i s g a
r h
A n d h
r a P r a
d e s h
M a h a
r a s h t
r a
W e s t
B e n g a
l
N u m b e r o f p l a n t s
Need to be shut downNeed to be renovated and modernizedNeed to be improvedAre fine
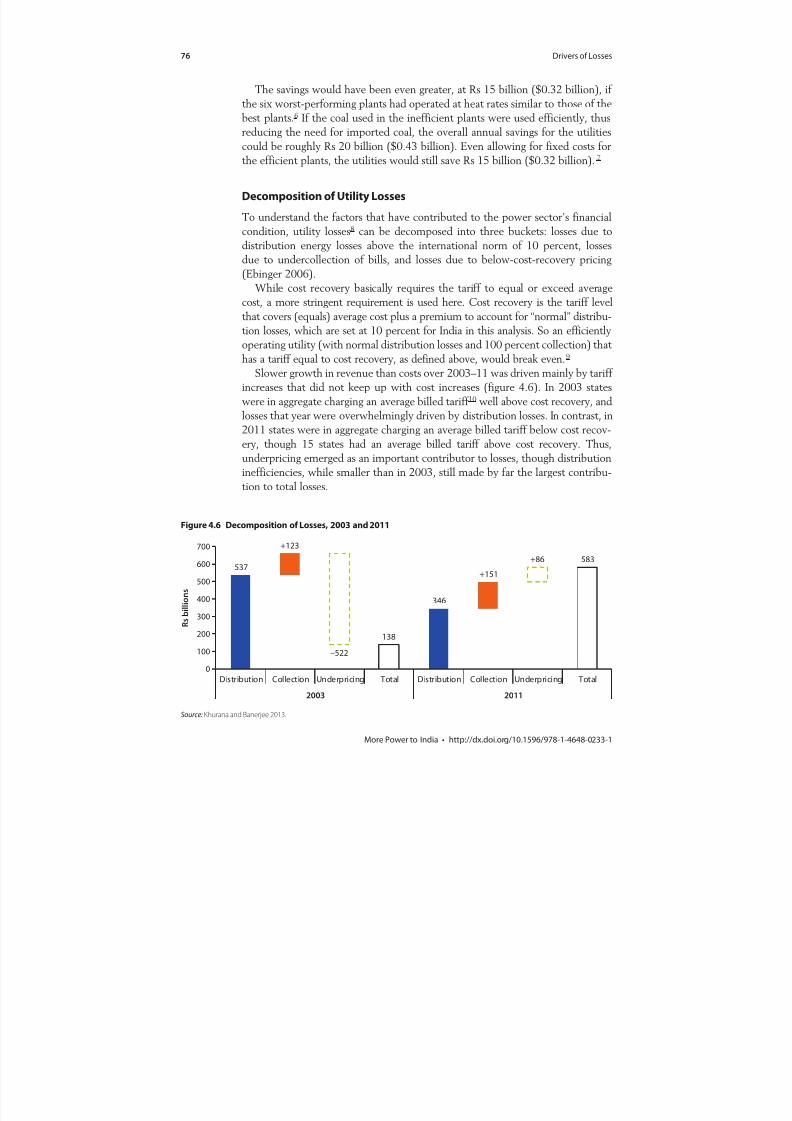
8/20/2019 WB - India Discom Report - Feb15
http://slidepdf.com/reader/full/wb-india-discom-report-feb15 100/255
76 Drivers of Losses
More Power to India • http://dx.doi.org/10.1596/978-1-4648-0233-1
The savings would have been even greater, at Rs 15 billion ($0.32 billion), if
the six worst-performing plants had operated at heat rates similar to those of the
best plants.6 If the coal used in the inefficient plants were used efficiently, thus
reducing the need for imported coal, the overall annual savings for the utilitiescould be roughly Rs 20 billion ($0.43 billion). Even allowing for fixed costs for
the efficient plants, the utilities would still save Rs 15 billion ($0.32 billion). 7
Decomposition of Utility Losses
To understand the factors that have contributed to the power sector’s financial
condition, utility losses8 can be decomposed into three buckets: losses due to
distribution energy losses above the international norm of 10 percent, losses
due to undercollection of bills, and losses due to below-cost-recovery pricing
(Ebinger 2006). While cost recovery basically requires the tariff to equal or exceed average
cost, a more stringent requirement is used here. Cost recovery is the tariff level
that covers (equals) average cost plus a premium to account for “normal” distribu-
tion losses, which are set at 10 percent for India in this analysis. So an efficiently
operating utility (with normal distribution losses and 100 percent collection) that
has a tariff equal to cost recovery, as defined above, would break even.9
Slower growth in revenue than costs over 2003–11 was driven mainly by tariff
increases that did not keep up with cost increases (figure 4.6). In 2003 states
were in aggregate charging an average billed tariff 10 well above cost recovery, and
losses that year were overwhelmingly driven by distribution losses. In contrast, in2011 states were in aggregate charging an average billed tariff below cost recov-
ery, though 15 states had an average billed tariff above cost recovery. Thus,
underpricing emerged as an important contributor to losses, though distribution
inefficiencies, while smaller than in 2003, still made by far the largest contribu-
tion to total losses.
Figure 4.6 Decomposition of Losses, 2003 and 2011
Source: Khurana and Banerjee 2013.
537
+123
–522
138
346
+151
+86 583
0
100
200
300
400
500
600
700
Distribution Collection Underpricing Total Distribution Collection Underpricing Total
2003 2011
R s b i l l i o n s
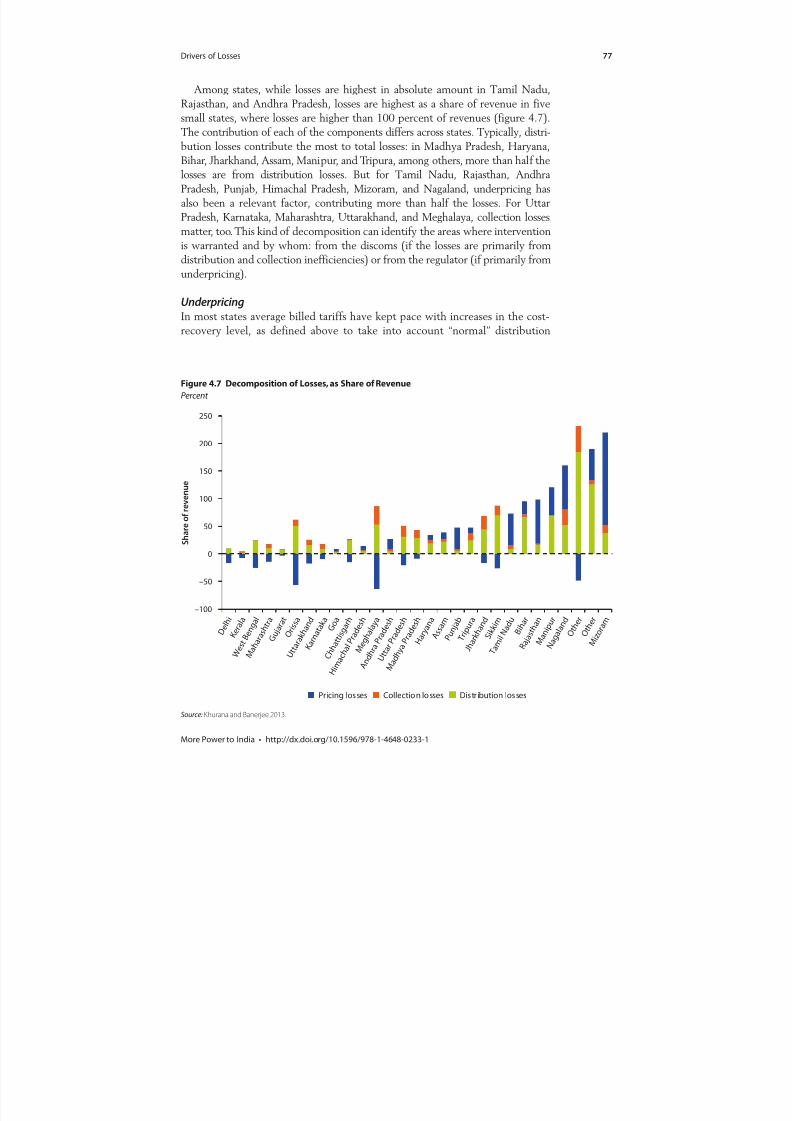
8/20/2019 WB - India Discom Report - Feb15
http://slidepdf.com/reader/full/wb-india-discom-report-feb15 101/255
Drivers of Losses 77
More Power to India • http://dx.doi.org/10.1596/978-1-4648-0233-1
Among states, while losses are highest in absolute amount in Tamil Nadu,
Rajasthan, and Andhra Pradesh, losses are highest as a share of revenue in five
small states, where losses are higher than 100 percent of revenues (figure 4.7).
The contribution of each of the components differs across states. Typically, distri-bution losses contribute the most to total losses: in Madhya Pradesh, Haryana,
Bihar, Jharkhand, Assam, Manipur, and Tripura, among others, more than half the
losses are from distribution losses. But for Tamil Nadu, Rajasthan, Andhra
Pradesh, Punjab, Himachal Pradesh, Mizoram, and Nagaland, underpricing has
also been a relevant factor, contributing more than half the losses. For Uttar
Pradesh, Karnataka, Maharashtra, Uttarakhand, and Meghalaya, collection losses
matter, too. This kind of decomposition can identify the areas where intervention
is warranted and by whom: from the discoms (if the losses are primarily from
distribution and collection inefficiencies) or from the regulator (if primarily from
underpricing).
UnderpricingIn most states average billed tariffs have kept pace with increases in the cost-
recovery level, as defined above to take into account “normal” distribution
Figure 4.7 Decomposition of Losses, as Share of Revenue
Percent
Source: Khurana and Banerjee 2013.
–100
–50
0
50
100
150
200
250
D e l h i
K e r a l a
W e s t B e
n g a l
M a h a
r a s h t
r a
G u j a r
a t
O r i s s
a
U t t a r a k h a
n d
K a r n a t a k a
G o a
C h h a
t t i s g a r h
H i m a c h a l P r
a d e s h
M e g h a l a
y a
A n d h
r a P r a d
e s h
U t t a r P r
a d e s h
M a d h y
a P r
a d e s h
H a r y a n a
A s s a m
P u n j a b
T r i p u r a
J h a r k h a
n d
S i k k i
m
T a m i l N a
d u B i h a
r
R a j a s
t h a n
M a n i p u r
N a g a l a
n d
O t h e
r
O t h e
r
M i z o
r a m
S h a r e
o f r e v e n u e
Pricing losses Collection losses Distribution losses

8/20/2019 WB - India Discom Report - Feb15
http://slidepdf.com/reader/full/wb-india-discom-report-feb15 102/255
78 Drivers of Losses
More Power to India • http://dx.doi.org/10.1596/978-1-4648-0233-1
losses of 10 percent, but the number of states where underpricing has
contributed to utility losses has risen over time. In 2003 tariffs did not meet
cost-recovery levels in only 7 states—in 2011 the number of such states was
14. Some states show a precipitous fall in cost recovery, such as Bihar, Haryana,Punjab, Rajasthan, Maharashtra, and Tamil Nadu. But more important, even
for states where tariffs continued to meet cost-recovery levels and so did not
add to utility losses, the margins were smaller. In addition, there are a few
states that reduced underpricing. Uttar Pradesh, Orissa, West Bengal, and
Meghalaya all saw gains from increases in tariffs, and thus underpricing made
a smaller contribution to utility losses in 2011 than in 2003 in these states
(figure 4.8).
For India in 2011, the average billed tariff trailed the cost-recovery tariff level
by Rs 0.16/kWh ($0.003/kWh), while average cost was lower than average billed
tariff by Rs 0.32/kWh ($0.007/kWh). Since 2003 the average billed tariff hasbeen higher than average cost, but it dropped below the cost-recovery level from
2008 onward (figure 4.9a). In 2011, 15 states had average billed tariffs exceeding
the cost-recovery tariff level, while 20 states had average billed tariffs higher than
average cost. Assam, Goa, Haryana, Himachal Pradesh, and Tripura all had aver-
age billed tariffs that met average cost but did not reach cost recovery.
On average, states increased tariffs at least once every two years from
2007/08 to 2012/13. Three states increased tariffs each year while Sikkim did
Figure 4.8 Losses from Underpricing
Source: Khurana and Banerjee 2013.
0
–150
–100
–50
50
100
150
M a h a
r a s h t
r a
U t t a r P r
a d e s h
O r i s s
a
W e s t B e
n g a l
D e l h i
K a r n a t a k a
M a d h y
a P r
a d e s h
G u j a r
a t
C h h a
t t i s g a r h
O t h e
r
K e r a l a
U t t a r a k h a
n d
J h a r k h a
n d
M e g h a l a
y a
S i k k i
m
T r i p u r a
G o a
O t h e
r
M a n i p u r
N a g a l a
n d
M i z o
r a m
A s s a m
H i m a c h a l P r
a d e s h
B i h a
r
H a r y a n a
A n d h
r a P r a d
e s h
P u n j a b
R a j a s
t h a n
T a m i l N a
d u
R s b i l l i o n s
2003 2011

8/20/2019 WB - India Discom Report - Feb15
http://slidepdf.com/reader/full/wb-india-discom-report-feb15 103/255
Drivers of Losses 79
More Power to India • http://dx.doi.org/10.1596/978-1-4648-0233-1
not revise tariffs at all in the six-year period. The frequency of tariff increases
varied from year to year—for instance, in 2008/09 only 13 states reported tariff
increases, compared with 2012/13 when about 26 states issued orders to raise
tariffs. Goa—one of the best performers—did not issue a tariff order for the firstfive years in this period, finally raising tariffs only in 2012/13 (figure 4.9b).
DistributionThe difference between input energy and energy sold equals the distribution loss.
Distribution losses, comprising both technical and nontechnical losses, have
followed a downward trajectory since 2003 when average distribution losses were
about 32 percent and 18 states reported losses above this average (figure 4.10).
Figure 4.9 Tariff Performance
0
5
10
15
20
25
–0.4
–0.3
–0.2
–0.1
0
0.1
0.2
0.3
0.4
0.5
0.6
2005 2006 2007 2008 2009 2010 2011
N u m b e r o f s t a t e s
R s p e
r k i l o w a t t - h o u r
a. Gap between average billed tariff and cost-recovery tariff level and number
of states achieving cost recovery, 2005–11
Gap between average billed tariff and cost-recovery tariff level
States achieving cost recovery
0
1
2
3
4
5
6
7
S i k k i m G o a
T r i p
u r a
M a n i p
u r
M i z
o r a m
N a g a l a
n d
R a j a s
t h a n
T a m i l N
a d u
A s s a m
H a r y a n
a
J h a r k h a
n d
K e r a l a
U
t t a r P r
a d e s h
B i h a r
C h h a t t i s g
a r h
D e l h i
G u j a r
a t
W e s t B e
n g a l
H i m a
c h a l P r
a d e s h
O t h e
r
K a r n a t a k a
M a d h y
a P r
a d e s h
M a h a
r a s h t
r a
M e g h a l a
y a
O r i s s
a
U t t a
r a k h a
n d
A n d h r
a P r
a d e s h
O t h e
r
P u n j a b
N u m b e r o f t a r i ff i n c r e a s
e s
b. Number of tariff increases by state, 2008–13
Source: Khurana and Banerjee 2013.
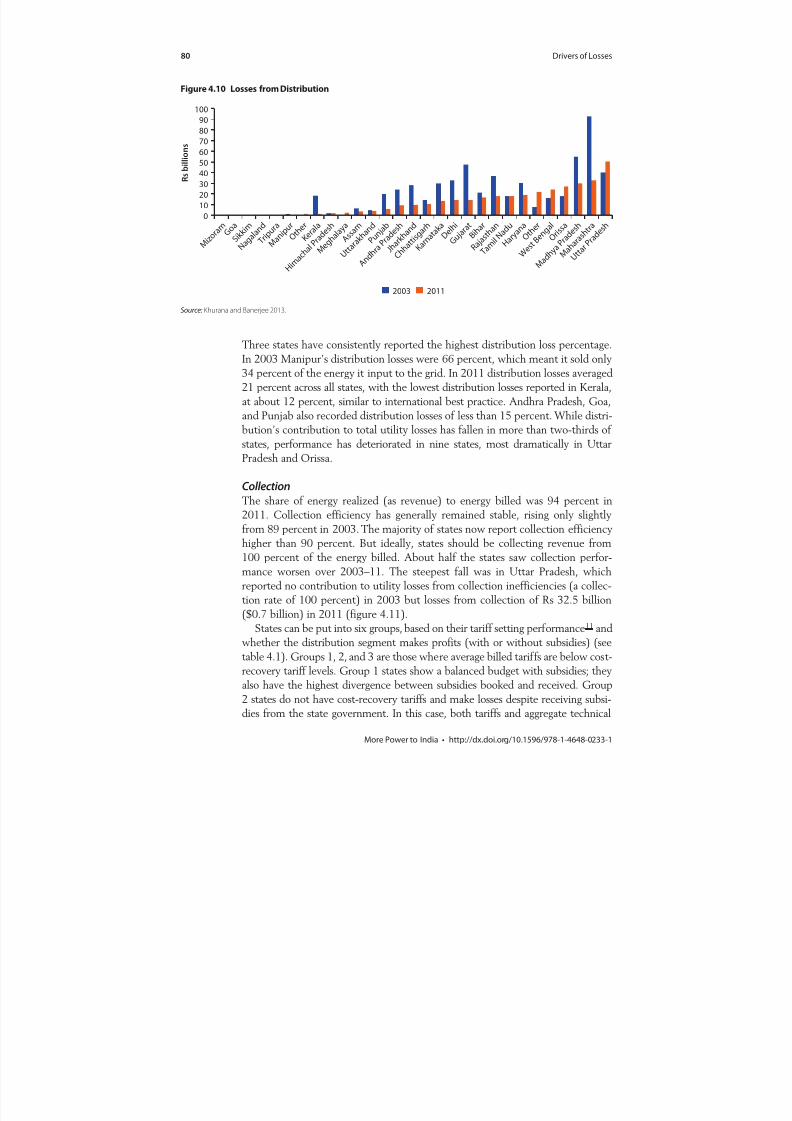
8/20/2019 WB - India Discom Report - Feb15
http://slidepdf.com/reader/full/wb-india-discom-report-feb15 104/255
80 Drivers of Losses
More Power to India • http://dx.doi.org/10.1596/978-1-4648-0233-1
Three states have consistently reported the highest distribution loss percentage.
In 2003 Manipur’s distribution losses were 66 percent, which meant it sold only
34 percent of the energy it input to the grid. In 2011 distribution losses averaged
21 percent across all states, with the lowest distribution losses reported in Kerala,
at about 12 percent, similar to international best practice. Andhra Pradesh, Goa,
and Punjab also recorded distribution losses of less than 15 percent. While distri-bution’s contribution to total utility losses has fallen in more than two-thirds of
states, performance has deteriorated in nine states, most dramatically in Uttar
Pradesh and Orissa.
CollectionThe share of energy realized (as revenue) to energy billed was 94 percent in
2011. Collection efficiency has generally remained stable, rising only slightly
from 89 percent in 2003. The majority of states now report collection efficiency
higher than 90 percent. But ideally, states should be collecting revenue from100 percent of the energy billed. About half the states saw collection perfor-
mance worsen over 2003–11. The steepest fall was in Uttar Pradesh, which
reported no contribution to utility losses from collection inefficiencies (a collec-
tion rate of 100 percent) in 2003 but losses from collection of Rs 32.5 billion
($0.7 billion) in 2011 (figure 4.11).
States can be put into six groups, based on their tariff setting performance11 and
whether the distribution segment makes profits (with or without subsidies) (see
table 4.1). Groups 1, 2, and 3 are those where average billed tariffs are below cost-
recovery tariff levels. Group 1 states show a balanced budget with subsidies; they
also have the highest divergence between subsidies booked and received. Group2 states do not have cost-recovery tariffs and make losses despite receiving subsi-
dies from the state government. In this case, both tariffs and aggregate technical
Figure 4.10 Losses from Distribution
Source: Khurana and Banerjee 2013.
0
10
20
30
40
50
60
70
80
90
100
M i z o
r a m G o a
S i k k i m
N a g a l a n
d
T r i p u r a
M a n i p
u r O t h e
r
K e r a l a
H i m a
c h a l P r a
d e s h
M e g h a
l a y a
A s s a m
U t t a r
a k h a
n d
P u n j a b
A n d h
r a P r a
d e s h
J h a r k h a
n d
C h h a
t t i s g a r h
K a r n a
t a k a D e l h i
G u j a r
a t B i h
a r
R a j a s
t h a n
T a m i l N
a d u
H a r y a
n a O t h e
r
W e s t B e
n g a l
O r i s s
a
M a d h y a
P r a d e s h
M a h a
r a s h t
r a
U t t a r
P r a d e s h
R s b i l l i o n s
2003 2011
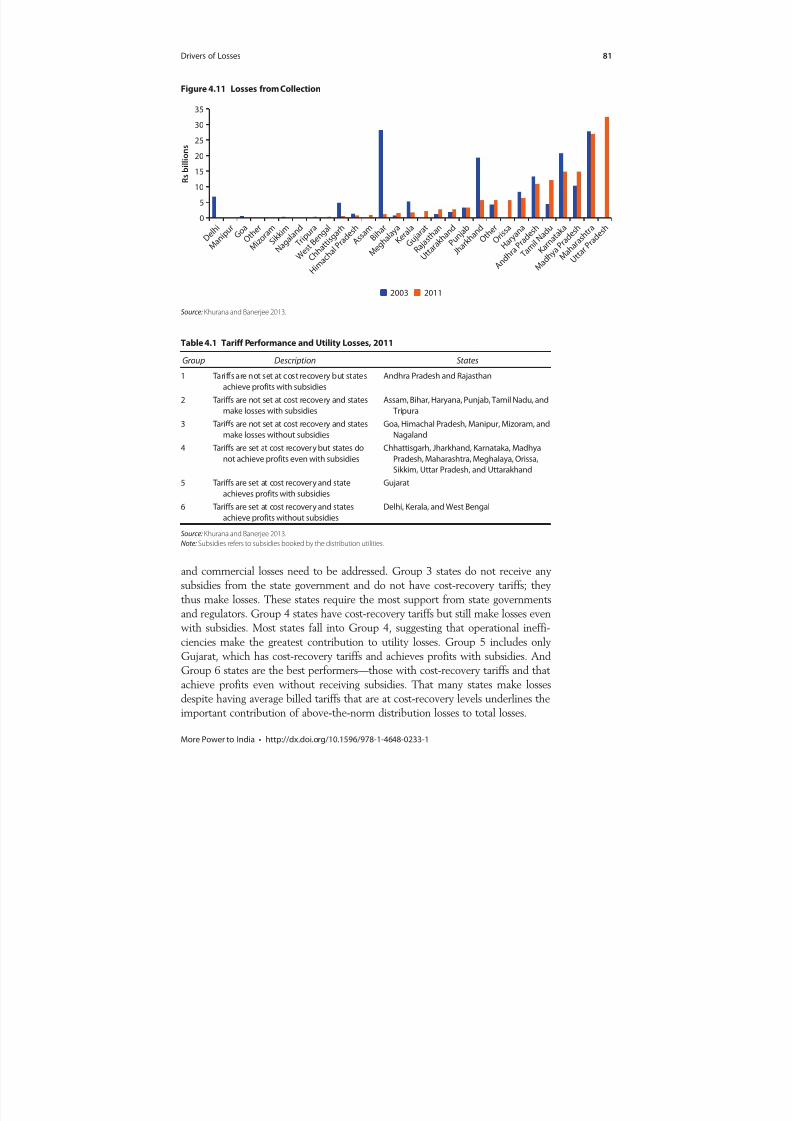
8/20/2019 WB - India Discom Report - Feb15
http://slidepdf.com/reader/full/wb-india-discom-report-feb15 105/255
Drivers of Losses 81
More Power to India • http://dx.doi.org/10.1596/978-1-4648-0233-1
and commercial losses need to be addressed. Group 3 states do not receive any
subsidies from the state government and do not have cost-recovery tariffs; they
thus make losses. These states require the most support from state governments
and regulators. Group 4 states have cost-recovery tariffs but still make losses even
with subsidies. Most states fall into Group 4, suggesting that operational ineffi-
ciencies make the greatest contribution to utility losses. Group 5 includes only
Gujarat, which has cost-recovery tariffs and achieves profits with subsidies. And
Group 6 states are the best performers—those with cost-recovery tariffs and that
achieve profits even without receiving subsidies. That many states make lossesdespite having average billed tariffs that are at cost-recovery levels underlines the
important contribution of above-the-norm distribution losses to total losses.
Figure 4.11 Losses from Collection
Source: Khurana and Banerjee 2013.
0
5
10
15
20
25
30
35
D e l h i
M a n i p
u r G o a O t h e
r
M i z o
r a m S i k k i m
N a g a l a n
d
T r i p u r a
W e s t B e
n g a l
C h h a
t t i s g a r h
H i m
a c h a l P
r a d e s h A s s a m B i h
a r
M e g h a
l a y a K e
r a l a
G u j a r
a t
R a j a s
t h a n
U t t a r
a k h a
n d
P u n j a b
J h a r k h a
n d O t h e
r O r i s s
a
H a r y a
n a
A n d h
r a P r a
d e s h
T a m i l N
a d u
K a r n a t a k a
M a d h y a
P r a d e s h
M a h a
r a s h t
r a
U t t a r
P r a d e s h
R s b i l l i o n s
2003 2011
Table 4.1 Tariff Performance and Utility Losses, 2011
Group Description States
1 Tariffs are not set at cost recovery but states
achieve profits with subsidies
Andhra Pradesh and Rajasthan
2 Tariffs are not set at cost recovery and states
make losses with subsidies
Assam, Bihar, Haryana, Punjab, Tamil Nadu, and
Tripura3 Tariffs are not set at cost recovery and states
make losses without subsidies
Goa, Himachal Pradesh, Manipur, Mizoram, and
Nagaland
4 Tariffs are set at cost recovery but states do
not achieve profits even with subsidies
Chhattisgarh, Jharkhand, Karnataka, Madhya
Pradesh, Maharashtra, Meghalaya, Orissa,
Sikkim, Uttar Pradesh, and Uttarakhand
5 Tariffs are set at cost recovery and state
achieves profits with subsidies
Gujarat
6 Tariffs are set at cost recovery and states
achieve profits without subsidies
Delhi, Kerala, and West Bengal
Source: Khurana and Banerjee 2013.
Note: Subsidies refers to subsidies booked by the distribution utilities.
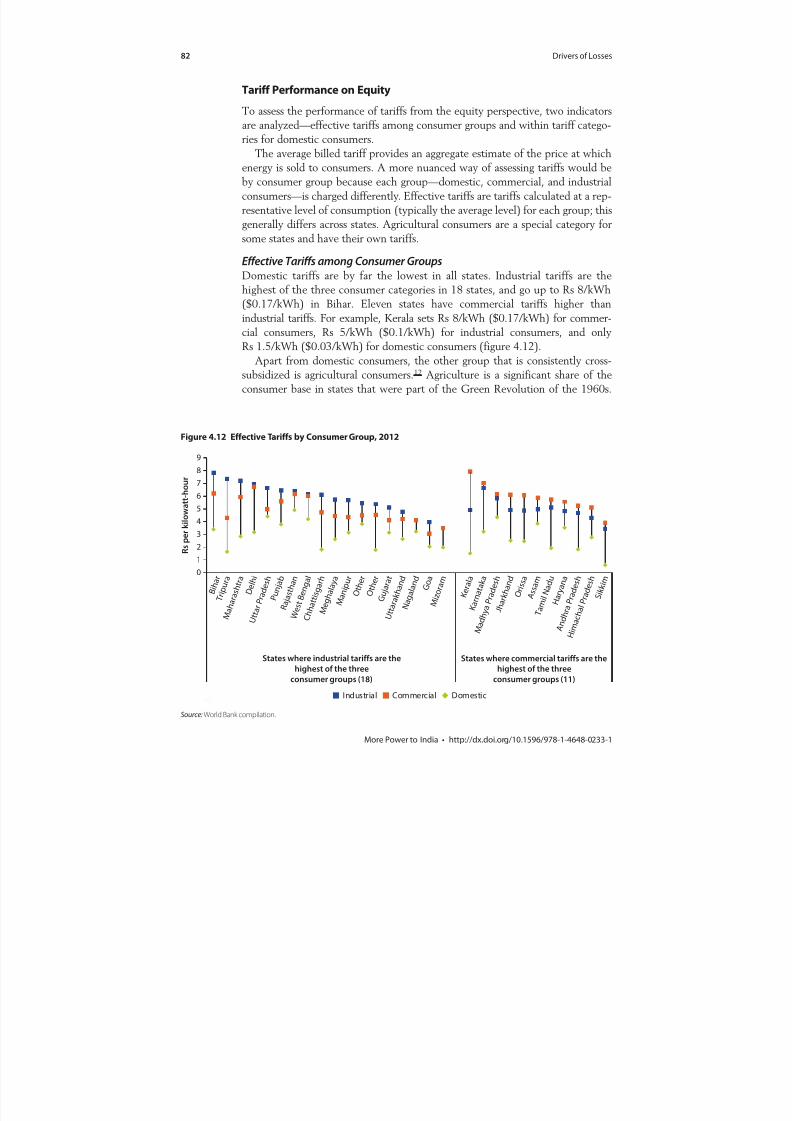
8/20/2019 WB - India Discom Report - Feb15
http://slidepdf.com/reader/full/wb-india-discom-report-feb15 106/255
82 Drivers of Losses
More Power to India • http://dx.doi.org/10.1596/978-1-4648-0233-1
Tariff Performance on Equity
To assess the performance of tariffs from the equity perspective, two indicators
are analyzed—effective tariffs among consumer groups and within tariff catego-
ries for domestic consumers.The average billed tariff provides an aggregate estimate of the price at which
energy is sold to consumers. A more nuanced way of assessing tariffs would be
by consumer group because each group—domestic, commercial, and industrial
consumers—is charged differently. Effective tariffs are tariffs calculated at a rep-
resentative level of consumption (typically the average level) for each group; this
generally differs across states. Agricultural consumers are a special category for
some states and have their own tariffs.
Effective Tariffs among Consumer Groups
Domestic tariffs are by far the lowest in all states. Industrial tariffs are thehighest of the three consumer categories in 18 states, and go up to Rs 8/kWh
($0.17/kWh) in Bihar. Eleven states have commercial tariffs higher than
industrial tariffs. For example, Kerala sets Rs 8/kWh ($0.17/kWh) for commer-
cial consumers, Rs 5/kWh ($0.1/kWh) for industrial consumers, and only
Rs 1.5/kWh ($0.03/kWh) for domestic consumers (figure 4.12).
Apart from domestic consumers, the other group that is consistently cross-
subsidized is agricultural consumers.12 Agriculture is a significant share of the
consumer base in states that were part of the Green Revolution of the 1960s.
Figure 4.12 Effective Tariffs by Consumer Group, 2012
Source: World Bank compilation.
0
12
3
4
5
6
7
8
9
B i h a r
P u n j a b
R a j a s
t h a n
M e g h a l a y a
M a n i p u r
G u j a r
a t
W e s t B e
n g a l
C h h a t t i s g
a r h
O t h e
r
O t h e
r
U t t a r
a k h a n d
N a g a l a n
d G o a
M i z o
r a m
K a r n a t a k a
J h a r k h a
n d
O r i s s
a
A s s a m
H a r y a n
a
M a d h y a
P r a d e
s h
T a m i l N
a d u
A n d h r
a P r
a d e s h
H i m
a c h a l P r
a d e s h
S i k k i m
States where industrial tariffs are the
highest of the three
consumer groups (18)
States where commercial tariffs are the
highest of the three
consumer groups (11)
R s p e r k i l o w a t t - h o u r
Industrial Commercial Domestic
T r i p u r
a
M a h a
r a s h t r a
D e l h i
U t t a r
P r a d e
s h
K e r a l a

8/20/2019 WB - India Discom Report - Feb15
http://slidepdf.com/reader/full/wb-india-discom-report-feb15 107/255
Drivers of Losses 83
More Power to India • http://dx.doi.org/10.1596/978-1-4648-0233-1
Box 4.1 Improving Rural Supply: Rural Feeder Segregation in Indian States
Power supply to agriculture is heavily subsidized and charged at a flat rate per horsepower per
pump. These conditions remove the price incentive for farmers to control their use of power.In response, state utilities seek to limit the power supply to agriculture to six to eight hours
a day, often in the evenings. But in most villages, feeders supply both nonagriculture and
agriculture loads, so this necessarily also limits the power supply for productive nonagricul-
tural activities and households. Combined feeders prevent utilities from distinguishing
between power used for agriculture or for other rural uses or even from monitoring the total
amount of power lost (such as through theft and technical inefficiencies).
Several states in India (Andhra Pradesh, Gujarat, Haryana, Punjab, Karnataka, Maharashtra,
Madhya Pradesh, and Rajasthan) have launched programs to segregate feeders into rural agri-
cultural and nonagricultural consumers, thus physically separating paid and nominally paid
loads. This mechanism enables utilities to measure and limit the amount of power suppliedfree for agriculture while ensuring that rural nonagricultural consumers receive higher quality
supply for longer periods.
The approach to load segregation has varied according to each state’s politics, regulatory
practices, and power sector development. For example, Haryana has used feeder segregation
to address high distribution losses. Rajasthan has tackled it through an integrated Feeder
Renovation Programme (which included other system-strengthening works) while Gujarat
has addressed it alongside groundwater issues in an integrated rural development approach.
The technical approach has also varied. Rajasthan undertook virtual segregation (single-phase
supply for all rural households) and Haryana physical (three-phase supply for rural house-
hold usage). Andhra Pradesh and Gujarat began with virtual segregation but later shifted to
physical segregation.
State approaches to project execution and monitoring were relatively similar. In all cases
there was no separate or specific institutional framework in place to execute the scheme. All
states other than Haryana undertook a pilot study (many studied Gujarat) before initiating
statewide rollout of load segregation. No state included information technology components
(remote meter reading and advanced metering infrastructure) to capture metering data online
or to implement user-friendly systems to measure and control agricultural consumption.
Finally, attention to monitoring and evaluation was negligible in all states; even five years after
implementation in Gujarat and Rajasthan, summary reports of agricultural consumption
based on the segregated load data were not prepared.
box continues next page
Because agricultural consumption is largely unmetered and charged estimated
rates, losses in other segments are often included in agricultural consumption
numbers. Separating agricultural and nonagricultural electricity feeders has been
proposed as a technical solution to improve transparency in the sector and poten-tially enhance the welfare of both farmers and rural domestic consumers while
also improving utility performance (box 4.1).
8/20/2019 WB - India Discom Report - Feb15
http://slidepdf.com/reader/full/wb-india-discom-report-feb15 108/255
84 Drivers of Losses
More Power to India • http://dx.doi.org/10.1596/978-1-4648-0233-1
Since 1990 agriculture has accounted for about 25 percent of total electricity
consumption, but it contributed only 4 percent of total revenue of distribution
utilities until 2001 and about 7 percent as recently as 2011 (Sharma 2005;
Planning Commission 2001, 2011; see also figure 4.13).
Effective Tariffs within Categories of Domestic ConsumersThere is inequity across consumption levels, stemming from the prevalence of
fixed charges or minimum consumption charges. These charges have a stark
impact on households consuming less than 30 kWh a month (which constitute
29 percent of all households below the poverty line). In 21 states the average
household consuming less than 30 kWh a month pays more per unit of electricity
than the average household consuming 30–100 kWh a month. In 10 of those states
(Bihar, Delhi, Haryana, Himachal Pradesh, Jharkhand, Manipur, Orissa, Rajasthan,
Uttarakhand, and Uttar Pradesh), the average household consuming less than30 kWh a month pays more per unit of electricity than even the average house-
hold consuming more than 300 kWh a month. In four states (Haryana, Kerala,
In Gujarat and Rajasthan (where two subdivisions were studied in depth), load segregation
appears to have met its primary objective of increasing the quality and quantity of power for
nonagricultural rural consumption. In the Vinchiyaa subdivision of Gujarat, for example, theshare of domestic consumers reporting rarely or never experiencing power outages rose from
34 percent to 86 percent after load segregation; the shares of other Gujarat consumers and all
consumers in the Bassi subdivision of Rajasthan rose comparably. Similarly, the share of con-
sumers experiencing low voltage fell steeply after load segregation. Load segregation has also
likely improved peak demand management and increased rural incomes. But it has not met
the objective of accurately measuring agricultural consumption and total power losses, as
utility, regulator, and state accounts do not use the data from the new feeders to estimate
consumption.
Other key lessons learned from Gujarat and Rajasthan include:
• Segregation is only necessary when agricultural metering cannot be adopted. If possible,
solutions such as advanced metering infrastructure can be used instead of load segregation
to limit supply to farmers. Without agricultural metering, load segregation alone does not
enable estimation of theft.
• Load segregation does not necessarily require additional infrastructure. If current infrastruc-
ture is aged and overloaded, load segregation can be achieved through the infrastructure
replacement that would have occurred anyway.
• Feeder segregation is not a one-time investment but rather an ongoing activity that requires
continuous monitoring and enforcement to ensure that new connections are introduced on
the appropriate feeders.
Source: World Bank 2013.
Box 4.1 Improving Rural Supply: Rural Feeder Segregation in Indian States (continued)
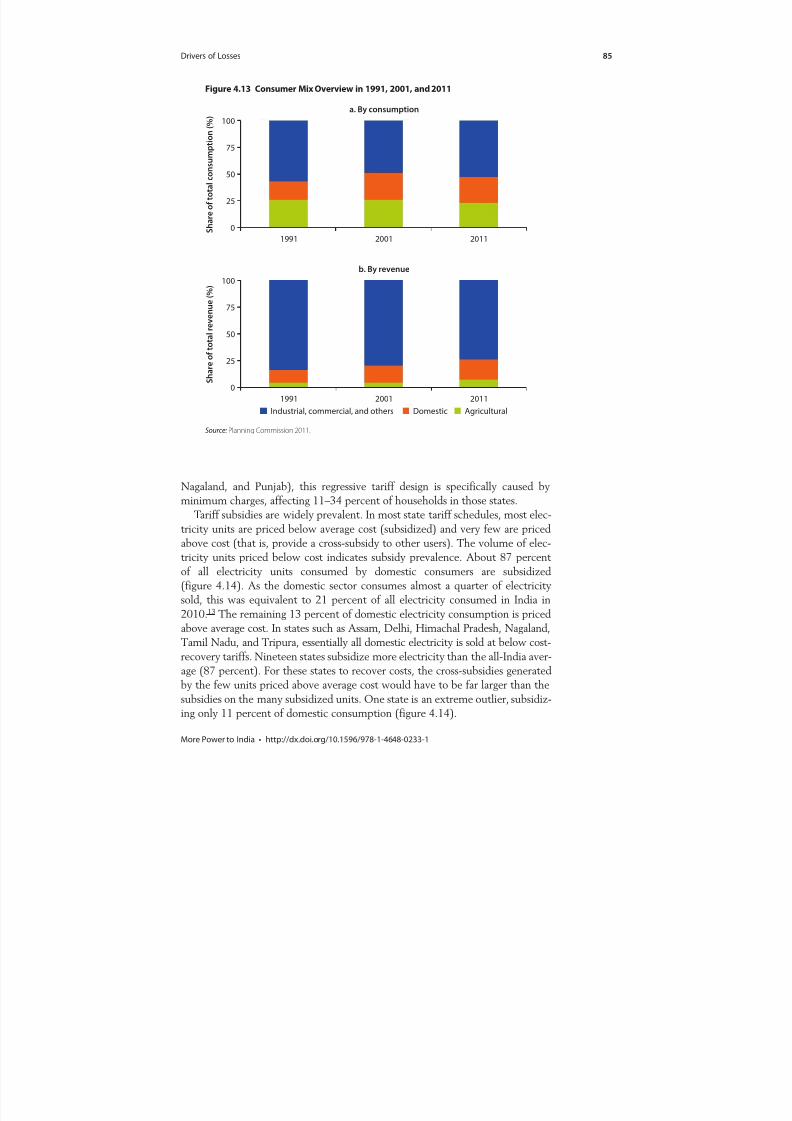
8/20/2019 WB - India Discom Report - Feb15
http://slidepdf.com/reader/full/wb-india-discom-report-feb15 109/255
Drivers of Losses 85
More Power to India • http://dx.doi.org/10.1596/978-1-4648-0233-1
Figure 4.13 Consumer Mix Overview in 1991, 2001, and 2011
a. By consumption
0
25
50
75
100
1991 2001 2011 S h a r e o f t o t a l c o n s u m p t i o n ( % )
b. By revenue
0
25
50
75
100
1991 2001 2011
S h a r e o f t o t a l r e v e n u e ( % )
AgriculturalDomesticIndustrial, commercial, and others
Source: Planning Commission 2011.
Nagaland, and Punjab), this regressive tariff design is specifically caused by
minimum charges, affecting 11–34 percent of households in those states.
Tariff subsidies are widely prevalent. In most state tariff schedules, most elec-
tricity units are priced below average cost (subsidized) and very few are priced
above cost (that is, provide a cross-subsidy to other users). The volume of elec-tricity units priced below cost indicates subsidy prevalence. About 87 percent
of all electricity units consumed by domestic consumers are subsidized
(figure 4.14). As the domestic sector consumes almost a quarter of electricity
sold, this was equivalent to 21 percent of all electricity consumed in India in
2010.13 The remaining 13 percent of domestic electricity consumption is priced
above average cost. In states such as Assam, Delhi, Himachal Pradesh, Nagaland,
Tamil Nadu, and Tripura, essentially all domestic electricity is sold at below cost-
recovery tariffs. Nineteen states subsidize more electricity than the all-India aver-
age (87 percent). For these states to recover costs, the cross-subsidies generated
by the few units priced above average cost would have to be far larger than thesubsidies on the many subsidized units. One state is an extreme outlier, subsidiz-
ing only 11 percent of domestic consumption (figure 4.14).
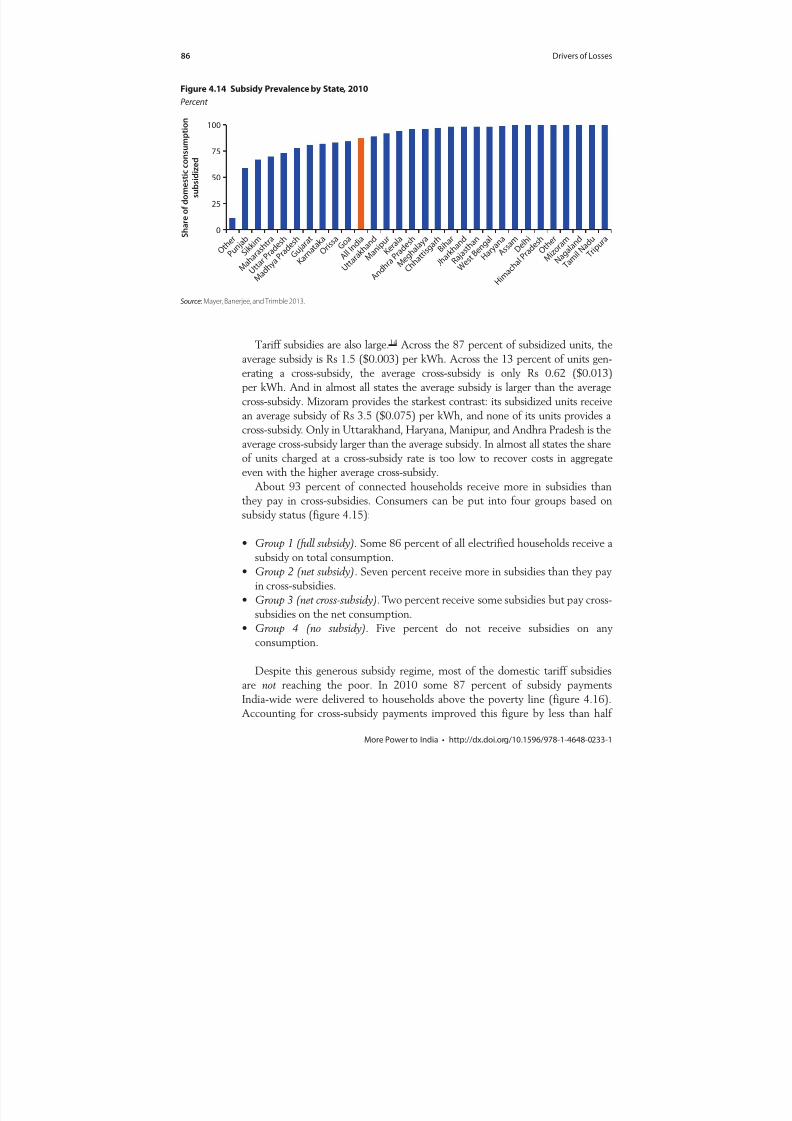
8/20/2019 WB - India Discom Report - Feb15
http://slidepdf.com/reader/full/wb-india-discom-report-feb15 110/255
86 Drivers of Losses
More Power to India • http://dx.doi.org/10.1596/978-1-4648-0233-1
Tariff subsidies are also large.14 Across the 87 percent of subsidized units, the
average subsidy is Rs 1.5 ($0.003) per kWh. Across the 13 percent of units gen-
erating a cross-subsidy, the average cross-subsidy is only Rs 0.62 ($0.013)
per kWh. And in almost all states the average subsidy is larger than the average
cross-subsidy. Mizoram provides the starkest contrast: its subsidized units receive
an average subsidy of Rs 3.5 ($0.075) per kWh, and none of its units provides across-subsidy. Only in Uttarakhand, Haryana, Manipur, and Andhra Pradesh is the
average cross-subsidy larger than the average subsidy. In almost all states the share
of units charged at a cross-subsidy rate is too low to recover costs in aggregate
even with the higher average cross-subsidy.
About 93 percent of connected households receive more in subsidies than
they pay in cross-subsidies. Consumers can be put into four groups based on
subsidy status (figure 4.15):
•
Group 1 (full subsidy). Some 86 percent of all electrified households receive asubsidy on total consumption.
• Group 2 (net subsidy). Seven percent receive more in subsidies than they pay
in cross-subsidies.
• Group 3 (net cross-subsidy). Two percent receive some subsidies but pay cross-
subsidies on the net consumption.
• Group 4 (no subsidy). Five percent do not receive subsidies on any
consumption.
Despite this generous subsidy regime, most of the domestic tariff subsidies
are not reaching the poor. In 2010 some 87 percent of subsidy paymentsIndia-wide were delivered to households above the poverty line (figure 4.16).
Accounting for cross-subsidy payments improved this figure by less than half
Figure 4.14 Subsidy Prevalence by State, 2010
Percent
Source: Mayer, Banerjee, and Trimble 2013.
0
25
50
75
100
O t h e
r
P u n j a b S i k k i m
M a h a
r a s h t
r a
U t t a
r P r a d
e s h
M a d h y
a P r a d
e s h
G u j a r
a t
K a r n a t a k a O r i s s
a G o
a
A l l I n d i a
U t t a r
a k h a
n d
M a n i p
u r
K e r a l a
A n d
h r a P
r a d e s h
M e g h a
l a y a
C h h a
t t i s g a r h B i h
a r
J h a r k h a
n d
R a j a s
t h a n
W e s t B e
n g a l
H a r y a
n a
A s s a m D e
l h i
H i m a c h a l P r a
d e s h O t h e
r
M i z o
r a m
N a g a l a n
d
T a m i l N
a d u
T r i p u r a
S h a r e o f d o m e s t i c c o n s u m p
t i o n
s u b s i d i z e d
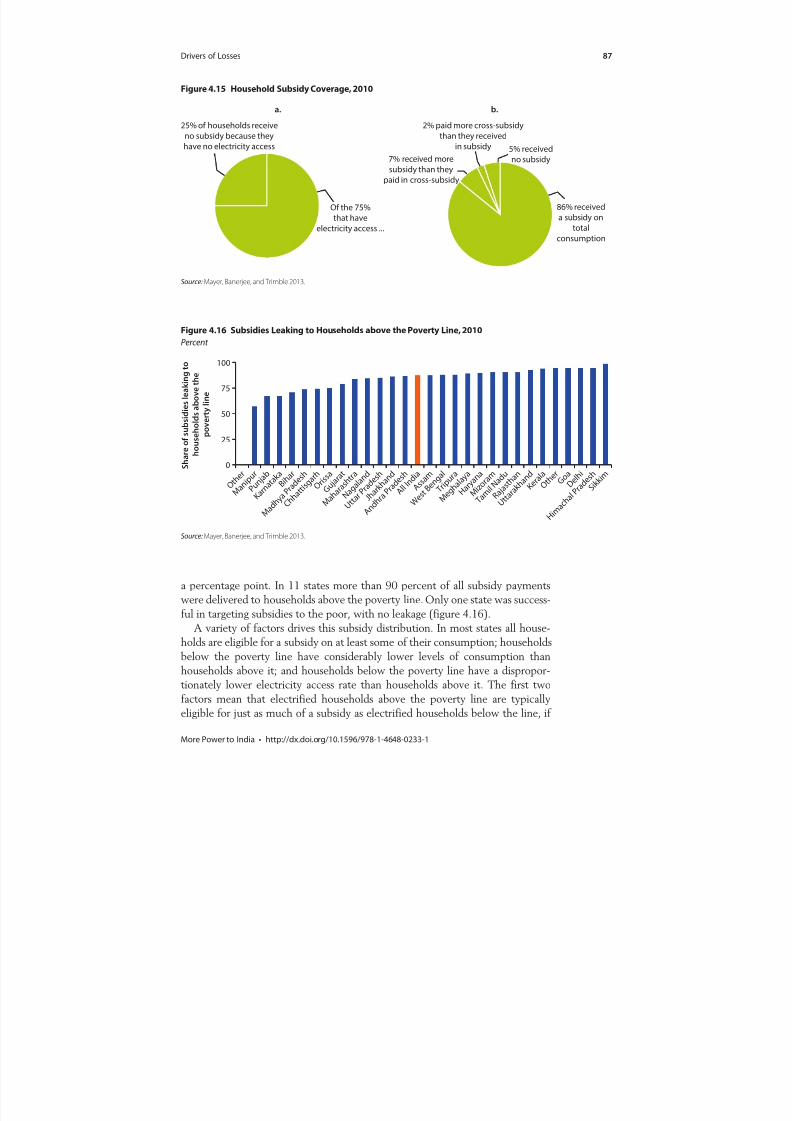
8/20/2019 WB - India Discom Report - Feb15
http://slidepdf.com/reader/full/wb-india-discom-report-feb15 111/255
Drivers of Losses 87
More Power to India • http://dx.doi.org/10.1596/978-1-4648-0233-1
a percentage point. In 11 states more than 90 percent of all subsidy payments
were delivered to households above the poverty line. Only one state was success-
ful in targeting subsidies to the poor, with no leakage (figure 4.16).
A variety of factors drives this subsidy distribution. In most states all house-
holds are eligible for a subsidy on at least some of their consumption; households
below the poverty line have considerably lower levels of consumption than
households above it; and households below the poverty line have a dispropor-
tionately lower electricity access rate than households above it. The first twofactors mean that electrified households above the poverty line are typically
eligible for just as much of a subsidy as electrified households below the line, if
Figure 4.15 Household Subsidy Coverage, 2010
Source: Mayer, Banerjee, and Trimble 2013.
Of the 75%
that have
electricity access ...
25% of households receive
no subsidy because theyhave no electricity access
a.
86% received
a subsidy on
total
consumption
7% received more
subsidy than they
paid in cross-subsidy
2% paid more cross-subsidy
than they receivedin subsidy 5% received
no subsidy
b.
Figure 4.16 Subsidies Leaking to Households above the Poverty Line, 2010
Percent
Source: Mayer, Banerjee, and Trimble 2013.
0
25
50
75
100
O t h e
r
M a n i p
u r
P u n j a b
K a r n a t a k a B i h
a r
M a d h y a
P r a d e s h
C h h a
t t i s g a r h O r i s s
a
G u j a r
a t
M a h a
r a s h t r
a
N a g a l a n
d
U t t a r
P r a d e s h
J h a r k h a
n d
A n d h r a P r a
d e s h
A l l I n d i a
A s s a m
W e s t B e
n g a l
T r i p u r a
M e g h a
l a y a
H a r y a
n a
M i z o
r a m
T a m i l N
a d u
R a j a s t h a n
U t t a r
a k h a
n d K e
r a l a O t h e
r G o
a D e l h i
H i m a
c h a l P r a
d e s h S i k k i m
S h a r e
o f s u b s i d i e s l e a k i n g t
o
h o u s e h o l d s a b o v e
t h e
p o v e r t y
l i n e

8/20/2019 WB - India Discom Report - Feb15
http://slidepdf.com/reader/full/wb-india-discom-report-feb15 112/255
88 Drivers of Losses
More Power to India • http://dx.doi.org/10.1596/978-1-4648-0233-1
not more. The third factor means relatively more households below the poverty
line are ineligible for a subsidy than households above it.
Low access rates in the poorer income quintiles make subsidy targeting a chal-
lenge. With the typical increasing block tariff structure, all households pay thesame low rate on their initial consumption. This necessarily means that higher-
consuming (usually richer) households consume as much or more of the initial
subsidized electricity units as lower-consuming (usually poor) households and
will therefore always receive as much or more in subsidy payments. The seven
states with the least leakage of subsidies all have separate tariff schedules for
households below the poverty line.
Benchmarking Utilities on Financial and Operational Indicators
There are significant differences among discoms on both financial and opera-tional indicators, and some have persisted for many years. The heterogeneity of
performance between the top 10 and bottom 10 utilities (each set of 10 repre-
sents about 20 percent of the sample) brings this sharply into focus. For this
analysis, six indicators—three financial (profit after tax with subsidy, accumu-
lated losses, and ratio of revenue to operating cost) and three operational (distri-
bution loss rate, collection efficiency, and debtor days)—are analyzed over
2003/04–2010/11, divided into two equal time frames—2003/04–2006/07 and
2007/08–2010/11 (figure 4.17).
Indicators have evolved in different ways over time. For profit after tax and
accumulated losses, while the top 10 companies held steady, the fall in perfor-mance of the bottom 10 companies was precipitous between 2003/04 and
2010/11. The divergence across top and bottom performers in distribution losses
and debtor days has been somewhat less. Over the same period, the difference in
recovery of operating cost and collection efficiency narrowed.
Some discoms are consistently strong over many years and across multiple
indicators.15 Tata Power in Delhi stands out: over 2003/04–2006/07 it was in
the top for two of the three financial indicators and one of the three opera-
tional indicators; over 2007/08–2010/11 it was in the top for all three financial
indicators and two of the three operational indicators. Other utilities thatstood out were Kerala’s state electricity board (SEB; box 4.2) and Goa’s power
department.
Several utilities persistently rank among the poorest performers over time,
often on both financial and operational indicators: included among them are
Dakshinanchal and Poorv Vidyut Vitran Nigams in Uttar Pradesh, and the power
department in Manipur. Punjab’s SEB and unbundled discom were among the
bottom on financial indicators (particularly over 2007/08–2010/11) but not on
operational indicators. Bihar’s SEB and the Kanpur Electricity Supply Company
in Uttar Pradesh were among the bottom on multiple operational indicators in
both periods but not on any financial indicators.In addition to the simple comparison among discoms described above, a tool
based on the analytic hierarchy process (AHP) can be used to monitor performance

8/20/2019 WB - India Discom Report - Feb15
http://slidepdf.com/reader/full/wb-india-discom-report-feb15 113/255
Drivers of Losses 89
More Power to India • http://dx.doi.org/10.1596/978-1-4648-0233-1
Figure 4.17 Evolution of Performance of Top and Bottom Discoms, 2003/04–2010/11
1.43 1.31
–8.18
–22.74
–1.37 –3.32
–25
–20
–15
–10
–5
0
5
2 0 0 3
/ 0 4
2 0 0 4
/ 0 5
2 0 0 5
/ 0 6
2 0 0 6
/ 0 7
2 0 0 7
/ 0 8
2 0 0 8
/ 0 9
2 0 0 9
/ 1 0
2 0 1 0
/ 1 1
R s b i l l i o n s
a. Profit after tax with subsidy 2003/04–2006/07
Top 5
1. Chhatt SEB
(Rs 4.03 billion)
2. Goa PD
3. Kerala SEB
4. Tata
5. BESCOM
Bottom 5
44. MVVN
45. Gujrat SEB
46. TN SEB
47. Other48. Poorv VVN
(Rs –13.44 billion)
2007/08–2010/11
Top 5
1. Chhatt SEB
(Rs 3.07 billion)
2. Tata
3. Kerala SEB
4. WBSEDCL
5. Goa PD
Bottom 5
48. Punjab SEB
49. DVVN
50. Poorv VVN
51. Other52. TN SEB
(Rs –68.07 billion)
Top 10 average Bottom 10 averageAll India
2.32 4.34
–30.90
–66.11
–6.64 –13.18
–90
–80
–70
–60
–50
–40
–30
–20
–10
0
10
2
0 0 3 / 0 4
2
0 0 4 / 0 5
2
0 0 5 / 0 6
2
0 0 6 / 0 7
2
0 0 7 / 0 8
2
0 0 8 / 0 9
2
0 0 9 / 1 0
2
0 1 0 / 1 1
R s b i l l i o n s
b. Accumulated profit or loss without subsidy 2003/04–2006/07
Top 5
1. Chhatt SEB
(Rs 13.70 billion)
2. Jharkhand SEB
3. Kerala SEB
4. Goa PD5. BESCOM
Bottom 5
44. Punjab SEB
45. Gujrat SEB
46. TN SEB
47. Other
48. WB SEB
(Rs –64.75 billion)
2007/08–2010/11
Top 5
1. Kerala SEB
(Rs 13.71 billion)
2. Goa PD
3. Tata
4. CSPDCL5. APSPDCL
Bottom 5
48. Poorv VVN
49. DVVN
50. Punjab SEB
51. Other
52. TN SEB
(Rs –180.50 billion)
figure continues next page
of state power distribution utilities (box 4.3). This method is particularly rele-
vant as it surveys selected experts from banks and financial institutions to make
a pairwise comparison of 11 factors important for power sector lending that
capture the sector’s financial and operational performance. The process is flexibleas it permits the introduction of new variables as relevant. The results also align
with the integrated ratings methodology adopted by the Ministry of Power in
2013. Using the AHP will require finessing on threshold values—at what
point does a state or the Ministry of Power ring warning bells on performance?

8/20/2019 WB - India Discom Report - Feb15
http://slidepdf.com/reader/full/wb-india-discom-report-feb15 114/255
90 Drivers of Losses
More Power to India • http://dx.doi.org/10.1596/978-1-4648-0233-1
1.47
1.15
0.45
0.55
1.12
1.02
0
0.2
0.4
0.6
0.8
1.0
1.2
1.4
1.6
2 0 0 3
/ 0 4
2 0 0 4
/ 0 5
2 0 0 5
/ 0 6
2 0 0 6
/ 0 7
2 0 0 7
/ 0 8
2 0 0 8
/ 0 9
2 0 0 9
/ 1 0
2 0 1 0
/ 1 1
R a t i o
19
11
49
45
31
21
0
10
20
30
40
50
60
2 0 0 3
/ 0 4
2 0 0 4
/ 0 5
2 0 0 5
/ 0 6
2 0 0 6
/ 0 7
2 0 0 7
/ 0 8
2 0 0 8
/ 0 9
2 0 0 9
/ 1 0
2 0 1 0
/ 1 1
P e r c e n t
c. Ratio of revenue to operating cost
d. Distribution loss rate
Top 10 average Bottom 10 averageAll India
2003/04–2006/07
Top 5
1. Kerala SEB (1.43)2. Goa PD
3. Chhatt SEB
4. Sikkim PD
5. Tata
Bottom 5
44. Mizoram PD
45. Other
46. Nagaland PD
47. Other
48. Manipur PD
(0.23)
2007/08–2010/11
Top 5
1. Me ECL (1.16)2. Kerala SEB
3. JDVVNL
4. AVVNL
5. Tata
Bottom 5
48. Chhatt SEB
49. Mizoram PD
50. Nagaland PD
51. Manipur PD
52. Other (0.36)
2003/04–2006/07
Top 5
1. APEPDCL (13%)
2. HP SEB
3. APSPDCL
4. TN SEB
5. Goa PD
Bottom 5
44. AVVNL
45. BSES YPL
46. Other
47. Jharkhand SEB
48. Manipur PD
(54%)
2007/08–2010/11
Top 5
1. APEPDCL (8%)
2. APNPDCL
3. MESCOM
4. Chhatt SEB
5. HP SEB
Bottom 5
48. Bihar SEB
49. SESCO
50. Manipur PD
51. Other
52. Other (60%)
Figure 4.17 Evolution of Performance of Top and Bottom Discoms, 2003/04–2010/11 (continued)
figure continues next page
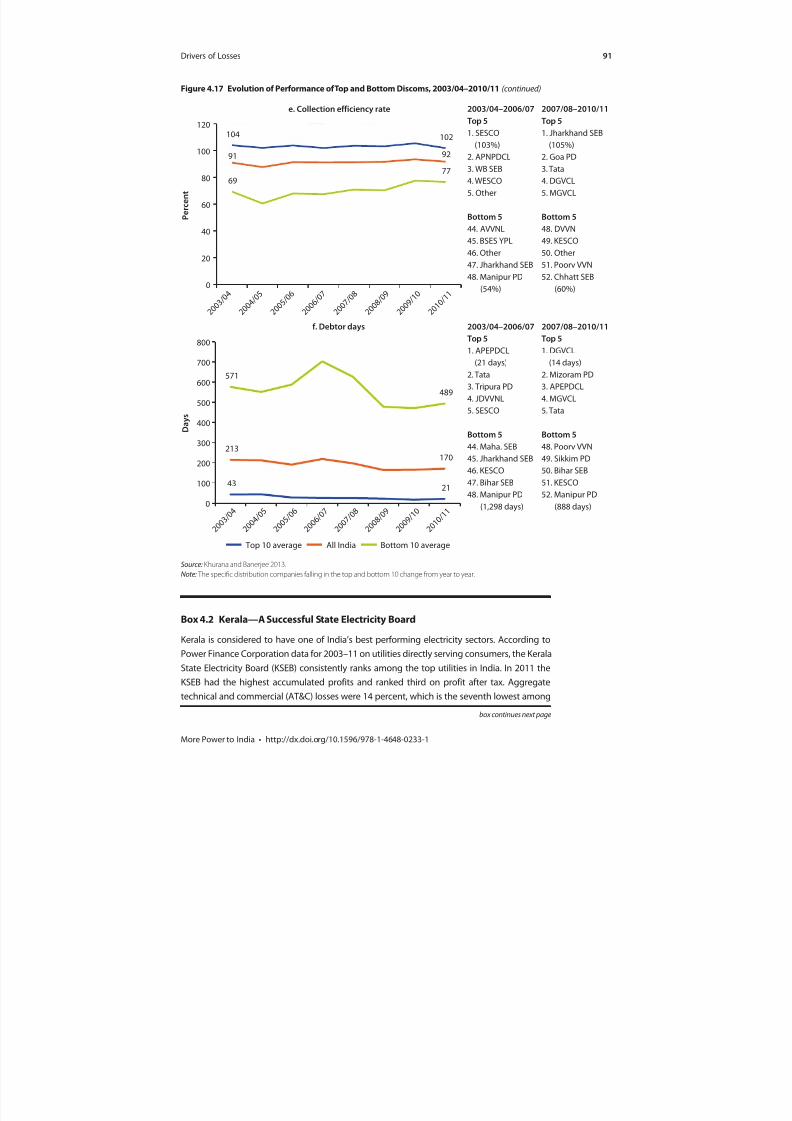
8/20/2019 WB - India Discom Report - Feb15
http://slidepdf.com/reader/full/wb-india-discom-report-feb15 115/255
Drivers of Losses 91
More Power to India • http://dx.doi.org/10.1596/978-1-4648-0233-1
Box 4.2 Kerala—A Successful State Electricity Board
Kerala is considered to have one of India’s best performing electricity sectors. According to
Power Finance Corporation data for 2003–11 on utilities directly serving consumers, the Kerala
State Electricity Board (KSEB) consistently ranks among the top utilities in India. In 2011 the
KSEB had the highest accumulated profits and ranked third on profit after tax. Aggregatetechnical and commercial (AT&C) losses were 14 percent, which is the seventh lowest among
box continues next page
104 102
6977
91 92
0
20
40
60
80
100
120
2 0 0 3
/ 0 4
2 0 0 4
/ 0 5
2 0 0 5
/ 0 6
2 0 0 6
/ 0 7
2 0 0 7
/ 0 8
2 0 0 8
/ 0 9
2 0 0 9
/ 1 0
2 0 1 0
/ 1 1
P e r c e n t
4321
571
489
213170
0
100
200
300
400
500
600
700
800
2 0 0 3
/ 0 4
2 0 0 4
/ 0 5
2 0 0 5
/ 0 6
2 0 0 6
/ 0 7
2 0 0 7
/ 0 8
2 0 0 8
/ 0 9
2 0 0 9
/ 1 0
2 0 1 0
/ 1 1
D a y s
e. Collection efficiency rate
f. Debtor days
Top 10 average Bottom 10 averageAll India
2003/04–2006/07
Top 5
1. SESCO (103%)
2. APNPDCL
3. WB SEB
4. WESCO
5. Other
Bottom 5
44. AVVNL
45. BSES YPL
46. Other
47. Jharkhand SEB
48. Manipur PD
(54%)
2007/08–2010/11
Top 5
1. Jharkhand SEB (105%)
2. Goa PD
3. Tata
4. DGVCL
5. MGVCL
Bottom 5
48. DVVN
49. KESCO
50. Other
51. Poorv VVN
52. Chhatt SEB
(60%)
2003/04–2006/07
Top 5
1. APEPDCL
(21 days)
2. Tata
3. Tripura PD
4. JDVVNL
5. SESCO
Bottom 5
44. Maha. SEB
45. Jharkhand SEB
46. KESCO
47. Bihar SEB
48. Manipur PD
(1,298 days)
2007/08–2010/11
Top 5
1. DGVCL
(14 days)
2. Mizoram PD
3. APEPDCL
4. MGVCL
5. Tata
Bottom 5
48. Poorv VVN
49. Sikkim PD
50. Bihar SEB
51. KESCO
52. Manipur PD
(888 days)
Source: Khurana and Banerjee 2013.
Note: The specific distribution companies falling in the top and bottom 10 change from year to year.
Figure 4.17 Evolution of Performance of Top and Bottom Discoms, 2003/04–2010/11 (continued)
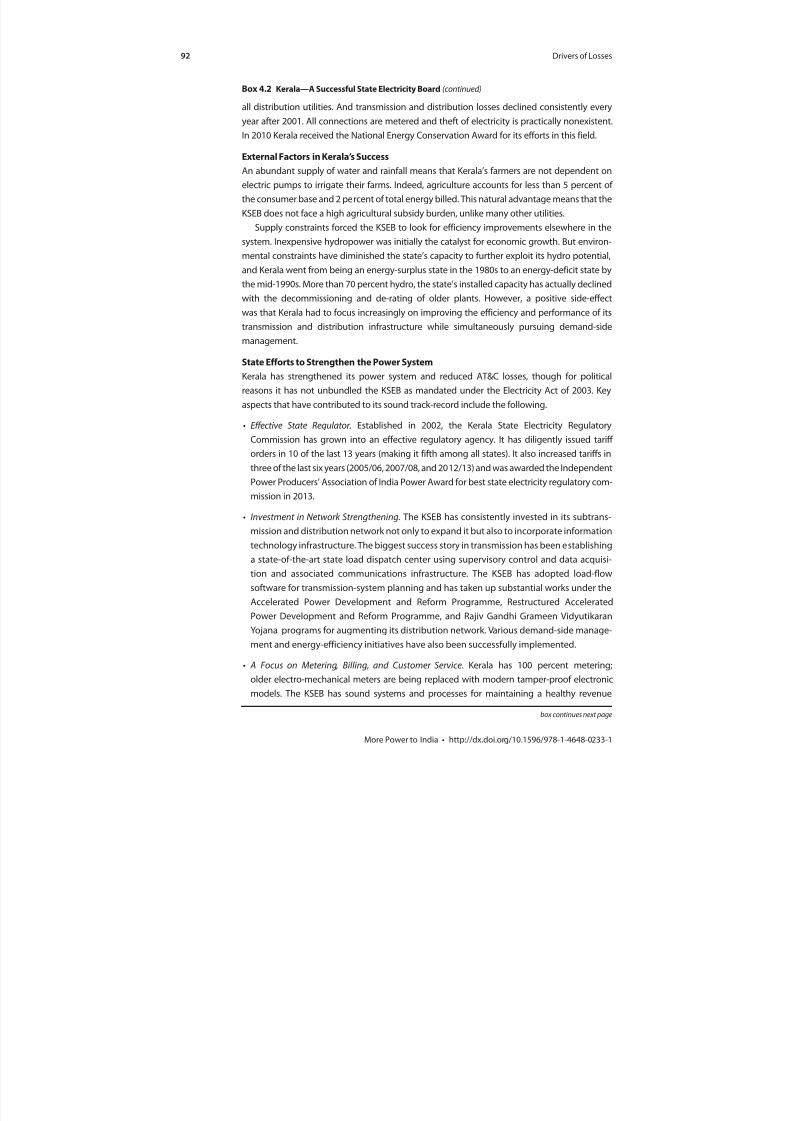
8/20/2019 WB - India Discom Report - Feb15
http://slidepdf.com/reader/full/wb-india-discom-report-feb15 116/255
92 Drivers of Losses
More Power to India • http://dx.doi.org/10.1596/978-1-4648-0233-1
all distribution utilities. And transmission and distribution losses declined consistently every
year after 2001. All connections are metered and theft of electricity is practically nonexistent.
In 2010 Kerala received the National Energy Conservation Award for its efforts in this field.
External Factors in Kerala’s Success
An abundant supply of water and rainfall means that Kerala’s farmers are not dependent on
electric pumps to irrigate their farms. Indeed, agriculture accounts for less than 5 percent of
the consumer base and 2 percent of total energy billed. This natural advantage means that the
KSEB does not face a high agricultural subsidy burden, unlike many other utilities.
Supply constraints forced the KSEB to look for efficiency improvements elsewhere in the
system. Inexpensive hydropower was initially the catalyst for economic growth. But environ-
mental constraints have diminished the state’s capacity to further exploit its hydro potential,
and Kerala went from being an energy-surplus state in the 1980s to an energy-deficit state bythe mid-1990s. More than 70 percent hydro, the state’s installed capacity has actually declined
with the decommissioning and de-rating of older plants. However, a positive side-effect
was that Kerala had to focus increasingly on improving the efficiency and performance of its
transmission and distribution infrastructure while simultaneously pursuing demand-side
management.
State Efforts to Strengthen the Power System
Kerala has strengthened its power system and reduced AT&C losses, though for political
reasons it has not unbundled the KSEB as mandated under the Electricity Act of 2003. Key
aspects that have contributed to its sound track-record include the following.
• Effective State Regulator. Established in 2002, the Kerala State Electricity Regulatory
Commission has grown into an effective regulatory agency. It has diligently issued tariff
orders in 10 of the last 13 years (making it fifth among all states). It also increased tariffs in
three of the last six years (2005/06, 2007/08, and 2012/13) and was awarded the Independent
Power Producers’ Association of India Power Award for best state electricity regulatory com-
mission in 2013.
• Investment in Network Strengthening. The KSEB has consistently invested in its subtrans-
mission and distribution network not only to expand it but also to incorporate information
technology infrastructure. The biggest success story in transmission has been establishinga state-of-the-art state load dispatch center using supervisory control and data acquisi-
tion and associated communications infrastructure. The KSEB has adopted load-flow
software for transmission-system planning and has taken up substantial works under the
Accelerated Power Development and Reform Programme, Restructured Accelerated
Power Development and Reform Programme, and Rajiv Gandhi Grameen Vidyutikaran
Yojana programs for augmenting its distribution network. Various demand-side manage-
ment and energy-efficiency initiatives have also been successfully implemented.
• A Focus on Metering, Billing, and Customer Service. Kerala has 100 percent metering;
older electro-mechanical meters are being replaced with modern tamper-proof electronic
models. The KSEB has sound systems and processes for maintaining a healthy revenue
box continues next page
Box 4.2 Kerala—A Successful State Electricity Board (continued)
8/20/2019 WB - India Discom Report - Feb15
http://slidepdf.com/reader/full/wb-india-discom-report-feb15 117/255
Drivers of Losses 93
More Power to India • http://dx.doi.org/10.1596/978-1-4648-0233-1
billing and collection cycle. Excellence in revenue management is also a function of the
sound payment culture in most of Kerala. Thirteen Power Anti-Theft Squads have been set
up under the anti-theft and vigilance wing of the KSEB, headed by a deputed senior policeofficer. District courts have been notified as special courts to deal with cases of power theft.
In addition, the KSEB is modernizing its systems. It uses internally developed software for
customer-friendly electric billing and accounting, and has built an online portal for con-
sumer payments and grievance redressal. These efforts have improved service quality,
billing efficiency, transparency, and financial savings. The KSEB’s collection efficiency of
97 percent in 2010/11 attests to the initiatives’ payoffs.
• Investment in Employees. The KSEB is working to improve employee efficiency and satisfac-
tion. There are now four human resources committees to oversee promotions and transfers.
And it has improved grievance-redressal and pension plans for employees. The KSEB alsooffers well-designed technical, information technology, and financial training to all officers
and staff.
But since 2011 KSEB’s finances have been constrained due to the state’s declining hydro
generation, forcing the utility to purchase power from external sources and draw down sur-
pluses earned in earlier years. Inadequate planning for power procurement to address demand
growth has exacerbated the change in fortunes of the utility, which remains well managed but
is now suffering in the face of external shocks.
box continues next page
Box 4.2 Kerala—A Successful State Electricity Board (continued)
Box 4.3 Design of a State Performance Index Using the Analytic Hierarchy Process
The analytic hierarchy process (AHP) was used to create a state performance index. Selected
experts from financial institutions and banks were asked to compare the various factors identi-
fied below for the purposes of lending to the power sector. There are around 12 major lenders
to power sector utilities in India (including private banks, government banks, and financial
institutions like the Rural Electrification Corporation and Power Finance Corporation). Five of
these lenders were selected for this exercise. The 11 factors used for this analysis are:
• Gap after subsidy [(average cost − average revenue)/average cost].
• Subsidy/total cost.
• Subsidy received/subsidy booked.
• Transmission and distribution losses.
• Collection efficiency.
• Debtor days.
• Creditor days.
• (Accumulated losses + subsidy)/current average cost.
• Future gap in 2017.
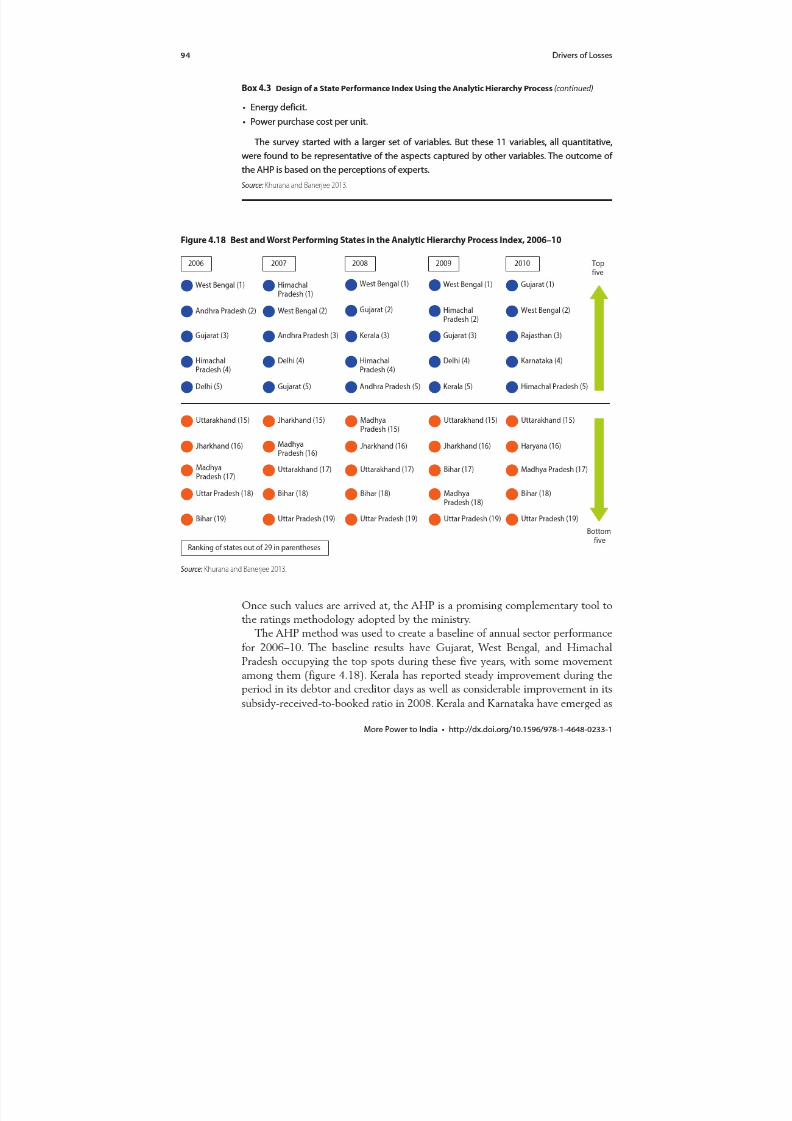
8/20/2019 WB - India Discom Report - Feb15
http://slidepdf.com/reader/full/wb-india-discom-report-feb15 118/255

8/20/2019 WB - India Discom Report - Feb15
http://slidepdf.com/reader/full/wb-india-discom-report-feb15 119/255
Drivers of Losses 95
More Power to India • http://dx.doi.org/10.1596/978-1-4648-0233-1
reasonable performers on both technical and commercial parameters included in
the AHP index. Of the two, Karnataka has worse financial performance (a large
amount of debtor days), but it has improved in the last two years.
Uttar Pradesh, Bihar, and Madhya Pradesh remained the worst performersover the five years. Bihar and Jharkhand fared poorly on most efficiency param-
eters (debtor days, collection efficiency, and transmission and distribution losses).
These states would gain tremendously from cash collections to reduce debtor
days from current abnormally high levels. In Bihar and Jharkhand several power
stations are either shut or operating at abysmal efficiency. Haryana and Punjab
exhibit high financial losses: of the two, Haryana performs worse than Punjab on
generation and distribution; Punjab lags on power purchase costs and tariff
revisions.
Notes
1. Total revenue is calculated as collected revenues from sale of power plus trading and other revenues.
2. Hydro-thermal mix, share of purchases from outside the state, and the costs of these out-of-state purchases, and so forth.
3. Stochastic frontier analysis is an econometric (parametric) method that estimates a cost or production frontier. The method is used to estimate the efficient frontier and efficiency scores. Because of its statistical nature, stochastic frontier analysis allows for the inclusion of stochastic errors in the analysis and testing of hypotheses. However, computations using this method are relatively complex and are highly dependent on the assumptions made in constructing the functional form for the utilities.
4. Data envelopment analysis is a linear programming methodology to measure the efficiency of multiple decision-making units when the production process presents a structure of multiple inputs and outputs. This method is commonly used for measur-ing the performance of similar utilities for which the presence of multiple inputs and outputs and nondiscretionary variables makes comparisons difficult. The approach identifies an efficient frontier made up of the most efficient firms in the sample and measures the efficiency scores of the less efficient firms in relation to the most efficient.
5. National average operating heat rate was 2,615.4 kilocalories per kWh in 2010 (CEA 2010).
6. The station heat rate of the Dahanu Plant was 2,285 kilocalories per kWh in 2010.
7. Although the utility is required to pay fixed costs for the use of third-party plants, because such plants are partially or wholly stranded for lack of coal, the saving for India is the entire amount, not just the net saving for the utility. Further, if the coal is used in another partially used plant of the utility (or where the utility has a share and is paying fixed costs for underused capacity), the entire saving would be to the account of the utility.
8. The difference between cost and revenue = profit before tax.
9. This tariff level would cover (exceed) average cost, but unless the utility had distribu-tion losses of less than 10 percent and 100 percent collection, it would not break even by charging a tariff equal to average cost.
8/20/2019 WB - India Discom Report - Feb15
http://slidepdf.com/reader/full/wb-india-discom-report-feb15 120/255
96 Drivers of Losses
More Power to India • http://dx.doi.org/10.1596/978-1-4648-0233-1
10. The average billed tariff is revenues billed/energy sold.
11. Whether the average billed tariff is higher than the cost-recovery tariff level.
12. This topic has been studied in detail by a recent World Bank report on how delivering
agriculture subsidies can be made more efficient (Gulati 2013). 13. This is a minimum share of electricity that was subsidized. Most agricultural con-
sumption, as well as some commercial and potentially industrial consumption, is also subsidized, so the actual share of subsidized consumption is probably much higher.
14. The difference between the cost and tariff on subsidized units indicates the subsidies’ size, while the difference between the cost and tariff on the cross-subsidized units signals the size of the cross-subsidies.
15. To identify these discoms, each discom’s value for an indicator was averaged (without weights) over two periods: 2004–07 and 2008–11. Discoms were then ranked by period and indicator. For states that unbundled within a period, the unbundled discomvalues were summed (for profit after tax and accumulated losses) or averaged (for the other indicators) and applied to the state electricity board (SEB), and only the SEB was included in the sample.
References
CEA (Central Electricity Authority). 2010. Issues in Energy Efficiency of Thermal PowerPlants. New Delhi.
———. 2011. Review of Performance of Thermal Power Stations 2009–10. New Delhi.
Ebinger, Jane O. 2006. “Measuring Financial Performance in Infrastructure: An Application
to Europe and Central Asia.” Policy Research Working Paper 3992, World Bank, Washington, DC.
Gulati, Mohinder. 2013. “Direct Delivery of Power Subsidy to Agriculture.” World Bank, Washington, DC.
Khurana, Mani, and Sudeshna G. Banerjee. 2013. “Beyond Crisis: Financial andOperational Performance of India’s Power Sector.” Background paper for this report.
World Bank, Washington, DC.
Mayer, Kristy, Sudeshna G. Banerjee, and Chris Trimble. 2013. “Elite Capture:Domestic Tariff Subsidies in India.” Background paper for this report. World Bank,
Washington, DC.
Planning Commission. 2001. Annual Report on the Working of State Power Utilities andElectricity Departments. Government of India, New Delhi.
———. 2011. Annual Report 2011–12 on the Working of State Power Utilities and ElectricityDepartments. Government of India, New Delhi.
Sharma, D.P., P.S. Chandramohanan Nairb, and R. Balasubramanian. 2005. “Performanceof Indian Power Sector during a Decade under Restructuring: A Critique.” EnergyPolicy 33 (4): 563–76.
World Bank. 2013. Lighting Rural India: Load Segregation Experience in Selected States. Washington, DC.
8/20/2019 WB - India Discom Report - Feb15
http://slidepdf.com/reader/full/wb-india-discom-report-feb15 121/255
97More Power to India • http://dx.doi.org/10.1596/978-1-4648-0233-1
Implementing Sector Reforms
Because the power sector is a concurrent subject under the constitution, states are
responsible for implementing the centrally designed mandates of the Electricity
Act of 2003 (EA 2003, or EA) and its associated policies. This chapter describes
an “implementation of reforms” index that assesses progress in executing the EA’s
six major focus areas. Index scores suggest that reform implementation has been
uneven. States have advanced the least in promoting competition, while they
have advanced the most in enhancing quality and affordability and in expanding
access. Delhi has made the most progress in implementing the EA’s agenda, fol-
lowed by Gujarat, Maharashtra, Madhya Pradesh, and Andhra Pradesh.
The chapter also describes a “sector outcomes” index that assesses the achieve-ment of sector performance targets relevant to consumers, investors, and the
government. Here, too, results are uneven. Gujarat and Punjab rank highest on
achieving outcomes.
Together, the indexes show that achievement of sector outcomes closely
reflects the extent to which each state has implemented the EA reforms.
Implementation of Reforms Index
To effectively implement EA mandates requires not just adhering to the letter of
the legislation but also following up to ensure that each reform has its intendedeffect. The implementation of reforms index attempts to move away from mere
“check-the-box” actions, such as notification of various sector regulations, to
examine tangible actions that reflect meaningful progress and true commitment
to an improved power sector. The index measures the actions by governments,
regulatory commissions, and utilities to realize the objectives of the EA and its
associated policies.
The implementation of reforms index comprises six subindexes, reflecting
six EA focus areas (see box 1.1 in chapter 1):
• Introduction of competition (“competition”).
• Enhanced accountability and transparency (“accountability and transparency”).
C H A P T E R 5

8/20/2019 WB - India Discom Report - Feb15
http://slidepdf.com/reader/full/wb-india-discom-report-feb15 122/255
98 Implementing Sector Reforms
More Power to India • http://dx.doi.org/10.1596/978-1-4648-0233-1
• Cost recovery and commercial viability (“cost recovery”).
• Access to electricity and rural electrification (“access”).
• Improved quality of service and affordability of supply (“quality and
affordability”).• Promotion of renewable energy (“renewable energy”).1
Each subindex aggregates performance with respect to between one and four
objectives of the associated reform area. Simple unweighted averages are used to
calculate the subindexes and to obtain an overall measure of implementation of
reforms. For each objective several implementation parameters are considered to
measure progress toward that objective. Scores on each implementation param-
eter are averaged to obtain scores for each objective; scores for each objective are
averaged to obtain scores for each reform area; and scores for each reform area
are averaged to obtain an overall score.The objectives and indicators (implementation parameters) considered for
each subindex are in table 5.1. Many indicators are considered across several years,
Table 5.1 Implementation of Reforms Index
Reform area Objective Implementation parameter
Competition Sector unbundling Years since unbundling
Open network access Notification of open access regulations
Cross-subsidy reduction from 2008/09 to 2012/13Scheduling discipline Implementation of availability-based tariffs
Competitive procurement Use of Case 1 or Case 2 processes
Accountability and
transparency
Regulatory oversight Notification of key regulations
Special courts for electricity theft
Special police stations for electricity theft
State advisory committee
Public tariff hearings
Regulator independence State electricity regulatory commission revenue source
Public availability of state electricity regulatory commission accounts
Utility corporatization Finalization of staff transfer
Autonomous cash management
Share of board that is executive directors
Share of board that is independent directors
Audit committee
Cost recovery Tariff-setting mechanism Frequency of tariff orders from 2000/01 to 2012/13
Delay in tariff issuance from 2000/01 to 2012/13
Frequency of tariff hikes from 2007/08 to 2012/13
Issuance of multiyear tariff order
Use of fuel and power purchase cost adjustment mechanism
Efficiency improvement Coverage under R-APDRP
Share of approved R-APDRP funds releasedSubsidy institutionalization Share of booked subsidies received from 2005/06 to 2012/13
table continues next page

8/20/2019 WB - India Discom Report - Feb15
http://slidepdf.com/reader/full/wb-india-discom-report-feb15 123/255
Implementing Sector Reforms 99
More Power to India • http://dx.doi.org/10.1596/978-1-4648-0233-1
Table 5.1 Implementation of Reforms Index (continued)
Reform area Objective Implementation parameter
Access Access and rural
electrification
Village electrification status
Share of nonelectrified villages electrified from RGGVY inceptionthrough 2011/12
Share of electrified villages intensively electrified from RGGVY
inception through 2011/12
Share of nonelectrified rural households connected from RGGVY
inception through 2011/12
Share of nonelectrified households below the poverty line
connected from RGGVY inception through 2011/12
Quality and
affordability
Service standards Consumer grievance redressal forum regulations notified
Ombudsman appointed
R-APDRP information technology coverage
Debtor daysReducing retail tariffs
through reduced
leakages
Instances of achievement of aggregate technical and commercial
loss reduction target from 2003/04 to 2010/11
Renewable energy Mandatory renewable
energy purchases
Number of future years for which Renewable Purchase Obligation
targets defined
Renewable energy certificate regulation notified
Renewable energy capacity
development
Share of identified renewable energy sources for which feed-in tariffs
notified
Source: Deloitte 2013.
Note: R-APDRP = Restructured Accelerated Power Development and Reform Programme; RGGVY = Rajiv Gandhi Grameen Vidyutikaran Yojana.
in which case the years of consideration are given. Otherwise, if not indicated, the
data are as of 2011/12.
The average implementation score across all states was 0.54, suggesting
that most states have completed half the reform actions envisaged. Among
the reform areas, service quality and affordability has seen the most progress,
with a statewide average score of 0.71, followed closely by access, on which
three-quarters of states scored above 0.50 (figure 5.1). The statewide
average was by far the lowest for competition, a cornerstone of the EA, inwhich almost half the states scored below 0.25. Of the five implementation
parameters used to measure progress in promotion of competition (see
table 5.1), only two have been implemented by most states: notification of
open access regulations (all but 2 states) and unbundling (18 states).
Thirteen states have reduced cross-subsidy surcharges over the last five
years. Only 10 states have initiated competitive power procurement, and
only 8 have begun implementing availability-based tariffs, beyond notifying
availability-based tariff regulations. Delhi achieved the highest score on
overall reform implementation (0.83), closely followed by Gujarat (0.81)
and Maharashtra (0.78).State scores on the reform subindexes underline that implementation of
reforms has been strikingly uneven (figure 5.2). Most states have made
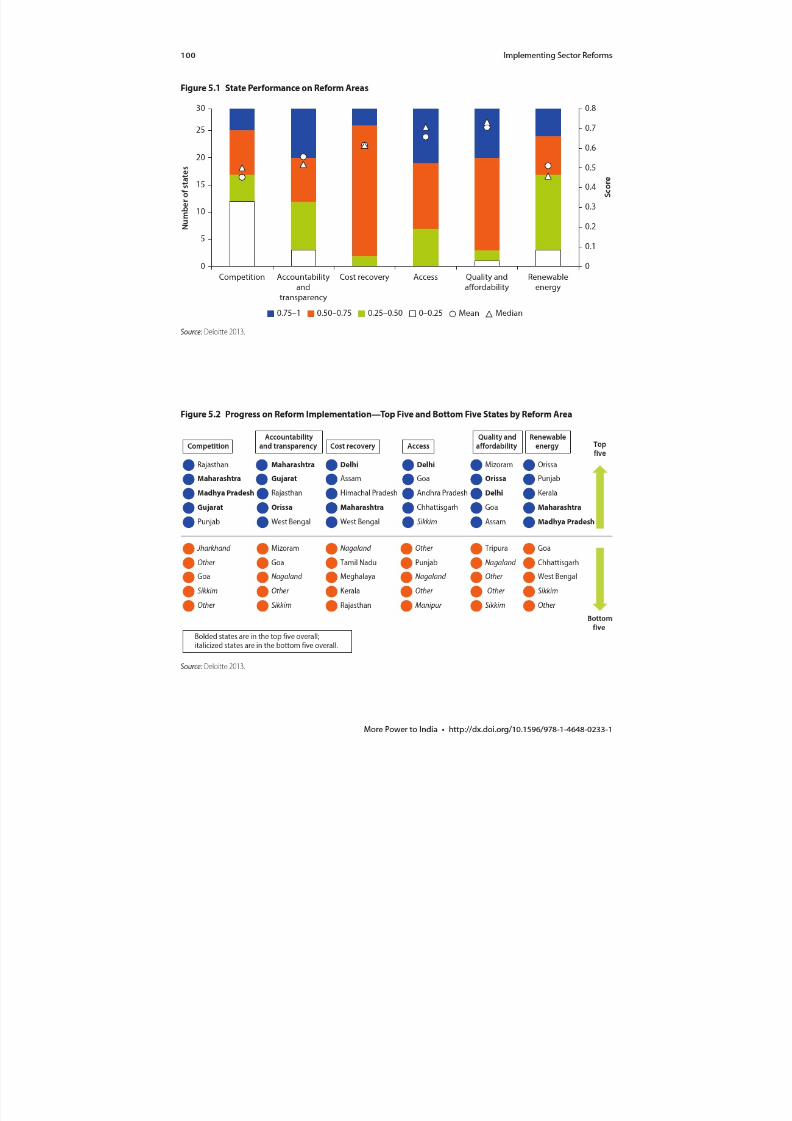
8/20/2019 WB - India Discom Report - Feb15
http://slidepdf.com/reader/full/wb-india-discom-report-feb15 124/255

8/20/2019 WB - India Discom Report - Feb15
http://slidepdf.com/reader/full/wb-india-discom-report-feb15 125/255
Implementing Sector Reforms 101
More Power to India • http://dx.doi.org/10.1596/978-1-4648-0233-1
nominal progress on the stated reform areas: all have established electricityregulatory commissions, and almost all have notified open access regulations.
But many of the follow-through actions that give impact to these reforms
have yet to be tackled. For example, few states have utilities with an ade-
quate share of independent directors on their boards. While 19 states have
determined all of the required charges for open access, only 13 have made
the cross-subsidy reductions necessary for open access to take effect. And
few state electricity regulatory commissions are financially autonomous from
their state governments.
While not the highest scoring state on overall reform implementation,Maharashtra has pushed strongly on implementation across a wide range of
reforms: it is among the top five states in implementation in four areas (competi-
tion, cost recovery, accountability and transparency, and renewable energy). It is
followed by Delhi and Orissa, which are among the top five states in three areas
each (see figure 5.2).
Sector Outcomes Index
The significant variation across states in implementing EA reforms indicates
that the outcomes expected from the reforms are unlikely to be fully realized.To test this hypothesis, a sector outcomes index was constructed to measure
progress on the various power sector outcomes that the reform agenda was
Table 5.2 Sector Outcomes Index
Stakeholder Objective/expectation Performance indicator
Customers and
citizens
Power availability Gap between electricity demand and supply
Efficient service delivery Aggregate technical and commercial lossesAffordable power Average difference between cost of supply and subsidy from
2005/06 to 2010/11
State government Reduction in burden to
exchequer
Reduction in subsidy support per unit of input energy from
2005/06 to 2010/11
Access to electricity Household electrification rate
Environmental concerns Solar renewable purchase obligation compliance
Share of identified nonsolar renewable energy potential
harnessed
Investors and
lenders
Sector openness Extent of private sector participation in installed generation
capacity
Extent of private sector participation in planned generationcapacity additions
Extent of private sector participation in distribution
Sector viability Trend in cash losses per input unit 2005/06–2010/11
Debt-to-equity ratio
Average net profit margin from 2005/06 to 2010/11
Competition in last-mile
delivery
Share of open access applications implemented
Number of transactions on power exchanges
Source: Deloitte 2013.

8/20/2019 WB - India Discom Report - Feb15
http://slidepdf.com/reader/full/wb-india-discom-report-feb15 126/255
102 Implementing Sector Reforms
More Power to India • http://dx.doi.org/10.1596/978-1-4648-0233-1
expected to achieve. The index is divided into three subindexes reflecting the
objectives and expectations of the sector’s three key stakeholders—customers
and citizens, the state government, and investors and lenders (table 5.2).
Performance indicators have been identified to measure progress in achieving
these objectives. Scores on each performance indicator are averaged to obtain
scores for each objective; scores for each objective are averaged to obtain scoresfor each stakeholder subindex; and scores for the stakeholder subindexes are
averaged to obtain an overall score, with unweighted averages used at each
level of aggregation.
State progress in achieving the outcomes expected from the reforms has
varied. Several states have nearly achieved the goal of universal access, while
others are far from achieving it. Some states have successfully reduced aggregate
technical and commercial (AT&C) losses to meet the goal of 15 percent, yet the
all-India average AT&C loss remains at about 26 percent. Subsidies persist in
many states, though several states have greatly narrowed or even closed the gap
between tariffs and the cost of supply. Gujarat and Punjab achieved the highest
scores on the overall outcomes index—0.77 and 0.72 (figure 5.3). The average
score across all states was 0.53.
States showed the most progress on outcomes of interest to customers
and citizens, with an average score of 0.64 (figure 5.4). Of these perfor-
mance targets, most states reduced the gap between power demand and
supply, though in nine states the demand-supply gap remained above
10 percent through 2012. States did less well in reducing consumer retail
tariffs to more affordable levels. The average score on the subindex of out-
comes most relevant to the state government was 0.62. Strong state perfor-mance on these outcomes was driven by a reduction in the burden on the
Figure 5.3 State Progress on Expected Outcomes
0
0.25
0.50
0.75
1.00
B i h a r O t h e
r
M e g h a
l a y a
N a g a l a n
d
M i z o
r a m O t h e
r
M a n i p
u r
S i k k i m T r i
p u r a
A s s a m
J h a r k h a
n d
M a d h y a
P r a d e s h
W e s t B e
n g a l
U t t a r
P r a d e s h
H a r y a
n a
M a h a
r a s h t
r a
H i m a
c h a l P r a
d e s h
A n d h r a P r a
d e s h K e
r a l a D e l h i G o
a O r i s s
a
T a m i l N
a d u
R a j a s
t h a n
U t t a r
a k h a
n d
C h h a
t t i s g a r h
K a r n a
t a k a
P u n j a b
G u j a r
a t
O u t c o m e s i n d e x s c o r e
Source: Deloitte 2013.
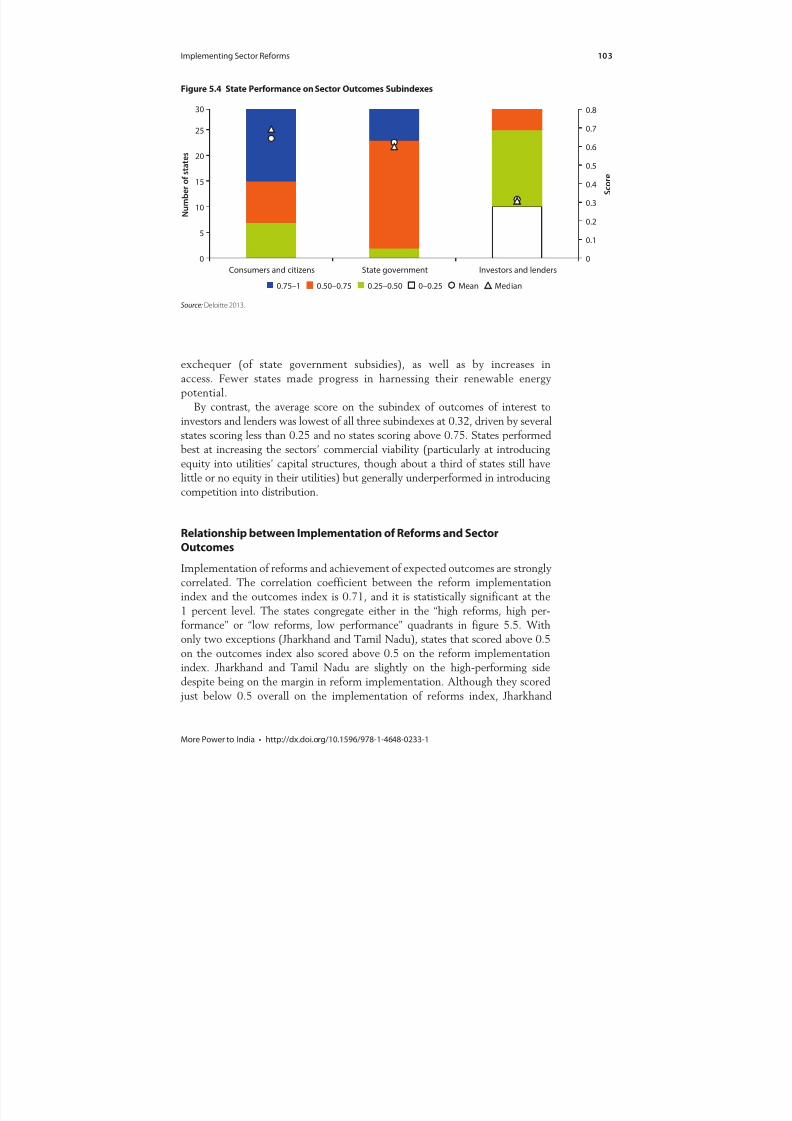
8/20/2019 WB - India Discom Report - Feb15
http://slidepdf.com/reader/full/wb-india-discom-report-feb15 127/255
Implementing Sector Reforms 103
More Power to India • http://dx.doi.org/10.1596/978-1-4648-0233-1
exchequer (of state government subsidies), as well as by increases in
access. Fewer states made progress in harnessing their renewable energy
potential.
By contrast, the average score on the subindex of outcomes of interest toinvestors and lenders was lowest of all three subindexes at 0.32, driven by several
states scoring less than 0.25 and no states scoring above 0.75. States performed
best at increasing the sectors’ commercial viability (particularly at introducing
equity into utilities’ capital structures, though about a third of states still have
little or no equity in their utilities) but generally underperformed in introducing
competition into distribution.
Relationship between Implementation of Reforms and Sector
Outcomes
Implementation of reforms and achievement of expected outcomes are strongly
correlated. The correlation coefficient between the reform implementation
index and the outcomes index is 0.71, and it is statistically significant at the
1 percent level. The states congregate either in the “high reforms, high per-
formance” or “low reforms, low performance” quadrants in figure 5.5. With
only two exceptions (Jharkhand and Tamil Nadu), states that scored above 0.5
on the outcomes index also scored above 0.5 on the reform implementation
index. Jharkhand and Tamil Nadu are slightly on the high-performing side
despite being on the margin in reform implementation. Although they scored just below 0.5 overall on the implementation of reforms index, Jharkhand
Figure 5.4 State Performance on Sector Outcomes Subindexes
0
0.1
0.2
0.3
0.4
0.5
0.6
0.7
0.8
0
5
10
15
20
25
30
Consumers and citizens State government Investors and lenders
S c o r e
N u m b e r o f s t a t e s
0–0.250.25–0.500.50–0.750.75–1 Mean Median
Source: Deloitte 2013.
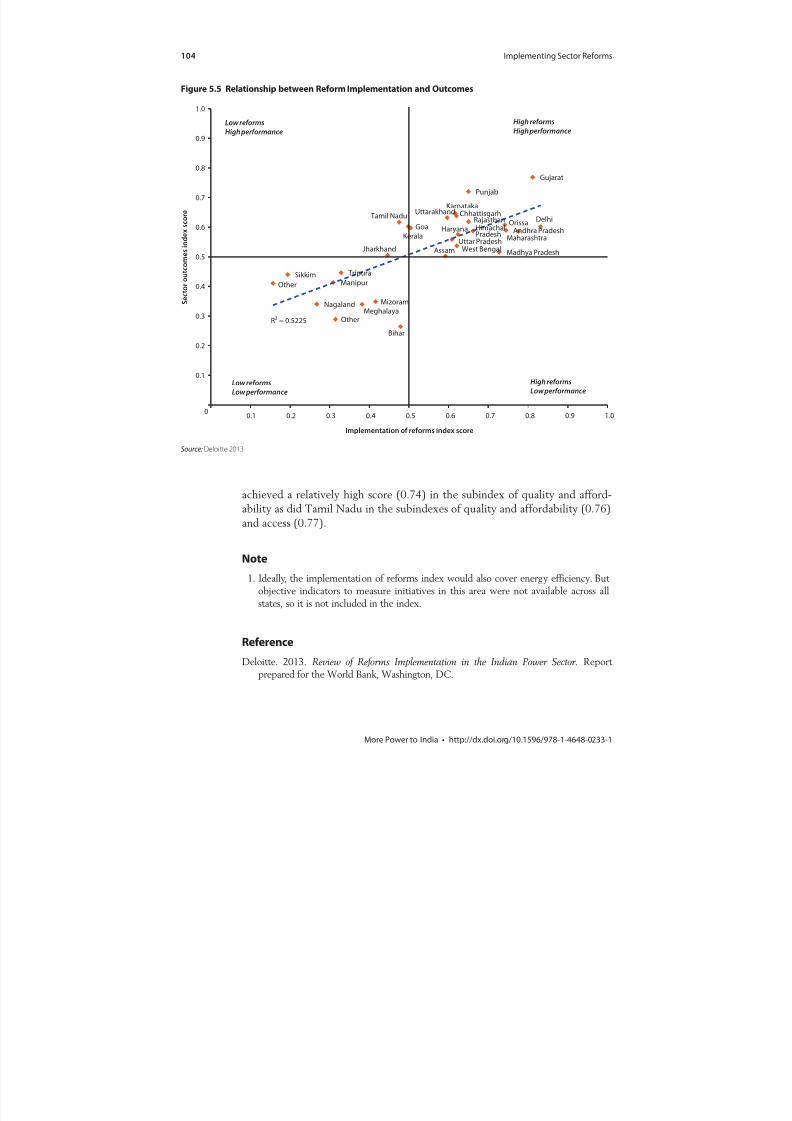
8/20/2019 WB - India Discom Report - Feb15
http://slidepdf.com/reader/full/wb-india-discom-report-feb15 128/255
104 Implementing Sector Reforms
More Power to India • http://dx.doi.org/10.1596/978-1-4648-0233-1
achieved a relatively high score (0.74) in the subindex of quality and afford-
ability as did Tamil Nadu in the subindexes of quality and affordability (0.76)
and access (0.77).
Note
1. Ideally, the implementation of reforms index would also cover energy efficiency. But objective indicators to measure initiatives in this area were not available across all states, so it is not included in the index.
Reference
Deloitte. 2013. Review of Reforms Implementation in the Indian Power Sector. Reportprepared for the World Bank, Washington, DC.
Figure 5.5 Relationship between Reform Implementation and Outcomes
OtherSikkim
Nagaland
Manipur
Other
Tripura
MeghalayaMizoram
Jharkhand
Tamil Nadu
Bihar
GoaKerala
Assam
Uttarakhand
Uttar Pradesh
KarnatakaChhattisgarh
West Bengal
Haryana
Punjab
RajasthanHimachalPradesh
Madhya Pradesh
OrissaAndhra Pradesh
Maharashtra
Gujarat
Delhi
R² = 0.5225
0
0.1
0.2
0.3
0.4
0.5
0.6
0.7
0.8
0.9
1.0
0.1 0.2 0.3 0.4 0.5 0.6 0.7 0.8 0.9 1.0
S e c t o r o u t c o m e s i n d e x s c o r e
Implementation of reforms index score
Low reforms
Low performance
High reforms
Low performance
Low reforms
High performance
High reforms
High performance
Source: Deloitte 2013.
8/20/2019 WB - India Discom Report - Feb15
http://slidepdf.com/reader/full/wb-india-discom-report-feb15 129/255
105More Power to India • http://dx.doi.org/10.1596/978-1-4648-0233-1
The Role of Governance and
Institutional Factors
The Electricity Act of 2003 (EA 2003, or EA) mandated unbundling and
corporatizing the state electricity boards (SEBs), along with establishing indepen-
dent regulators at the central and state levels and the Appellate Tribunal (ApTel),
all for creating a more accountable and commercial performance culture. It was
considered that much of the poor performance of utilities reflected internal and
external shortfalls in governance. A particular motivation was the need to keep
the state government at arm’s length from utilities and regulators alike.
State power sector utilities rarely face the accountability pressures that
commercial enterprises do from equity owners, or even creditors. Most are pub-
licly owned, with ownership vested in the state government, and unlisted, so not
subject to the discipline of stock markets. At the same time, as utilities, their
operational performance is shaped by the framework established by the regulator
(such as tariffs and performance standards). Public ownership, moreover, means
that the interests of owners may differ from the objectives of maximizing profits
or shareholder value that are usually associated with a private corporation. The
incentives and responses, too, of publicly owned firms to regulatory rules differ
from those of privately owned utilities.
The fundamental issue of the extent to which the regulator can influence theactions of a utility that is owned by the state remains unresolved. Regulators can
only infrequently apply sanctions to utilities because they generally have less
political weight than utilities. In fact, “unless the internal governance of the util-
ity focuses on performance (via pressure from the Board of Directors),” the regu-
lator is unlikely to be able to improve performance (Berg 2013, 12). Thus sound
regulatory and corporate governance are reinforcing elements in utilities’ operat-
ing environment.
Unbundling the SEBs has progressed quite well on paper, but full separa-
tion with functional independence of the unbundled entities has generally not
occurred. Also, boards remain state dominated, lack sufficient decision-makingauthority, and are rarely evaluated. The few utilities that have developed
C H A P T E R 6
8/20/2019 WB - India Discom Report - Feb15
http://slidepdf.com/reader/full/wb-india-discom-report-feb15 130/255
106 The Role of Governance and Institutional Factors
More Power to India • http://dx.doi.org/10.1596/978-1-4648-0233-1
information-driven processes and sound mechanisms for performance man-
agement and that make their accounts and audits publicly available tend to be
the top financial performers with high operational efficiency, pointing to the
potential for sound governance to lead to improved performance.On regulatory governance, state electricity regulatory commissions (SERCs)
have struggled to achieve true autonomy from state governments, partly because
of relationships built into the EA. Many SERCs appear to fall short on the
resources needed to carry out their functions—most notably, professional staff
and appropriate information technology (IT) systems. And despite some innova-
tions, most SERCs have yet to implement adequate transparency measures or
create frameworks for meaningful public input to the regulatory process. Finally,
perhaps most important, there is no clear accountability mechanism to govern
the SERCs themselves.
Additional institutional pressures on utility performance come from therequirements of centrally designed and funded government initiatives that must
be executed by the distribution utilities. Such measures often impose collateral
costs on utilities that are not always obvious up front. Beyond that, deficiencies
in implementation often mean that the anticipated returns do not fully material-
ize, a particularly relevant factor for the two large centrally driven programs in
power distribution—the Rajiv Gandhi Grameen Vidyutikaran Yojana (RGGVY)
and the Restructured Accelerated Power Development and Reform Programme
(R-APDRP).
Vertical Restructuring: Unbundling State Electricity Boards
Unbundling the SEBs to create distinct companies with independent accounts
and staff was anticipated to lead to greater transparency in operational perfor-
mance of each element in the service delivery chain, creating incentives for each
such element to achieve a profit (Tongia 2003). Corporatization itself was
intended to create an arm’s-length relationship between the state government
and the utility, and thus create space for the utility to operate along commercial
lines.
Yet unbundled utilities often remain part of a single holding company. Andwhether such unbundled companies are actually run as distinct entities is
unclear, as the chairman of the holding-company board and of the successor-
company boards is frequently the same person and, indeed, board membership
often partly or completely overlaps. This structure undermines the main reason
for unbundling—and muddies lines of accountability. Only half the states that
have unbundled their SEBs have actually finalized staff transfer and created sepa-
rate cadres for each of the unbundled entities. In addition, inherited staff and
human resources policies that require staff to be absorbed by the successor com-
panies restrict the successors’ freedom to manage themselves as commercial
entities.In short it appears that utilities in many unbundled states still do not function
independently. Some practices retained include centralized cash flow, lack of
8/20/2019 WB - India Discom Report - Feb15
http://slidepdf.com/reader/full/wb-india-discom-report-feb15 131/255
The Role of Governance and Institutional Factors 107
More Power to India • http://dx.doi.org/10.1596/978-1-4648-0233-1
autonomous cash management, lack of independence in financing decisions, and
absence of independent power procurement.
Unbundling is thus perhaps better thought of as a process along a continuum
rather than a binary state of “on” or “off.” Utilities may be separate entities legallybut still make operational decisions (procurement, human resources, IT, regula-
tory responses) together. They may receive common direction from a holding
company. Or they may make financial decisions as a single entity. The closer a
utility is to having financial and operational independence the more likely it is
that the impacts expected from unbundling—accountability, transparency, and
stronger performance—will be observed. This may explain why, in a simple cat-
egorization of unbundling, unbundled utilities represent some of India’s worst
performers—and some of the best.
Corporate Governance
Corporate governance includes elements of external and internal accountability.1
For state-owned corporatized enterprises, the role of the board is delicate. As the
owner’s agent it monitors management but it also has a fiduciary duty to insu-
late management from political pressures and ensure that business decisions
are taken on their merits.
State-owned corporatized power utilities have to comply with the Companies
Act of 1956.2 The Guidelines on Corporate Governance issued by the Department
of Public Enterprises (DPE), which apply to central public sector enterprises, go
well beyond the Companies Act. They are not mandatory for utilities that areowned by state governments, but since they apply to government-owned compa-
nies (albeit central rather than state), they are used as the benchmark for recom-
mended practices in this report. Box 6.1 lists key corporate governance good
practices relevant for state utilities.
The history of state control of the SEBs means that the autonomy of the board
and its ability to operate without government interference are particularly
important for corporatized state power utilities. However, state governments
often exert informal influence over utility decisions and, in many cases, there are
far more government directors on utility boards than recommended—and thusnecessarily fewer than recommended independent directors.
The regulator is the other major external entity holding the utility accountable
for performance. This relationship, too, must be managed appropriately, including
addressing the legitimate interest of the public in key utility information that
should be disclosed, such as basic company data, organization charts, company
rules, budget allocations, and accounts.
The boards of directors have two major roles in terms of internal account-
ability: setting company strategies and policies, and monitoring management
performance. To improve performance, the board needs to be able to hold man-
agement accountable. For a start, it needs information systems that generate thedata to monitor management in real time and allow it to create incentives for
improving performance. As managerial accountability for performance increases,
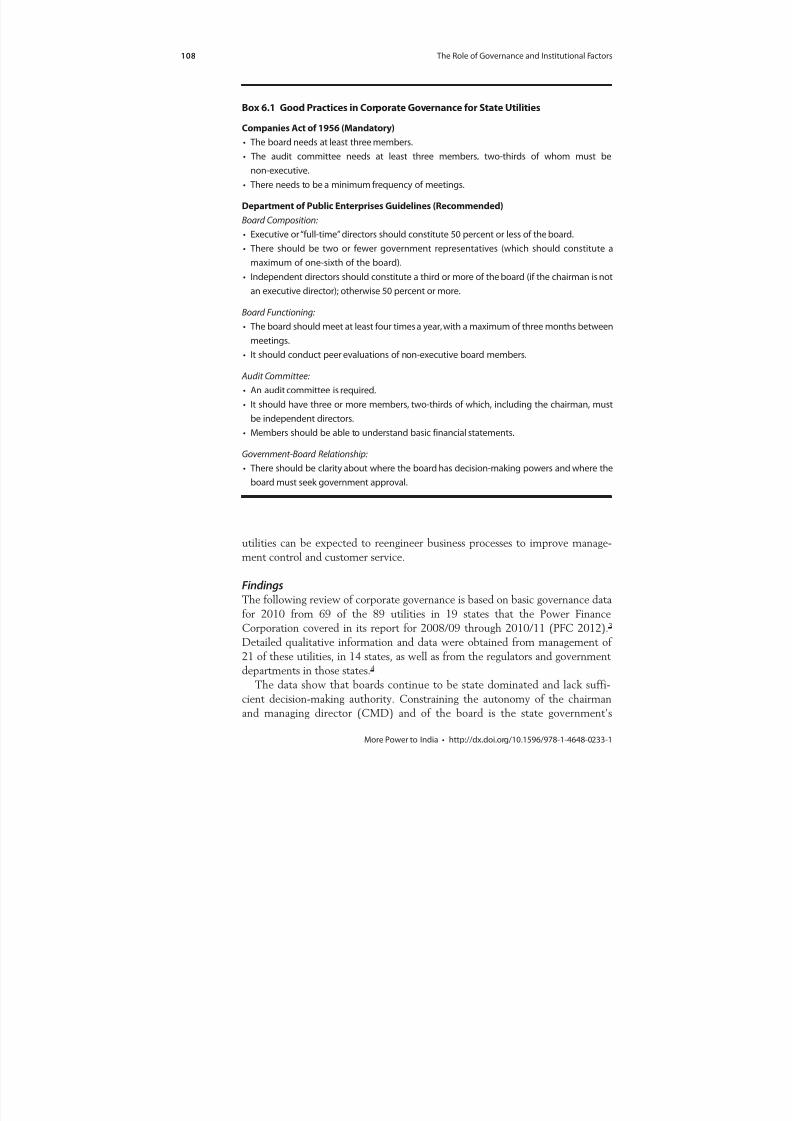
8/20/2019 WB - India Discom Report - Feb15
http://slidepdf.com/reader/full/wb-india-discom-report-feb15 132/255
108 The Role of Governance and Institutional Factors
More Power to India • http://dx.doi.org/10.1596/978-1-4648-0233-1
utilities can be expected to reengineer business processes to improve manage-ment control and customer service.
FindingsThe following review of corporate governance is based on basic governance data
for 2010 from 69 of the 89 utilities in 19 states that the Power Finance
Corporation covered in its report for 2008/09 through 2010/11 (PFC 2012).3
Detailed qualitative information and data were obtained from management of
21 of these utilities, in 14 states, as well as from the regulators and government
departments in those states.4
The data show that boards continue to be state dominated and lack suffi-cient decision-making authority. Constraining the autonomy of the chairman
and managing director (CMD) and of the board is the state government’s
Box 6.1 Good Practices in Corporate Governance for State Utilities
Companies Act of 1956 (Mandatory)
• The board needs at least three members.
• The audit committee needs at least three members, two-thirds of whom must be
non-executive.
• There needs to be a minimum frequency of meetings.
Department of Public Enterprises Guidelines (Recommended)
Board Composition:
• Executive or “full-time” directors should constitute 50 percent or less of the board.
• There should be two or fewer government representatives (which should constitute a
maximum of one-sixth of the board).
• Independent directors should constitute a third or more of the board (if the chairman is not
an executive director); otherwise 50 percent or more.
Board Functioning:
• The board should meet at least four times a year, with a maximum of three months between
meetings.
• It should conduct peer evaluations of non-executive board members.
Audit Committee:
• An audit committee is required.
• It should have three or more members, two-thirds of which, including the chairman, must
be independent directors.
• Members should be able to understand basic financial statements.
Government-Board Relationship:
• There should be clarity about where the board has decision-making powers and where the
board must seek government approval.
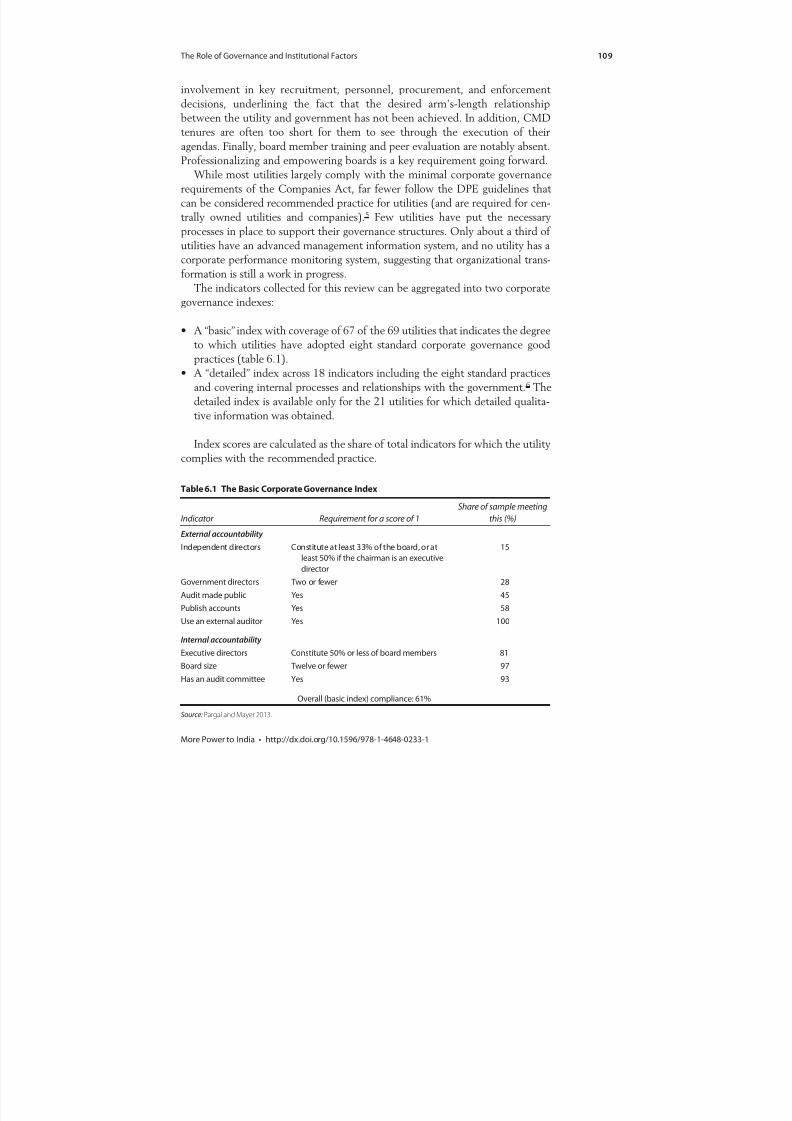
8/20/2019 WB - India Discom Report - Feb15
http://slidepdf.com/reader/full/wb-india-discom-report-feb15 133/255
The Role of Governance and Institutional Factors 109
More Power to India • http://dx.doi.org/10.1596/978-1-4648-0233-1
involvement in key recruitment, personnel, procurement, and enforcement
decisions, underlining the fact that the desired arm’s-length relationship
between the utility and government has not been achieved. In addition, CMD
tenures are often too short for them to see through the execution of theiragendas. Finally, board member training and peer evaluation are notably absent.
Professionalizing and empowering boards is a key requirement going forward.
While most utilities largely comply with the minimal corporate governance
requirements of the Companies Act, far fewer follow the DPE guidelines that
can be considered recommended practice for utilities (and are required for cen-
trally owned utilities and companies).5 Few utilities have put the necessary
processes in place to support their governance structures. Only about a third of
utilities have an advanced management information system, and no utility has a
corporate performance monitoring system, suggesting that organizational trans-
formation is still a work in progress.The indicators collected for this review can be aggregated into two corporate
governance indexes:
• A “basic” index with coverage of 67 of the 69 utilities that indicates the degree
to which utilities have adopted eight standard corporate governance good
practices (table 6.1).
• A “detailed” index across 18 indicators including the eight standard practices
and covering internal processes and relationships with the government.6 The
detailed index is available only for the 21 utilities for which detailed qualita-
tive information was obtained.
Index scores are calculated as the share of total indicators for which the utility
complies with the recommended practice.
Table 6.1 The Basic Corporate Governance Index
Indicator Requirement for a score of 1
Share of sample meeting
this (%)
External accountability
Independent directors Constitute at least 33% of the board, or atleast 50% if the chairman is an executive
director
15
Government directors Two or fewer 28
Audit made public Yes 45
Publish accounts Yes 58
Use an external auditor Yes 100
Internal accountability
Executive directors Constitute 50% or less of board members 81
Board size Twelve or fewer 97
Has an audit committee Yes 93
Overall (basic index) compliance: 61%
Source: Pargal and Mayer 2013.

8/20/2019 WB - India Discom Report - Feb15
http://slidepdf.com/reader/full/wb-india-discom-report-feb15 134/255
110 The Role of Governance and Institutional Factors
More Power to India • http://dx.doi.org/10.1596/978-1-4648-0233-1
The 67 utilities covered by the basic index score an average of 61 percent
on compliance with recommended practices. The lowest compliance rate is
38 percent (Tripura’s corporation, Uttar Pradesh’s UPJVNL generation company,
Tamil Nadu’s SEB, and Karnataka’s Mangalore Electricity Supply Company),while full compliance is achieved by Assam’s distribution company (discom) and
Gujarat’s holding company. Twelve utilities, about 18 percent of the sample,
comply with all but one of the indicators (all have more than two government
directors). All utilities use an external auditor and almost all have boards with 12
or fewer members. But compliance with measures of external accountability—
the number of government directors and share of board that consists of indepen-
dent directors—is relatively low. The performance of distribution utilities is
similar to that of the sample as a whole, suggesting that all power utilities work
within the same corporate governance compact (figure 6.1).
Among the 21 utilities with detailed information, 5 stand out as following atleast two-thirds of recommended corporate governance practices: Gujarat’s dis-
com (Dakshin Gujarat Vij Company, or DGVCL) and holding company, West
Bengal’s discom and transmission company, and Tata Power in Delhi (table 6.2).
These utilities are also some of the stronger financial or operational performers,
sometimes both. DGVCL and Tata Power are among the five discoms with the
lowest aggregate technical and commercial losses, and DGVCL, Tata Power, and
West Bengal’s discom are among the six discoms with the highest profits per unit
of energy sold. This connection between strong corporate governance and
Figure 6.1 Basic Index: Share of Utilities in Compliance with Key Good Practices
Percent
Source: Pargal and Mayer 2013.
0
25
50
75
100
Executive
directors
constitute
50% or less of
board
members
Has an audit
committee
Use an
external
auditor
Audits
made
public
Accounts are
published
Twelve or
fewer board
members
Two or fewer
government
directors
Independent
directors
constitute at
least 33% of
the board, or
at least 50% if
the chairman
is an executive
director
All sample utilities All sample distribution companies
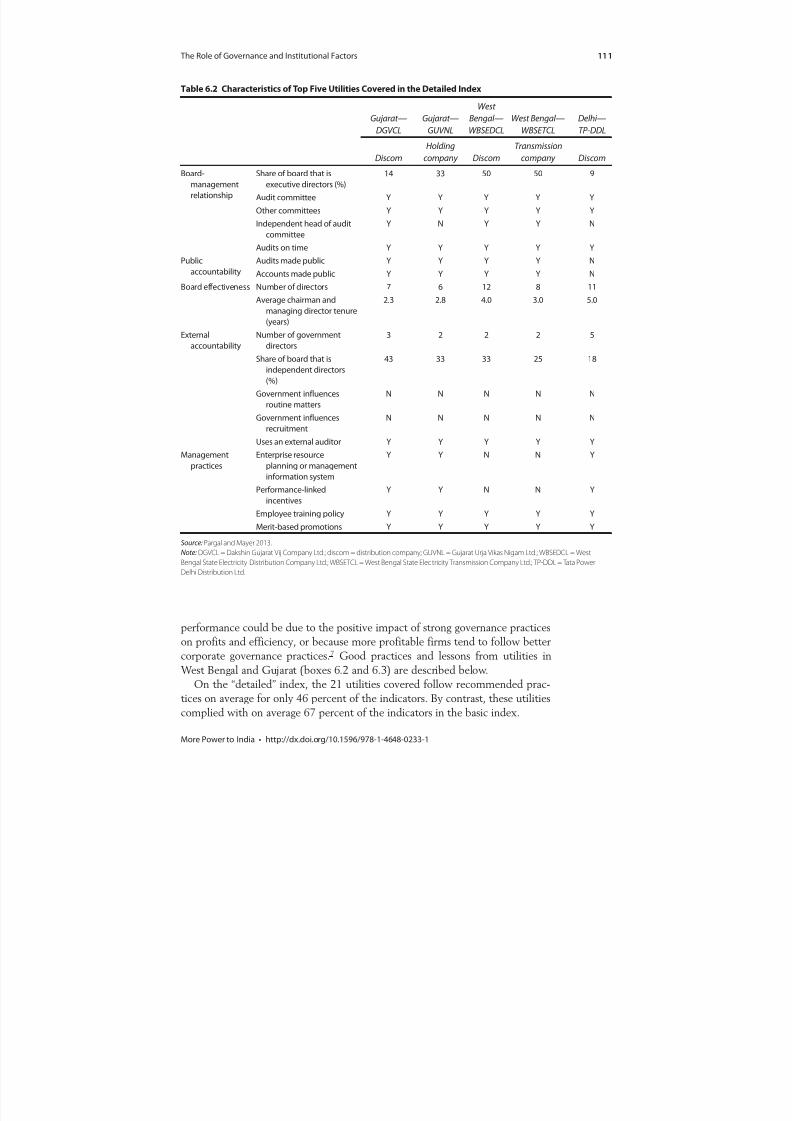
8/20/2019 WB - India Discom Report - Feb15
http://slidepdf.com/reader/full/wb-india-discom-report-feb15 135/255
The Role of Governance and Institutional Factors 111
More Power to India • http://dx.doi.org/10.1596/978-1-4648-0233-1
performance could be due to the positive impact of strong governance practices
on profits and efficiency, or because more profitable firms tend to follow better
corporate governance practices.7 Good practices and lessons from utilities in
West Bengal and Gujarat (boxes 6.2 and 6.3) are described below.
On the “detailed” index, the 21 utilities covered follow recommended prac-tices on average for only 46 percent of the indicators. By contrast, these utilities
complied with on average 67 percent of the indicators in the basic index.
Table 6.2 Characteristics of Top Five Utilities Covered in the Detailed Index
Gujarat—
DGVCL
Gujarat—
GUVNL
West
Bengal—
WBSEDCL
West Bengal—
WBSETCL
Delhi—
TP-DDL
Discom
Holding
company Discom
Transmission
company Discom
Board-
management
relationship
Share of board that is
executive directors (%)
14 33 50 50 9
Audit committee Y Y Y Y Y
Other committees Y Y Y Y Y
Independent head of audit
committee
Y N Y Y N
Audits on time Y Y Y Y Y
Public
accountability
Audits made public Y Y Y Y N
Accounts made public Y Y Y Y NBoard effectiveness Number of directors 7 6 12 8 11
Average chairman and
managing director tenure
(years)
2.3 2.8 4.0 3.0 5.0
External
accountability
Number of government
directors
3 2 2 2 5
Share of board that is
independent directors
(%)
43 33 33 25 18
Government influences
routine matters
N N N N N
Government influences
recruitment
N N N N N
Uses an external auditor Y Y Y Y Y
Management
practices
Enterprise resource
planning or management
information system
Y Y N N Y
Performance-linked
incentives
Y Y N N Y
Employee training policy Y Y Y Y Y
Merit-based promotions Y Y Y Y Y
Source: Pargal and Mayer 2013.
Note: DGVCL = Dakshin Gujarat Vij Company Ltd.; discom = distribution company; GUVNL = Gujarat Urja Vikas Nigam Ltd.; WBSEDCL = West
Bengal State Electricity Distribution Company Ltd.; WBSETCL = West Bengal State Electricity Transmission Company Ltd.; TP-DDL = Tata Power
Delhi Distribution Ltd.
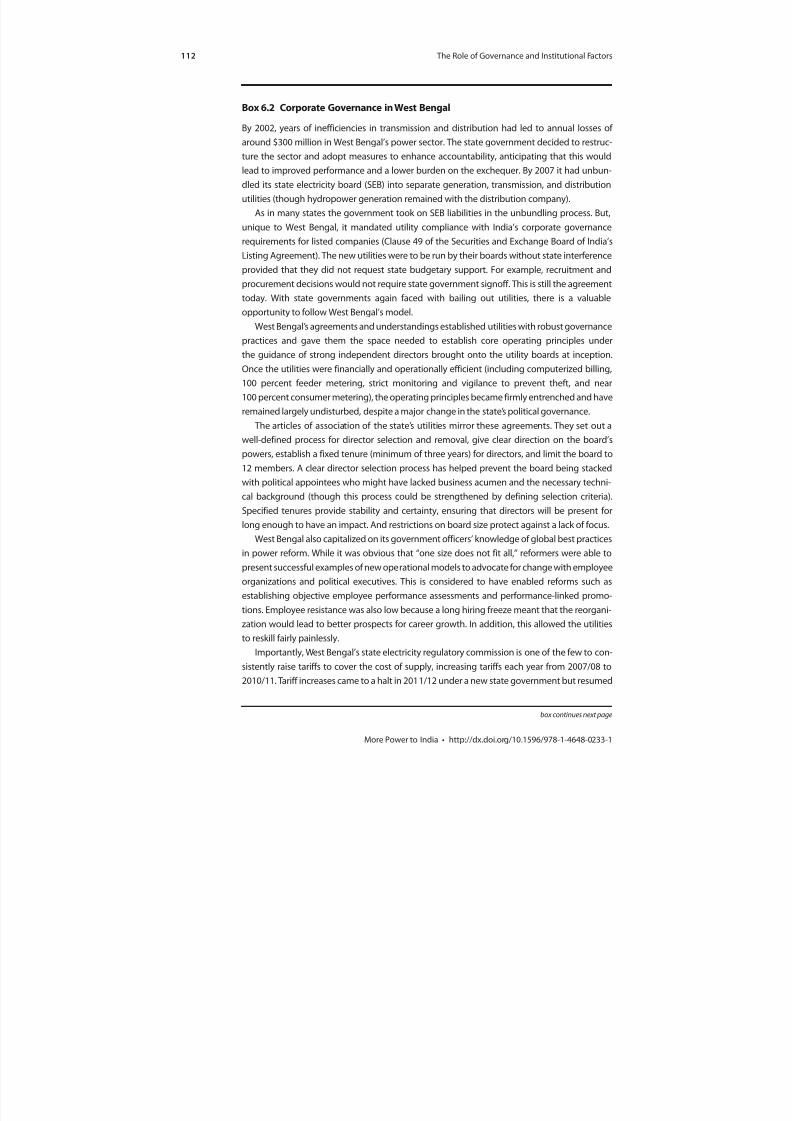
8/20/2019 WB - India Discom Report - Feb15
http://slidepdf.com/reader/full/wb-india-discom-report-feb15 136/255
112 The Role of Governance and Institutional Factors
More Power to India • http://dx.doi.org/10.1596/978-1-4648-0233-1
Box 6.2 Corporate Governance in West Bengal
By 2002, years of inefficiencies in transmission and distribution had led to annual losses of
around $300 million in West Bengal’s power sector. The state government decided to restruc-
ture the sector and adopt measures to enhance accountability, anticipating that this would
lead to improved performance and a lower burden on the exchequer. By 2007 it had unbun-
dled its state electricity board (SEB) into separate generation, transmission, and distribution
utilities (though hydropower generation remained with the distribution company).
As in many states the government took on SEB liabilities in the unbundling process. But,
unique to West Bengal, it mandated utility compliance with India’s corporate governance
requirements for listed companies (Clause 49 of the Securities and Exchange Board of India’s
Listing Agreement). The new utilities were to be run by their boards without state interference
provided that they did not request state budgetary support. For example, recruitment andprocurement decisions would not require state government signoff. This is still the agreement
today. With state governments again faced with bailing out utilities, there is a valuable
opportunity to follow West Bengal’s model.
West Bengal’s agreements and understandings established utilities with robust governance
practices and gave them the space needed to establish core operating principles under
the guidance of strong independent directors brought onto the utility boards at inception.
Once the utilities were financially and operationally efficient (including computerized billing,
100 percent feeder metering, strict monitoring and vigilance to prevent theft, and near
100 percent consumer metering), the operating principles became firmly entrenched and have
remained largely undisturbed, despite a major change in the state’s political governance. The articles of association of the state’s utilities mirror these agreements. They set out a
well-defined process for director selection and removal, give clear direction on the board’s
powers, establish a fixed tenure (minimum of three years) for directors, and limit the board to
12 members. A clear director selection process has helped prevent the board being stacked
with political appointees who might have lacked business acumen and the necessary techni-
cal background (though this process could be strengthened by defining selection criteria).
Specified tenures provide stability and certainty, ensuring that directors will be present for
long enough to have an impact. And restrictions on board size protect against a lack of focus.
West Bengal also capitalized on its government officers’ knowledge of global best practices
in power reform. While it was obvious that “one size does not fit all,” reformers were able to
present successful examples of new operational models to advocate for change with employee
organizations and political executives. This is considered to have enabled reforms such as
establishing objective employee performance assessments and performance-linked promo-
tions. Employee resistance was also low because a long hiring freeze meant that the reorgani-
zation would lead to better prospects for career growth. In addition, this allowed the utilities
to reskill fairly painlessly.
Importantly, West Bengal’s state electricity regulatory commission is one of the few to con-
sistently raise tariffs to cover the cost of supply, increasing tariffs each year from 2007/08 to
2010/11. Tariff increases came to a halt in 2011/12 under a new state government but resumed
box continues next page

8/20/2019 WB - India Discom Report - Feb15
http://slidepdf.com/reader/full/wb-india-discom-report-feb15 137/255
The Role of Governance and Institutional Factors 113
More Power to India • http://dx.doi.org/10.1596/978-1-4648-0233-1
recently, reportedly in part because the state utilities made a compelling case to the new
government that its constituents were willing to pay more for the consistent and reliable power
that higher tariffs enable.
Source: Pargal and Mayer 2013.
Box 6.2 Corporate Governance in West Bengal (continued)
Box 6.3 Organizational Transformation and a Turnaround in Performance in
Gujarat
In 2000 the Gujarat Electricity Board (GEB) was one of India’s worst-performing power utilities—
a drag on the government’s finances and the state’s development. A decade later, the Gujarat
Urja Vikas Nigam (GUVNL) group, comprising seven interlocked companies, is a model publicutility, winning innovation and customer service awards. It is efficient, agile, and profitable.
State leaders gave full support to the turnaround. While power purchase remained central-
ized even after the GEB was unbundled, authority and decision making were decentralized to
constituent companies, each with its own corporate office and a professional board. Politicians
were replaced by bureaucrats and professionals on the board of GUVNL, the holding company,
as well as the boards of its constituent units, while the very best generalist administrators were
appointed to the top management of the unbundled utilities. Strong political backing was
given to the distribution company (discom) staff, including in matters such as halting power
theft by the politically connected.
A multipronged change management strategy was put in place. It involved a purposeful
campaign of information, education, and communication, using dialogue to jointly develop
solutions to issues raised by staff, incentivizing improved housekeeping practices to increase
revenues and cut costs, and implementing initiatives to improve utility finances by cutting
transmission and distribution losses, flab in the organization, and theft. The government neu-
tralized employee apprehensions by signing a tripartite agreement with GEB management
and employee unions that working conditions would be no worse after unbundling, no jobs
would be shed, nor any employee relocated without consent. Starting the new entities off with
a clean balance sheet made financial sustainability of the new structure achievable. The work
culture was transformed by investing heavily in training and capacity building of all staff, fromthe chairman and managing director to the lineman.
The management of the “GUVNL family” also strengthened driving forces for change: for
example, e-Urja—an enterprise resource planning platform—became instrumental in devel-
oping a strong information and communications technology culture that has empowered
staff to develop homegrown solutions to their problems. Decentralized decision making
empowered even junior field staff. Competition among discoms contributed to galvanizing
employees around corporate goals. And a culture of performance management around key
performance indicators further enhanced staff participation. For instance, to curb farmers
stealing power from single-phase supply by using phase-splitting capacitors, discom engi-
neers designed special transformers that trip whenever the load exceeds a given limit.Source: Shah and others 2012.

8/20/2019 WB - India Discom Report - Feb15
http://slidepdf.com/reader/full/wb-india-discom-report-feb15 138/255
114 The Role of Governance and Institutional Factors
More Power to India • http://dx.doi.org/10.1596/978-1-4648-0233-1
Link between Corporate Governance and Utility PerformanceFor the utilities in the sample, the basic corporate governance index is not cor-
related with measures of performance—profits per kilowatt-hour (kWh) with
and without subsidies. But the detailed index is strongly positively correlated(significant at the 1 percent level) with profits per kWh without subsidies for all
utilities and for discoms only (table 6.3). This correlation only covers 20 utilities,
making the significance of these results all the more striking.
The observed correlation is consistent with the idea that the more demanding
implementation-related aspects of corporate governance captured in the detailed
index strongly affect company performance. The basic index focuses on board
size and structure, which may be somewhat superficial—the real impact on per-
formance depends on more meaningful attributes of organization management.
Higher-quality boards are likely to induce internal organizational and process
changes in response to their demands for better information and their interest inholding management accountable for delivering results. This reasoning is consis-
tent with the need for corporate governance practices that go beyond simply
ticking boxes and for boards to actually be strategic and demanding in their
approach to implementing their mandates.
Another explanation consistent with the observed lack of correlation
between the basic index and utility profits comes from the evidence—much of
it qualitative—that the state government remains a big presence in these utilities
and has a say in critical decisions, despite the formal creation of a board to insu-
late management from state interference. This means the state as owner can
undermine the board, so the fact that the board structure and size are consistent
with recommended practices or statutory requirements would not necessarily be
associated with better performance.
The results of an ordinary least-squares cross-section regression of 2010 util-
ity financial performance (measured by per unit profits without subsidies) on
state controls (including measures of regulatory governance), utility controls,
Table 6.3 Correlation between Corporate Governance Variables and Performance Measures
Index
Performance variables (2010) Performance variables (2011)
Profit per unit
(without
subsidies)
Profit per unit
(without
subsidies)—
discoms only
Profit per unit
(with
subsidies)—
discoms only
Profit per unit
(without
subsidies)
Profit per unit
(without
subsidies)—
discoms only
Profit per unit
(with
subsidies)—
discoms only
Basic corporate
governance
index 0.039 0.059 −0.090 0.039 −0.068 0.052
Detailed
corporate
governance
index 0.621*** 0.791*** 0.612** 0.621*** 0.751*** 0.507*
Source: Pargal and Mayer 2013.
Note: discom = distribution company.
Significance level: * = 10 percent, ** = 5 percent, *** = 1 percent.
8/20/2019 WB - India Discom Report - Feb15
http://slidepdf.com/reader/full/wb-india-discom-report-feb15 139/255
The Role of Governance and Institutional Factors 115
More Power to India • http://dx.doi.org/10.1596/978-1-4648-0233-1
and corporate governance indicators are consistent with these findings
(see appendix N). While the basic index is not significantly related to utility
performance, the share of the board that is executive directors is significantly
negatively associated with performance and the share of the board that isindependent directors is positively associated with performance.8
Overall, the analysis undertaken for this review indicates that going beyond
the Companies Act requirements and implementing the DPE-recommended
practices (and even going beyond those to effect organizational transformation)
are associated with significantly higher profits per unit, indicating a potential
win-win.
Regulatory Governance
Establishing state electricity regulators under the Electricity RegulatoryCommission Act of 1998, and, subsequently, the EA 2003 was intended to
reduce government control over the power sector and delink it from electoral
politics. The EA 2003 aimed to create an independent, unbiased, and trans-
parent governance framework that balanced consumer and investor interests,
specifically by removing regulation and tariff determination from the purview
of the government.9
The SERCs are mandated to play multiple roles. They are expected to pre-
vent state intervention in the sector and protect the interests of different
stakeholders by regulating the operations of power utilities and the tariff
chargeable to consumers (Prayas Energy Group 2003). Key responsibilitiesinclude issuing licenses for distribution and intra-state transmission; ensuring
nondiscriminatory open access to both the transmission and distribution sys-
tems to promote competition and support the development of a multibuyer
market and power trading; regulating and rationalizing tariffs to cover costs;
implementing multiyear tariff frameworks to reduce uncertainty and encour-
age investment in the sector; establishing and monitoring standards for licensee
service quality and reliability; and safeguarding consumer interests, such as by
setting up mechanisms to redress grievances. In addition, the SERCs are tasked
with drafting, notifying, and implementing additional regulations to enact theEA mandates.
The ability of the SERCs to carry out their mandates depends on their techni-
cal, financial, and human resources; their competence; their autonomy in deci-
sion making (including insulation from political pressures); and their
accountability—all falling under the rubric of institutional design (ID).
Analyzing Performance of SERCsTo efficiently organize the information available under different heads and ana-
lyze the performance of the SERCs, simple indexes (unweighted averages) have
been created to measure how each SERC implemented key regulatory mandatesand their rating on the main pillars of ID (table 6.4). All SERCs other than those
in three small states, where data are very spotty, are included.
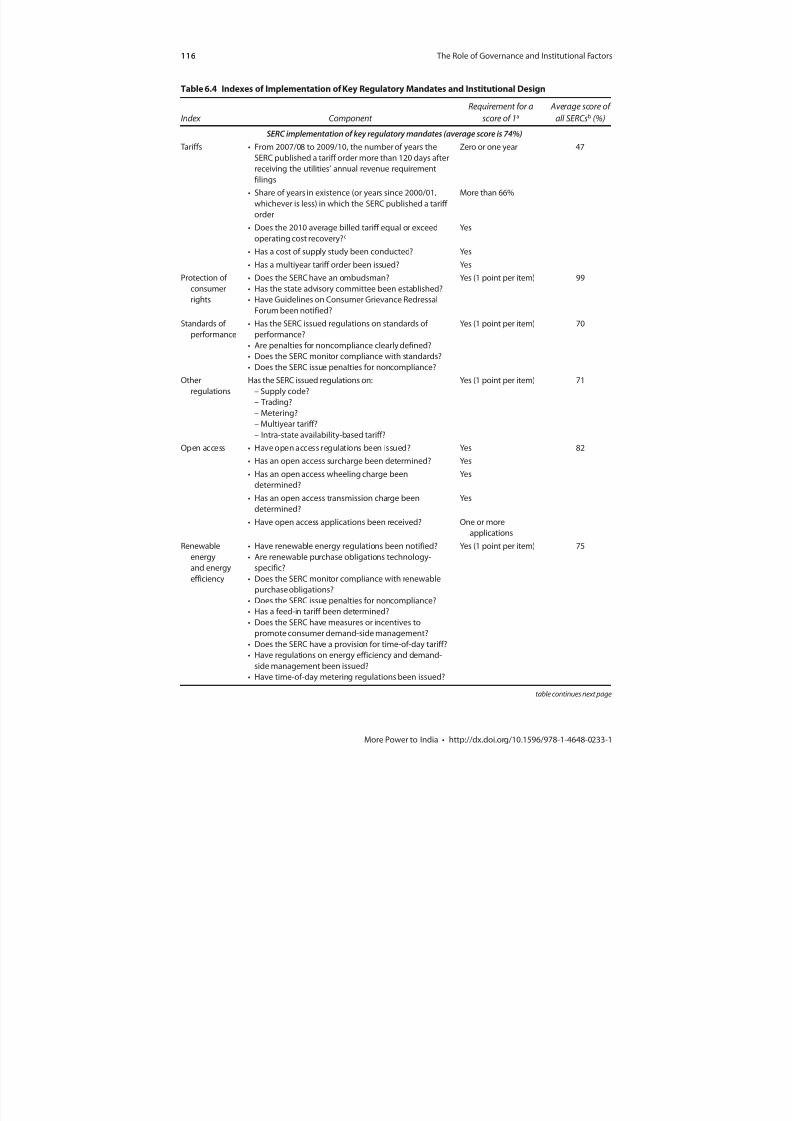
8/20/2019 WB - India Discom Report - Feb15
http://slidepdf.com/reader/full/wb-india-discom-report-feb15 140/255
116 The Role of Governance and Institutional Factors
More Power to India • http://dx.doi.org/10.1596/978-1-4648-0233-1
Table 6.4 Indexes of Implementation of Key Regulatory Mandates and Institutional Design
Index Component
Requirement for a
score of 1a
Average score of
all SERCsb (%)
SERC implementation of key regulatory mandates (average score is 74%) Tariffs • From 2007/08 to 2009/10, the number of years the
SERC published a tariff order more than 120 days after
receiving the utilities’ annual revenue requirement
filings
Zero or one year 47
• Share of years in existence (or years since 2000/01,
whichever is less) in which the SERC published a tariff
order
More than 66%
• Does the 2010 average billed tariff equal or exceed
operating cost recovery?c
Yes
• Has a cost of supply study been conducted? Yes
• Has a multiyear tariff order been issued? Yes
Protection of
consumer
rights
• Does the SERC have an ombudsman?
• Has the state advisory committee been established?
• Have Guidelines on Consumer Grievance Redressal
Forum been notified?
Yes (1 point per item) 99
Standards of
performance
• Has the SERC issued regulations on standards of
performance?
• Are penalties for noncompliance clearly defined?
• Does the SERC monitor compliance with standards?
• Does the SERC issue penalties for noncompliance?
Yes (1 point per item) 70
Other
regulations
Has the SERC issued regulations on:
– Supply code?
– Trading?
– Metering?– Multiyear tariff?
– Intra-state availability-based tariff?
Yes (1 point per item) 71
Open access • Have open access regulations been issued? Yes 82
• Has an open access surcharge been determined? Yes
• Has an open access wheeling charge been
determined?
Yes
• Has an open access transmission charge been
determined?
Yes
• Have open access applications been received? One or more
applications
Renewableenergy
and energy
efficiency
• Have renewable energy regulations been notified?• Are renewable purchase obligations technology-
specific?
• Does the SERC monitor compliance with renewable
purchase obligations?
• Does the SERC issue penalties for noncompliance?
• Has a feed-in tariff been determined?
• Does the SERC have measures or incentives to
promote consumer demand-side management?
• Does the SERC have a provision for time-of-day tariff?
• Have regulations on energy efficiency and demand-
side management been issued?
• Have time-of-day metering regulations been issued?
Yes (1 point per item) 75
table continues next page

8/20/2019 WB - India Discom Report - Feb15
http://slidepdf.com/reader/full/wb-india-discom-report-feb15 141/255
The Role of Governance and Institutional Factors 117
More Power to India • http://dx.doi.org/10.1596/978-1-4648-0233-1
The “overall” indexes are simple averages of the subindexes. Thus the ID index
averages scores on the subindexes for regulator autonomy, transparency, and
capacity. (In the absence of quantitative benchmarks, an index has not been
developed to measure regulator accountability.) The subindexes are calculated as
the share of relevant criteria in each subindex category with which each state
regulator complies. The implementation of key regulatory mandates (IM) index
averages the scores on the subindexes for tariffs, protection of consumers, stan-
dards of performance, open access, renewable energy, and notification of other
regulations.10 The two indexes are significantly (at 1 percent) positively related
with a correlation of 0.59, suggesting that implementation of mandates moves in
line with desirable ID.
The SERCs receive an average score of only 48 percent on the ID index but
an average of 74 percent on the IM index, on which Andhra Pradesh, Himachal
Pradesh, and Karnataka are the highest-ranking SERCs. Most SERCs score close
to or above the average on the IM index (figure 6.2).
While progress has been significant, most SERCs have not yet fully imple-mented the EA mandates. For instance, average billed tariffs cover average cost
Table 6.4 Indexes of Implementation of Key Regulatory Mandates and Institutional Design (continued)
Index Component
Requirement for a
score of 1a
Average score of
all SERCsb (%)
SERC institutional design (average score is 48%)Autonomy • What was the average chairman tenure over the last
10 years (or since the SERC was created, whichever is
shorter)?
Five or more years 42
• Is the budget from own revenues or a mix of own
revenues and state grants?
Yes
Capacity • Is there a Regulatory Information Management
System?
Yes 28
• Number of professional staff Fifteen or more (per
Forum of Regulators
recommendation)
Transparency • Are regulatory decisions online?• Are public hearings held before the tariff order?
• Is the updated hearing schedule online?
• Are annual reports available on the website?
• Are annual reports available in the local language?
• Is the Constitution of the state advisory committee
online?
• Are the minutes of the state advisory committee
online?
Yes (1 point per item) 75
Source: Pargal and Mayer 2013.
Note: SERC = state electricity regulatory commission.
a. The benchmarks are taken from legislation or recommended best practices, except standards for publishing tariff orders annually and on time,
which are as specified in the table.
b. The exclusion of three small states may skew averages upward, as these states had generally not achieved the benchmarks considered in thisreport for which data were available.
c. Operating cost recovery is defined as the tariff level that covers (equals) average operating cost plus a premium to account for “normal”
distribution losses, which are set at 10 percent for India for this analysis.
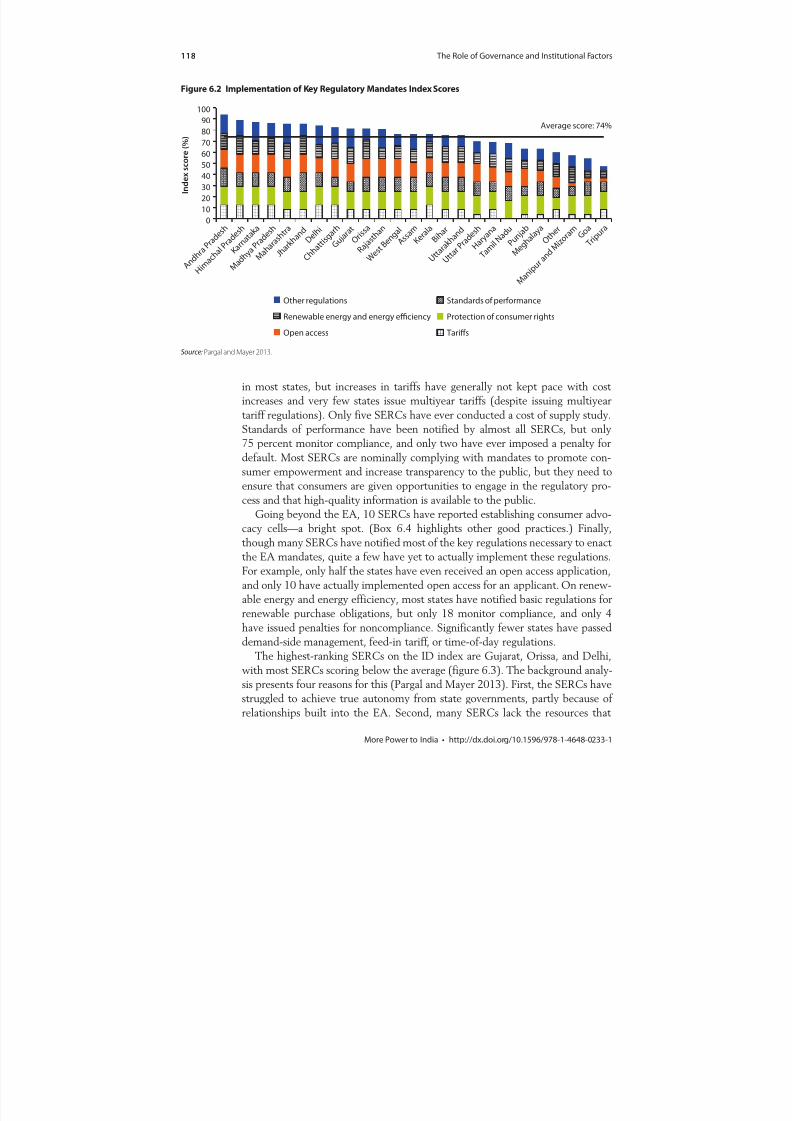
8/20/2019 WB - India Discom Report - Feb15
http://slidepdf.com/reader/full/wb-india-discom-report-feb15 142/255
118 The Role of Governance and Institutional Factors
More Power to India • http://dx.doi.org/10.1596/978-1-4648-0233-1
in most states, but increases in tariffs have generally not kept pace with cost
increases and very few states issue multiyear tariffs (despite issuing multiyear
tariff regulations). Only five SERCs have ever conducted a cost of supply study.Standards of performance have been notified by almost all SERCs, but only
75 percent monitor compliance, and only two have ever imposed a penalty for
default. Most SERCs are nominally complying with mandates to promote con-
sumer empowerment and increase transparency to the public, but they need to
ensure that consumers are given opportunities to engage in the regulatory pro-
cess and that high-quality information is available to the public.
Going beyond the EA, 10 SERCs have reported establishing consumer advo-
cacy cells—a bright spot. (Box 6.4 highlights other good practices.) Finally,
though many SERCs have notified most of the key regulations necessary to enactthe EA mandates, quite a few have yet to actually implement these regulations.
For example, only half the states have even received an open access application,
and only 10 have actually implemented open access for an applicant. On renew-
able energy and energy efficiency, most states have notified basic regulations for
renewable purchase obligations, but only 18 monitor compliance, and only 4
have issued penalties for noncompliance. Significantly fewer states have passed
demand-side management, feed-in tariff, or time-of-day regulations.
The highest-ranking SERCs on the ID index are Gujarat, Orissa, and Delhi,
with most SERCs scoring below the average (figure 6.3). The background analy-
sis presents four reasons for this (Pargal and Mayer 2013). First, the SERCs havestruggled to achieve true autonomy from state governments, partly because of
relationships built into the EA. Second, many SERCs lack the resources that
Figure 6.2 Implementation of Key Regulatory Mandates Index Scores
Source: Pargal and Mayer 2013.
Average score: 74%
0
10
20
30
40
50
60
70
80
90
100
A n d h
r a P r a
d e s h
H i m
a c h a
l P r a d
e s h
K a r n a
t a k a
M a d h
y a P r a d
e s h
M a h a
r a s h t r
a
J h a r k h a
n d D e
l h i
C h h a
t t i s g
a r h
G u j a r
a t O r
i s s a
R a j a s
t h a n
W e s t B e
n g a l A s
s a m K e r a l
a B i h
a r
U t t a r
a k h a
n d
U t t a r
P r a d
e s h
H a r y a
n a
T a m i l N
a d u
P u n j a b
M e g h a
l a y a O t h e
r
M a n i p u
r a n d
M i z o
r a m G o a
T r i p u
r a
I n d e x s c o r e ( % )
Tariffs
Protection of consumer rights
Standards of performance
Open access
Renewable energy and energy efficiency
Other regulations
8/20/2019 WB - India Discom Report - Feb15
http://slidepdf.com/reader/full/wb-india-discom-report-feb15 143/255
The Role of Governance and Institutional Factors 119
More Power to India • http://dx.doi.org/10.1596/978-1-4648-0233-1
might assist in performing their functions—most notably, adequate numbers of
professional staff and appropriate IT systems. Third, most SERCs have yet to
implement adequate transparency measures and create frameworks for meaning-
ful public input on the regulatory process.
And fourth, the lack of a clear accountability mechanism to govern the SERCs
themselves is clear from the absence of an appropriate measure of such account-
ability. All SERCs are technically accountable to the state legislature, as theSERC submits rules and regulations to the legislature before issuance. The
SERCs also file their audited accounts and annual reports with the legislature.
Box 6.4 Involving Consumers as Stakeholders: Selected State Electricity
Regulatory Commission Experiences
The state electricity regulatory commissions (SERCs) of Delhi (DERC) and Maharashtra (MERC)
stand out as having developed innovative mechanisms to ensure public opinion is taken into
account in regulatory proceedings. Madhya Pradesh’s (MPERC) is notable for raising consumer
awareness of standards of performance.
The DERC began conducting consumer surveys in 2007, and Delhi remains the only state in
which surveys are carried out regularly, with the results used to measure licensee performance.
The survey asks 10,000–15,000 domestic consumers about their preferences along seven
macro parameters (such as supply continuity and quality); their satisfaction with their distribu-
tion companies (discoms) along several micro parameters; and their ranking of the impor-
tance of each parameter. The DERC publishes the survey findings in its annual reports along
with the scores of the three discoms and the best- and worst-performing areas for each
discom.
The MERC is the first and still only SERC to form a panel of authorized consumer representa-
tives to represent the interests of consumers in SERC proceedings. The relevant regulation
states that the representatives should also recommend capacity building for consumer groups
and take steps to improve the efficacy of the SERC’s regulatory processes (though it does not
say how it expects the representatives to do this). From time to time, the MERC may also direct
the representatives to educate consumers on demand-side management and their rights to
service, provide advice to the SERC on safeguarding consumers’ interests in SERC orders and
regulations, assist the SERC in improving the efficacy of its consumer grievance redressalmechanisms, and bring to the SERC’s attention any noncompliance with its orders and regula-
tions. The panel comprises a mix of individuals and registered organizations working on con-
sumer grievances, both selected through a process specified in the MERC regulations.
The MPERC is one of the few SERCs that has taken steps to increase consumer awareness of
standards of performance to mitigate the significant challenge that lack of awareness poses to
successful implementation of the regulations. It monitors utilities’ compliance with the stan-
dards and publishes an annual compliance report in newspapers, in English and Hindi, and on
its website. It has also directed licensees to publish the standards on noticeboards in key sub-
division offices for consumers visiting the offices.
Source: Pargal and Mayer 2013.

8/20/2019 WB - India Discom Report - Feb15
http://slidepdf.com/reader/full/wb-india-discom-report-feb15 144/255
120 The Role of Governance and Institutional Factors
More Power to India • http://dx.doi.org/10.1596/978-1-4648-0233-1
But in practice, the state legislatures ask few questions about rules and regula-
tions, and there have been few instances noted of proactivity from the legislature.
Even SERC budgets are usually passed with little debate.
An additional accountability channel is the ApTel, established under the EA
2003 to hear appeals by those aggrieved by SERC orders, subjecting the SERCsto judicial scrutiny. At the request of the Ministry of Power, in 2011 the ApTel
issued directions to all SERCs to revise tariffs periodically, by suo motu11 action,
if necessary, in the interest of improving the financial health and viability of the
electricity sector in general and distribution utilities in particular (Appellate
Tribunal for Electricity 2011). But since the ApTel is not mandated to routinely
monitor or review SERC performance, its mandate would need to be modified
for it to function as a proper accountability mechanism. The consumer protec-
tion measures that the SERCs are required to put in place are a further account-
ability device. Lack of full public transparency and limited follow-through onnoncompliance with standards of performance, however, inhibit consumers’
ability to meaningfully hold the SERCs accountable. Likely in recognition of this
lack of accountability, the Shunglu Committee, set up by the Planning
Commission in 2010 to review the financial problems of the SEBs and discoms
and to identify steps to improve their performance, recommended instituting
SERC performance monitoring (Planning Commission 2011). And in early 2013
the central government initiated discussion on a possible amendment to the EA
2003 to strengthen the accountability framework for the SERCs.
Regulatory Governance and PerformanceThe correlation between each of the two indexes of regulatory governance and
measures of utility financial performance is positive and significantly different
Figure 6.3 Institutional Design Index Scores
Source: Pargal and Mayer 2013.
Average score: 48%
0
25
50
75
100
G u j a r
a t O r i s s
a D e l h i
M a h a
r a s h t
r a
A n d h r a P r a
d e s h
C h h a
t t i s g a r h
H i m a
c h a l P r a
d e s h
J h a r k h a
n d
U t t a r
P r a d e s h
W e s t B e
n g a l
K a r n a t a k a
K e r a l a
M
a d h y
a P r a d
e s h
R a j a s t h a n O t h e
r
P u n j a b
T a m i l N
a d u B i h
a r G o a
M a n i p u r
a n d M
i z o r a m
M e g h a
l a y a
T r i p u r a
H a r y a
n a
A s s a m
U t t a r
a k h a
n d
I n d e x s c o r e ( % )
Autonomy Capacity Transparency
8/20/2019 WB - India Discom Report - Feb15
http://slidepdf.com/reader/full/wb-india-discom-report-feb15 145/255
The Role of Governance and Institutional Factors 121
More Power to India • http://dx.doi.org/10.1596/978-1-4648-0233-1
from zero at the 1 percent level, underlining the importance of regulatory
governance to utility functioning. This result holds for all utilities in the sample
as well as for the subset that is discoms. Utility financial performance is mea-
sured by profits per unit without subsidies (for all utilities and for discoms) aswell as profits per unit with subsidies for discoms only.12
Appendix N shows that in an ordinary least-squares cross-section regression
of 2010 utility financial performance on utility controls, state per capita income
and each of the regulatory governance indexes separately, the indexes are signifi-
cantly positively related to utility profits per unit without subsidies. When
included in the same regression together, only the ID index is significantly differ-
ent from zero.
The ID index captures the features of the regulatory framework, such as pre-
dictability, and certainty and quality of regulatory decisions that are expected to
impact utility strategic and operational choices, while the IM index goes to theheart of how active the regulator has been (and potentially is likely to be). Some
areas of regulatory action would likely improve the utility’s operational viability
(including regular tariff revisions to cover costs), while others may have a nega-
tive impact on profits (such as clean energy mandates or open access that would
draw away large industrial or commercial consumers) so the net effect of the IM
index is not necessarily predictable. This result is robust to the inclusion of cor-
porate governance controls in the regression—that is, the coefficient on the ID
index remains positive and significant, while the coefficient on the IM index is
positive but not significantly different from zero. Thus, getting the design of regu-
latory institutions right—especially key attributes such as autonomy, capacity,and transparency measured in the ID index—should be a priority for states.
Effect of Regulatory Decisions on Utilities’ FinancesThe regulator shapes the environment in which utilities operate, most directly
through decisions on the expenses considered appropriate for passing through to
consumers through the tariff.
Expense Disallowances
The expenses claimed by utilities often differ widely from those allowed by theSERC. In recent years many regulators have not permitted pass-through to the
tariffs of the full cost of power purchased, particularly for the power bought in
the short-term market. So discoms have been unable to fully recover their
costs—a serious blow, as power purchase accounts for 70–80 percent of discoms’
operating costs.13 Likewise, the impact of disallowing interest expenses on short-
term borrowing hits utility profits. Similar disallowances have been experienced
for transmission (figure 6.4).
Disallowance of Return on Equity
The Central Electricity Regulatory Commission has set the return on equity forgeneration and transmission projects at 15.5 percent, which is expected to be
followed by the SERCs while deciding on the tariffs applicable in their states.
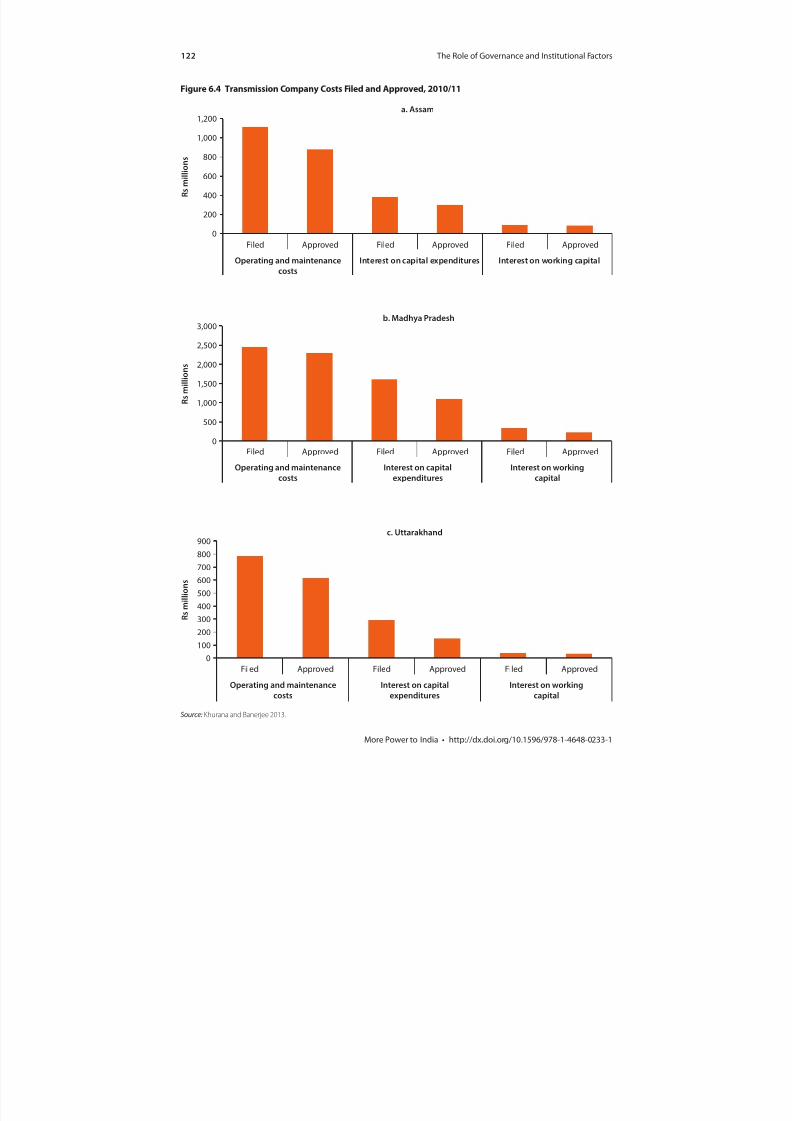
8/20/2019 WB - India Discom Report - Feb15
http://slidepdf.com/reader/full/wb-india-discom-report-feb15 146/255
122 The Role of Governance and Institutional Factors
More Power to India • http://dx.doi.org/10.1596/978-1-4648-0233-1
b. Madhya Pradesh
0
500
1,000
1,500
2,000
2,500
3,000
Filed Approved Filed Approved Filed Approved
Operating and maintenance
costs
Interest on capital
expenditures
Interest on working
capital
R s m i l l i o n s
Figure 6.4 Transmission Company Costs Filed and Approved, 2010/11
0
200
400
600
800
1,000
1,200
Filed Approved Filed Approved Filed Approved
Operating and maintenance
costs
Interest on capital expenditures Interest on working capital
R s m i l l i o n s
a. Assam
c. Uttarakhand
0
100
200
300
400
500
600
700
800
900
Filed Approved Filed Approved Filed Approved
Operating and maintenancecosts
Interest on capitalexpenditures
Interest on workingcapital
R s m i l l i o n s
Source: Khurana and Banerjee 2013.
8/20/2019 WB - India Discom Report - Feb15
http://slidepdf.com/reader/full/wb-india-discom-report-feb15 147/255
The Role of Governance and Institutional Factors 123
More Power to India • http://dx.doi.org/10.1596/978-1-4648-0233-1
But the SERCs in Bihar, Haryana, and Uttar Pradesh, among others, either do not
allow or allow less than the specified annual return on equity to their generation
and transmission utilities.
Buildup of “Regulatory Assets.”
To avoid a tariff shock to consumers, at times the SERCs do not increase tariffs
during the period in which costs have increased. The shortfall in revenue of the
distribution utility is recognized as a regulatory asset to be recovered through
future tariff increases. Mounting regulatory assets have increased the discoms’
cash-flow problems, jeopardizing routine operations.14 In Tamil Nadu, Rajasthan,
Punjab, Uttar Pradesh, Haryana, Delhi (see appendix J), and West Bengal, utili-
ties have had to borrow heavily to fund the revenue deficit. Although the ApTel
has ruled that regulatory assets must be recovered over three years, the sheer size
of current regulatory assets means that this would induce a major tariff shock.Recovery has thus been spread over a longer period, with no relief to utility
finances. Exacerbating the problem are delays in “truing up,” regulators assigning
lower power purchase costs than used by discoms in their projected revenue
requirements to keep starting tariffs low, and the interest burden on cash-
strapped discoms that have to borrow to purchase power.
Central Mandates
Centrally sponsored programs bring substantial resources to the sector but can
also impose costs that are not always anticipated at the design stage. A majorsource of pressure on distribution utility finances is the mandate to build and
“power up” the vast network of lines laid across the country under the central
government’s flagship access program, RGGVY. Due to low demand (per con-
sumer and overall), high cost of service provision, and low (frequently below-
cost) tariffs, this powering-up is nonremunerative.
Where programs have been designed to increase distribution efficiency, weak-
ness in rollout often undermines achieving results. A potentially transformative
two-part central program to increase distribution efficiency, the R-APDRP, has
not yet realized its potential because of implementation deficiencies.Finally, since both the RGGVY and R-APDRP are directed at the same utili-
ties, greater coordination between them could generate myriad synergies. For
instance, rather than restricting to urban areas the collection of baseline data and
use of IT needed for R-APDRP, data collection could be extended to the com-
plete service area of the utilities being supported so that utility performance in
rural areas can also be tracked, thus supporting monitoring of RGGVY and put-
ting in place the information base for targeted interventions in the utility service
area.
Rajiv Gandhi Grameen Vidyutikaran YojanaThe RGGVY promises a 90 percent subsidy from the Rural Electrification
Corporation (REC) for the capital cost of grid extension and for decentralized
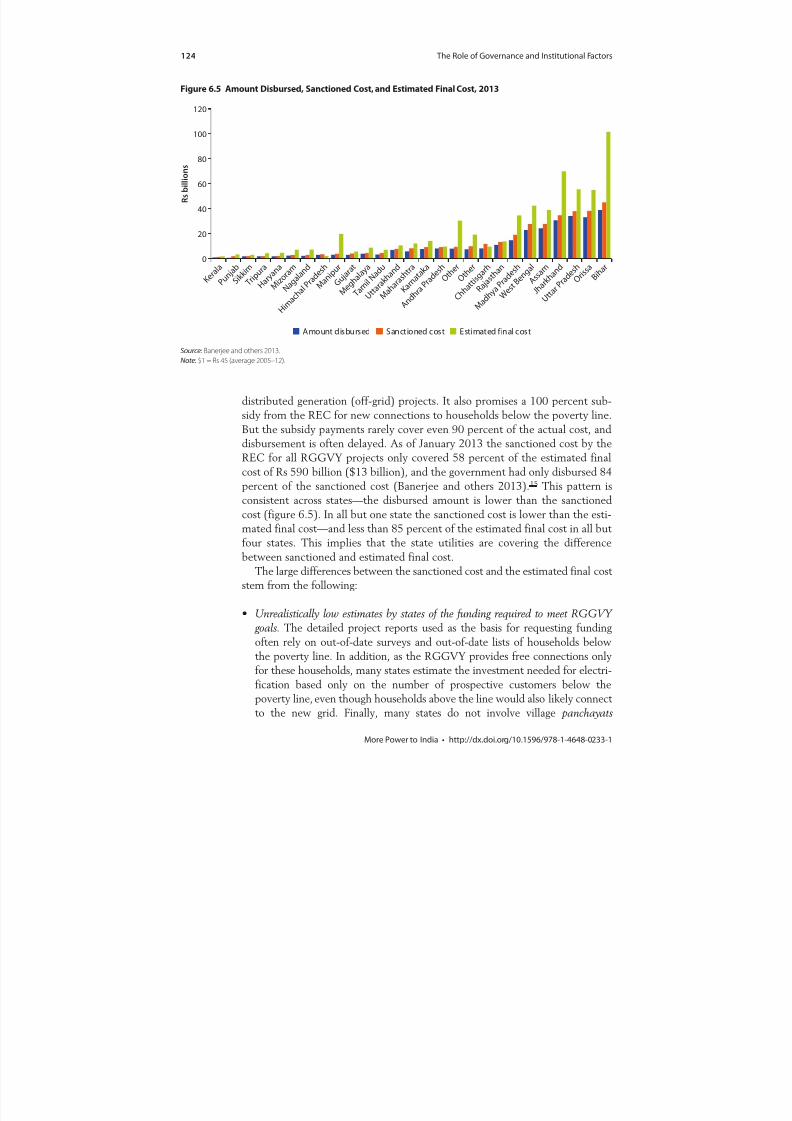
8/20/2019 WB - India Discom Report - Feb15
http://slidepdf.com/reader/full/wb-india-discom-report-feb15 148/255
124 The Role of Governance and Institutional Factors
More Power to India • http://dx.doi.org/10.1596/978-1-4648-0233-1
distributed generation (off-grid) projects. It also promises a 100 percent sub-
sidy from the REC for new connections to households below the poverty line.But the subsidy payments rarely cover even 90 percent of the actual cost, and
disbursement is often delayed. As of January 2013 the sanctioned cost by the
REC for all RGGVY projects only covered 58 percent of the estimated final
cost of Rs 590 billion ($13 billion), and the government had only disbursed 84
percent of the sanctioned cost (Banerjee and others 2013).15 This pattern is
consistent across states—the disbursed amount is lower than the sanctioned
cost (figure 6.5). In all but one state the sanctioned cost is lower than the esti-
mated final cost—and less than 85 percent of the estimated final cost in all but
four states. This implies that the state utilities are covering the differencebetween sanctioned and estimated final cost.
The large differences between the sanctioned cost and the estimated final cost
stem from the following:
• Unrealistically low estimates by states of the funding required to meet RGGVY goals. The detailed project reports used as the basis for requesting funding
often rely on out-of-date surveys and out-of-date lists of households below
the poverty line. In addition, as the RGGVY provides free connections only
for these households, many states estimate the investment needed for electri-
fication based only on the number of prospective customers below thepoverty line, even though households above the line would also likely connect
to the new grid. Finally, many states do not involve village panchayats
Figure 6.5 Amount Disbursed, Sanctioned Cost, and Estimated Final Cost, 2013
Source: Banerjee and others 2013.
Note: $1 = Rs 45 (average 2005–12).
0
20
40
60
80
100
120
K e r a l a
P u n j a b S i k k i
m T r i p u
r a
H a r y a n a
M i z o r a
m
N a g a l a n
d
H i m a
c h a l P r a d e s
h
M a n i p u
r
G u j a r a t
M e g h a l a y
a
T a m i l N a d
u
U t t a r
a k h a n d
M a h a
r a s h t r a
K a r n a t a k
a
A n d h r a P r a d e s
h O t h
e r
O t h e r
C h h a
t t i s g a r h
R a j a s t h a
n
M a d h y a
P r a d e s
h
W e s t B e n g
a l
A s s a m
J h a r k h a n
d
U t t a r
P r a d e s
h O r i s s
a B i h
a r
R s b i l l i o n s
Amount disbursed Sanctioned cost Estimated final cost
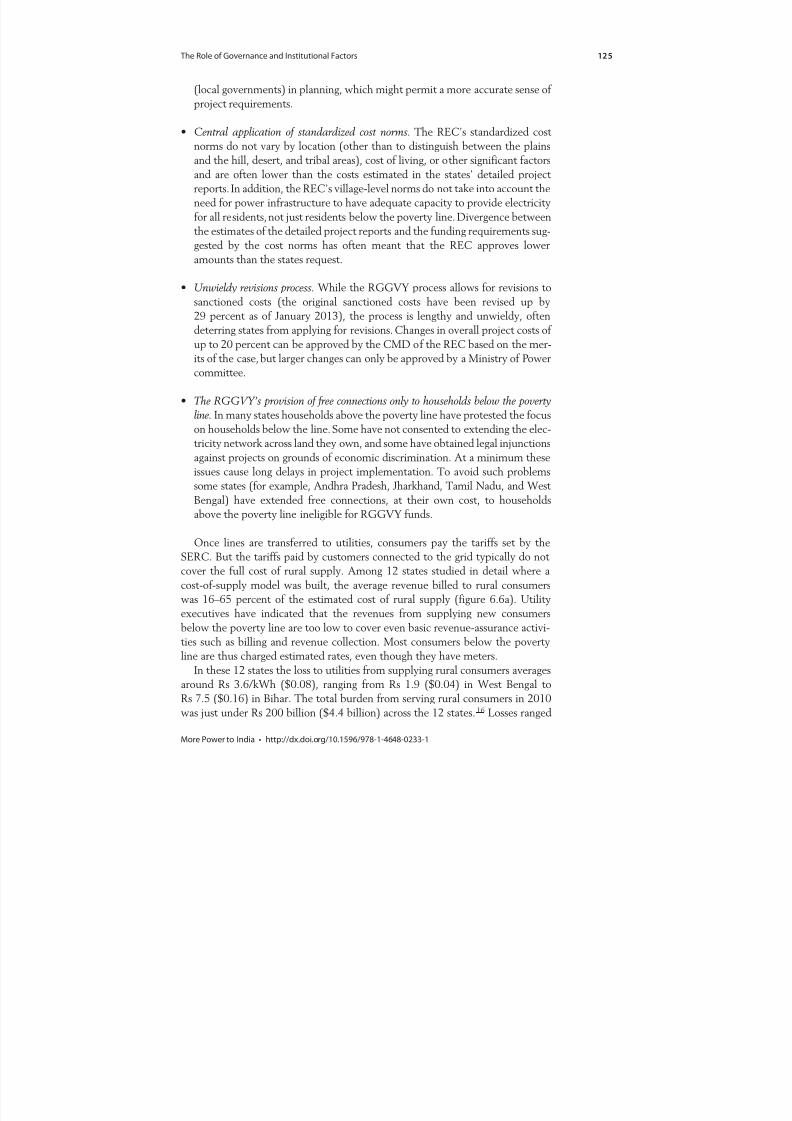
8/20/2019 WB - India Discom Report - Feb15
http://slidepdf.com/reader/full/wb-india-discom-report-feb15 149/255
The Role of Governance and Institutional Factors 125
More Power to India • http://dx.doi.org/10.1596/978-1-4648-0233-1
(local governments) in planning, which might permit a more accurate sense of
project requirements.
•
Central application of standardized cost norms. The REC’s standardized costnorms do not vary by location (other than to distinguish between the plains
and the hill, desert, and tribal areas), cost of living, or other significant factors
and are often lower than the costs estimated in the states’ detailed project
reports. In addition, the REC’s village-level norms do not take into account the
need for power infrastructure to have adequate capacity to provide electricity
for all residents, not just residents below the poverty line. Divergence between
the estimates of the detailed project reports and the funding requirements sug-
gested by the cost norms has often meant that the REC approves lower
amounts than the states request.
• Unwieldy revisions process. While the RGGVY process allows for revisions to
sanctioned costs (the original sanctioned costs have been revised up by
29 percent as of January 2013), the process is lengthy and unwieldy, often
deterring states from applying for revisions. Changes in overall project costs of
up to 20 percent can be approved by the CMD of the REC based on the mer-
its of the case, but larger changes can only be approved by a Ministry of Power
committee.
• The RGGVY’s provision of free connections only to households below the poverty
line. In many states households above the poverty line have protested the focuson households below the line. Some have not consented to extending the elec-
tricity network across land they own, and some have obtained legal injunctions
against projects on grounds of economic discrimination. At a minimum these
issues cause long delays in project implementation. To avoid such problems
some states (for example, Andhra Pradesh, Jharkhand, Tamil Nadu, and West
Bengal) have extended free connections, at their own cost, to households
above the poverty line ineligible for RGGVY funds.
Once lines are transferred to utilities, consumers pay the tariffs set by theSERC. But the tariffs paid by customers connected to the grid typically do not
cover the full cost of rural supply. Among 12 states studied in detail where a
cost-of-supply model was built, the average revenue billed to rural consumers
was 16–65 percent of the estimated cost of rural supply (figure 6.6a). Utility
executives have indicated that the revenues from supplying new consumers
below the poverty line are too low to cover even basic revenue-assurance activi-
ties such as billing and revenue collection. Most consumers below the poverty
line are thus charged estimated rates, even though they have meters.
In these 12 states the loss to utilities from supplying rural consumers averages
around Rs 3.6/kWh ($0.08), ranging from Rs 1.9 ($0.04) in West Bengal toRs 7.5 ($0.16) in Bihar. The total burden from serving rural consumers in 2010
was just under Rs 200 billion ($4.4 billion) across the 12 states.16 Losses ranged
8/20/2019 WB - India Discom Report - Feb15
http://slidepdf.com/reader/full/wb-india-discom-report-feb15 150/255
126 The Role of Governance and Institutional Factors
More Power to India • http://dx.doi.org/10.1596/978-1-4648-0233-1
from Rs 3.1 billion ($0.1 billion) in Uttarakhand to Rs 36 billion ($0.8 billion)
in Tamil Nadu (figure 6.6b). These losses placed a very heavy burden on the
distribution utilities’ finances, one often uncompensated by state government
subsidies, as cost of rural service delivery is very hard to estimate.
Restructured Accelerated Power Development and Reform Programme
The centrally sponsored R-APDRP aims to reduce aggregate technical andcommercial losses in selected urban areas.17 It requires participating utilities to
demonstrate performance improvements such as sustained loss reduction to
Figure 6.6 Financial Burden of Serving Rural Consumers, 2010
a. Revenues and costs
0
5
10
15
20
25
30
35
40
45
0
1
2
3
4
5
6
7
89
10
J h a r k h a
n d O r
i s s a
B i h a r
T a m i l N
a d u
U t t a r P
r a d e s h
A n d h r a P
r a d e s h
U t t a r a k h a
n d
G
u j a r a t
R a j a s t h
a n A s s a m
M a d h y a P
r a d e s h
W e s t B e
n g a l
P e r c e n t
R s p e r k i l o w a t t - h o u r
Revenue Cost Revenue as share of cost (Percent)
Source: Banerjee and others 2013.Note: $1 = Rs 45.70 in 2010.
b. Total losses
0
5
10
15
20
25
30
35
40
U t t a r
a k h a
n d A s s a m
J h a r k h a
n d
W e s t B e
n g a l
G u j a r
a t O r i s s
a
M a d h y a
P r a d
e s h
R a j a s
t h a n
A n d h
r a P r a
d e s h
B i h a r
U t t a r
P r a d
e s h
T a m i l N
a d u
R s b i l l i o n s
8/20/2019 WB - India Discom Report - Feb15
http://slidepdf.com/reader/full/wb-india-discom-report-feb15 151/255
The Role of Governance and Institutional Factors 127
More Power to India • http://dx.doi.org/10.1596/978-1-4648-0233-1
receive financial assistance. As this entails collecting accurate baseline data
and measuring performance, reliable and “no manual touch” systems need to
be established, and IT needs to be adopted for energy accounting, to ensure
data integrity. The R-APDRP provides support for both these aspects, recogniz-ing that they are preconditions for the success of distribution-strengthening
projects.
The R-APDRP has two parts. Part A includes support for preparing baseline
data for the project area through consumer indexing, Geographic Information
System (GIS) mapping, metering of distribution transformers and feeders, auto-
matic data logging for all distribution transformers and feeders, and supervisory
control and data acquisition and data management systems. It includes support
for mapping assets of the entire distribution network at and below the 11 kilovolt
(kV) transformers, such as distribution transformers and feeders, low-tension
lines, poles, and other distribution network equipment. It also covers adopting ITapplications for meter reading, billing and collection, energy accounting and
auditing, and redressal of consumer grievances. It supports the adoption of man-
agement information systems and establishment of IT-enabled consumer service
centers. After completion, the energy audit data are verified by an independent
agency appointed by the Ministry of Power.
Part B includes distribution-strengthening projects such as renovation, mod-
ernization, and strengthening of 11 kV substations and transformers/transformer
centers, reconductoring of lines at the 11 kV level and below, load bifurcation,
feeder separation, load balancing, installation of high-voltage distribution systems
(11 kV), use of aerial bunched conductors in densely populated areas, replace-ment of electromagnetic energy meters with tamper-proof electronic meters, and
installation of capacitor banks and mobile service centers.
Underpinning the R-APDRP are technical solutions designed to improve the
efficiency of distribution companies, adopted to different degrees by different
states. Solutions such as energy audits, asset mapping, and power procurement
planning have had limited take-up, while solutions such as metering of the dis-
tribution transformers, low-tension aerial bunched conductors, and spot billing
have been widely adopted (figure 6.7). Andhra Pradesh, Himachal Pradesh,
Delhi, Gujarat, Maharashtra, Madhya Pradesh, Karnataka, and West Bengal leadin these good practices.
If successfully implemented, the R-APDRP can transform utility operations
and service delivery mechanisms. But no state has completed Part A, though
some are in an advanced stage of execution. The key issues affecting implementa-
tion are:
• Change management. Implementing such a large IT-based program requires
widespread changes in the utility’s business processes because IT needs to be
integrated into commercial operations. A major issue is rollout without sensi-
tizing utilities about the extensive change management that needs to go handin hand with it. The organizational structure needs to be aligned to the new
IT-based systems. Very few utilities have addressed this aspect so far.
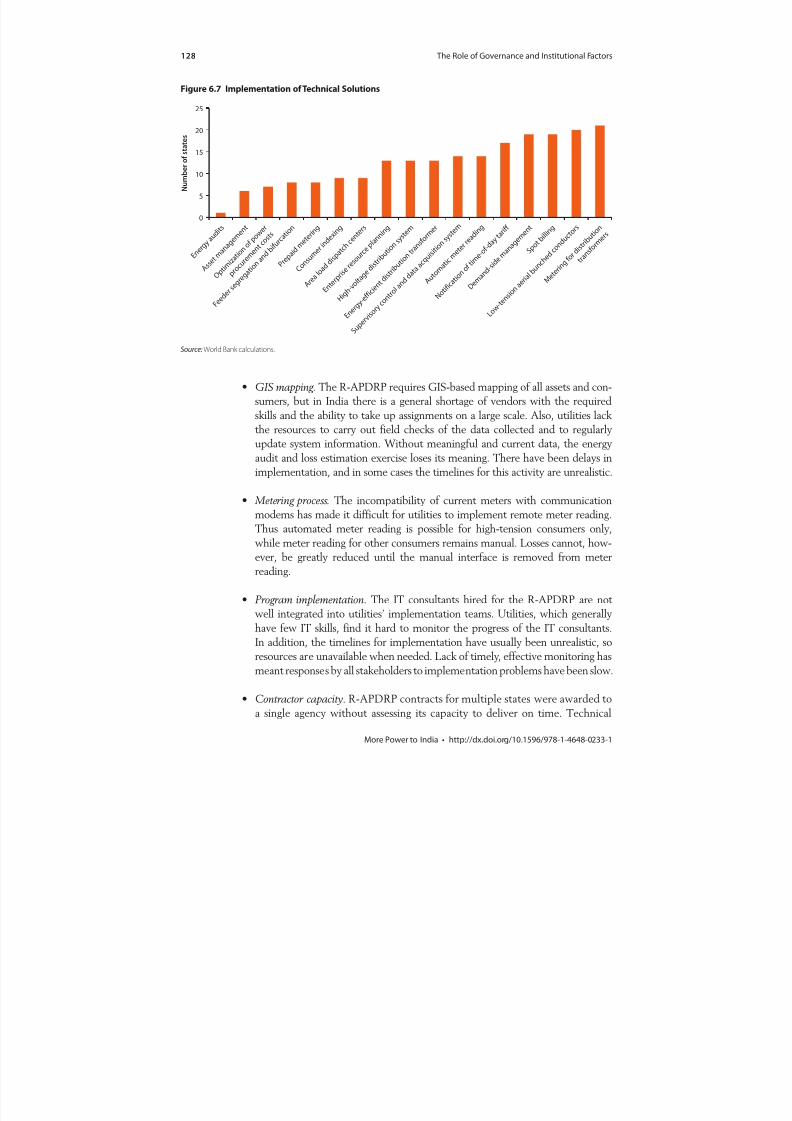
8/20/2019 WB - India Discom Report - Feb15
http://slidepdf.com/reader/full/wb-india-discom-report-feb15 152/255
128 The Role of Governance and Institutional Factors
More Power to India • http://dx.doi.org/10.1596/978-1-4648-0233-1
• GIS mapping. The R-APDRP requires GIS-based mapping of all assets and con-
sumers, but in India there is a general shortage of vendors with the required
skills and the ability to take up assignments on a large scale. Also, utilities lackthe resources to carry out field checks of the data collected and to regularly
update system information. Without meaningful and current data, the energy
audit and loss estimation exercise loses its meaning. There have been delays in
implementation, and in some cases the timelines for this activity are unrealistic.
• Metering process. The incompatibility of current meters with communication
modems has made it difficult for utilities to implement remote meter reading.
Thus automated meter reading is possible for high-tension consumers only,
while meter reading for other consumers remains manual. Losses cannot, how-ever, be greatly reduced until the manual interface is removed from meter
reading.
• Program implementation. The IT consultants hired for the R-APDRP are not
well integrated into utilities’ implementation teams. Utilities, which generally
have few IT skills, find it hard to monitor the progress of the IT consultants.
In addition, the timelines for implementation have usually been unrealistic, so
resources are unavailable when needed. Lack of timely, effective monitoring has
meant responses by all stakeholders to implementation problems have been slow.
• Contractor capacity. R-APDRP contracts for multiple states were awarded to
a single agency without assessing its capacity to deliver on time. Technical
Figure 6.7 Implementation of Technical Solutions
Source: World Bank calculations.
0
5
10
15
20
25
E n e r
g y a u d
i t s
A s s e
t m a n
a g e m
e n t
O p t i m
i z a t i o
n o f p o
w e r
p r o c
u r e m
e n t c
o s t s
F e e d
e r s e
g r e g a t i o
n a n d b i
f u r c
a t i o n
P r e p
a i d m e t
e r i n
g
C o n s
u m e r
i n d e
x i n g
A r e a l o
a d d i s p
a t c h
c e n t
e r s
E n t e
r p r i s e r
e s o u
r c e p l a n
n i n g
H i g h -
v o l t a g e
d i s t
r i b u t i o
n s y s t e
m
E n e r
g y - e f f i
c i e n t
d i s t r i b u
t i o n t r
a n s f o
r m e r
S u p e
r v i s o
r y c o
n t r o l a
n d d a t
a a c q u
i s i t i o
n s y s t e
m
A u t o m
a t i c
m e t
e r r e a d
i n g
N o t i f
i c a t i o n
o f t i m
e - o f
- d a y
t a r i f f
D e m a n d
- s i d e
m a n
a g e m
e n t
S p o t
b i l l i n
g
L o w -
t e n s
i o n a e
r i a l b u n
c h e d
c o n d
u c t o
r s
M e t e r i n
g f o r
d i s t r
i b u t i o
n
t r a n s
f o r m
e r s
N u m b e r o f s t a t e s
8/20/2019 WB - India Discom Report - Feb15
http://slidepdf.com/reader/full/wb-india-discom-report-feb15 153/255
The Role of Governance and Institutional Factors 129
More Power to India • http://dx.doi.org/10.1596/978-1-4648-0233-1
criteria were not sufficiently specific on bidder capacity, and financial bids did
not always cover all items, affecting the quality of implementation.
Metering and the use of technology have immense potential to improve effi-
ciency even in rural areas, as seen in Haryana, where innovative approaches are
being piloted (box 6.5).
Box 6.5 Impact of Metering on Operational and Financial Efficiency in
Rural Haryana
A program for demand-side management and loss reduction was initiated as a pilot in the
Singhran and Chirod villages of Haryana in December 2012. Given sociopolitical sensitivities
on charging for power in rural Haryana, the utility, Dakshin Haryana Bijli Vitran Nigam, startedits loss-reduction drive with a pilot in an area that enjoys political support for power reforms.
Under this program all consumers are provided high-quality and almost uninterrupted supply
against 100 percent payments for energy consumed. The infrastructure in these villages was
strengthened, and insulated overhead conductors were provided to prevent unauthorized
wire-tapping. All consumers have been metered, with meters installed outside the consumers’
premises in meter pillar boxes. Consumers can view the meter display through a glass cover in
real time, motivating them to be more energy efficient. Consumer indexing was also carried
out, making transformer-wise energy audits possible.
Since the pilot began, energy input has declined 43 percent while billed units have risen 98
percent, collection efficiency has improved 26 percent, and aggregate technical and commer-
cial losses have dropped from 77 percent to 26 percent. The utility managed this at an average
cost of only Rs 5,560 ($104) per consumer. No capital expenditure was involved because there
was no need for more distribution transformers, conductors, or cables. In fact, the number of
distribution transformers required and the transformer damage rate fell, due to a decline in over-
loading as consumption came down. Some 165 new consumers were added to the utility rolls
(table B6.5.1). The combination of reduced theft (which improved utility finances) and better
demand management has allowed the utility to increase supply from 11 hours a day to 22 hours.
Table B6.5.1 Savings Achieved by Pilot Project in Singhran and Chirod Villages
Pilot project indicator
Saving
achieved
Number of consumers before pilot project 583
Number of consumers after pilot project 748
Average daily consumption before pilot project on 11 kilovolt Chirod feeder, January 2013 (kilowatt-hours) 6,000
Average daily consumption after pilot project on 11 kilovolt Chirod feeder, March 1–11, 2013 (kilowatt-hours) 3,254
Reduction in average daily energy consumption after installation of pillar boxes (kilowatt-hours) 2,746
Monthly savings (Rs millions [$])a 0.18 (3,370)
Approximate project cost for the pilot project (Rs millions [$ million]) 4.16 (0.08)
Estimated payback period (months) 23
a. The savings are calculated conservatively at the applicable energy charge per unit for the lowest tariff slab for domestic supply, which is 0–40 units.
8/20/2019 WB - India Discom Report - Feb15
http://slidepdf.com/reader/full/wb-india-discom-report-feb15 154/255
130 The Role of Governance and Institutional Factors
More Power to India • http://dx.doi.org/10.1596/978-1-4648-0233-1
Notes
1. External accountability covers features of the relationship between the government (as owner), the regulator, or the public, and the utility represented by its board; internal
accountability refers to the relationship between the board and management. 2. The Act has basic provisions on board size and meeting frequency; the total number
of directorships any director can hold and the remuneration directors may receive; the constitution and composition of an audit committee; and guidelines for preparing annual reports, financial statements, and audited account statements.
3. The sample comprises 37 distribution companies, 15 transmission companies, 15 generation companies, 1 corporation, and 1 holding company.
4. The 14 states were selected to ensure a range of locations and sizes. Utilities within these states were selected to include at least one distribution company and at most one other utility. Within that, selection was based on ease of access to senior manage-
ment and likelihood of data availability. These decisions were all made in view of the difficulty and time-intensity of obtaining corporate governance data.
5. The Listing Agreement (Clause 49) of the Securities and Exchange Board of India lays out corporate governance requirements for companies listed on the stock market, which are more or less identical to those of the DPE.
6. In addition to the basic indicators listed in table 6.1, the “detailed” index includes indicators on internal processes and the relationship with the government—in par-ticular, the existence of other specialized board committees, having an independent director heading the audit committee, preparing annual accounts on time, having an average CMD tenure of at least three years, lack of government influence over routine and recruitment decisions, existence of enterprise resource planning or an advanced
management information system, use of performance-linked incentives, consideration of merit in promotion decisions, and existence of a clearly defined employee training policy.
7. While deeper analysis of the political economy of change would be required to come to a definitive conclusion, it is instructive that the initial impetus for change in these three states (including the privatization of distribution in Delhi) appears to have come from the government and political leadership. In all three cases the fiscal burden of a poorly performing power sector and consumer unhappiness with constant power cuts seems to have created the political will to take steps to not only improve the situation but also turn the sector into a source of comparative advantage for the state.
8. Running the regression with 2011 utility financial performance as the dependent vari-able, the coefficient on executive directors remains negative and significant, but the coefficient on independent directors loses significance, though it remains positive.
9. Prior to the establishment of independent regulators, the state governments were responsible for fixing electricity tariffs for their SEBs.
10. Other papers on regulatory governance have followed similar strategies for bench-marking regulators. For example, see Andres and others (2007). Similarly, the Electricity Governance Initiative has created a toolkit for assessing regulators, bench-marking best practice, and promoting accountability among electricity governance bodies; see Dixit and others (2007).
11. Suo motu describes an act of authority taken without formal prompting from another party. The term is usually applied to actions by a judge taken without a prior motion or request from the parties.
8/20/2019 WB - India Discom Report - Feb15
http://slidepdf.com/reader/full/wb-india-discom-report-feb15 155/255
The Role of Governance and Institutional Factors 131
More Power to India • http://dx.doi.org/10.1596/978-1-4648-0233-1
12. The results are robust across performance data from 2010 to 2011. See Pargal and Mayer (2013) for details.
13. For their part, discoms are often unable to reduce losses according to the schedule agreed with the regulator. But the estimation of transmission and distribution losses is not transparent, so there is often disagreement over this amount.
14. Borrowing against regulatory assets is becoming less feasible: since commercial banks are not sure how to value regulatory assets that may or may not be worth their face value, discoms can no longer borrow up to the full amount of the regulatory assets they own.
15. Actual cost is estimated by calculating the cost per new connection released thus far (money disbursed divided by number of connections released) and multiplying that by the total expected number of connections.
16. This loss figure is estimated as the product of the total number of rural consumers and the gap between average revenue and average cost.
17. Urban areas with a population of more than 30,000 except in the hilly and North-Eastern regions, where towns with a population of more than 10,000 are covered.
Bibliography
Andres, Luis, Jose L. Guasch, Makhtar Diop, and Sebastian L. Azumendi. 2007. Assessingthe Governance of Electricity Regulatory Agencies in the Latin American and theCaribbean Region: A Benchmarking Analysis. Washington, DC: World Bank.
Appellate Tribunal for Electricity. 2011. Appeal No.143 of 2011. New Delhi: Governmentof India.
Banerjee, Sudeshna G., Doug Barnes, Bipul Singh, Kristy Mayer, and Hussain Samad.2013. “Power for All: Electricity Access Challenge in India.” Background paper for thisreport. World Bank, Washington, DC.
Berg, Sanford V. 2013. Best Practices in Regulating State-Owned and Municipal WaterUtilities. Economic Commission for Latin America and the Caribbean ProjectDocument. Santiago: United Nations.
Dixit, Shantanu, Navroz K. Dubash, Crescencia Maurer, and Smita Nakhooda. 2007. Benchmarking Best Practice and Promoting Accountability in the Electricity Sector .Electricity Governance Initiative. World Resources Institute, Washington, D.C.
Khurana, Mani, and Sudeshna G. Banerjee. 2013. “Beyond Crisis: Financial and
Operational Performance of India’s Power Sector.” Background paper for this report. World Bank, Washington, DC.
Pargal, Sheoli, and Kristy Mayer. 2013. “Governance of Indian Power Sector Utilities: AnOngoing Journey.” Background paper for this report. World Bank, Washington, DC.
PFC (Power Finance Corporation). 2010. The Performance of State Power Utilities for theYears 2006–07 to 2008–09. New Delhi.
———. 2011. The Performance of State Power Utilities for the Years 2007–08 to 2009–10.New Delhi.
———. 2012. The Performance of State Power Utilities for the Years 2008–09 to 2010–11.New Delhi.
Planning Commission. 2011. Financial Position of Distribution Utilities. New Delhi:Government of India.

8/20/2019 WB - India Discom Report - Feb15
http://slidepdf.com/reader/full/wb-india-discom-report-feb15 156/255
132 The Role of Governance and Institutional Factors
More Power to India • http://dx.doi.org/10.1596/978-1-4648-0233-1
Prayas Energy Group. 2003. A Good Beginning but Challenges Galore. Pune, India: PrayasEnergy Group.
Shah, Tushaar, Madhavi Mehta, Gopi Sankar, and Shankar Mondal. 2012. “OrganizationalReform in Gujarat’s Electricity Utility: Lessons for Revitalizing a Bureaucratic ServiceDelivery Agency.” Water Policy Research Highlight 6, IWMI-Tata Water PolicyProgram, Gujarat, India.
Tongia, Rahul. 2003. “The Political Economy of Indian Power Sector Reforms.” Programon Energy and Sustainable Development Working Paper, Stanford University,Stanford, CA.

8/20/2019 WB - India Discom Report - Feb15
http://slidepdf.com/reader/full/wb-india-discom-report-feb15 157/255
133More Power to India • http://dx.doi.org/10.1596/978-1-4648-0233-1
Moving Toward Efficient and
Effective Service Delivery
This review has shown that multiple stakeholders play a role in improving sector
performance. Moreover, there are inefficiencies at each level of the sector value
chain that, if minimized, could generate considerable cost savings to be passed on
to final consumers, either in improved service or lower tariffs, as Chile managed
to do (see appendix K). This would also reduce the burden on the exchequer and
increase the competitiveness of India’s economy.
Both central and state governments have an important stake in creating a
robust operating environment, while staying out of the day-to-day business of
utility operations. The central government particularly may need to fine-tune the
design and execution of its flagship programs so that the envisaged benefits are
actually realized. And it may need to coordinate grants from multiple pro-
grams to create a larger “carrot” that can only be earned by consistently good
performers.
Lenders and regulators represent other groups of important stakeholders.
Lenders who have been allocating money to the power sector without adequate
due diligence need to be more discerning. Regulators need to fulfill their man-
dates in a transparent and accountable fashion—their role in supporting the sec-
tor on its path to financial recovery and commercial viability is critical.Finally, the sector needs to be monitored regularly so that timely action can
be taken to address problems. So far, poor quality and paucity of critical data
have handicapped management and oversight.1 The sector is still a long way from
taking data collection seriously, which it needs to do to present relevant informa-
tion to the public, make informed decisions, and ultimately create a clear sense
of accountability among managers.
The main conclusions flowing from the review and suggestions for action are
presented below.
C H A P T E R 7
8/20/2019 WB - India Discom Report - Feb15
http://slidepdf.com/reader/full/wb-india-discom-report-feb15 158/255
134 Moving Toward Efficient and Effective Service Delivery
More Power to India • http://dx.doi.org/10.1596/978-1-4648-0233-1
Align Stakeholder Incentives
The central government’s grant-funded programs should be used to induce better performance in the distribution segment. The large centrally sponsored programs—
the Rajiv Gandhi Grameen Vidyutikaran Yojana (RGGVY) and the RestructuredAccelerated Power Development and Reform Programme (R-APDRP)—can
promote responsible behavior by utilities and state governments if disbursements
are tied to utilities demonstrably achieving financial and operational perfor-
mance targets.2
Ratings of utilities should be consistently used in lending decisions. The Power
Finance Corporation’s (PFC) and Rural Electrification Corporation’s (REC) con-
sistent use of the ratings recently developed by the Ministry of Power (2013) as
a core input in their lending decisions holds promise. Since the PFC and REC are
the leading lenders to the sector, using these or similar ratings would send a clear
signal of the need to achieve and maintain strong financial and operational
performance.
State governments could encourage responsible action by lenders and utilities. They can offer guarantees for utility borrowing that are contingent on prior,
publicly announced actions to be taken by the utilities. Guarantees can be a
powerful inducement for lenders to push utilities to meet key financial and
operational performance targets. They also directly create an incentive for utili-
ties to comply because obtaining a guarantee would increase their access to
funds, as well as lowering the cost of any funds made available.
State governments ought to be held accountable for sector performance. Stategovernments have not always endorsed proposals by utilities to file for tariff
revisions and at times have not even permitted regulators to increase tariffs
(even using section 108 of the Electricity Act of 2003 to this end). State inter-
vention has frequently hurt the continuity of top utility management. States also
need to be held responsible for making timely and complete subsidy payments
as restitution to the utility, when they mandate below-cost supply of power to
specific consumer groups on social or political grounds. The central govern-
ment’s budgetary transfer to the state could be a potential source for making up
the shortfall if the state government does not make the payments due. Another
approach to enhance state government accountability is to encourage publicannouncement (on the web, in the news media, and so forth) of the state gov-
ernment’s sector performance targets and promote regular monitoring of their
achievement by civil society organizations, think-tanks, and the like.
Strengthen Regulatory Governance and Processes
The autonomy of regulators is essential to their ability to fully implement theirmandates. Widespread concerns about the objectivity of decisions and auton-
omy of decision making arise from the “revolving door” among the regulator,utility, and government that is one result of the narrow pool of qualified staff
in the sector. An option would be to establish a common pool of technically
8/20/2019 WB - India Discom Report - Feb15
http://slidepdf.com/reader/full/wb-india-discom-report-feb15 159/255
Moving Toward Efficient and Effective Service Delivery 135
More Power to India • http://dx.doi.org/10.1596/978-1-4648-0233-1
specialized regulatory staff that could work across states and regulatory com-
missions. It could be a permanent national cadre of staff, possibly under the
aegis of the Forum of Regulators (FoR). Financial autonomy of regulatory agen-
cies could also be enhanced by charging regulatory expenses to the state’sconsolidated fund so that the state electricity regulatory commission (SERC)
has a dedicated source of funding, independent of the state budgetary process.
Perhaps most critically, safeguards need to be developed against the misuse of
section 108 of the Electricity Act of 2003, which permits states to “direct” the
SERCs in matters of public interest. While this provision was apparently
intended to provide a check on “rogue” regulators, it has in practice been
employed to clip the wings of the SERC. A possible option is for the Appellate
Tribunal (ApTel) to be the arbiter of whether a specific government directive
is in the public interest (and to define the public interest).
The SERCs need to develop greater technical capacity to design and implementregulations, monitor compliance, and penalize noncompliance.3 Such capacity can
be brought in by expert consultants, or developed through twinning arrange-
ments across compatible states, possibly with the assistance and guidance of the
Central Electricity Regulatory Commission (CERC). The CERC could, on
behalf of the FoR, help SERCs identify lacunae to be filled, and help them com-
petitively select professional technical advisory consultants to undertake the
studies required (such as cost of service, or research to determine cross-subsidy
and other charges) and to provide their staff with training and support. Funding
needs to be ensured so that regulators have adequate numbers of appropriately
trained professional staff, and access to training, research (possibly in partnershipwith the CERC or under the FoR to ensure economies of scale), and expertise
in key disciplines such as law, economics, finance, and regulation.
Regional regulators can promote regulatory independence. The limited ability of
the SERCs to penalize state-owned utilities (Berg 2013) and overcome state-
level political considerations points to the need to review the regulatory model
and adjust it if necessary. Potential structural solutions that narrow the scope for
state governments to intervene in regulatory matters include replacing the
28 SERCs with four or five regional regulators, which would be responsible for
regulating the sector in a group of states, thus increasing the distance betweenthe regulator and the utilities and state government and also slowing the revolv-
ing door. Fewer regulators would also require fewer technically qualified staff
and would likely be less handicapped by the prevailing shortage of trained
personnel.
The regulator’s credibility and effectiveness can be enhanced by increasing trans- parency in the regulatory process. This would entail holding open hearings, with
agendas and minutes of the proceedings published in a timely fashion; inviting
and publishing comments on regulatory proposals in local languages; and mak-
ing all decisions and each step in key processes public.4 Transparency also
involves publishing studies (such as results of customer satisfaction surveys)and holding open meetings to discuss their findings. Finally, the regulator must
publish its budget and accounts on the web on time.

8/20/2019 WB - India Discom Report - Feb15
http://slidepdf.com/reader/full/wb-india-discom-report-feb15 160/255
136 Moving Toward Efficient and Effective Service Delivery
More Power to India • http://dx.doi.org/10.1596/978-1-4648-0233-1
Robust mechanisms to promote accountability of regulators should be developed.Given the general lack of involvement of state legislatures, consideration could
be given to alternatives such as reporting every six months, possibly through the
FoR, to a standing Parliamentary Committee. The CERC through the FoR mayneed to consult broadly and develop a set of options to increase accountability.
One suggestion is for periodic performance monitoring and evaluation of regula-
tors by the ApTel and publication of the results.
Implement Key Regulatory Mandates
Retail tariffs should not be allowed to pass through upstream inefficiencies to the final consumer. They should take account of service quality and the appropriate-
ness of power purchase costs.5 Regular cost of supply and cost of service studies
(that account for variations in geography, population density, and the like) needto be commissioned and performance tracking needs to be undertaken to feed
into tariff determination so that tariff increases are linked to efficiency
improvements; tariff orders should cite these studies as the bases for tariff
determination.6 As underlined by the Shunglu report (Planning Commission
2011), suo motu revision of tariffs is within the regulators’ power and must be
undertaken if utilities do not put forward the necessary petitions on time.
Related to this are “regulatory assets,” which have been permitted to reach
unsustainable levels (Rs 700 billion [$15 billion] nationwide with annual inter-
est costs of around Rs 95 billion [$2 billion]).7 Not only must such a buildup
not be permitted again, but an immediate solution also needs to be found tothe problem of receivables, which cannot reasonably be expected to be dis-
solved within three years, as mandated by the ApTel, because the tariff
increases required would be unacceptably high.8
Standards of performance need to be clearly specified, measured, and made public. Data on basic measures of service quality (outages by circle, distribution trans-
former failure rates, and system average interruption duration and frequency)
need to be made public and regularly updated by the SERCs, as should data on
penalties imposed and the reasons for imposition. Utilities can be mandated to
implement (through third parties) consumer satisfaction surveys and to providethe results to the SERCs and the public.
Regulators can create incentives for performance improvement by benchmarkingutilities against each other. The FoR can publish annual utility-wise achievements
(“league tables”) on standards of performance, operational indicators, service
quality, and so on. It can also help states learn from each other, for instance,
through an annual conference of utilities and SERCs to showcase successes and
share experiences. The Ministry of Power might itself consider establishing a
virtual platform for utility cooperation (something for utilities that is similar to
the FoR for the SERCs).
Regulators need to determine the charges required for implementing open access.They need to take the initiative in putting in place the preconditions (such as
wheeling and transmission charges and the cross-subsidy surcharge, a path for

8/20/2019 WB - India Discom Report - Feb15
http://slidepdf.com/reader/full/wb-india-discom-report-feb15 161/255
Moving Toward Efficient and Effective Service Delivery 137
More Power to India • http://dx.doi.org/10.1596/978-1-4648-0233-1
cross-subsidy reductions, and so forth) for open access to both transmission and
distribution. The market for merchant sales has collapsed, and open access to
distribution is needed if it is to contribute to balancing demand and supply of
power. Open access and available evacuation capacity are also necessary to per-mit third-party sales to compensate generation companies if distribution compa-
nies (discoms) fail to honor their power purchase agreements (PPAs).
International experience with retail competition, through the separation of“carriage” and “content,” needs to be considered when implementing retail competi-tion. It is advisable to pilot this separation to ensure that the institutional precon-
ditions for successful implementation can be met.9 A major cautionary note on
separation of carriage and content is the need for appropriate institutional capac-
ity at the state level to incentivize the state discom (the carriage provider) to
invest in reducing aggregate technical and commercial losses and strengthening
wires systems (see appendix L).10 Also, in a situation of bulk power shortage, itwill be difficult for new content providers or retailers to source adequate reliable
power and enter the market to compete with incumbent suppliers.
Improve Corporate Governance of State Utilities
Compliance with the guidelines on corporate governance issued by the Department ofPublic Enterprises (DPE) can help insulate utility operations from state interference. Empirical analysis underlines the potential benefits from professionalizing and
empowering utility boards, reducing the number of executive directors, and
bringing in more independent directors, as prescribed in current guidelines forcorporate governance of central public sector undertakings issued by the DPE.
The central government should consider requiring state utilities to comply with
these guidelines. Further, independent directors should be appointed by a com-
mittee that includes entities such as the Central Electricity Authority (CEA) or
other representatives of the public interest to avoid capture by the state govern-
ment. Beyond that, an arm’s-length relationship between the government and
the utility can be institutionalized more easily if utility articles of association
specify clear limits on the role of the government. The stock market can be an
effective monitoring and enforcement mechanism for governance of listed com-panies. One option is to mandate that utilities comply with listing requirements
(“shadow” listing) as a precondition for central or other support, as was done in
West Bengal to good effect. This can bring greater accountability to utility boards,
while also restricting state interference.
Complete financial and operational unbundling is important to improve theaccountability of each unit in the value chain.11 This can help identify where ineffi-
ciencies or performance shortfalls occur and, by increasing accountability, improve
incentives for performance. Full vertical unbundling with separation of accounts,
staff, and decision making is also a necessary step toward competition in supply.
Since unbundling on its own will not lead to commercialization, it is also importantto consider other ways of bringing in efficiencies, such as divesting an ownership
share to central public sector undertakings like the National Thermal Power
8/20/2019 WB - India Discom Report - Feb15
http://slidepdf.com/reader/full/wb-india-discom-report-feb15 162/255
138 Moving Toward Efficient and Effective Service Delivery
More Power to India • http://dx.doi.org/10.1596/978-1-4648-0233-1
Corporation (NTPC) or the Power Grid Corporation of India (PGCIL), which are
recognized for strong results and which, as equity owners, might have both an
interest in pushing for better performance and the ability to do so.
Incentives for utility performance can be strengthened by using memorandums ofunderstanding (MoUs), following the practice of central public sector undertakings.MoUs on performance between the utility and the state government (owner)
with clear consequences for not reaching targets (loss of performance bonuses for
managers, no contingent guarantees, and so forth) can be effective if they go
beyond lip-service on requirements (they “bite”), are made publicly available, and
are subject to transparent monitoring by third parties.
Promote Responsible Lending to the Sector
Loan disbursements need to be linked to performance and creditworthiness. Themajor lenders to the sector are the government-owned financial institutions, the
PFC and REC. Lacking the profit orientation of commercial lenders, they may
not have adequate incentives to push utilities to improve financial performance.
By encouraging the PFC and REC to consider in their lending decisions the
recently developed rating of utility performance, the Ministry of Power can move
the sector toward more robust assessments of creditworthiness than merely rely-
ing on implicit and explicit government guarantees. An additional step is for
financial restructuring plans to require disbursement of funds from financial
institutions, banks, or government to be linked to a few key performance mea-
sures that would be specified up front.Lenders need to be penalized for inadequate due diligence. The expectation that
the state government would backstop loans to its utilities has historically led to
relatively profligate (or politically directed) lending to the sector by private and
public sector banks, with little concern for the creditworthiness of the discom as
the ultimate power offtaker. In many cases sector exposure limits have been
reached, with several banks exposed beyond their net worth. Incentives will be
aligned only if lenders are not bailed out when they have made poor decisions.
At the same time lenders need to be empowered to resist political pressure to
lend and should have step-in rights to bring in new management when there is adefault or noncompliance with financial covenants. A possible way of side-
stepping political pressure would be to adapt the United Kingdom’s system of
“warehousing of shares” in which management control of the utility is diluted by
bringing in a neutral third party (such as a law firm) to represent the public
interest on the utility’s board and to push management to improve
performance.
Ensure Availability of High-Quality, Updated Data
Data need to be collected and updated regularly for decision making. Sector moni-toring can only be as good as the data on which it is based, but reliable data
consistent over time are not there. This hampers planning, decision making,

8/20/2019 WB - India Discom Report - Feb15
http://slidepdf.com/reader/full/wb-india-discom-report-feb15 163/255
Moving Toward Efficient and Effective Service Delivery 139
More Power to India • http://dx.doi.org/10.1596/978-1-4648-0233-1
implementation monitoring, and compliance enforcement, hurting all players
and both internal accountability (for example, of utility management to its board
and owners) and external accountability (for example, of the utility, government,
regulators, and consumers and civil society to each other). Operational and tech-nical, financial, and service delivery data need to be regularly and systematically
collected with a view to using them for decision making, performance monitor-
ing, trend analysis, and planning.12 The central government could introduce a
statutory requirement for regular primary data collection by utilities, with the
effort being appropriately budgeted so that data can be professionally collected,
vetted, and maintained. Data also need to be updated regularly. Whistleblower
protection should be provided to utility staff who point out irregularities. And
incentives should be provided for ideas on how to prevent “cooking” of data. It is
essential that data and analysis be made public, not only to permit stakeholders
(including civil society) to use them, but also as a quality check as this permitsinformation vetting.
Feedback loops are essential to incentivize regularly collecting and updating data. Performance targets should be published up front and achievements regularly
tracked and made publicly known. Incentive schemes should rely on progress in
achieving targets (similar to R-APDRP) including levels of customer satisfaction,
with third-party monitoring. Regulators should also systematically use data for
performance benchmarking and encourage their use by researchers and academ-
ics, which would create another constituency for collecting high-quality data. At
a more macro level, data can be used for specialized tracking of policy implemen-
tation, and repeated surveys can help policy makers identify trends and monitorsector developments.13 Further, data on compliance with commitments (such as
timeliness and completeness of subsidy payments, and payment of own bills) by
state governments should be published to permit civil society to hold them
accountable. Most important, data need to be made available in a user-friendly
format, including on the regulatory commissions’ websites, in newspapers, and in
other media channels.
Reinvigorate Planning and Coordination Mechanisms
Planning needs to be strengthened. Key concerns that emerged from this review
relate to systemwide planning and coordination of generation and transmission
investments; the overall strategy for private involvement in transmission; the real-
ism of the government’s fuel availability assessments; the general absence of
power procurement planning by utilities; and the need for sharing good practices.
The delicensing of generation and decentralization of decision making after
unbundling raise concerns about appropriate sequencing and coordination of
investment in generation and transmission, ensuring adequate transmission
capacity, and whether the CEA’s role in leading network planning at the central
level and in coordinating with states must be strengthened. This has becomemore important with the entry of more private investors to the sector, especially
in generation. Private investment in off-grid solutions depends heavily on the
8/20/2019 WB - India Discom Report - Feb15
http://slidepdf.com/reader/full/wb-india-discom-report-feb15 164/255
140 Moving Toward Efficient and Effective Service Delivery
More Power to India • http://dx.doi.org/10.1596/978-1-4648-0233-1
timetable for extending the grid to unserved areas.14 In addition, there is a need
to bolster integration of renewable energy into the grid, and to plan for its
evacuation.
Coal India’s performance to support the power sector needs to be reviewed andmonitored. Its monopoly on coal production and sales in the country, coupled
with its inefficiency, has led to consistent shortfalls in coal availability compared
with official estimates over the past two plan periods (2002–07 and 2007–12).
Considerable investment in thermal power plants, with PPAs based on the
projected availability of cheap, domestic coal, is now likely to remain stranded.
Inadequate diversification of fuels and development of reliable fuel sources could
even put at risk the country’s energy security. The government’s role in facilitat-
ing bulk procurement of fuel from abroad and in resolving uncertainty over
domestic availability and prices of coal and gas, issues related to the structure,
management, and productivity of these industries, needs further debate.The CEA can act as the knowledge repository for the power sector. The CEA’s role
was reduced when the sector opened up. For example, the need for technical
clearance from the CEA was done away with, along with the requirement
for generation licensing. It may be time to bring back the technical and coordina-
tion role of a highly specialized agency such as the CEA. It can ensure dissemina-
tion of best practices across states on key issues like power procurement,
operation and maintenance practices, loss reduction, and new technologies, while
also helping build capacity in state power departments and utilities for compre-
hensive assessments and projections of demand and supply, contracting, and
portfolio planning. The CEA can also be used as a platform for sharingexperiences with innovations or new interventions like private participation in
generation, transmission and distribution, or rural feeder segregation.
Explore Different Models to Improve Distribution
Many approaches exist to attract private participation to distribution. India’s size
and diversity have created the opportunity to experiment with and learn from
different models of service provision, including private sector participation
through, for example, joint ventures (Delhi), franchising (Bhiwandi), and man-agement contracts. Key issues with attracting outside expertise and investment
for improving distribution are a lack of reliable information on asset quality
(including asymmetry of information in relation to the incumbent utility); very
different demand, needs, and ability-to-pay of rural and urban consumers who
are served by the same utility; long-lived assets that require heavy investment up
front; and sensitivity of government to potential for “extraordinary” profits being
earned by private investors leading to excessive conditionality (and reduced
interest by potential entrants in the newer franchises offered).
Potential approaches could thus consist of one or more of the following:
• Make provision for learning by doing, starting with management contracts or
franchises that permit the discovery of the true state of assets and that bring

8/20/2019 WB - India Discom Report - Feb15
http://slidepdf.com/reader/full/wb-india-discom-report-feb15 165/255
Moving Toward Efficient and Effective Service Delivery 141
More Power to India • http://dx.doi.org/10.1596/978-1-4648-0233-1
basic efficiencies to operations before specifying investment requirements
over the longer term.15
• Separate urban and rural areas and consider license, franchise, and public-
private partnership models16
only in urban areas, while letting state discomsremain responsible for rural supply (or separately contract out specific func-
tions, like revenue collection, to a rural franchisee) and assign low-cost public-
sector generation (such as NTPC PPAs) to them—the private urban operators
would be responsible for procuring power for their own consumers.
• Encourage urban franchisees to gradually expand their service to cover rural
areas (as through a series of concentric circles) so that learning consolidates
over time.
Variants of this basic approach could include permitting private entrants to
provide enhanced levels of service reliability for additional fees paid over thebasic, regulated tariff and specified service quality for which they are accountable.
Benefits from experimentation will be enhanced if benchmark competition is
encouraged in states with multiple discoms; criteria should include service qual-
ity and reliability, operational efficiency, and public satisfaction.
Promote Electrification in a Financially Responsible Manner throughDifferent Delivery Models
As India moves to electrify the remaining quarter of its population, it faces different
challenges from earlier phases. Ensuring the availability of reliable and affordablepower is important to bridge the gap between village electrification and house-
hold electrification and to maintain the access extension achieved to date. The
surge of new connections under the RGGVY consists of low-volume consumers
whose consumption is typically estimated and who are charged a tariff consider-
ably below cost—both elements likely to financially overwhelm utilities if not
prioritized for attention.
Rural service delivery will become viable only if discoms are compensated fully forsupplying power to such consumers. For this, the cost of service delivery needs to
be known, and the state needs to make up the shortfall in discom revenues fromsupplying rural consumers. Cost of service modeling and associated studies must
be undertaken, and funding needs to be allocated to this in the state budget.
While increasing rural loads will make it cost-effective to meter, bill, and collect
payments, technology innovations and rural collection franchisees can help
reduce the associated transaction costs.
A common agency for planning and monitoring grid and off-grid investments at thecentral level can promote coordination. Such an institution can lead the develop-
ment and regular update of state rural electrification plans as well as provide a
countrywide picture of the rollout of grid as well as off-grid investments.
Coordination would require more reliable information on people without elec-tricity living in villages with power (important for state utilities) and living in
villages without power (important for off-grid providers).
8/20/2019 WB - India Discom Report - Feb15
http://slidepdf.com/reader/full/wb-india-discom-report-feb15 166/255
142 Moving Toward Efficient and Effective Service Delivery
More Power to India • http://dx.doi.org/10.1596/978-1-4648-0233-1
Supporting productive uses is critical for aggregating the rural load and improvingthe commercial viability of rural service delivery. The experience of Indonesia and
Peru suggests that capacity building for productive uses of electricity in rural
areas has many benefits (see appendix M). It increases the productivity of ruralbusinesses (generating local income), enables a more efficient use of the supply
infrastructure, and increases the revenues of discoms, as these commercial con-
sumers can be expected to pay tariffs that cover the cost of service. Complementary
services for enhancing productive use include access to affordable microfinance
as well as to information and knowledge (such as education, training, business
development services, dissemination campaigns, and qualified human resources).
Households above the poverty line should be included in the ambit of ruralelectrification programs to enhance social cohesion and the sustainability of theaccess expansion achieved. In several states the exclusion of households above
the poverty line has caused problems such as illegal tapping of networks orconsent withheld for extending the network across land under their ownership.
In some cases legal injunctions have been obtained to prevent project discrimi-
nation on economic grounds. To avoid such issues some states (for example,
Andhra Pradesh, Tamil Nadu, Jharkhand, and West Bengal) have granted free
connections to households above the poverty line at their own expense, even
though they are ineligible for RGGVY funds.
Billing and collection systems in rural areas should be improved. Prepaid meters
could be used to reduce utilities’ commercial risks while also allowing rural
households to have more control over consumption. In fact, the pay-as-you-go
system is very familiar to rural users of mobile telephony prepaid cards. Otherinnovations, widespread in East Africa, allow rural consumers to make various
payments through their mobile phones (such as the M-Pesa system in Kenya).
India could try this arrangement to reduce transaction costs for all parties. It may
be beneficial for interested state utilities to explore management contracts with
private operators who can deploy prepaid metering technology.
Rationalizing domestic tariff structures will improve targeting and reduce the fiscalburden. An accurate system for identifying households below the poverty line
can better target delivery of subsidies to the poor. Until such a system is func-
tional, it would be useful to work toward rationalization of tariff structuresthrough volume-differentiated tariffs instead of incremental block tariffs. In
volume-differentiated tariffs, households are grouped by total monthly con-
sumption and each household in a given group pays the same (constant) tariff
for all the power it consumes. States with fairly low fiscal costs of subsidies
achieve this by limiting the subsidy, restricting how many households receive the
subsidy, and by charging a cross-subsidy to some households.
Notes
1. For instance, updated employment data are not available for all state utilities, making basic productivity comparisons difficult. Likewise, a lack of metering means that consumption cannot be accurately measured or billed.

8/20/2019 WB - India Discom Report - Feb15
http://slidepdf.com/reader/full/wb-india-discom-report-feb15 167/255
Moving Toward Efficient and Effective Service Delivery 143
More Power to India • http://dx.doi.org/10.1596/978-1-4648-0233-1
2. Payment release could be conditional on concurrence with the performance report by the lenders’ representatives on utilities’ boards.
3. Concerns have been raised about the information asymmetries between the CERC and the PGCIL, and how this may affect the CERC’s oversight of the transmission system and ability to provide a level playing field for potential entrants.
4. Webcasts of regulatory hearings would greatly enhance transparency and likely improve public information and participation.
5. Realistic efficiency targets for state-owned generation companies need to be set and monitored to encourage better use of capacity. This is especially important for sales to distribution utilities whose power purchase agreements are subject to cost-plus regulation.
6. Regulators should move to multiyear tariffs based on an agreed projected performancetrajectory (taking account of power procurement cost and generation performance, efficacy of capital expenditure, and reduction of distribution losses) to provide greater
certainty to utilities and to incentivize immediate efforts to increase efficiency.
7. See appendix J.
8. For the discoms in Delhi, which are majority privately owned, central government assistance through concessional lending or backstopping the issuance of bonds by the affected distribution companies may be the only way of buying enough time to resolve the issue.
9. The primary advantage of such separation is fixing accountability for reducing techni-cal losses. For the largest customers (1 megawatt and above) who contract directly with a generator, the benefit would be the disappearance of the cross-subsidy sur-charge currently levied by the discom, since the discom’s revenues would come from
wheeling charges for the use of its network. The global experience with separation, particularly in Europe, is that far fewer customers than anticipated switch from the incumbent retail supplier. Successful retail competition, as in New Zealand (see appendix L), highlights the importance of institutional support to allow customers to actually take advantage of the retail choices open to them. In the United States, by contrast, despite retail competition, if the generators’ market is distorted there is no long-term consumer benefit from switching retail suppliers. European studies also show that despite different levels of competition, retail tariffs for customers only decreased when retailers were able to buy cheaper power in bulk, and not due to the number of actors competing for end-customers.
10. This model, prevalent in Australia, the Netherlands, Nordic countries, and the United Kingdom, makes significant demands on system operators, regulators, and the like, as well as requiring adequate metering technology, functional unbundling of the system, and ways of managing the price volatility faced by consumers.
11. Separate distribution from transmission if the utility (state electricity board) is large enough to warrant this and if managerial capacity is not a constraint (the Electricity Act of 2003 mandates separation of generation from transmission).
12. Three priorities: financial data, with quality and coverage (variables collected) to be improved along with the adoption of standard accounting norms (or regulator- specified norms) and penalties for delays in finalizing and auditing accounts; opera-tional data, with enhanced frequency and collection of data from the field (currently
very limited), covering standards of performance and measures of reliability and quality, avoiding manual intervention in data collection, and randomly auditing the data collected; and state government commitments, such as subsidy payments.
8/20/2019 WB - India Discom Report - Feb15
http://slidepdf.com/reader/full/wb-india-discom-report-feb15 168/255
144 Moving Toward Efficient and Effective Service Delivery
More Power to India • http://dx.doi.org/10.1596/978-1-4648-0233-1
13. The Implementation of Reforms Index, the Sector Outcomes Index, and the Analytic Hierarchy Process Index illustrate the potential options that can be considered (see chapters 4 and 5).
14. Given limited state capacity, a central planning agency should assist the states in pre-paring their own rural electrification plans (clearly highlighting areas where provision of grid supply will not be possible or will be unviable), integrate these plans, and make this information widely available.
15. The incumbent franchisee has an information advantage when bidding for concessions or privatizing the utility (if that is envisaged in the next stage); appropriate mecha-nisms for capturing this knowledge or handling the information advantage will need to be developed. They should provide incentives for franchisee performance but also allow for an open competitive process.
16. The Delhi utilities are technically public-private partnerships as they are joint ventures between the government and the various licensees.
References
Berg, Sanford V. 2013. Best Practices in Regulating State-Owned and Municipal WaterUtilities. Economic Commission for Latin America and the Caribbean ProjectDocument. Santiago: United Nations.
Ministry of Power. 2013. State Distribution Utilities First Annual Integrated Rating .New Delhi.
Planning Commission. 2011. Financial Position of Distribution Utilities. Government ofIndia, New Delhi.
8/20/2019 WB - India Discom Report - Feb15
http://slidepdf.com/reader/full/wb-india-discom-report-feb15 169/255
145More Power to India • http://dx.doi.org/10.1596/978-1-4648-0233-1
Advantages of the Point of
Connection Method in Assessing
Transmission Charges
A postage stamp rate is a flat per kilowatt charge for network access within
a particular zone, based on average system costs. Postage stamp transmission
tariffs allocate total system costs to consumers on the basis of the ratio of load
share to energy share. A customer pays a transmission charge equal to the
total system cost, weighted by their consumption as a share of total consump-
tion. This method results in higher costs (above marginal costs) because it
incorporates historical fixed costs. It does not reflect marginal costs except in
a special hypothetical circumstance where all generators are at equal dis-
tances from load and where the load on each line in a network is equal. The
cost for transmitting power within the zone is independent of the transmis-
sion distance. A generator transmitting to a customer in a different zone
would have to pay postage stamp charges for the zone of origin and the zone
of delivery, and any intervening zones. This accumulation of zone access
charges is often called “pancaking.” Thus longer distances increase the likeli-
hood that more than one zone will be crossed, increasing the total transmis-
sion cost.Although postage stamp rates provide a way to recover the fixed costs of the
network, they provide no information about congestion. The main advantage of
using this method is that it is easy to administer. In conclusion, a postage stamp
tariff is most suitable when the area in consideration is relatively small, and when
flows are relatively simple and do not cause disproportionate load on any single
part of the system.
The genesis of the revised framework of the Central Electricity Regulatory
Commission for sharing transmission charges and losses lies in the National
Electricity Policy, which mandates that the national tariff framework imple-
mented should be sensitive to distance and direction, and related to quantum ofpower flow. The National Electricity Policy requires transmission charges to
A P P E N D I X A
8/20/2019 WB - India Discom Report - Feb15
http://slidepdf.com/reader/full/wb-india-discom-report-feb15 170/255
146 Advantages of the Point of Connection Method in Assessing Transmission Charges
More Power to India • http://dx.doi.org/10.1596/978-1-4648-0233-1
reflect network utilization—that is, they must address congestion and thus
improve efficiency and reduce cost for the end customer (the discom). Point of
connection (POC) tariffs are based on load flow analysis and capture utilization
of each network element by customers.The core principles of the POC methodology are as follows:
• The interstate transmission system (ISTS) is a single integrated “common-
use” national network for use by all designated interstate transmission
customers.
• All designated interstate transmission customers would have to pay relevant
charges to transmission providers depending on where they are placed in the
national network. For example, for generators close to a load center, the trans-
mission charges assessed would be relatively lower, and vice versa. Similarly,
demand centers near generation hubs would have relatively lower chargesallocated to them.
• Locational pricing establishes a merit order in which generators further away
pay more. This prevents any one-on-one transaction with the transmission
provider—like individual contracts—and instead provides a transparent pricing
mechanism.
Thus transaction management (including on the trading platforms) becomes
simpler and merit order is maintained.
Under this framework, any generator node is required to pay a single charge
based on its location in the grid to gain access to any customer anywhere inthe country. Similarly, any demand node will also be required to pay just one
charge to get access to any generator in the grid. This is based on load flow
studies conducted for each node, one at a time. The same principle holds for
transmission losses that a generator node or demand node has to bear. With
the implementation of the POC transmission pricing mechanism—where
transmission charges are differentiated by location—power generators will
have to take a view both on transmission costs of electricity and transportation
costs of fuel.
The new approach, apart from addressing network congestion, also greatly
facilitates fair and transparent competition for Case 1 bids. Under the previ-
ous methodology, Case 1 bid processes were severely distorted because of
pancaking, and this also resulted in pit-head/hydro plants not being competi-
tive for interregional bids. The impact of pancaking was further amplified in
such bid processes because of application of escalation factors to transmission
charges over a 25-year period. The new POC regulations also specify the
methodology for sharing transmission charges for the use of ISTS and trans-
mission losses in the ISTS, in accordance with the National Electricity Policy
and Tariff Policy.
Sources: CERC 2011; NLDC 2010.
8/20/2019 WB - India Discom Report - Feb15
http://slidepdf.com/reader/full/wb-india-discom-report-feb15 171/255
Advantages of the Point of Connection Method in Assessing Transmission Charges 147
More Power to India • http://dx.doi.org/10.1596/978-1-4648-0233-1
References
CERC (Central Electricity Regulatory Commission). 2011. Annual Report 2010–11.New Delhi.
NLDC (National Load Despatch Centre). 2010. Procedure for Computation of Point ofConnection (POC) Transmission Charges in Accordance with Central ElectricityRegulatory Commission Regulation, 2010. New Delhi.

8/20/2019 WB - India Discom Report - Feb15
http://slidepdf.com/reader/full/wb-india-discom-report-feb15 172/255
8/20/2019 WB - India Discom Report - Feb15
http://slidepdf.com/reader/full/wb-india-discom-report-feb15 173/255
149More Power to India • http://dx.doi.org/10.1596/978-1-4648-0233-1
Measures to Overcome Barriers in
Integrating Renewable Energy into
the Electricity Grid
Grid integration is the most common barrier to scaling up electricity generation
from renewable energy sources, for two key reasons: conventional transmission
lines are not designed to handle sudden spikes or drops in electric current that
are characteristic of variable, intermittent, and uncertain generation from renew-
able energy sources; and renewable energy sources are often in remote locations
with weak transmission networks that provide less grid support during system
disturbances and are usually not fault-ride-through capable.
To manage the variability of renewable energy in system operations, the
following strategies are effective (Madrigal and Porter 2013):
• Forecasting. As penetration of variable generation increases, appropriate fore-
casting methodology and modeling become essential to influence dispatch
operations at different time frames (days, hours, and tens of minutes ahead);
this minimizes fuel and short-term reserve needs. To have effective forecasting
in place, it is pertinent to define the responsibilities of renewable energy
providers in making forecasts or key inputs available.
• Subhourly markets. Shorter market clearing periods are necessary to incorpo-
rate updated variable generation forecasts. This also improves access to existing
generation units or other ancillary services (such as balancing). As long as fore-
casting influences dispatch, subhourly markets can help in managing the
impacts of generation variability.
• Shorter scheduling intervals. Submitting schedules closer to real time will allow
for more accurate forecasts of wind and solar generation. This requires strong
information and telecommunications systems, a well-structured process forlinking short-term operations with real-time dispatch, and discipline in main-
taining both of those on time. On the downside, shorter scheduling intervals
A P P E N D I X B
8/20/2019 WB - India Discom Report - Feb15
http://slidepdf.com/reader/full/wb-india-discom-report-feb15 174/255
150 Measures to Overcome Barriers in Integrating Renewable Energy into the Electricity Grid
More Power to India • http://dx.doi.org/10.1596/978-1-4648-0233-1
may lead to higher costs from the increased starting and stopping of conven-
tional power plants.
•
Consolidating balancing areas. Larger balancing areas (operational regions)improve both load diversity and the diversity of wind and solar generation,
reducing overall variability of renewable energy resources. This is especially
effective if variability in renewable energy resources in the different areas
within the operational region is complementary.
• Flexible resources. Higher amounts of variable generation require flexibility in
the generation system so that it can increase or decrease operations quickly
and over a wide operating range. Having a variety of generation and nonge-
neration sources (such as storage) can effectuate this.
• Grid codes. Grid codes define the performance requirements (mainly voltage
and frequency) of variable power generation, operational and dispatch rules,
and specifications for interconnected grid planning. It is critical that grid codes
be enforced and that appropriate tests be carried out strategically to ensure
that old and new technologies comply with the standards.
• Improving planning practices. Technical planning is required to ensure adequacy
of transmission and supply to meet supply security standards. Planning prac-
tices need to ensure that the contribution of renewable energy to supply
adequacy and cost implications is correctly assessed.
• Demand response and demand-side management. These are direct requests from
system operators or pricing strategies to change consumer demand. The natu-
ral progression of a demand response system is to fix any price distortions,
introduce time-differentiated tariffs, and implement other pricing interven-
tions to flatten peak demand (such as pricing overconsumption of reactive
power).
Five broad principles derived from international experiences that should bekept in mind when expanding transmission systems are listed below (Madrigal
and Stoft 2012):
• The additional cost of significant transmission expansion required by renew-
able energy sources is often offset by the incremental benefits of additional
renewable energy generation.
• Transmission should be developed proactively, with providers building
transmission with the intention of guiding efficient growth of the power
system—as opposed to the provider reacting to committed renewable energyprojects. Proactive planning will produce a more efficient outcome and result in
timely provision of transmission services. An intermediate step is to perform
8/20/2019 WB - India Discom Report - Feb15
http://slidepdf.com/reader/full/wb-india-discom-report-feb15 175/255
Measures to Overcome Barriers in Integrating Renewable Energy into the Electricity Grid 151
More Power to India • http://dx.doi.org/10.1596/978-1-4648-0233-1
anticipatory planning, in which transmission does not guide generation invest-
ment or intend to reach the best resources but rather attempts to build lines in
areas where generators are likely to be placed in the future.
• To maximize the net benefit of renewable energy resources, transmission lines
should be built as if the transmission planner had control over both the trans-
mission and generation investments—that is, by attempting to maximize the
joint net benefit of transmission and generation. Although planners are unlikely
to have direct control over generation, they can influence it by building and
then appropriately pricing transmission lines.
• Appropriate transmission pricing is necessary to send the right locational
signals to generators and to capture some locational rents (excess profits) for
consumers. The locational signals intend to provide pricing incentives fordeveloping the best combination of transmission and renewable energy
generation resources.
• Transmission companies should recoup all efficient costs to ensure their
sustainability. Any financial loss from allocating transmission to a generation
source (such as a source of renewable energy) which poses challenges to grid
operation should be compensated by a tariff that is fair and that causes minimal
distortion to electricity generation and use.
Sources: Madrigal and Porter 2013; Madrigal and Stoft 2012; PGCIL 2012.
References
Madrigal, Marcelino, and Kevin Porter. 2013. Operating and Planning Electricity Grids withVariable Renewable Generation: A Review of Emerging Lessons from Selected OperationalExperiences and Desktop Studies. Washington, DC: World Bank.
Madrigal, Marcelino, and Steven Stoft. 2012. Transmission Expansion for Renewable EnergyScale-Up: Emerging Lessons and Recommendations. Washington, DC: World Bank.
PGCIL (Power Grid Corporation of India Ltd). 2012. Report on Green Energy Corridors:
Transmission Plan for Envisaged Renewable Capacity. Gurgaon, India.

8/20/2019 WB - India Discom Report - Feb15
http://slidepdf.com/reader/full/wb-india-discom-report-feb15 176/255
8/20/2019 WB - India Discom Report - Feb15
http://slidepdf.com/reader/full/wb-india-discom-report-feb15 177/255
153More Power to India • http://dx.doi.org/10.1596/978-1-4648-0233-1
Considerations for Attracting
Private Investment in Hydropower
With a total potential of 148,700 megawatts (MW), hydropower is an important
option to address India’s energy shortages and limit the carbon intensity of its
power sector. It is a reliable source for meeting peaking power requirements, and
by diversifying the energy mix enhances energy security. However, India has
exploited only 24 percent of this potential at the current installed capacity of
around 35,000 MW. The share of hydropower in total power generation capacity
decreased from 44 percent in 1970 to about 19 percent by March 2012. In the
11th Five-Year Plan hydropower achieved only 35 percent of targeted capacity
addition,1 with shortfalls in performance across both the public and private
sectors.
Hydropower projects are subject to high risks stemming from the need for
massive capital investments, complex project development processes involving
coordination across multiple agencies, gestation periods that can extend to
10 years or more, poor or missing hydrological data and topographical sheets at
the award stage, land acquisition and resettlement issues that can lead to huge
delays in project preparation, and high construction risks and possibility of geo-
logical surprises—among other things. The need for environmental, forest, and
other clearances from government agencies also contributes to uncertainty andimplementation delays; for example, the majority of the 11th Plan hydropower
projects were delayed by more than three years.
A review of current and upcoming hydro projects indicates that a radical
change in the project portfolio is under way, with a move away from a public
sector–dominated capacity mix (93 percent of current installed capacity is
owned by states and the center) to private sector domination in the future
(around 64 percent of planned capacity). The policy implementation framework
for hydropower development in the country is in the process of adjusting to this
change. A key issue that has been raised is the fact that, after the award stage, as
approval and construction of the project begins, the involvement of governmententities diminishes. This, added to the long gap between project award and
A P P E N D I X C
8/20/2019 WB - India Discom Report - Feb15
http://slidepdf.com/reader/full/wb-india-discom-report-feb15 178/255
154 Considerations for Attracting Private Investment in Hydropower
More Power to India • http://dx.doi.org/10.1596/978-1-4648-0233-1
commissioning during which no revenues flow to the developer, increases the
difficulty of attracting private investors to the sector.
Given the current state of development, even if the entire planned hydropower
capacity comes online during the 12th Plan period, the share of hydropower willdecrease to 17 percent. To overcome this and support private sector participation
in hydropower, it will be important to address the following:
Ensure strong central and state leadership in project development implementation.Committed sponsorship and coordination among the central government and its
agencies is vital for removing bottlenecks. These measures should include sup-
port for completing preliminary studies and for preparing detailed project
reports, facilitating approvals and construction, and resolving disputes and diffi-
culties. In addition, project implementation can be facilitated by the develop-
ment of road infrastructure by the state government to allow transport of
construction equipment and ease access to project sites, and by the constructionof necessary evacuation lines by the state transmission company or the Power
Grid Corporation of India Ltd.
Support policy actions by creating effective institutional structures, which aid
development through the private sector and which facilitate time-bound actions.
For example: all critical clearances should be facilitated by the government ide-
ally through a single-window process, and requirements should be realistic; in
line with international practice, consents and clearances should be obtained
before the project is awarded. Ensure that allotted power projects cannot be
cancelled, as it leads to protracted litigation—instead, a system of penalties and
milestones such as in Himachal Pradesh should be implemented. Align the trans-mission development framework at the state level (as is the case at the interstate
level) with generation development.
Realign incentives to ensure close coordination between the host government
and the developer during the approval and construction phases. Some recom-
mendations are to reduce the upfront premium charged from successful bidders,
which is high in India compared with international benchmarks; to base project
allocation on robust and comprehensive detailed project reports and monitoring
systems; to adopt competitive bidding for awarding projects; and to establish an
effective dispute resolution mechanism.Ease financing through greater market certainty and risk sharing. An effective
risk–return sharing model is needed as a “one-size-fits-all” approach is unsuitable
for different states. The quality of documentation and studies provided to bidders
also needs to be improved. Long-term power purchase agreements for hydro-
power projects are also necessary to reduce risk exposure for the developer/
project. A separate market for hydro Case 1 needs to be considered and bid
documents should be designed specifically for hydro projects. In addition,
extending the existing cost-plus tariff regime beyond December 2015, in recog-
nition of the high degree of uncertainty in hydropower and the need for assured
returns, needs serious consideration.Ensure regulatory certainty for cost approvals and pricing, which is critical for
Indian and cross-border projects alike. Without confidence in the regulatory
8/20/2019 WB - India Discom Report - Feb15
http://slidepdf.com/reader/full/wb-india-discom-report-feb15 179/255
Considerations for Attracting Private Investment in Hydropower 155
More Power to India • http://dx.doi.org/10.1596/978-1-4648-0233-1
environment, applicable jurisdiction, and price, project financing is difficult.
A clear duty structure and licensing requirements are also necessary to encourage
international developers to participate in the Indian market. In addition, hydro-
bearing neighboring countries should also be considered as integral parts of theplanning process and permitted to participate in Case 1 bids and be financed by
Indian institutions, since India serves as a key market and shares the river basins
with them.
Sources: Chatterjee 2013; Mercados EMI 2012.
Note
1. Some 5,544 MW of hydropower capacity was added out of the targeted 15,627 MW.
References
Chatterjee, Vinayak. 2013. “Shrivelling Temples of Resurgent India.” Business Standard ,August 19. http://www.business-standard.com/article/opinion/shrivelling-temples-of-resurgent-india-113081901183_1.html.
Mercados EMI. 2012. India: Understanding Private Sector Participation in HydropowerDevelopment . New Delhi.

8/20/2019 WB - India Discom Report - Feb15
http://slidepdf.com/reader/full/wb-india-discom-report-feb15 180/255
8/20/2019 WB - India Discom Report - Feb15
http://slidepdf.com/reader/full/wb-india-discom-report-feb15 181/255
157More Power to India • http://dx.doi.org/10.1596/978-1-4648-0233-1
Experience with Multiple
Transmission Owners
Ownership of transmission services by more than one entity came about
organically along with the development of national grids and the establishment
of regional transmission operators (RTOs), transmission system operators
(TSOs), and independent system operators (ISOs) in the country examples pre-
sented here. Unlike generation, the transmission system has a natural monopolis-
tic structure. Not only is the number of players limited but issues to be addressed
include appropriate distribution of costs of grid expansion and tariff setting. The
fractured nature of the grid resulting from liberalization of the market and mul-
tiple owners is a concern for planning and security. At the same time, multiple
owners create the need for greater coordination, better transmission planning,
and implementation of measures to ensure reliability locally and regionally.
Examples of different market and regulatory approaches with multiple grid
owners are provided below (and see table D.1).
Argentina—Argentina restructured its power system in the early 1990s, as
part of a larger economic reform program that included the privatization of all
state-owned industries. Transmission and generation assets were sold, mainly to
foreign entities. Although the sector remained regulated, the government intro-
duced competition by auctioning (concessioning) contractual rights to deliverservices for specified periods under technical and reliability standards established
by the National Entity for Electricity Regulation.
Argentine transmission companies are responsible for the operation and main-
tenance of their networks, but not for the expansion of the system. The conces-
sionaire earns a fixed remuneration (for connection, transmission capacity, and
energy transported), to ensure no distortion of spot prices of electricity. This
aspect of regulation has worked well. It has improved quality of service and
provided sufficient revenue for line maintenance and has encouraged greater
efficiency. Although users pay for new transmission capacity, effective planning
for the sector has been a challenge.
A P P E N D I X D
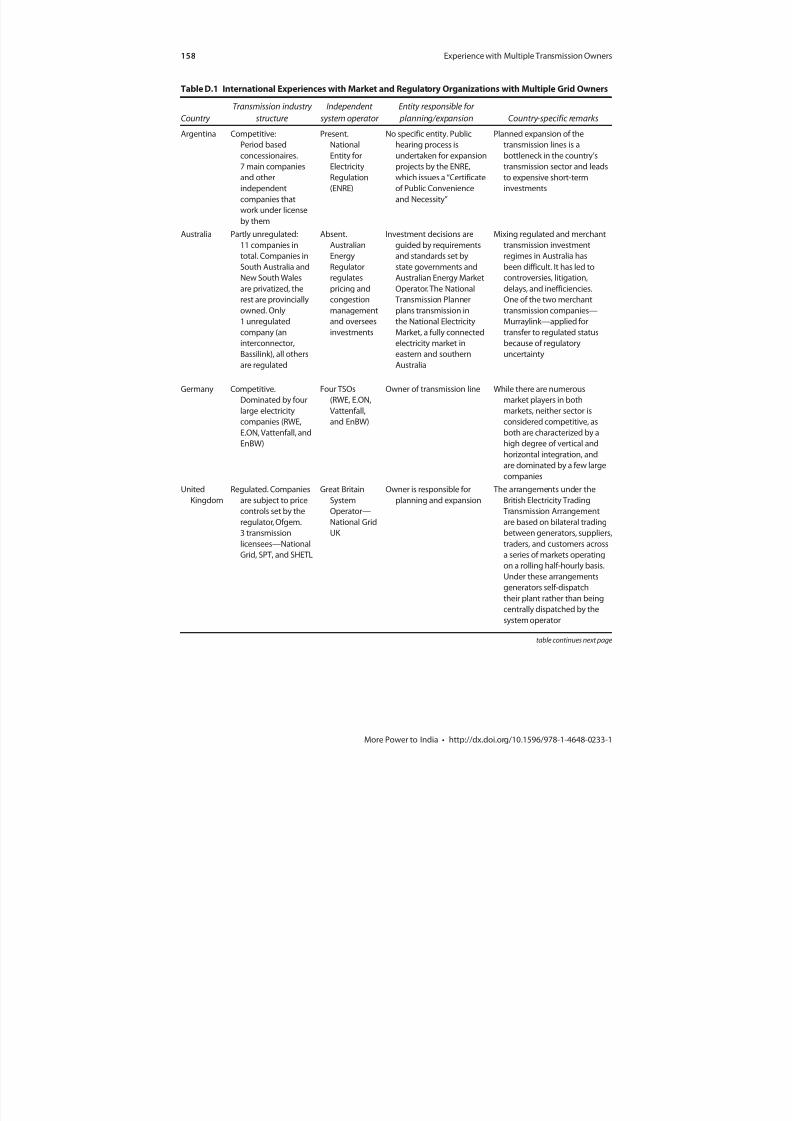
8/20/2019 WB - India Discom Report - Feb15
http://slidepdf.com/reader/full/wb-india-discom-report-feb15 182/255
158 Experience with Multiple Transmission Owners
More Power to India • http://dx.doi.org/10.1596/978-1-4648-0233-1
Table D.1 International Experiences with Market and Regulatory Organizations with Multiple Grid Owners
Country
Transmission industry
structure
Independent
system operator
Entity responsible for
planning/expansion Country-specific remarks
Argentina Competitive:Period based
concessionaires.
7 main companies
and other
independent
companies that
work under license
by them
Present.National
Entity for
Electricity
Regulation
(ENRE)
No specific entity. Publichearing process is
undertaken for expansion
projects by the ENRE,
which issues a “Certificate
of Public Convenience
and Necessity”
Planned expansion of thetransmission lines is a
bottleneck in the country’s
transmission sector and leads
to expensive short-term
investments
Australia Partly unregulated:
11 companies in
total. Companies in
South Australia and
New South Wales
are privatized, the
rest are provincially
owned. Only
1 unregulated
company (an
interconnector,
Bassilink), all others
are regulated
Absent.
Australian
Energy
Regulator
regulates
pricing and
congestion
management
and oversees
investments
Investment decisions are
guided by requirements
and standards set by
state governments and
Australian Energy Market
Operator. The National
Transmission Planner
plans transmission in
the National Electricity
Market, a fully connected
electricity market in
eastern and southern
Australia
Mixing regulated and merchant
transmission investment
regimes in Australia has
been difficult. It has led to
controversies, litigation,
delays, and inefficiencies.
One of the two merchant
transmission companies—
Murraylink—applied for
transfer to regulated status
because of regulatory
uncertainty
Germany Competitive.
Dominated by four
large electricitycompanies (RWE,
E.ON, Vattenfall, and
EnBW)
Four TSOs
(RWE, E.ON,
Vattenfall,and EnBW)
Owner of transmission line While there are numerous
market players in both
markets, neither sector isconsidered competitive, as
both are characterized by a
high degree of vertical and
horizontal integration, and
are dominated by a few large
companies
United
Kingdom
Regulated. Companies
are subject to price
controls set by the
regulator, Ofgem.
3 transmission
licensees—National
Grid, SPT, and SHETL
Great Britain
System
Operator—
National Grid
UK
Owner is responsible for
planning and expansion
The arrangements under the
British Electricity Trading
Transmission Arrangement
are based on bilateral trading
between generators, suppliers,
traders, and customers across
a series of markets operating
on a rolling half-hourly basis.
Under these arrangements
generators self-dispatch
their plant rather than being
centrally dispatched by the
system operator
table continues next page
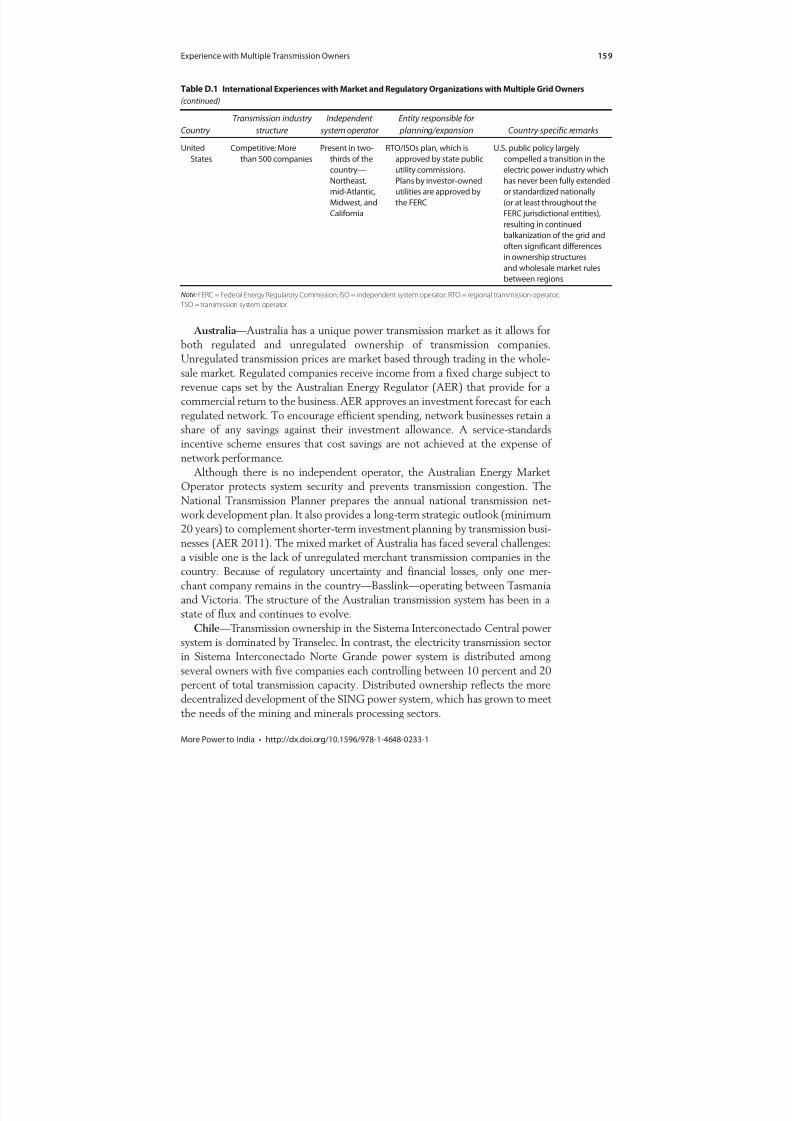
8/20/2019 WB - India Discom Report - Feb15
http://slidepdf.com/reader/full/wb-india-discom-report-feb15 183/255
Experience with Multiple Transmission Owners 159
More Power to India • http://dx.doi.org/10.1596/978-1-4648-0233-1
Australia—Australia has a unique power transmission market as it allows for
both regulated and unregulated ownership of transmission companies.
Unregulated transmission prices are market based through trading in the whole-
sale market. Regulated companies receive income from a fixed charge subject to
revenue caps set by the Australian Energy Regulator (AER) that provide for a
commercial return to the business. AER approves an investment forecast for each
regulated network. To encourage efficient spending, network businesses retain ashare of any savings against their investment allowance. A service-standards
incentive scheme ensures that cost savings are not achieved at the expense of
network performance.
Although there is no independent operator, the Australian Energy Market
Operator protects system security and prevents transmission congestion. The
National Transmission Planner prepares the annual national transmission net-
work development plan. It also provides a long-term strategic outlook (minimum
20 years) to complement shorter-term investment planning by transmission busi-
nesses (AER 2011). The mixed market of Australia has faced several challenges:a visible one is the lack of unregulated merchant transmission companies in the
country. Because of regulatory uncertainty and financial losses, only one mer-
chant company remains in the country—Basslink—operating between Tasmania
and Victoria. The structure of the Australian transmission system has been in a
state of flux and continues to evolve.
Chile—Transmission ownership in the Sistema Interconectado Central power
system is dominated by Transelec. In contrast, the electricity transmission sector
in Sistema Interconectado Norte Grande power system is distributed among
several owners with five companies each controlling between 10 percent and 20
percent of total transmission capacity. Distributed ownership reflects the moredecentralized development of the SING power system, which has grown to meet
the needs of the mining and minerals processing sectors.
Table D.1 International Experiences with Market and Regulatory Organizations with Multiple Grid Owners
(continued)
Country
Transmission industry
structure
Independent
system operator
Entity responsible for
planning/expansion Country-specific remarks
United
States
Competitive: More
than 500 companies
Present in two-
thirds of the
country—
Northeast,
mid-Atlantic,
Midwest, and
California
RTO/ISOs plan, which is
approved by state public
utility commissions.
Plans by investor-owned
utilities are approved by
the FERC
U.S. public policy largely
compelled a transition in the
electric power industry which
has never been fully extended
or standardized nationally
(or at least throughout the
FERC jurisdictional entities),
resulting in continued
balkanization of the grid and
often significant differences
in ownership structures
and wholesale market rules
between regions
Note: FERC = Federal Energy Regularoty Commission; ISO = independent system operator; RTO = regional transmission operator;
TSO = transmission system operator.
8/20/2019 WB - India Discom Report - Feb15
http://slidepdf.com/reader/full/wb-india-discom-report-feb15 184/255
160 Experience with Multiple Transmission Owners
More Power to India • http://dx.doi.org/10.1596/978-1-4648-0233-1
New regulated transmission investment is determined through a centralized
process involving a holistic planning phase (the transmission “trunk” study) and
a subsequent tendering process. Merchant interconnector investments are per-
mitted, but there is little incentive to make such investments in the absence ofcertainty about the regulated return on investment.
Comisión Nacional de Energía—Chile’s energy regulator—is responsible for
analyzing pricing, tariffs, and technical standards for energy production, genera-
tion, transmission, and distribution. In Chile responsible generators and network
owners are also legally obliged to have contingency plans that enable them to
effectively support emergency management and restoration activities.
Superintendencia de Electricidad y Combustibles is responsible for monitoring
and verifying such compliance (IEA 2012).
Germany—The German electricity industry is dominated by four large elec-
tricity companies (RWE, E.ON, Vattenfall, and EnBW), which together control90 percent of the country’s generating capacity, almost the entire high-voltage
transmission network, and about half the retail market. This structure, in com-
bination with the congestion prevailing at all German borders with the excep-
tion of Austria, is thought to prevent effective competition from developing
(EC 2007).
The four TSOs in Germany are also RWE, E.ON, Vattenfall, and EnBW. Thus
they act as the system operating grid owners (system operators and owners) and
work autonomously and independently of each other (for example, independent
grid planning, grid operations, grid tariff calculations, and dispatch). This struc-
ture developed mainly for political reasons, and has led to many issues includingthe need for balancing separate power markets within each network. Attempts
to separate system operators from transmission ownership have not been
successful.
Norway—There are around 47 network companies in Norway; however,
Statnett SF holds the position of the monopoly TSO. It is responsible for all high-
voltage electricity transmission and distribution in the country. The central gov-
ernment owns a large proportion of the central grid through Statnett, while
private companies, counties, and local authorities own the remainder.
The Norwegian Water Resources and Energy Directorate (NVE) is responsi-ble for monitoring grid management and operations and determines an income
cap for each network company: their income, which mainly derives from trans-
mission tariffs, must not exceed the maximum permitted level determined by
NVE. This system is intended to ensure both that grid companies do not make
unreasonable monopoly profits and that cost reductions also benefit grid
customers.
The United Kingdom—Three companies, responsible for maintenance as well
as planning and expansion of their networks, dominate the market. The British
Electricity Trading Transmission Arrangement made provisions for a single system
operator—National Grid UK—in the country. Apart from being a regular trans-mission company, National Grid also ensures that supply and demand can be
continuously matched or balanced in real time and works to regulate the three
8/20/2019 WB - India Discom Report - Feb15
http://slidepdf.com/reader/full/wb-india-discom-report-feb15 185/255
Experience with Multiple Transmission Owners 161
More Power to India • http://dx.doi.org/10.1596/978-1-4648-0233-1
transmission monopolies effectively to maintain market efficiency. Market par-
ticipants have access to information to enable them to trade to balance their
positions and self-dispatch their plant. The Grid Code is designed to permit the
development, maintenance, and operation of an efficient, coordinated, and eco-nomical system for transmitting electricity; to facilitate competition in the gen-
eration and supply of electricity; and to promote the security and efficiency of
the power system as a whole. To help achieve appropriate pricing in transmission,
a performance-based model for setting the network companies’ prices, called
RIIO (Revenue = Incentives + Innovation + Outputs) has been established by
the electricity regulator, Ofgem.
The United States—Some 500 companies own transmission grids in the
country. Responsibility for operating the transmission networks is dispersed
among widely divergent business models that can coexist under the transmission
open-access regime established by the Federal Energy Regulatory Commission(FERC). Overall the grids are operated within a framework of about 130 control
areas, which the FERC now calls “balancing authorities” (Willrich 2009).
RTO/ISOs provide transmission service for about two-thirds of America’s
electricity consumers in the Northeast, mid-Atlantic, Midwest, and California.
Transmission service in the Northwest and Southeast is provided by investor-
owned utilities. An RTO/ISO designs and administers within its balancing
authority several types of auction markets, including day-ahead and real-time
wholesale spot markets, and forward markets for financial transmission
rights. These markets are characterized by transparent prices that support
workably competitive market outcomes. Importantly, both the RTO andISOs report evidence of possible manipulative behavior to the FERC. The
North American Electric Reliability Corporation (NERC) puts in place reli-
ability standards and enforces them.
RTO/ISO staff and stakeholders reach consensus on planning assumptions,
and identify locations where transmission projects may improve reliability and/
or relieve congestion, provide economic benefits, and help meet renewable port-
folio standard goals. Depending on project size, the management or RTO/ISO
board approves projects. The FERC encourages RTO/ISOs to participate in
regional planning efforts. Respective state public utility commissions and theFERC (in the case of investor-owned utilities) approve cost recovery for trans-
mission investments.
Sources: AER 2009; BETTA 2011; EC 2007; IEA 2012; Willrich 2009.
References
AER (Australian Energy Regulator). 2009. State of the Energy Market 2009—TransmissionPlanning. Melbourne, Australia: AER.
———. 2011. State of the Energy Market 2011. Melbourne, Australia: AER.
BETTA (British Electricity Trading and Transmission Arrangements). 2011. Electricity Market Reform—Energy and Climate Change. http://www.publications.parliament.uk/pa/cm201012/cmselect/cmenergy/742/74205.htm.

8/20/2019 WB - India Discom Report - Feb15
http://slidepdf.com/reader/full/wb-india-discom-report-feb15 186/255
162 Experience with Multiple Transmission Owners
More Power to India • http://dx.doi.org/10.1596/978-1-4648-0233-1
EC (European Commission). 2007. “Germany—Internal Market Worksheet.” http://ec.europa.eu/energy/energy_policy/doc/factsheets/market/market_de_en.pdf.
IEA (International Energy Agency). 2012. Oil & Gas Security, Emergency Response of IEACountries—Chile. Paris.
Willrich, Mason. 2009. “Electricity Transmission Policy for America: Enabling a SmartGrid, End-to-End.” MIT-IPC-Energy Innovation Working Paper 09-003, MassachusettsInstitute of Technology, Cambridge, MA.

8/20/2019 WB - India Discom Report - Feb15
http://slidepdf.com/reader/full/wb-india-discom-report-feb15 187/255
163More Power to India • http://dx.doi.org/10.1596/978-1-4648-0233-1
Maharashtra State Electricity
Transmission Company’s Strategic
Alliance Model
The Maharashtra State Electricity Transmission Company (MSETCL), unbundled
from the Maharashtra State Electricity Board in 2005, is responsible for trans-
mission and load dispatch in the state. The utility is the largest state transmission
company in India by asset base. Maharashtra is one of India’s most industrial-
ized states, but has been suffering from massive transmission shortages and
growing power outages. In response, the government developed an ambitious
plan to invest $5.5 billion over four years to improve transmission capacity by
120 percent. In 2006, the MSETCL sought financial and technical assistance
from the World Bank to improve its institutional and implementation capacity
in furtherance of its objectives.
By 2007, after extensive consultation—among employees, customers (mainly
the distribution companies), equipment and services suppliers, state govern-
ment, and the state power regulatory authority—a consensus was reached to
adopt a public-private partnership–based approach. This “strategic alliance”
model entailed designing an optimal bidding strategy for selecting a private
partner for this priority program and developing a risk-sharing contractualframework to attract large and technically competent vendors on a “win-win”
platform. The idea was that both the MSETCL and the chosen strategic alliance
partner would benefit from more efficient and cost-effective project implemen-
tation resulting from a faster, less cumbersome tender process, and technical
and project management skills would be fostered within the company.
This strategic alliance approach—a first for India—allowed for innovative
risk-sharing between the MSETCL and its contractors by building perfor-
mance-based conditions into the contracts, such as incentives for early com-
pletion, implementation of quality assurance mechanisms, and contractual
payments linked to physical progress of works rather than to supply of equip-ment. Another critical innovation was that instead of inviting separate bids
A P P E N D I X E
8/20/2019 WB - India Discom Report - Feb15
http://slidepdf.com/reader/full/wb-india-discom-report-feb15 188/255
164 Maharashtra State Electricity Transmission Company’s Strategic Alliance Model
More Power to India • http://dx.doi.org/10.1596/978-1-4648-0233-1
for more than 250 contracts in line with traditional practice, the projects
were bundled into four packages based on geographic contiguity and required
timelines for completion. This bundling greatly streamlined the procurement
process.Adopting this partnership and risk-sharing approach required a fundamen-
tal cultural shift at the MSETCL, which had grown accustomed to executing
all investments either in house or through a rather adversarial, top-down
relationship with vendors. The new approach allowed the MSETCL to
quickly attract and secure large and technically competent engineering pro-
curement and construction partners to implement the expansion. In May
2009 strategic alliance contracts worth around $1.5 billion were awarded to
globally reputable transmission vendors, which are expected to save the
MSETCL $100 million compared with internal cost estimates.
Following the success of the strategic alliance framework, the MSETCL’snext key challenge was to ensure that it had sufficient capacity to adequately
supervise all its projects and contractors. The MSETCL thus focused on
implementing a detailed project monitoring and review process and a well-
defined strategic communication framework. These initiatives served to
strengthen its institutional capacity for managing public-private contracts, its
human resources approach, and sustainable change-management practices.
Major changes have been executed in business processes and hierarchies
within the organization, current roles have been realigned, and new positions
have been created.
More specifically, instead of separate departments working on differentphases of project design and implementation, integrated project teams with
representation from different functional areas were operationalized. In addition,
revamped reporting—by key results area/key performance indicator—and
effective performance appraisal systems created a system of transparency and
accountability. After a year of implementation and continued management
support, positive change permeated the organization, prompting enthusi-
asm among staff. There is now regular proactive dialogue in review meetings
on constraints faced in achieving key results areas, and on how to overcome
them.The MSETCL’s transition from a traditional state government department to
an efficient and commercial entity is steadily being achieved. Indeed, the
MSETCL has become a model for other Indian utilities. In addition to maintain-
ing healthy profits (Rs 3,290 million [$70 million] in 2011), it has maintained
high technical performance in line with international standards. In 2011 it real-
ized systems availability of 99.62 percent for heating, ventilation, and air condi-
tioning and 97.62 percent for high-voltage, direct current systems, and transmission
loss of only 4.31 percent while wheeling a high of 102,076 million units of
energy during the year. Since unbundling, annual transmission and distribution
losses declined from more than 32 percent in 2006 to 23 percent in 2011.Source: PPIAF 2012.
8/20/2019 WB - India Discom Report - Feb15
http://slidepdf.com/reader/full/wb-india-discom-report-feb15 189/255
Maharashtra State Electricity Transmission Company’s Strategic Alliance Model 165
More Power to India • http://dx.doi.org/10.1596/978-1-4648-0233-1
Reference
PPIAF (Public-Private Infrastructure Advisory Facility). 2012. PPIAF Supports a Pioneering Approach for Executing the Maharashtra State Electricity Transmission Company’s
Investment Plan. Washington, DC.

8/20/2019 WB - India Discom Report - Feb15
http://slidepdf.com/reader/full/wb-india-discom-report-feb15 190/255

8/20/2019 WB - India Discom Report - Feb15
http://slidepdf.com/reader/full/wb-india-discom-report-feb15 191/255
167More Power to India • http://dx.doi.org/10.1596/978-1-4648-0233-1
International Experience in Private
Sector Participation in Transmission
and Distribution
Private sector participation (PSP) in transmission and distribution has been
pursued by developed and developing countries as a means of addressing criti-
cal challenges in the power sector generally with one or more of the four
overlapping objectives: introduce competition; attract fresh capital; improve
financial and operational performance; and depoliticize the sector and reduce
government influence. Several countries such as the United Kingdom and
those in Latin America during the 1980s and 1990s pursued power sector
reforms as part of a larger economy-wide liberalization effort in response to
economic crises.
Three models of PSP have generally been followed for transmission: dives-
ture (the most common) was used in the 1980s in Latin American countries
that followed the Chilean model, such as Argentina, El Salvador, and Peru;
leasing contracts, which are relatively rare although employed by Brazil and
the Philippines and in some Sub-Saharan countries like Kenya, Rwanda,
Tanzania, and Uganda; and build-own-operate-transfer contract models in
Peru. Turkey decided not to privatize transmission but only focus on privati-zation of distribution. As a result, it has an integrated transmission model
where ownership and operation is under the responsibility of a single trans-
mission company.
There is a full spectrum of options for PSP in distribution with models
ranging from full to partial privatization. Some of the models adopted by dif-
ferent countries are divestiture (Chile, Peru, and the United Kingdom); man-
agement contracts; right to operate and investment management contracts
with specific electric cooperatives (the Philippines); concession contracts
(Brazil); contracts for transfer of operating rights (Turkey); and distribution
franchises (India).
A P P E N D I X F
8/20/2019 WB - India Discom Report - Feb15
http://slidepdf.com/reader/full/wb-india-discom-report-feb15 192/255
168 International Experience in Private Sector Participation in Transmission and Distribution
More Power to India • http://dx.doi.org/10.1596/978-1-4648-0233-1
Selected Country Experiences
Germany—Europe’s largest power market, Germany’s transmission network is
connected to nine neighboring countries. Historically, the market was run by a
cartel dominated by four companies with legally enforced monopoly on servicearea through demarcation contracts. Germany began implementing the European
Union Directive with its Energy Act of 1998, but it was not until the creation of
the Bundesnetzagentur (sector regulator) in 2005 that ordinances for opening
distribution networks and terms and conditions for these were passed. In 2009
Germany adopted incentive- rather than cost-based regulation to spur efficiency.
The United States—PSP has had a long history starting with municipal fran-
chises (concession or license) with monopoly over assigned service areas.
Regulation was also developed at the state (not national) level, which continued
in largely the same form until major developments occurred in the 1980s, focus-
ing on increased trading rather than on changes in ownership or structure, as the
construction of high-voltage networks came to be recognized as a means of
enabling commerce. Sophisticated means of transmission pricing and wholesale
market energy trading were developed, which became salient characteristics of
the industry.
The United Kingdom—After the recession of the 1980s, the United Kingdom
viewed privatization and liberalization as a way to reduce public spending and
the national debt, and to improve sector efficiency. As a result, the UK became
the second country after Chile to pursue PSP in power sector networks.
Unbundling and the creation of the Electricity Pool enabled competition in thenon-monopolistic segments (generation and retail). This was complemented by
the application of an incentive or performance-based regulation (PBR) for
pricing and service quality of the natural monopolies of electricity transmission
and distribution. The state monopolies went through several stages of takeover
and merger during the 1990s. Currently, there are 12 regional distribution net-
works in England and Wales run by seven companies and one company for trans-
mission, National Grid UK. Transmission and distribution in Scotland are run by
two vertically integrated firms (Pond 2006). Reforms have largely been a success,
resulting in a healthy competitive market with lower overall tariffs and improved
operational and technical performance compared with pre-reform days. Australia—The restructuring of the electricity industry in Australia was
initiated in 1991, and by 1998 a National Electricity Market had developed to
lower electricity prices through competition by creating a more flexible and
cost-efficient industry. Although a “national approach” was adopted for intro-
ducing competition and operating a nationwide market, states had significant
independence in their PSP approach. Victoria led the way, closely following the
UK model—vertically unbundling and privatizing the state utility and creating
a state power sector regulator. Western Australia separated out supply but left
generation as one business; New South Wales unbundled but kept the utilities
under government ownership; and South Australia privatized electricity assets
via long-term lease arrangements.
8/20/2019 WB - India Discom Report - Feb15
http://slidepdf.com/reader/full/wb-india-discom-report-feb15 193/255
International Experience in Private Sector Participation in Transmission and Distribution 169
More Power to India • http://dx.doi.org/10.1596/978-1-4648-0233-1
Chile—Chile is widely regarded as the world’s pioneer in restructuring and
privatizing electricity markets. Reforms resulted in almost 100 percent private
ownership of generation, transmission, and distribution, and served as a model for
other countries in Latin America. Transmission and distribution are each a regu-lated monopoly, and distribution companies within concession areas serve both
regulated and nonregulated customers. The power market is one of the best
performing in the world, with high employee efficiency, quality of service, and
consistently low distribution losses (at 5–6 percent, better than in most devel-
oped countries). The progress is best illustrated by Chilectra, Chile’s largest dis-
tribution company (discom): from 1987 to 2011, its sale of power almost
quadrupled to 13,697 GWh, and the number of consumers increased 70 percent
to 1.6 million, all the while reducing the workforce from 2,587 to 712
employees.
Brazil—Power sector reforms were initiated in the 1990s when economicdifficulties and high inflation severely curtailed the government’s ability to con-
tinue operating state-run businesses. In 1997, around half the transmission and
distribution utilities were transferred to new private owners on the basis of
30-year concessions awarded through public auctions run by Agência Nacional
de Energia Elétrica (the national electricity regulator). While the first round of
privatization improved performance, severe drought-related power shortages in
2000–01 led to a second round of reforms aimed at renewing private invest-
ment. This “New Model” introduced energy auctions as the main procurement
mechanism for discoms to acquire electricity wholesale.1 Reforms aimed to
ensure fair tariffs by providing for tariff reviews whenever any taxes or legalcharges were introduced after bidding. Post privatization, utilities have markedly
reduced losses and improved quality of supply.
Peru—Following economic upheaval in the late 1980s, an independent power
regulator was created in 1993. Over 1994–97, reform went smoothly and distri-
bution assets in Lima and five provinces, as well as the national transmission sys-
tem, were privatized. Thereafter the process slowed due to domestic and external
factors (political resistance and economic spillovers from the Asian financial
crisis). There were some setbacks: in 2001, four regional utilities covering 800,000
clients were taken back by the state after the failure of a local concessionaire tocomply with its payment obligations. Severe drought-related power shortages
forced a second round of reforms in 2006, encouraging PSP by strengthening
planning and the pricing policy for generation and transmission. Despite improved
performance, there has been vertical reintegration in the sector.
Argentina—The Electricity Law of 1992 unbundled state utilities, estab-
lished a wholesale energy market, and created a sector regulator. Contracts
were awarded for 99 years with price reviews every five years. However, the
reforms were largely undone following the country’s severe economic and
political crisis in 2001. Extreme devaluation of the peso forced the government
to violate the concession contracts it had signed by freezing tariffs, despite clearprovisions on pricing. Even with economic recovery, tariffs continue to be
propped up by government subsidies under discretionary and unclear rules.
8/20/2019 WB - India Discom Report - Feb15
http://slidepdf.com/reader/full/wb-india-discom-report-feb15 194/255
170 International Experience in Private Sector Participation in Transmission and Distribution
More Power to India • http://dx.doi.org/10.1596/978-1-4648-0233-1
This reform reversal has resulted in a widespread default on debt payments
by energy companies and a loss of shareholder value. After drastic deterioration
in service quality, the government has publicly expressed its plan to take back
the distribution companies.Turkey—Turkey transferred operating rights to the state-owned companies
and regional companies operating its distribution systems, while assets remained
state owned. To encourage competition, discoms were initially not allowed to sell
more than 20 percent of the total amount of electricity supplied within their
own regions. This limit was removed in 2006 and discoms were permitted to
hold generation licenses and become self-suppliers. The transmission sector
remains under a single public company, TEIAS, with an integrated model where
both transmission grid ownership and operation is independent of supply and
trading, which minimizes any tension between the system operator and grid
owner, and promotes efficient maintenance and expansion.The Philippines—Executive Order 215, issued in 1987, permitted the private
sector to participate in power generation (FDC 2007). Deteriorating finances in
the early 2000s forced reforms to increase PSP. The regulatory agency (the
Electricity Regulatory Commission) was established in 2001 to oversee unbun-
dling and privatization of the National Power Corporation (the state utility). The
private sector is involved with municipality-owned utilities or electric coopera-
tives operated through investment management contracts. Joint ventures are also
prevalent. The transmission company’s (TransCo) assets were privatized in 2009.
They are now run by the National Grid Corporation of the Philippines through
25-year concessions. The Electricity Regulatory Commission promulgated aperformance-based regulatory framework, and the performance of the transmis-
sion sector has markedly improved since privatization.
Europe and Central Asia—Several countries launched power sector reform at
the end of the 1990s, notably former Soviet republics such as Georgia, Moldova,
Tajikistan, and Ukraine, to varying degrees. In Georgia, after unbundling and
urgent rehabilitation of transmission and distribution infrastructure, the discoms
were privatized. Ukraine’s power sector was unbundled and partly liberalized,
and the distribution segment privatized (out of 27 regional discoms, only 14 are
majority state owned).
Key Findings
The PSP experience in transmission and distribution in both developing and
developed countries has provided many lessons. Across the board, PSP has con-
sistently increased inflows of private capital; improved technical, operational, and
financial performance; and motivated the strengthening of the regulatory frame-
work of the country’s power sector.
•
PSP has played a key role in attracting fresh capital. In Peru, over 1994–2010,the private sector accounted for 87 percent of all investment in transmission
and 56 percent of distribution expansion. In Turkey, estimates suggest over
8/20/2019 WB - India Discom Report - Feb15
http://slidepdf.com/reader/full/wb-india-discom-report-feb15 195/255
International Experience in Private Sector Participation in Transmission and Distribution 171
More Power to India • http://dx.doi.org/10.1596/978-1-4648-0233-1
$5.7 billion in government revenue has been raised from privatization.
Private capital has also been used to fund improvements in network operation
and maintenance in countries like Brazil and Chile.
• PSP has improved financial and operational performance of transmission and
distribution sectors. Losses came down and employee efficiency went up.
Quality of service also improved with reliable power and fewer outages. New
contracting procedures, network modernization, better customer relationships,
and corporate management were fueled by the private sector.
• In successful PSP models in transmission and distribution, private companies
act as effective implementers of programs that are systematically planned,
designed, and funded by the relevant government agencies. As Brazil, Chile,
and Peru discovered during the first phase of reform, even the best-performingprivate discoms do not initiate service expansion without specific incentives.
The private sector does not address issues of energy security either, which is
necessary for large-scale and long-term integrated planning.
• Vertical and horizontal reintegration of assets after reform is a concern, as seen
in several Latin American countries (Chile, El Salvador, and Peru) and Turkey,
where creeping monopolization hampered early progress and made market
entry for new players nearly impossible. Clear policies are needed to halt this
trend.
The key to attract PSP is to reduce risk and improve the financial viability of
the sector:
• PSP requires a sound and transparent policy and regulatory framework/
environment and a strong and independent regulatory agency. This can help to
improve the credibility of the government and sector by reducing uncertainty,
such as political risk (as seen in Argentina), which is imperative to attract
private investors.
• Distribution projects tend to be riskier than generation or transmission proj-
ects, with threats of contract cancellations and major disputes. Worldwide,
13 percent of more than 250 contracts involving distribution signed in 1990–
2005 are no longer operational, almost twice the rate of generation projects.
• Preventing tariff volatility and charging cost-reflective tariffs to end users is
critical for promoting high-quality service and for service providers to achieve
reasonable profits. Introduction of PBR2 and multiyear reviews has been very
effective in Latin America (Argentina, Chile, Columbia, El Salvador, Peru, and
Brazil) in helping allay investors’ reservations.
Sources: Bowman and McKay 2001; FDC 2007; Pond 2006; Woolf and others 2010; ESMAP (forthcoming).

8/20/2019 WB - India Discom Report - Feb15
http://slidepdf.com/reader/full/wb-india-discom-report-feb15 196/255
172 International Experience in Private Sector Participation in Transmission and Distribution
More Power to India • http://dx.doi.org/10.1596/978-1-4648-0233-1
Notes
1. The New Model is being discussed and implemented in developed countries such as the United Kingdom and Australia for developing smart grids.
2. Under traditional cost-of-service regulation, utilities are allowed to recover prudently incurred costs plus a return. This requires frequent regulatory reviews and provides little incentive to increase service offerings or cut costs. Under PBR, price or revenue is capped, providing utilities with the incentive to improve efficiency and reduce costs to improve profit margins. PBR is a more light-handed form of regulation, resulting in reduced costs of regulation, reduced cost of power owing to sharing of utility cost reductions between utilities and consumers, and improved risk allocation between utilities and consumers. Most PBR schemes institute a revenue or price cap adjusted annually to account for input price increases offset by productivity improvements to ensure that customers share in any benefits derived by the utility (Bowman and McKay 2001).
References
Bowman, Douglas C., and Margaret S. McKay. 2001. “Performance-Based Regulation(PBR) Delivers Maximum Benefits.” http://www.elp.com/articles/print/volume-79
/issue-4/industry-news/performance-based-regulation-pbr-delivers-maximum-benefits.html.
ESMAP (Energy Sector Management Assistance Program). Forthcoming. InternationalExperience with Private Sector Participation in Transmission and Distribution Grids.
Washington, DC: World Bank.
FDC (Freedom from Debt Coalition). 2007. Philippine Power Industry Restructuring andPrivatization. Quezon City. http://pcij.org/blog/wp-docs/Philippine_Power_Fact_Sheet.pdf.
Pond, Richard. 2006. Liberalisation, Privatisation and Regulation in the UK Electricity Sector .Pique (Privatisation of Public Services and the Impact on Quality, Employment andProductivity) Project, London.
Woolf, Fiona, Vivek Gambhir, Ivan Londres, and Leo Simpson. 2010. “Brazil’s ElectricityMarket: A Successful Journey and an Interesting Destination.” February 11. http://www .mondaq.com/x/93780/Oil+Gas+Electricity/Brazils+Electricity+Market+A+Successful+Journey+And+An+Interesting+Destination.
8/20/2019 WB - India Discom Report - Feb15
http://slidepdf.com/reader/full/wb-india-discom-report-feb15 197/255
173More Power to India • http://dx.doi.org/10.1596/978-1-4648-0233-1
International Experience in Open
Access
Open access (OA) to the power grid is an essential element in introducing
competition to electricity markets and thus contributing to their efficiency. The
competition permitted by OA allows for multiple and flexible power supply
contracts that take advantage of load and time diversity and contribute to more
efficient operation, thus potentially reducing tariffs and improving the quality of
power supply.
Opening up access to the grid can be seen as a multilayered process: passing
OA laws and establishing regulatory agencies constitute just the first step.
Countries need to go beyond that by fostering a vibrant marketplace that is
sophisticated, efficient, and supported by specification of terms and conditions
of access, including pricing arrangements. Countries that have fully enabled OA
have experienced an improved competitive environment and better sector per-
formance. Greater transparency has attracted new investments in generation and
network development, and countries like Brazil, Peru, and Turkey have seen
impressive growth in the wholesale market.
Country Experiences
The United States—Unleashing competition to bring down costs was the
main rationale for the U.S. power industry and regulators to embrace the con-
cept of OA. The United States has increasingly relied on OA in its gradual
progression toward wider competition, starting with the introduction of a
competitive wholesale power market. During the 1980s, the Federal Energy
Regulatory Commission (FERC) began to move from traditional cost-of-ser-
vice rate-making at the wholesale generation level, toward allowing prices to
be set by competitive market forces, culminating in the Electricity Policy Act
(EPACT) of 1992, which mandated transmission OA. Open access at the retail
level varies by state—roughly half the states have retail third-party competi-tion and retail choice.
A P P E N D I X G
8/20/2019 WB - India Discom Report - Feb15
http://slidepdf.com/reader/full/wb-india-discom-report-feb15 198/255
174 International Experience in Open Access
More Power to India • http://dx.doi.org/10.1596/978-1-4648-0233-1
Canada—Because much of Canada’s grid is integrated with that of the United
States and many Canadian utilities sell to the United States, the FERC policy of
OA has significant influence in Canada. Many of the utilities in Canada are still
owned by provincial and local governments, and market structures vary from oneprovince to another. Models include separation of generation and transmission
from distribution and retail supply; an open market with retail choice; open
wholesale markets; and some forms of competition in generation along with
retail choice. The National Energy Board (Canada’s national energy regulator)
works with a number of provincial and federal agencies to improve the regula-
tory process.
Brazil—The electricity market model is one of the more advanced with
respect to enabling OA, with a detailed and explicit legal framework for OA to
transmission and distribution and creation of regulatory institutions. However,
the absence of effective and transparent price signals for ancillary services, con-gestion, and demand response has hampered achievement of full OA and the
development of an efficient and competitive power market.
Chile—The enactment of DFL No. 1 in 1982 aimed to make generation com-
petitive and enable OA in transmission, while distribution was to remain a natural
monopoly. A market was set up between generation and distribution companies
(discoms) for small consumers, and large consumers were enabled to engage in
supply contracts with generators or discoms. The Chilean wholesale electricity
market comprises a spot market and a contracts market. Dispatch and prices are
based on an economic merit order. Prices take account of transmission constraints,
so generators directly bear those costs (Pollitt 2004).Germany—Historically, the German electricity sector functioned as a cartel
with biased rules for network access. The sector was restructured in 1996
and nondiscriminatory network access was mandated in 1998. Reforms contin-
ued with the formation of the Bundesnetzagentur (sector regulator) in 2005,
and ordinances requiring the opening of distribution networks and specifying
the general terms and conditions for this were passed. In 2009 Germany
adopted incentive-based regulation, rather than cost-based regulation, to spur
efficiency. The electricity market comprises a futures market, day-ahead (spot)
market, and intraday market (organized by the European Energy Exchange andEuropean Power Exchange) and reserve markets (operated by the transmission
system operators).
Australia—The National Electricity Market (NEM) began in 1998, with
national prices set by a National Electricity Code Manager while the Australian
Competition and Consumer Commission set transmission prices. The Minister
for Energy has review powers over certain Commission decisions. Australia has a
gross pool system that suppliers bid into. It does not have a nodal pricing system
and there are high variations in regional spot prices due to loss factors for trans-
mission and capacity. The development of the NEM has accommodated substan-
tial load growth, while absorbing several thousand megawatts of new merchantplant of various types and sizes. Reasons for the success of the NEM include
careful specification and description of network limitations, resulting in a general

8/20/2019 WB - India Discom Report - Feb15
http://slidepdf.com/reader/full/wb-india-discom-report-feb15 199/255
International Experience in Open Access 175
More Power to India • http://dx.doi.org/10.1596/978-1-4648-0233-1
increase in network utilization; consistent application of standards for connection
and access; and transparent governance strictly adhering to the National
Electricity Code and National Electricity Law.
Peru—OA to transmission has been particularly instrumental in the growth ofthe wholesale energy market, now accounting for almost half the country’s elec-
tricity consumption, and attracting major investments in power generation.
Formerly isolated self-generators have joined the market and have reacted
positively to the government’s call for building surplus capacity on their sites.
A second wave of reform in 2006 highlighted the importance of government
leadership in system-expansion planning and fostering competition. A notable
element missing from the current model is a provision for independent energy
trading intermediaries.
Turkey—OA policy and an active wholesale market led to sharp growth in
installed capacity in 2003–11, with private investment accounting for 71 percentof the total increase. Turkey has pursued OA for wholesale and retail consumers
alike. The retail threshold, initially set at 9 GWh a year, has consistently been
reduced over the past decade. Turkey shows steady progress through the initial
institutional and market design phases toward some of the elements of a full OA
regime, including market-based wholesale price setting and regulatory provisions
for pricing ancillary services.
India—Despite strong emphasis on OA in the Electricity Act of 2003, OA is
still poorly implemented, with many problems arising at the distribution level
particularly, leading to disincentives and conflicts of interest. First, distribution
has not been unbundled from retail, and most states do not have an independentstate load dispatch center (SLDC), but one that operates under the transmission
company. SLDCs can be biased and resist OA by delaying applications, or deny
rights to sell to a third party on technical grounds. States such as Karnataka,
Maharashtra, and Tamil Nadu have also invoked Section 11 of the Electricity Act,
restricting export of power outside the state. High charges are seriously deterring
OA, including the contentious cross-subsidy surcharge (especially high in Punjab,
Tamil Nadu, and West Bengal), which is imposed on consumers who trade the
discom’s retail sale service for those of an alternative supplier. While there is a
significant volume of wholesale market transactions through power exchanges, alarge part of this is accounted for by own-use or captive generation.
Key Considerations in Designing OA
Finding a suitable model . There is no established rulebook for implementing OA,
as both the starting conditions and the political preferences of every country
differ. Countries can envisage a minimalist approach by simply establishing legal
rights, or can pursue more sophisticated models aiming to put price signals to
work and remove arbitrary influences from the marketplace.
Sequencing wholesale and retail OA. The experience of countries with the mostopen and competitive power systems was to grant OA to the grid starting with
the largest market participants and progressively lowering the size threshold of
8/20/2019 WB - India Discom Report - Feb15
http://slidepdf.com/reader/full/wb-india-discom-report-feb15 200/255
176 International Experience in Open Access
More Power to India • http://dx.doi.org/10.1596/978-1-4648-0233-1
players eligible to participate; reforms also started with transmission (wholesale)
OA and went on to distribution (retail) OA. Retail OA, especially access to dis-
tribution grids, poses more challenges, requiring aggressive policy and price sig-
nals to incentivize the switch to an alternative supplier.Unbundling and revenue separation. Before reform, many developing countries
had integrated generation and transmission activities (the transmission cost was
embedded in the price of energy sold). An effective OA regime requires a clear
focus on the provision of network services as a distinct area of business opera-
tions, best achieved by unbundling transmission from generation and prohibiting
transmission from association with other energy suppliers or traders.
Implementation Issues
Transmission incentives. When the transmission operation receives revenues spe-cific only to provision of grid service, it has an incentive to improve the service,
including maximizing throughput. To enhance OA transparency, a real-time
website that monitors transmission grid utilization, capacity, and ancillary ser-
vices should be provided.
Distribution incentives. Discoms should be neutral to energy sales revenues that
they enable other parties to receive. Even when energy sales revenues belong to
another party (generator, retail supplier), a discom is interested in maximizing its
throughput—similar to the case of a transmission owner/operator. The discom’s
close interface with the end user can be misused to maximize throughput at the
expense of socially desirable objectives, such as conservation or demand-sideefficiency. Therefore, it is recommended that discom revenues be decoupled
from throughput by revenue capping, where the regulator sets a total revenue
requirement for the company for a certain period and tariffs are set to attain it.
Tariffs can later be adjusted to meet any shortfall.
Default service obligation. In practice, it is difficult to achieve a complete
unbundling of the distribution from retail business due to the default (or last-
resort) service obligation of the distribution company. Therefore, even under a
distribution OA regime, a discom will typically have a double license. To main-
tain competitive pressure on the default service provider, distributors should beobliged to bid out the last-resort supplier obligation on a parceled, periodic basis.
Product differentiation. In retail access particularly, a more efficient market will
emerge if players are given an opportunity to offer differentiated products other
than the default product. This may include the energy service company offering
a blend of demand-side services as well as energy; or offering a hedged product
with a fixed price or, conversely, a variable, time-differentiated market-following
price depending on the buyer’s preferences.
Large industrial consumers. These consumers are logical candidates for con-
necting directly to the transmission grid. The policy decision is whether or not to
compensate the discom for losing such consumers to OA. The recommendedapproach is to allow large customers to buy off the local grid but limit their abil-
ity to move freely between the regulated and deregulated markets due to the

8/20/2019 WB - India Discom Report - Feb15
http://slidepdf.com/reader/full/wb-india-discom-report-feb15 201/255
International Experience in Open Access 177
More Power to India • http://dx.doi.org/10.1596/978-1-4648-0233-1
additional system costs and supply disruption this might cause. In several U.S.
states, for example, large customers may return to the regulated market only if
they pay all the incremental costs incurred. In Brazil, customers must provide the
distributor with five years notice of intent.Smart grid technology. This technology should be deployed at major sites of
large customers and all distributed generators. In retail access, attention should
be paid to who owns and operates the metering and billing operations. This capa-
bility is designed to enhance market transparency and efficiency, but in some
circumstances it can also be exploited to exercise market power.
Sources: Pollitt 2004; ESMAP 2013.
References
ESMAP (Energy Sector Management Assistance Program). 2013. International Experiencewith Open Access to Power Grids. Washington, DC: World Bank.
Pollitt, Michael. 2004. “Electricity Reform in Chile—Lessons for Developing Countries.”CEEPR Working Paper 04-016, Center for Energy and Environmental PolicyResearch, Massachusetts Institute of Technology, Cambridge, MA.

8/20/2019 WB - India Discom Report - Feb15
http://slidepdf.com/reader/full/wb-india-discom-report-feb15 202/255
8/20/2019 WB - India Discom Report - Feb15
http://slidepdf.com/reader/full/wb-india-discom-report-feb15 203/255
179More Power to India • http://dx.doi.org/10.1596/978-1-4648-0233-1
Coal Sector Challenges and the
Power Sector
About 76 percent of the coal consumed in India is used by the power sector, and
around 60 percent of the electricity generated comes from coal. The coal sector
does not appear to have anticipated the rapid increase in commissioning of
power plants, mainly led by the private sector, in the 11th Five-Year Plan. Large
gaps between the coal requirement (for plants with coal linkages, which were
commissioned during the plan period) and the actual increase in coal production
(figure H.1), show that increases in production fell well short of demand. Such
a discrepancy between incremental demand for coal by power plants with coal
linkage (implying that they are known to Coal India) and actual production,
particularly in 2010–12, points to a serious lack of coordination between the
ministries concerned.
This is further illustrated by figure H.2, which shows that linkages were effec-
tively approved for over 210 million tons per annum (mtpa) in 2009 and 2010
alone, even considering only a partial coal allocation of 3.4 million tons per giga-
watt (GW) for power plants that requested the coal linkage (against the norm of
5 million tons per GW. In sharp contrast to the approved amount of 210 mtpa,
figure H.2 shows that under the business-as-usual scenario, the total increase in
production expected in the entire 12th Five-Year Plan is only 175 mtpa. If all theplants that have received these linkages (for 210 mtpa) are actually commis-
sioned, it is unclear how they will be supplied with coal, or whether indeed some
of them will become stranded assets from day one. It is likely that these linkages
were used by private power developers to make their projects bankable; that is,
cash-flow forecasts were based on them. The implications of granting these unre-
alistic linkages are now apparent.
As of July 31, 2011, about 1,500 applications for linkages were pending with
the government, including applications for about 600 GW of power plants
(or 3,000 mtpa at the normative average of 5 million tons per GW), and a further
650 mtpa for cement and sponge iron plants. Clearly such huge pent-up demandcannot be satisfied, and whatever allocation process is used, winners and losers
A P P E N D I X H

8/20/2019 WB - India Discom Report - Feb15
http://slidepdf.com/reader/full/wb-india-discom-report-feb15 204/255
180 Coal Sector Challenges and the Power Sector
More Power to India • http://dx.doi.org/10.1596/978-1-4648-0233-1
will emerge. If this process is not transparent and objective, it is likely to unduly
benefit some individual private players at the cost of the national interest and the
reputation of the sector (witness “Coal-gate” allegations that undue financial
gains of about Rs 1.86 trillion ($40 billion) have accrued to private sector recipi-
ents of discretionary and nontransparent allocations).
Increases in production require adequate coal exploration around 10 years in
advance to establish mineable reserves. However, exploration in the 11th Five-
Year Plan was actually less than what was accomplished in the 10th Five-YearPlan, and only about 70 percent of the target was achieved. Yet despite this, the
target for the 12th Five-Year Plan remains very optimistic.
Figure H.1 Incremental Coal Requirement and Coal Production, 2007/08–2011/12
Sources: Coal Controller’s Organization 2012; Ministry of Power 2007.
Note: MW = megawatt.
0
2,000
4,000
6,000
8,000
10,000
0
10
20
30
40
50
2007/08 2008/09 2009/10 2010/11 2011/12
M W
M i l l i o n t o n s
Normative incremental coal requirement for power sector (million tons)
Incremental coal production (million tons)
Incremental coal Thermal Power Plant capacity with linkage (MW)
Figure H.2 Proposed Coal Production and Linkages Granted
Sources: Ministry of Coal 2011a, 2011b.
Annual production
increase in 11th Plan
Proposed production
increase in 12th Plan
Effective Letter of assurance
approved in 2009–2010
0
50
100
150
200
250
M i l l i o n t o n s p e r a n n u m
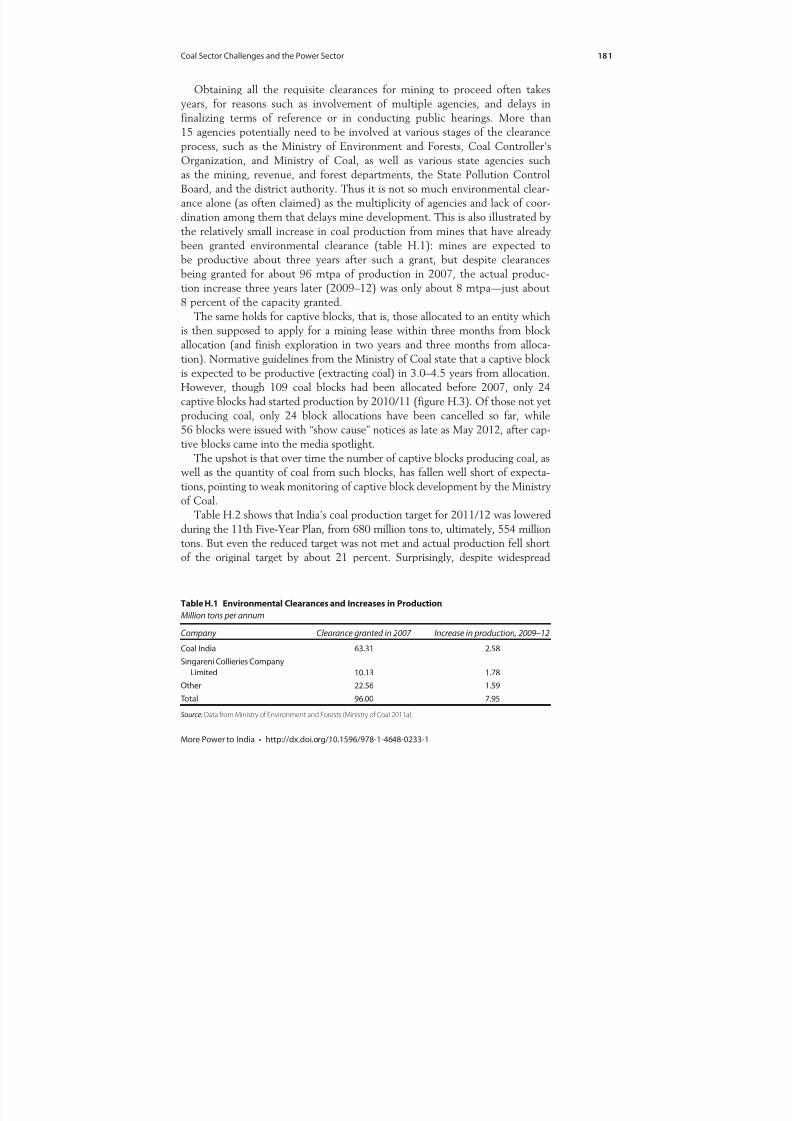
8/20/2019 WB - India Discom Report - Feb15
http://slidepdf.com/reader/full/wb-india-discom-report-feb15 205/255
Coal Sector Challenges and the Power Sector 181
More Power to India • http://dx.doi.org/10.1596/978-1-4648-0233-1
Obtaining all the requisite clearances for mining to proceed often takes
years, for reasons such as involvement of multiple agencies, and delays in
finalizing terms of reference or in conducting public hearings. More than
15 agencies potentially need to be involved at various stages of the clearanceprocess, such as the Ministry of Environment and Forests, Coal Controller’s
Organization, and Ministry of Coal, as well as various state agencies such
as the mining, revenue, and forest departments, the State Pollution Control
Board, and the district authority. Thus it is not so much environmental clear-
ance alone (as often claimed) as the multiplicity of agencies and lack of coor-
dination among them that delays mine development. This is also illustrated by
the relatively small increase in coal production from mines that have already
been granted environmental clearance (table H.1): mines are expected to
be productive about three years after such a grant, but despite clearances
being granted for about 96 mtpa of production in 2007, the actual produc-tion increase three years later (2009–12) was only about 8 mtpa—just about
8 percent of the capacity granted.
The same holds for captive blocks, that is, those allocated to an entity which
is then supposed to apply for a mining lease within three months from block
allocation (and finish exploration in two years and three months from alloca-
tion). Normative guidelines from the Ministry of Coal state that a captive block
is expected to be productive (extracting coal) in 3.0–4.5 years from allocation.
However, though 109 coal blocks had been allocated before 2007, only 24
captive blocks had started production by 2010/11 (figure H.3). Of those not yet
producing coal, only 24 block allocations have been cancelled so far, while56 blocks were issued with “show cause” notices as late as May 2012, after cap-
tive blocks came into the media spotlight.
The upshot is that over time the number of captive blocks producing coal, as
well as the quantity of coal from such blocks, has fallen well short of expecta-
tions, pointing to weak monitoring of captive block development by the Ministry
of Coal.
Table H.2 shows that India’s coal production target for 2011/12 was lowered
during the 11th Five-Year Plan, from 680 million tons to, ultimately, 554 million
tons. But even the reduced target was not met and actual production fell shortof the original target by about 21 percent. Surprisingly, despite widespread
Table H.1 Environmental Clearances and Increases in Production
Million tons per annum
Company Clearance granted in 2007 Increase in production, 2009–12
Coal India 63.31 2.58
Singareni Collieries Company
Limited 10.13 1.78
Other 22.56 1.59 Total 96.00 7.95
Source: Data from Ministry of Environment and Forests (Ministry of Coal 2011a).
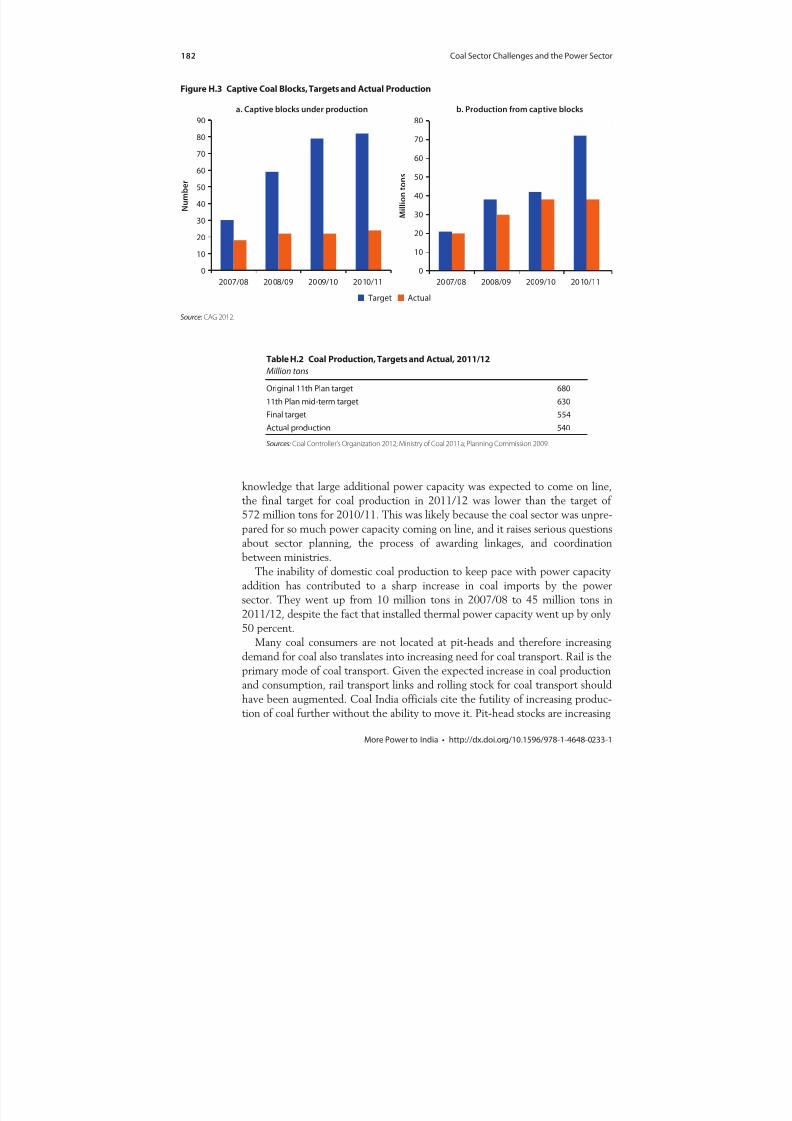
8/20/2019 WB - India Discom Report - Feb15
http://slidepdf.com/reader/full/wb-india-discom-report-feb15 206/255
182 Coal Sector Challenges and the Power Sector
More Power to India • http://dx.doi.org/10.1596/978-1-4648-0233-1
knowledge that large additional power capacity was expected to come on line,
the final target for coal production in 2011/12 was lower than the target of
572 million tons for 2010/11. This was likely because the coal sector was unpre-
pared for so much power capacity coming on line, and it raises serious questions
about sector planning, the process of awarding linkages, and coordinationbetween ministries.
The inability of domestic coal production to keep pace with power capacity
addition has contributed to a sharp increase in coal imports by the power
sector. They went up from 10 million tons in 2007/08 to 45 million tons in
2011/12, despite the fact that installed thermal power capacity went up by only
50 percent.
Many coal consumers are not located at pit-heads and therefore increasing
demand for coal also translates into increasing need for coal transport. Rail is the
primary mode of coal transport. Given the expected increase in coal production
and consumption, rail transport links and rolling stock for coal transport shouldhave been augmented. Coal India officials cite the futility of increasing produc-
tion of coal further without the ability to move it. Pit-head stocks are increasing
Figure H.3 Captive Coal Blocks, Targets and Actual Production
Source: CAG 2012.
Target Actual
0
10
20
30
40
50
60
70
80
90
2007/08 2008/09 2009/10 2010/11
N u m b e r
a. Captive blocks under production b. Production from captive blocks
0
10
20
30
40
50
60
70
80
2007/08 2008/09 2009/10 2010/11
M i l l i o n t o n s
Table H.2 Coal Production, Targets and Actual, 2011/12
Million tons
Original 11th Plan target 680
11th Plan mid-term target 630
Final target 554
Actual production 540
Sources: Coal Controller’s Organization 2012; Ministry of Coal 2011a; Planning Commission 2009.

8/20/2019 WB - India Discom Report - Feb15
http://slidepdf.com/reader/full/wb-india-discom-report-feb15 207/255
Coal Sector Challenges and the Power Sector 183
More Power to India • http://dx.doi.org/10.1596/978-1-4648-0233-1
much faster than annual offtake. Inefficiencies are also seen in coal linkages,
absent an attempt to optimize transportation. There are numerous examples in
which either coal linkages or captive blocks have been assigned without consid-
eration for transportation overheads.Looking ahead, the coal sector’s challenges require a comprehensive approach,
involving numerous stakeholders, to address many of the issues identified above.
An interministerial Apex Committee (coal, power, rail, environment and forests,
iron and steel, industry, finance, the Prime Minister’s Office, and the Planning
Commission) should transparently consult with, and consider suggestions from,
all stakeholders including coal producers, consumers, social and environmental
activists, academics, coal-washing organizations, consultants, logistics organiza-
tions, and anyone else considering themselves interested parties. Agendas and
minutes of these meetings and consultations should be in the public domain, and
all reports prepared by committees on coal should also be disseminated widely,after incorporating feedback.
The root cause of the current problem is that much more coal has been
promised to consumers than is realistically possible for Coal India to supply. All
existing coal linkages will need to be reviewed and optimized to reduce coal
transportation requirements. Linkages of end-use plants whose progress is unsat-
isfactory could be reassigned to different end users who have shown greater
progress.
One of the options the government has been considering to address the down-
stream cost impact of imports is the use of pooled prices. In July 2012, Coal India
reported plans to import up to 30 million tons of coal in order to meet risingdomestic demand and to mitigate power shortages. However, as the imported
coal price would be based on gross calorific value, following international trading
practice, and Indian domestic coal pricing would be based on useful heat value,
it can be assumed that a combined or pooled price would be higher than current
domestic coal prices paid by thermal power plants.
In addition, coal imports and their delivery will require considerable logistical
capability and planning:
•
Coordinated transport arrangements for ports, rail, loading and unloading facil-ities, etc. are not in place—constraining imported coal movements—and true
pooling may not be physically possible. Lessons learned from logistics prob-
lems with imported coal in 2012 should be carefully reviewed.
• Domestic coal raises similar logistical challenges due to uneven geographic
allocation of India’s own coal resources:
– Most of India’s reserves are in the East—Jharkhand, Orissa, and West
Bengal. This region has 173.12 billion tons (62.7 percent) of reserves with
293 mines owned by Eastern Coalfield Ltd, Bharat Coking Coal Ltd,
Central Coalfield Ltd, Mahanadi Coalfield Ltd and some private players.
This region produced around 232.6 million tons in 2010–11. – In the Western region coal reserves are in Chhattisgarh, Madhya Pradesh,
and Maharashtra. The region has 79 billion tons (28.6 percent) of reserves
8/20/2019 WB - India Discom Report - Feb15
http://slidepdf.com/reader/full/wb-india-discom-report-feb15 208/255
184 Coal Sector Challenges and the Power Sector
More Power to India • http://dx.doi.org/10.1596/978-1-4648-0233-1
with 186 mines owned by Western Coalfield Ltd, South Eastern Coalfield
Ltd, and others. It produced 223.6 million tons in 2010–11.
– The Southern region has 22.01 billion tons (8 percent) of reserves,
mainly in Andhra Pradesh. It has 67 mines owned by Singareni CollieriesCompany Ltd and some others; the region produced 51.333 million tons
in 2010–11.
• While it seems difficult to pool coal in physical terms because of logistical
challenges, it is much easier to pool in pricing terms (for example, the weighted
average of import and domestic costs). However, the impacts are likely to be
highly unequal. Those power generators—generally public—that have access
to cheap domestic coal will suddenly face a hike in input costs. And those reli-
ant on expensive, imported coal—generally private—will benefit from a lower
average price.
• Price pooling is a pure redistribution from the state sector (and eventually theconsumer) in favor of private power producers.
International Experience with Coal for Power Generation
The organization of the coal-mining sector and its links to power generation
vary widely among countries (table H.3). It ranges from a fully privatized coal
and power sector where the market decides the demand, supply, and therefore
pricing (as in Canada, the United Kingdom, and the United States); to a par-
tially regulated power or coal sector with subsidized end-user prices of elec-
tricity (as in China, India, Indonesia, and South Africa); and all the way to atightly regulated monopoly market of state-owned enterprises (as in Vietnam).
Lack of coordination between the power and coal sectors in many of these
countries emanates from ineffective market organization, competition with
export markets, transportation bottlenecks, and a feeble institutional setup that
lacks regulatory oversight.
In countries rich in coal reserves like Australia, Indonesia, Poland, and South
Africa, domestic power plants often have to compete with the coal export
market. When the price of coal in the international market is high, coal compa-
nies tend to export good-quality coal while providing the power plants withlower-quality coal. In such situations, power plants have to find shorter-term coal
contracts at higher spot prices that often increase the cost of electricity. To avoid
that, the Indonesian government in 2009 came up with the “Domestic Market
Obligation,” which makes it binding for coal companies to supply part of their
production to the domestic market.
Similarly, a lack of coordination in planning for the coal sector in the face of
increasing power demand leads to supply shortages, as seen in South Africa’s
power crisis of 2008. As the production capacity of ESKOM (the state-owned
power company) surpassed existing coal contracts, power shortages were immi-
nent. Thus ESKOM launched a forum for government departments and enter-prises to work together. A second initiative was the South African Coal Roadmap,

8/20/2019 WB - India Discom Report - Feb15
http://slidepdf.com/reader/full/wb-india-discom-report-feb15 209/255
1 8 5
Table H.3 Coal Production, Market Structure, and Regulation: Some International Examples
Country
Coal
produced
(1,000 tons)
Coal
consumed
(1,000 tons)
Coal market
structure
Power market
structure Coal market regulator
Transportation
bottleneck
Australia 402,237 133,650 Competitive:
Dominated by 4
big companies
Competitive Absent Rail constraints in
transporting coal to
power sector and for
export.
Canada 67,114 43,025 Competitive: 8
publicly traded
companies
Competitive Federal Minerals
and Metals
Policy by Natural
Resources Canada
(NRCan) ensures
competitiveness in
mineral industry.
Coal is transported
using rail and
roads. No major
bottlenecks.
China 3,418,766 3,501,294 Decentralized:
Previously state
owned and
local mines
administered
by provincial
authorities, and
individually/
community-
owned township
and private
mines
Partly
deregulated:
Dominated by
5 companies
that emerged
from former
state power
company
State Economic and Trade
Commission (SETC)
oversees the market.
Industrial Management
department of SETC
coordinates the coal,
rail, and electricity
sectors.
Rail infrastructure is
inadequate leading
to accumulation of
coal stockpiles at
mines.
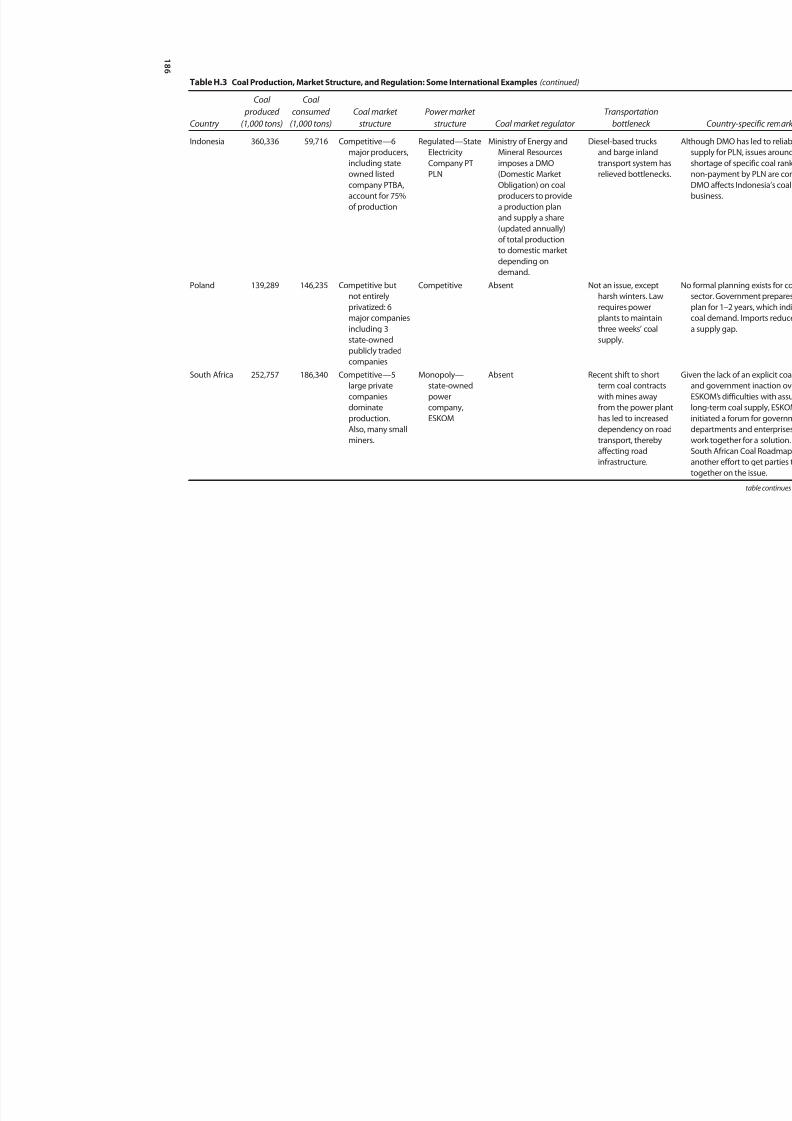
8/20/2019 WB - India Discom Report - Feb15
http://slidepdf.com/reader/full/wb-india-discom-report-feb15 210/255
1 8 6
Table H.3 Coal Production, Market Structure, and Regulation: Some International Examples (continued)
Country
Coal
produced
(1,000 tons)
Coal
consumed
(1,000 tons)
Coal market
structure
Power market
structure Coal market regulator
Transportation
bottleneck
Indonesia 360,336 59,716 Competitive—6
major producers,
including state
owned listed
company PTBA,
account for 75%
of production
Regulated—State
Electricity
Company PT
PLN
Ministry of Energy and
Mineral Resources
imposes a DMO
(Domestic Market
Obligation) on coal
producers to provide
a production plan
and supply a share
(updated annually)
of total production
to domestic market
depending on
demand.
Diesel-based trucks
and barge inland
transport system has
relieved bottlenecks.
Poland 139,289 146,235 Competitive but
not entirely
privatized: 6
major companies
including 3
state-owned
publicly traded
companies
Competitive Absent Not an issue, except
harsh winters. Law
requires power
plants to maintain
three weeks’ coal
supply.
South Africa 252,757 186,340 Competitive—5
large private
companies
dominateproduction.
Also, many small
miners.
Monopoly—
state-owned
power
company,ESKOM
Absent Recent shift to short
term coal contracts
with mines away
from the power planthas led to increased
dependency on road
transport, thereby
affecting road
infrastructure.
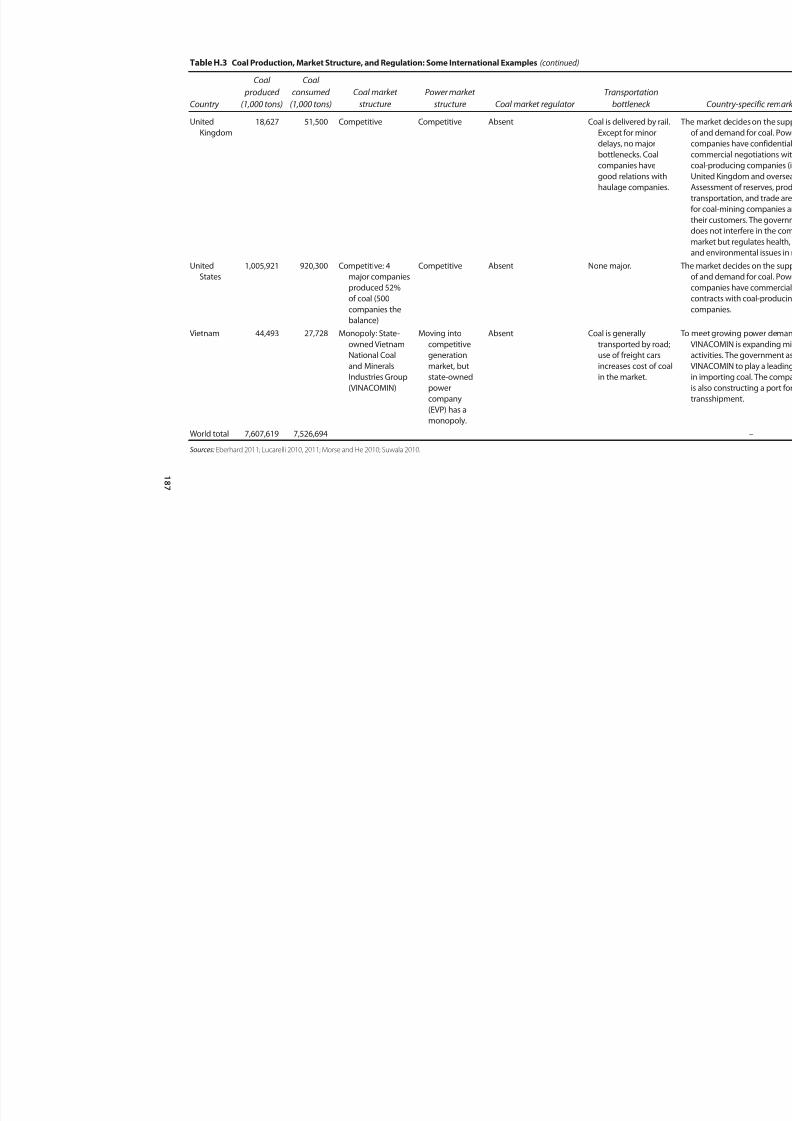
8/20/2019 WB - India Discom Report - Feb15
http://slidepdf.com/reader/full/wb-india-discom-report-feb15 211/255
1 8 7
Table H.3 Coal Production, Market Structure, and Regulation: Some International Examples (continued)
Country
Coal
produced
(1,000 tons)
Coal
consumed
(1,000 tons)
Coal market
structure
Power market
structure Coal market regulator
Transportation
bottleneck
United
Kingdom
18,627 51,500 Competitive Competitive Absent Coal is delivered by rail.
Except for minordelays, no major
bottlenecks. Coal
companies have
good relations with
haulage companies.
United
States
1,005,921 920,300 Competitive: 4
major companies
produced 52%
of coal (500
companies the
balance)
Competitive Absent None major.
Vietnam 44,493 27,728 Monopoly: State-
owned Vietnam
National Coal
and Minerals
Industries Group
(VINACOMIN)
Moving into
competitive
generation
market, but
state-owned
power
company
(EVP) has amonopoly.
Absent Coal is generally
transported by road;
use of freight cars
increases cost of coal
in the market.
World total 7,607,619 7,526,694 – – – –
Sources: Eberhard 2011; Lucarelli 2010, 2011; Morse and He 2010; Suwala 2010.
8/20/2019 WB - India Discom Report - Feb15
http://slidepdf.com/reader/full/wb-india-discom-report-feb15 212/255
188 Coal Sector Challenges and the Power Sector
More Power to India • http://dx.doi.org/10.1596/978-1-4648-0233-1
which engages stakeholders to facilitate policy, planning, and strategy develop-
ment in this sector.
Renewal and renegotiation of long-term contracts between power companies
and the coal sector is another area of concern in many countries. Competitionfrom the export market aside, this is also driven by regulated end-user prices of
electricity and nonpayment of bills by monopsonist power companies. Since
2002, this has become a significant challenge for China. As the gap between
term-contract coal prices and spot market prices widens, tension between coal
producers and power generators has heightened. Coal producers have become
increasingly reluctant to enter into contracts, fearing that they will be locked into
prices that turn out too low, and key power producers are in turn reluctant to
pay the market price.
Another sector that affects both the supply and pricing of coal to power plants
is transport. For countries with mine-mouth power plants such as Australia,Poland, and South Africa, this transport constraint is insignificant. However,
countries that depend on road and rail transportation of coal over long distances
bear the impact of heavy vehicles that damage the transport infrastructure.
Furthermore, in many cases, development of infrastructure is not aligned or
coordinated with development of mining activities. In such situations, compa-
nies generally invest in their own transportation facilities (if permitted by law) or
tend to develop good relations with freight companies, as seen in the United
Kingdom. The Industrial Management department of the State Economic and
Trade Commission in China is a good example of an institutional setup that
coordinates the coal, rail, and electricity sectors.Countries with competitive coal and power markets have fewer chal-
lenges around coordinating the coal and power sectors, as contracts with
domestic or overseas coal companies are commercially driven, and require
less government involvement. In almost all the major coal-intensive devel-
oped economies (except Canada), there is no specific regulatory body to
oversee market performance and prevent abuse of market power. However,
as mining is a capital-intensive business, only a handful of companies in
Australia, Poland, South Africa, the United Kingdom, and the United States
now dominate the market, increasing concerns about the lack of a truly com-petitive market.
Although regulatory oversight of market performance is lacking in developed
countries, there is strong regulatory oversight on health, safety, and environmental
issues for coal mining. The Coal Authority of the United Kingdom, Natural
Resources Canada, and the Environmental Protection Agency in the United
States are examples.
Sources: Eberhard 2011; Lucarelli 2010, 2011; Morse and He 2010; Prayas Energy Group 2013; Suwala 2010.
ReferencesCAG (Comptroller and Auditor General of India). 2012. Performance Audit of Allocation
of Coal Blocks and Augmentation of Coal Production. New Delhi.

8/20/2019 WB - India Discom Report - Feb15
http://slidepdf.com/reader/full/wb-india-discom-report-feb15 213/255
Coal Sector Challenges and the Power Sector 189
More Power to India • http://dx.doi.org/10.1596/978-1-4648-0233-1
Coal Controller’s Organization. 2012. Provisional Coal Statistics 2011–2012. Governmentof India, Kolkata.
Eberhard, Anton. 2011. The Future of South African Coal: Market, Investment, and PolicyChallenges. Stanford University, Stanford, CA.
Lucarelli, Bart. 2010. The History and Future of Indonesia’s Coal Industry: Impact of Politicsand Regulatory Framework on Industry Structure and Performance. Stanford University,Stanford, CA.
———. 2011. Australia’s Black Coal Industry: Past Achievements and Future Challenges.Stanford University, Stanford, CA.
Ministry of Coal. 2011a. Report of the Working Group on Coal & Lignite for Formulation ofTwelfth Five Year Plan (2012–2017). Government of India, New Delhi.
———. 2011b. “Notice of the Standing Linkage Committee (Long-Term) on Power to beHeld on 18-4-2011.” http://www.coal.nic.in/130411.pdf.
Ministry of Power. 2007. Report of the Working Group on Power for the 11 Five-Year Plan.New Delhi.
Morse, Richard K., and Gang He. 2010. The World’s Greatest Coal Arbitrage: China’s CoalImport Behavior and Implications for the Global Coal Market . Stanford University,Stanford, CA.
Planning Commission. 2009. Mid Term Appraisal of the 11th Five Year Plan—Chapter 15:Energy. New Delhi: Government of India.
Prayas Energy Group. 2013. Black and Dirty: The Real Challenges Facing India’s CoalSector . Pune, India.
Suwala, Wojciech. 2010. Lessons Learned from the Restructuring of Poland’s Coal-Mining
Industry. International Institute for Sustainable Development, Switzerland.

8/20/2019 WB - India Discom Report - Feb15
http://slidepdf.com/reader/full/wb-india-discom-report-feb15 214/255

8/20/2019 WB - India Discom Report - Feb15
http://slidepdf.com/reader/full/wb-india-discom-report-feb15 215/255
191More Power to India • http://dx.doi.org/10.1596/978-1-4648-0233-1
Best Practices in Electricity Theft
Reduction
Electricity theft at the distribution end is fairly common in India. Though theft
is not explicitly measured, aggregate technical and commercial (AT&C) losses of
over 26 percent in 2011 suggest high levels of theft. Thieves employ a variety of
methods, including tampering with meters and seals, bypassing meters, and dam-
aging or removing meters; hooking directly onto bare wires or tapping under-
ground cables; or tapping terminals of overhead lines on the low-voltage side of
the transformer. First generation electronic meters are susceptible to interference
from electrostatic discharges or magnetic disturbances close by—and thieves
know this. In addition, theft can take the form of billing “irregularities” (often
with the connivance of meter readers) and unpaid power bills.
Electricity theft can be tackled through technical and nontechnical means.
Technical solutions used in India include the following:
• Implementing high-voltage distribution systems—that is, bringing high-
voltage supply as close as possible to point of use. This reduces technical
losses, because the higher voltage means there is less current flowing for
the same amount of power supplied, and commercial losses as well, because
high-tension voltage cannot be directly used by households and small com-mercial establishments (and it is more hazardous and complex to tap into
a high-tension line).
• Covering and bundling low-voltage lines (aerial bunched cables), which makes
tapping difficult.
• Using closed distribution boxes for low-voltage lines at the pole end so that
they cannot be tapped.
• Installing meters outside establishments (such as homes and buildings) on
service poles, which makes tampering visible, and, if theft is detected, painting
the meter black to indicate theft to the community.
• Removing the human interface from meter reading by using technologies suchas automated meter reading (AMR) and carrying out real-time energy audits
A P P E N D I X I

8/20/2019 WB - India Discom Report - Feb15
http://slidepdf.com/reader/full/wb-india-discom-report-feb15 216/255
192 Best Practices in Electricity Theft Reduction
More Power to India • http://dx.doi.org/10.1596/978-1-4648-0233-1
using software. AMR, which is increasingly used for large consumers (indus-
trial, commercial, and some domestic) has the advantage of generating real-
time data on consumption that utilities analyze for inconsistencies or sudden
changes, which may indicate interference with the meter, prompting timelyinvestigation and corroboration through site visits.
• Installing second-generation meters, which are shielded from interference.1
Nontechnical theft prevention measures include public outreach to increase
awareness of the importance of paying for electricity, better consumer service
(on-the-spot billing and collection, establishment of 24-hour call centers to
handle complaints), and legal and regulatory steps.
Similar measures have been adopted in other theft-prone areas of the
world (including Brazil and Nigeria). In Brazil, initial steps included customer
indexation (by geographic location and electrical feeder), regular communi-cation with customers, establishment of service centers (with key performance
indicators that include the average time taken to assist customers), and AMR
and automated alarm signals when nontechnical losses are detected. In addi-
tion, companies like CEMIG in the state of Minas Gerais use information
technology (IT) to trigger an inspection when consumption inconsistencies
are spotted, when complaints are received (both internal and external), and
when data mining indicates losses beyond the norm. AMPLA, a private
company in Rio de Janeiro state that distributes electricity in slums domi-
nated by drug traffickers, has adopted AMR for all its residential consumers.
As well as bunching low-voltage cables, it uses 10-meter electric utility polesthat are hard to climb and ensures that distribution boxes and connections
are difficult to reach. Every medium- and low-voltage transformer has a
meter, and there are relatively few customers per transformer, making it
rather easy to pinpoint and address problems, including theft. These measures
led to a 44 percent decline in annual supply interruptions between 2003 and
2004. For large consumers and corporates, moreover, meters are at a distance
from the user’s premises; multiple “sub”-meters are used to disaggregate the
load and enable easier location of the source of any inconsistencies; telemetry
is used; and motion detectors/sensors are incorporated into the meteringinfrastructure.2
The Nigerian utility, NEPA, has followed an initiative known as CREST
(Commercial Reorientation of the Electricity Sector: Toolkit) to reduce losses.
Ring-fenced “clusters” serving around 50,000 consumers are demarcated and
comprise a single network served by a 33/11 kilovolt (kV) substation with
about six 11 kV feeders facilitating energy audits (input and use) and presenting
a manageable business proposition for outsourcing various activities. CREST
involves the following key actions: metering of all customers; a regular increase
in the value of the estimated bill until meters have been put in place; electronic
and spot-billing of all customers; energy audit of distribution feeders; remotereading of major customers to eliminate fraud in meter reading; high-voltage
distribution systems to reduce theft and losses; internet-based customer records
8/20/2019 WB - India Discom Report - Feb15
http://slidepdf.com/reader/full/wb-india-discom-report-feb15 217/255
Best Practices in Electricity Theft Reduction 193
More Power to India • http://dx.doi.org/10.1596/978-1-4648-0233-1
for greater transparency and information; customer service centers for improv-
ing utility-customer interface; outsourced rapid response mobile customer ser-
vice units; outsourced retail areas such as housing estates, markets, and industrial
areas on a bulk-metering basis to contain illegal connections, improve service,and increase revenues; and a focus on collecting government receivables.
In India, Tata Power Delhi Distribution Ltd has brought down its AT&C losses
from 53 percent to 11 percent over 10 years with various measures, including
universal metering in the service area using tamper-resistant electronic meters,
often encased in boxes; AMR for high-revenue customers; data analysis to detect
theft; high-voltage distribution systems and replacement of bare overhead lines
with aerial bunched cables; periodic energy audits of feeders from power-import
points to distribution transformers to identify leaks and prioritize actions in high-
loss areas; advanced IT applications and process reengineering (enterprise
resource planning, Supervisory Control and Data Acquisition, geographic infor-mation system mapping, billing and customer relationship management, etc.)
to improve commercial processes; and fast-track of settlement of theft cases
through public hearings and forums.
Several other Indian states have also been quite successful in reducing electric-
ity losses, partly due to the implementation of theft-prevention measures, includ-
ing IT and other technical solutions. Of the top 10 AT&C loss-cutting states,3
seven have brought in technical interventions similar to those used by Tata Power
Delhi Distribution Ltd and other utilities in Delhi, and five have improved their
billing processes using IT. Several states have adopted feeder segregation. Some
states such as Haryana have tried nontechnical approaches such as creatingincentives for consumers and employees to report theft, but these have shown
limited success.
Twenty-two of India’s 29 states have received state government support in the
form of special courts for prosecuting electricity theft. These courts have expe-
dited processing of cases of theft and recovery of penalties, and have been rela-
tively active. In Madhya Pradesh, for example, they have solved over 25,000 cases
since they were set up in 2010 (many of these cases were pending a decision at
the time). Evidence is not yet available as to whether the courts have led to a
decrease in theft.Indian states have also established special police stations for handling theft,
though the exigencies of maintaining law and order mean that this is often sim-
ply in theory. In many states (including Rajasthan and Andhra Pradesh), police
stations are partly funded by discoms. In Rajasthan, human resources are deputed
from the police department. Haryana has adopted electronic filing of complaints
(about theft) by the utility to the police stations. Haryana has also significantly
stepped up vigilance activities by setting and notifying targets for checking and
recovery of dues and maintaining an electronic record of such activities. In other
states, the special police stations have enabled the detection of a large amount
(by value) of electricity theft, though the utilities have only been able to collectabout half the penalty amount assessed. For example, in Rajasthan in 2010,
Rs 949 million ($20 million) was assessed for electricity theft by the utilities’
8/20/2019 WB - India Discom Report - Feb15
http://slidepdf.com/reader/full/wb-india-discom-report-feb15 218/255
194 Best Practices in Electricity Theft Reduction
More Power to India • http://dx.doi.org/10.1596/978-1-4648-0233-1
vigilance wings, but only Rs 461 million ($9.9 million) was received by the
utility; the situation was similar in Andhra Pradesh in 2008 and 2009.
Theft prevention support can also come from the regulator. For example, the
regulator in Madhya Pradesh took suo motu action to put in place a procedurefor provisional billing in extreme cases of electricity theft. Regulators in Delhi
and Gujarat have issued regulations on assessing the size of energy theft, includ-
ing for calculating the penalty amount. This has increased transparency and
consistency of treatment of energy theft.
That said, as of April 2013, the four highest-ranking states in terms of reported
numbers of cases of theft over the past four years were Madhya Pradesh,
Haryana, Uttar Pradesh, and Delhi.4
Notes
1. Since the installed base of meters cannot be replaced overnight, this solution is not easy. To stay ahead, in fact, some utilities, including Tata Power Delhi Distribution Ltd, monitor the technologies used in meter tampering, which lets them revise the meters’ manufacturing specifications.
2. Informal presentation (2010) of findings from a staff technical study tour of Brazilian power distribution companies.
3. By percentage reduction in 2003–11 these were Delhi, Kerala, Maharashtra, Gujarat, Rajasthan, Punjab, Karnataka, Tripura, Andhra Pradesh, and Nagaland.
4. The Ministry of Power, cited in India Today, April 1, 2013. Delhi is striking in that
theft is completely in the domestic consumer category. In the other states theft is also prevalent among industry, commercial, and agricultural consumers.
Reference
World Bank. 2009. Project Appraisal Document for Nigeria Electricity and Gas ImprovementProject (NEGIP). Washington, DC.
8/20/2019 WB - India Discom Report - Feb15
http://slidepdf.com/reader/full/wb-india-discom-report-feb15 219/255
195More Power to India • http://dx.doi.org/10.1596/978-1-4648-0233-1
Regulatory Assets: The Delhi Case
In 2002 the Delhi Vidyut Board was unbundled into three (privately owned)
distribution companies (discoms), a transmission company, a generation com-
pany, and a holding company that held most of the Board’s pre-privatization
liabilities. A five-year transition period was announced, in which all discoms
would provide electricity to their consumers at the same rates, and bring down
aggregate technical and commercial losses by 17 percent. During the period all
discoms had to buy power from the transmission utility, Delhi Transmission
Company Ltd, at subsidized rates and sell it to consumers at a rate determined
by the Delhi Electricity Regulatory Commission (DERC). After five years, the
subsidy was to be withdrawn and discom tariffs would be set by the DERC basedon the utility’s cost of service. The pricing mechanism, as worked out by the
DERC, is based on the annual revenue requirement, which includes a 16 percent
post-tax return on equity as assured profit.
Once the regulator has accepted the expenses leading to an agreed annual rev-
enue requirement, there is an implied tariff hike to be borne by consumers. At this
point, the DERC may exercise discretion to create a so-called “regulatory asset”: if
the regulator recognizes that a discom needs to be paid Rs 100 ($2) but feels this
will burden consumers who can pay just Rs 60 ($1.20), Rs 40 ($0.80) is classified
by the regulator as a “regulatory asset,” which is an outstanding receivable owed to
the discoms, on which 13–14 percent interest will be paid the following year, as acarrying cost. Simply put, regulatory assets are dues that have not been paid to the
discoms and can be recovered from consumers in the future by way of tariffs.
As of 2013, the regulatory assets of the three Delhi discoms stand at close to
Rs 70 billion ($1.5 billion) with the interest on the principal mounting. While
the Appellate Tribunal for Electricity has said the carrying cost of regulatory
assets should be paid to utilities every year in order to avoid cash-flow problems,1
regulatory assets continue to pile up and utilities are unlikely to be able to retire
them in the requisite three years. Three further problems are emerging with
regulatory assets:
• Delays in “truing up” add up to the size of the regulatory assets—retail tariffs
are always awarded at the start of the year on the basis of the discom’s expected
A P P E N D I X J

8/20/2019 WB - India Discom Report - Feb15
http://slidepdf.com/reader/full/wb-india-discom-report-feb15 220/255
196 Regulatory Assets: The Delhi Case
More Power to India • http://dx.doi.org/10.1596/978-1-4648-0233-1
operating costs, but if the costs and revenues are different from what is
projected, these additional gaps are fixed by “truing up” the following year.
• In several cases, to keep initial tariffs low, regulators have also been known
to assign lower power purchase costs than the figures used by discoms to proj-ect their revenue requirements at the beginning of the year. When the “truing
up” takes place after a year or two, there is a sudden swelling in the regulatory
asset base.
• Due to cash-flow constraints, discoms have ended up borrowing at high inter-
est rates to finance power purchases. If their regulatory assets are not liqui-
dated soon, the interest burden will continue to mount and their financial
positions become untenable, with an increasingly remote chance of recovering
the full amount due since this would require unrealistically high tariff hikes to
be imposed on end users.2 Consumers are now fighting very frequent tariff
hikes and demanding greater transparency. They are also seeking to hold theregulator accountable for how it has been assessing “eligible expenditures”
within the tariff petitions submitted by the discoms. Tariffs have reportedly
increased by 65 percent since privatization, whereas costs of power purchase
have increased by 300 percent.
The regulatory asset problem is not confined to Delhi. Nationwide it is esti-
mated that regulatory assets have reached over Rs 700 billion ($15 billion) and
that just the interest cost adds up to around Rs 95 billion ($2 billion) a year. Tamil
Nadu has seen its regulatory assets swell to nearly Rs 200 billion ($4.3 billion)
from Rs 79 billion ($1.7 billion) in 2010–11. In Haryana, regulatory assets havenearly doubled to Rs 13 billion ($0.03 billion) from Rs 7.24 billion ($0.16 billion)
in 2009–10. Regulatory assets in West Bengal have increased to Rs 21 billion
($0.45 billion) in 2012/13 from Rs 1.57 billion ($433 million) in 2010/11.3
Discoms with mounting regulatory assets are facing increasing cash-flow
problems, jeopardizing their functioning. Borrowing against regulatory assets is
becoming less feasible: since commercial banks are not sure how to value regula-
tory assets that may or may not be worth their face value, discoms can no longer
borrow up to the full amount of the regulatory assets they own. Proposals
that have been floated include three options for raising funds in order to retirethe regulatory assets of the Delhi discoms, rather than imposing continued
uncertainty on them about when and how fast their state electricity regulatory
commission–approved claims (regulatory assets) can actually be recovered from
consumers through the tariff:
• Allow the discoms to issue tax-free bonds offering an 8 percent coupon; or
• Allow the Power Finance Corporation/Rural Electrification Corporation
(PFC/REC) to issue tax-free bonds offering an 8 percent coupon, and that
PFC/REC onlends the proceeds to the discom at 8.5 percent a year for a period
deemed adequate to ensure that the full principal owed to the discoms can berecovered through tariff increases; or

8/20/2019 WB - India Discom Report - Feb15
http://slidepdf.com/reader/full/wb-india-discom-report-feb15 221/255
Regulatory Assets: The Delhi Case 197
More Power to India • http://dx.doi.org/10.1596/978-1-4648-0233-1
• Allow PFC/REC to directly finance (through fresh loans at their regular
lending rate) the amounts owed to discoms, which are being held by discoms
as illiquid regulatory assets, for a period corresponding to the requirement to
reasonably recover these charges from consumers through the tariff.4
Assuming that the full amount owed can be reasonably recovered from con-
sumers within the same period (say eight years) under each scenario, the discoms
would accrue the highest benefit under the first option, involving the direct issu-
ance of tax-free bonds—of particular interest to investors in the highest tax
bracket.
Sources: ICRA 2012; Nair 2013; Sethi 2013.
Notes 1. Appellate Tribunal’s Order of November 11, 2011: The recovery of the Regulatory
Asset (RA) should be time-bound and within a period not exceeding three years at the most and preferably within the control period. The carrying cost of the RA should be allowed to the utilities in the annual revenue requirement of the year in which the RA is created to avoid the problem of cash flow to the distribution licensee.
2. It has been estimated that consumer tariffs would have to increase more than three times overnight, with electricity consumption remaining unchanged, in order to fully pay discoms what they are owed in the form of RAs.
3. However, in these states the RAs are captured in the package of short-term loans
being arranged for SEBs by the center; this does not apply to Delhi discoms. 4. This is actually already the practice for RAs of state electricity boards (with a state
guarantee to PFC/REC), but is at present not allowed for private discoms or joint ventures. One of the Delhi discoms has proposed that this distinction be erased, and that PFC/REC also be allowed to bridge finance the uncollected RAs for private dis-coms, without a state guarantee.
References
ICRA (Investment Information and Credit Rating Agency of India). 2012. State-Owned
Electricity Distribution Companies: Some Positives, Though Several Concerns Remain. New Delhi.
Nair, Viraj. 2013. “Discoms Weighed Down by Rs 70,000-Crore Dues.” Indian Express,June 24. http://www.indianexpress.com/news/discoms-weighed-down-by-rs-70000crore-dues/1132922/.
Sethi, Aman. 2013. “The Price of Power.” The Hindu. http://www.hindu.com.

8/20/2019 WB - India Discom Report - Feb15
http://slidepdf.com/reader/full/wb-india-discom-report-feb15 222/255

8/20/2019 WB - India Discom Report - Feb15
http://slidepdf.com/reader/full/wb-india-discom-report-feb15 223/255
199More Power to India • http://dx.doi.org/10.1596/978-1-4648-0233-1
A Strategic Model to Improve
Distribution Performance—Enersis
in Chile
In 1982, Chile became the first Latin American country to introduce wide-ranging
reforms in its power sector. Its private distribution companies (discoms), such as
Enersis, which was originally responsible for distribution in the Santiago metro-
politan region, have been pioneers in improving operational efficiency. Enersis
has since expanded into generation and distribution in other Latin American
countries, including Argentina, Brazil, Colombia, and Peru. Enersis invested
about $1.2 billion taking over Codensa, the discom serving Bogotá, the capital of
Colombia, in 1998. It designed and implemented a strategic model and related
action plans to restructure Codensa, with impressive outcomes.
Codensa’s productivity reached 2,100 customers per employee, through
downsizing combined with outsourcing of a variety of services associated with
network expansion and maintenance, information technology (IT), and installa-
tion of metering devices. The quality of service improved greatly: average inter-
ruption time was reduced by more than 70 percent (from 6.3 hours in 1997 to
2 hours in 2002), and the interruption frequency declined by more than
70 percent (from 11.4 hertz in 1997 to 3.1 hertz in 2002).1
Total distributionlosses steadily declined from 22 percent in 1997 to 9 percent in 2007, with a
positive impact on the company’s bottom line.
The strategic model followed by Enersis to achieve and sustain market disci-
pline comprises actions in regulation, commercial management, technical man-
agement, training and management of external contractors (outsourced services),
community engagement, and IT—as well as punitive measures. Highlights
include Enersis working with sector authorities and the regulator to achieve:
• A tariff structure that would allow financial sustainability of efficiently
managed discoms.
A P P E N D I X K
8/20/2019 WB - India Discom Report - Feb15
http://slidepdf.com/reader/full/wb-india-discom-report-feb15 224/255
200 A Strategic Model to Improve Distribution Performance—Enersis in Chile
More Power to India • http://dx.doi.org/10.1596/978-1-4648-0233-1
• Tariff rates reflecting costs of efficiently meeting service quality standards,
assuring a fair and reasonable equilibrium between electricity consumers and
service providers.
•
Generation of funds to subsidize low-income and other customers throughtariff rates and/or additional charges paid by selected categories of customers,
government budgets, grants, or a combination thereof.
• Use of technologies that assure environmentally sustainable and low-cost
supply.
The main steps to improve commercial management entailed:
• Integrating the management of metering, meter-reading, billing, collection,
disconnection–reconnection, and inspection of meters.
• Enhancing customer service and programs for payment of old debts andregularization of connections.
• Increasing the number of points of contact for customer service to move the
company closer to its clients.
• Developing marketing programs to create awareness that electricity is a
commercial good with a price.
• Transparent communication to provide customers with information on their
rights and obligations.
Technical steps included:
• Construction of distribution networks that are less vulnerable to tampering
and irregular connections.
• Systematic field assessments looking for irregular connections, tampered or
damaged consumption meters, and unmetered consumers (customers and
irregular users).
• Use of boxes to ensure that the consumption meters are properly sealed and
cannot be tampered with.
• Use of boxes to seal customer connections.
•
Monitoring of public lighting services.• Monitoring of operational condition of installed seals.
Community engagement involved the following:
• Establishing direct, open contact with communities, their leaders, and the
authorities involved to create awareness that electricity is a commercial good
with a price and that electricity consumption should be rationalized and
efficient.
• Designing and executing campaigns on the culture of regular payment of elec-
tricity bills, preserving electricity infrastructure, and behaving safely to avoidelectrocution.
8/20/2019 WB - India Discom Report - Feb15
http://slidepdf.com/reader/full/wb-india-discom-report-feb15 225/255
A Strategic Model to Improve Distribution Performance—Enersis in Chile 201
More Power to India • http://dx.doi.org/10.1596/978-1-4648-0233-1
Investments in IT required:
• Use of management information systems (MIS) to support commercial and
technical functions.• Development of databases for each MIS, with regular updates and field audits
to assure consistency with physical reality.
• Progressive application of automated meter reading devices for monitoring
consumption of large and medium-sized consumers.
• Systematic field action on irregular service conditions detected through the
commercial MIS.
• Regular updates to ensure inclusion of users into the customer database.
Punitive approaches involved:
• Collaboration with the judiciary to ensure effective action in cases of electricity
theft.
• Systematic presentation before the courts of law of cases involving large
consumers.
• Police action when required.
• Recovery of old debts in selected cases through judicial actions.
• Publicity to instances of electricity theft involving prominent members of
society, to promote social condemnation.
Source: World Bank 2013.
Note
1. “Experience in Reduction and Monitoring of Nontechnical Losses in Latin America”. Enersis-Endesa. Presentation to government officials of the Dominican Republic by José Inostroza (CEO-Codensa), February 2005.
Reference
World Bank. 2013. International Experience with Private Sector Participation and Open Accessin Power Grids. Energy Sector Management Assistance Program, Washington, DC.

8/20/2019 WB - India Discom Report - Feb15
http://slidepdf.com/reader/full/wb-india-discom-report-feb15 226/255

8/20/2019 WB - India Discom Report - Feb15
http://slidepdf.com/reader/full/wb-india-discom-report-feb15 227/255
203More Power to India • http://dx.doi.org/10.1596/978-1-4648-0233-1
Separation of Carriage and Content
in Distribution—Potential Benefits
and International Experience
The introduction of retail competition in power markets through the separation
of carriage and content is expected to generate large benefits. The logic is clear:
multiple retail suppliers will compete for customers based on reliability and ser-
vice, and prices will fall. The distribution network (wires business) will receive
investment upgrades because it is accountable for aggregate technical and com-
mercial (AT&C) losses. The Indian case is examined first, followed by
New Zealand, the United States, and Europe.1 Lessons from these international
experiences are looked at last.
India
The Electricity Act 2003 foresees competition in the distribution segment, in
part through the separation of the wires business (carriage) from the retail supply
(content) business. To date however, competition, and the benefits of price dis-
covery and private participation, have been largely confined to generation.
Distribution licensees in India, mostly state government–owned distributioncompanies (discoms), remain “bundled” in the sense that the wires and the sup-
ply business are combined. Even under the few urban franchise operations, the
retail customer is unable to benefit from competition among retail suppliers.
Through the introduction of contractual agreements for carriage of electricity
over the network, the segregation of wires and supply could help achieve a num-
ber of objectives. The owner of the network, who receives payment for “carriage,”
becomes accountable for losses incurred and discrepancies between the metered
quantity of power injected into the system versus the metered quantity of power
delivered.
A P P E N D I X L

8/20/2019 WB - India Discom Report - Feb15
http://slidepdf.com/reader/full/wb-india-discom-report-feb15 228/255
204 Separation of Carriage and Content in Distribution—Potential Benefits and International Experience
More Power to India • http://dx.doi.org/10.1596/978-1-4648-0233-1
The benefits of segregation include:
• Identifying and containing the wheeling costs of power by focusing on reduc-
ing technical losses.• Increasing the focus on wires system strengthening and development.
• Increasing accountability, transparency, and commercial prudence and thereby
reducing and controlling AT&C losses.
• Introducing competition in retail supply and offering consumers a choice of
supplier by commoditizing electricity.
• Improving customer service.
• Helping to develop an energy market.
• Achieving long-term commercial viability of the power sector by improving
efficiency. With separation of carriage and content, those (likely larger) cus-
tomers who prefer to directly procure power from the generator would stillincur wheeling charges, but no longer need to pay a cross-subsidy surcharge (as
they do now) because the erstwhile discom’s business model would change to
that of a wires business: its revenues would be mainly derived from wheeling
charges for the use of its network and it would rely less on earnings from the
retail customers it still serves. By contracting directly with generators, the very
largest customers (such as 1 megawatt [MW] and above) will thus act as their
own retail suppliers. In addition, some retail suppliers could choose to procure
additional power directly from a generator, and supply it to customers, for
instance, with a reliability surcharge.
One cautionary note here concerns institutional capacity at the state regulator
level. Appropriate regulation will be necessary, along with well-designed contrac-
tual clauses that penalize poor performance, in order to incentivize the state dis-
com, as the monopoly owner and operator of the network, to upgrade it, i.e. invest
in reduction of AT&C losses and strengthening of wires systems. The performance
of many state electricity regulatory commissions (SERCs) has not been exem-
plary even under the bundled model (before separation of carriage and content),
and it may be a challenge for them to take on this additional complexity.
Separating Carriage and Content Segregation needs to be accomplished gradually, while retaining government
(state discom) ownership of the monopoly wires network, at least initially. Some
ideas are:2
• Because the state discom is not well equipped to handle large investments in
loss reduction and upgrading of wires, the discom could competitively select a
set of operation and maintenance (O&M) subcontractors for concentric opera-
tional circles of the network.
• The O&M subcontractors would have service agreements with the discom,
and would be paid by it for improvements made to its wires as well as for the
8/20/2019 WB - India Discom Report - Feb15
http://slidepdf.com/reader/full/wb-india-discom-report-feb15 229/255
Separation of Carriage and Content in Distribution—Potential Benefits and International Experience 205
More Power to India • http://dx.doi.org/10.1596/978-1-4648-0233-1
O&M necessary to achieve the contracted service levels. In their operational
circles, they would be responsible for O&M to ensure network availability;
network strengthening and expansion; technical and commercial loss reduc-
tion; and consumer metering. This is similar to the responsibilities of distribu-tion franchises, although without the direct customer interface, which would
be the remit of the retail supplier(s). The discom’s role would be relatively
hands off. As the “owner” of the wires, its revenue stream would depend on
wheeling charges paid by competing retail suppliers.
• To avoid a breakdown of confidence between generators holding 25-year
power purchase agreements (PPAs) and the discom (in its new role of network
owner and operator without direct access to revenues from retail sales)3 during
the transition, a successor entity with the same creditworthiness as the “old
discom” is required to “take over” the existing contracts. A bulk procurer forthe state is proposed to be created on paper and to inherit all the contractual
obligations of the old discom. This would give comfort to generators that their
25-year contracts for power supply would continue to be honored during the
transition to full separation of the wires and supply businesses.
Multiple retail suppliers that source their own power, including from the bulk
procurer, for sale to consumers should be prequalified, competitively selected,
and licensed by the SERC. Initially the SERC should license and regulate the
retail supply business; over time, as competition takes off among retail suppliers,
the SERC may only license them and may deregulate the retail supply businessas margins charged by retailers will be better determined by competition. All
retailers will still pay wheeling charges for the wire service, which will be passed
through to consumers.4
The merits of this model are that the wires business is not simply handed over
to the state discom without further attention to how AT&C losses will be reduced,
but that private O&M operators are proposed to be contracted by the discom in
order to bring about loss reduction in operational circles; the bulk procurer pro-
vides continuity to the generators while taking the state discom out of being a
counterparty to PPAs, in keeping with its new wires-only focus; and retail suppli-ers gradually increase in number in order to provide consumers with the possibil-
ity of choice and benefits of competition among last-mile service providers.
New Zealand
Retail competition is thriving, meaning that separation of carriage and content
has been successfully concluded. Most New Zealand consumers have a choice of
20 retail brands selling power. The Electricity Industry Act of 2010 provided for
the electricity market to be governed by the Electricity Industry Participation
Code (the Code), overseen by the Electricity Authority, with effect fromNovember 2010. The Code promotes retail competition by specifying efficient
switching processes (from one supplier to another) and by allowing any party to
8/20/2019 WB - India Discom Report - Feb15
http://slidepdf.com/reader/full/wb-india-discom-report-feb15 230/255
206 Separation of Carriage and Content in Distribution—Potential Benefits and International Experience
More Power to India • http://dx.doi.org/10.1596/978-1-4648-0233-1
be an electricity retailer, provided that minimum standards are met. Retailers and
a few large, industrial customers typically buy electricity directly from the spot
market.
Institutional Underpinnings Are Crucial to Support Smooth Implementationof Retail Competition
• Consumer Switching Fund: To help strengthen competition in the retail
sector, the Act provided for the establishment of a 3.5 year Consumer
Switching Fund, for which the first initiative was an awareness campaign to
promote to consumers the benefits of comparing and switching retailers. In
partnership with the Ministry of Consumer Affairs and Consumer NZ, the
fund aims to improve the flow of information through the system, to increase
consumers’ readiness to switch suppliers, and as a result to permanently lockin pressure on retailers to produce innovative pricing plans and service offer-
ings. During the first 90 days of the campaign, over 390,000 people visited the
website and 128,000 switches took place.
• Metering: Metering is a critical part of retail market operations. The Code
specifies requirements for meter performance and maintenance including
meter suppliers’ responsibilities and standards for accreditation of metering
test houses. Twenty test houses are currently approved by the Authority to
certify that metering systems are operating accurately, and all test houses
are audited periodically. The rollout of advanced metering in New Zealandis a significant technological advance being led by retailers. The rollout is
voluntary and provided at no additional direct cost to consumers. Advanced
metering can allow consumers to analyze expenditures and control costs by
running appliances at least-cost times of the day and will play an important
part in the uptake of smart appliances and electric vehicles. It also enables
distributors and retailers to manage their portfolios more cost-effectively;
this eases pressure for investment in new generation, transmission, and dis-
tribution assets.
• Market Administration: The Authority contracts out the services required to
operate the retail and wholesale electricity markets, apart from the market
administration function, which it performs itself, such as appointing auditors
of metering test houses and metering installations and specifying backup
procedures in the event of a failure of market systems. Two separate private
contractors handle “registry” and “reconciliation.”
– Registry: This is managed by a competitively selected private contractor.
The registry is a national database containing information on 2 million
points of connection at which electricity is supplied. Referred to as
Installation Control Points, each one has a unique identifier which is usedin managing customer switching and reconciliation processes.
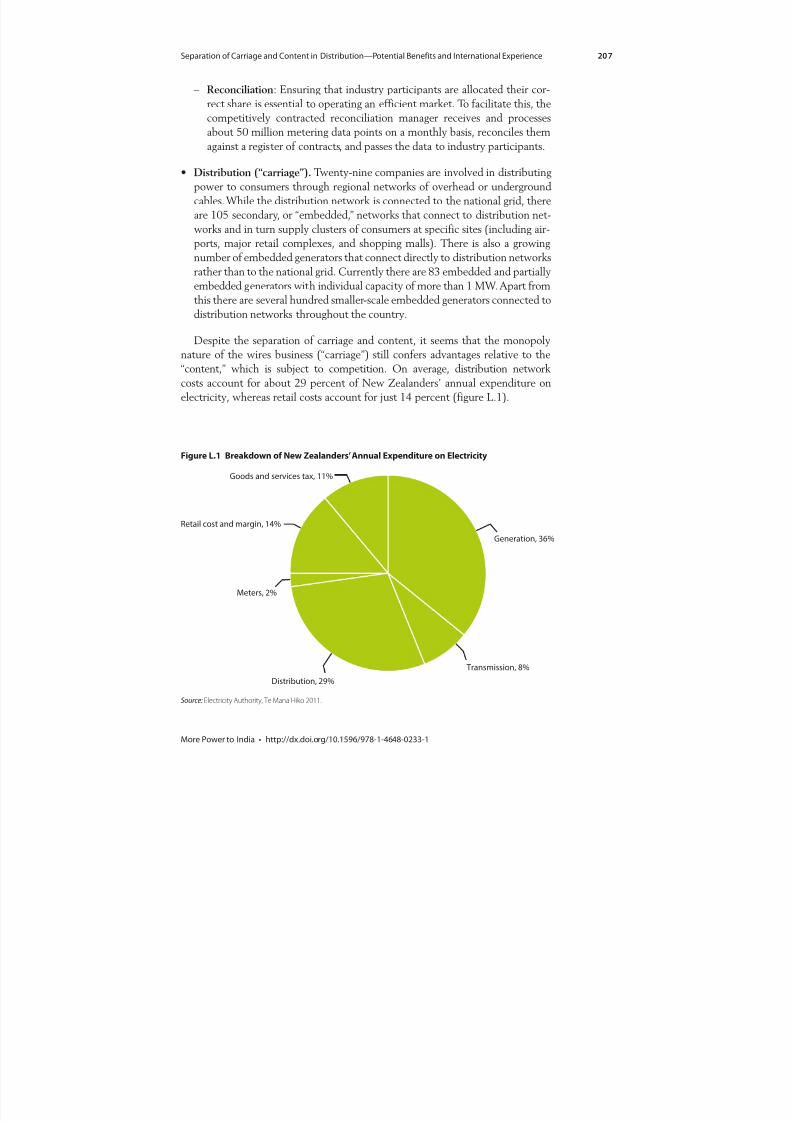
8/20/2019 WB - India Discom Report - Feb15
http://slidepdf.com/reader/full/wb-india-discom-report-feb15 231/255
Separation of Carriage and Content in Distribution—Potential Benefits and International Experience 207
More Power to India • http://dx.doi.org/10.1596/978-1-4648-0233-1
– Reconciliation: Ensuring that industry participants are allocated their cor-
rect share is essential to operating an efficient market. To facilitate this, the
competitively contracted reconciliation manager receives and processes
about 50 million metering data points on a monthly basis, reconciles themagainst a register of contracts, and passes the data to industry participants.
• Distribution (“carriage”). Twenty-nine companies are involved in distributing
power to consumers through regional networks of overhead or underground
cables. While the distribution network is connected to the national grid, there
are 105 secondary, or “embedded,” networks that connect to distribution net-
works and in turn supply clusters of consumers at specific sites (including air-
ports, major retail complexes, and shopping malls). There is also a growing
number of embedded generators that connect directly to distribution networks
rather than to the national grid. Currently there are 83 embedded and partiallyembedded generators with individual capacity of more than 1 MW. Apart from
this there are several hundred smaller-scale embedded generators connected to
distribution networks throughout the country.
Despite the separation of carriage and content, it seems that the monopoly
nature of the wires business (“carriage”) still confers advantages relative to the
“content,” which is subject to competition. On average, distribution network
costs account for about 29 percent of New Zealanders’ annual expenditure on
electricity, whereas retail costs account for just 14 percent (figure L.1).
Source: Electricity Authority, Te Mana Hiko 2011.
Figure L.1 Breakdown of New Zealanders’ Annual Expenditure on Electricity
Generation, 36%
Transmission, 8%
Distribution, 29%
Meters, 2%
Retail cost and margin, 14%
Goods and services tax, 11%

8/20/2019 WB - India Discom Report - Feb15
http://slidepdf.com/reader/full/wb-india-discom-report-feb15 232/255
208 Separation of Carriage and Content in Distribution—Potential Benefits and International Experience
More Power to India • http://dx.doi.org/10.1596/978-1-4648-0233-1
The United States
Some 20 U.S. states have implemented varying degrees of retail restructuring,
in which consumers were given the right to purchase power from nonutility
providers. The incumbent—once vertically integrated—utility may continue toserve customers who elect to buy from it, but for customers who choose an
alternative power supplier, the incumbent acts solely as a wires and service
provider, not as a seller of electricity. In an attempt to prevent incumbent utili-
ties from having a competitive advantage over alternative suppliers, the incum-
bent was generally required to divest its generating plants, usually to an
unregulated affiliate.
Customers who continue to purchase power from the incumbent utility
receive what is known as standard-offer or “default” service. While the costs of
transmission and distribution remain regulated by state regulators on a cost of
service basis, the cost of electricity generation, whether provided by the incum-
bent utility or an alternative nonutility supplier, reflects the cost of purchasing
power on the wholesale market or through bilateral contracts. As a result of sepa-
ration of carriage and content, a much larger pool of customers is now exposed
to the wholesale power rates than would have been the case in the absence of
restructuring and retail customer access.
To the extent that the wholesale market for power generation does not
appear to be “workably competitive,” all customers, not just those of public
power and rural electric utilities, are ill-served. Access to alternative retail sup-
pliers does not solve the fundamental problems of the wholesale market fromwhich those suppliers must purchase power. In 2011 returns on equity for a
sample of the largest merchant generators (who previously used to have regu-
lated caps on their returns) ranged from 15 percent to 23 percent, rates far
exceeding regulated utility returns. Continued market power was reflected in
the difference between fuel costs (falling) and electricity prices (rising) in
2011. Other data for the U.S. electricity market show that the beneficiaries of
restructuring have not been consumers, as promised, but owners of formerly
regulated—and largely depreciated—generating units.
European Union
While the introduction of competitive retail and generation markets in the 1990s
and early 2000s brought about a dramatic restructuring of the electricity industry
and regulatory environment, the underlying power sector paradigm changed
little. Large, central-station power plants continued to supply the vast majority
of electricity, delivered to customers over a hierarchical chain of high-voltage
transmission lines and lower-voltage distribution networks (Jenkins 2013).
Today, new forces are upending much of that traditional paradigm, sparking
changes at least as profound as those unleashed by the earlier era of industryliberalization. According to Eurelectric (2013), four major trends are reshaping
the global power sector, for which Europe is likely to be the bellwether: growth
8/20/2019 WB - India Discom Report - Feb15
http://slidepdf.com/reader/full/wb-india-discom-report-feb15 233/255
Separation of Carriage and Content in Distribution—Potential Benefits and International Experience 209
More Power to India • http://dx.doi.org/10.1596/978-1-4648-0233-1
of renewable energy, a more decentralized system, foundation of the smart grid,
and retail competition and new services.
Increasingly competitive retail markets are creating new opportunities—and
pressures—for innovative ways of delivering value to electricity users. Greaterproduct differentiation is more possible now than ever before, and consumers are
becoming more engaged, looking for ways to get more out of their relationship
with their retail supplier. Those retailers who evolve to meet customer demands
will thrive, while others will see their market share wither.
With declining profitability in the utilities’ core business areas, the future for
utilities rests on capturing the growing pool of value associated with renewable
and distributed energy generation and other emerging technologies, capitalizing
on their existing relationship with customers, and finding novel ways to serve
customer needs through new business models and services. While the large-
scale renewable energy sector will continue to grow in value, with the EuropeanUnion adding 135 GW of new renewable energy capacity by 2020 and creating
an additional a14 billion value pool, utilities have so far failed to capture a
substantial share of these new value pools: Germany’s four largest power
producers controlled less than 5 percent of renewable energy capacity as of
2012, for example.
Today, electric utilities everywhere need to be cognizant of a variety of disrup-
tive technologies5 that are emerging to compete with utility-provided services
and that will threaten the centralized utility model—or at the least will reduce
the customer base and hence affect revenue expectations of utilities’ investors.
Such threats relate particularly to the “carriage” or fixed-line distribution net-work. Due to the intermittent nature of renewable energy technologies, there has
tended to be a presumption on the part of utilities that customers will always
need to remain on the grid; however, 10 years ago most people would not have
believed that traditional telephone land-line customers could “cut the cord.” If, as
seems likely, viable and economic renewable-energy storage technology is not far
off, this will sharply reduce the need for carriage, as it will permit the production
of power close to where it is consumed.
Threats to the centralized utility model are also likely to come from new
technologies or customer behavioral changes that reduce load. Any cost-recovery paradigms and regulations that force cost of service to be spread over
fewer units of sales (that is, kWh) serve to enhance the growing competitive
threat of disruptive alternatives and will likely lead to pressures to revise tariff
structures, such as through a higher fixed-charge component. Customers are
not precluded from leaving the system entirely if a cost-competitive alternative
is available (in a scenario where efficient energy storage is combined with dis-
tributed generation, this could create the ultimate risk to grid viability). Tariff
restructuring to restore lost revenues will be only a temporary fix against the
threat of customers fully exiting, or at best solely using the grid for backup
purposes (as with the telephone landline). An old-line industry with a businessmodel requiring 30-year cost-recovery of investment is clearly vulnerable to
threats from disruptive forces.

8/20/2019 WB - India Discom Report - Feb15
http://slidepdf.com/reader/full/wb-india-discom-report-feb15 234/255
210 Separation of Carriage and Content in Distribution—Potential Benefits and International Experience
More Power to India • http://dx.doi.org/10.1596/978-1-4648-0233-1
What can utilities do? Eurelectric (2013) advises utilities to embrace
renewable energy technologies and invest in the in-house development and addi-
tion of the following value added services in order to remain relevant to
customers:
• Ongoing take-up of distributed generation creates business opportunities to
provide, install, and maintain new equipment at customers’ premises, as well as
additional potential services, such as virtual power-plant generation models.
• Continued energy efficiency improvement will create a market for a wide
range of technical solutions and, equally importantly, advisory services on new
business models to unlock the potential value that energy-saving solutions
entail.
• As part of providing system flexibility, the importance of demand response
aggregation will grow. A market involving business-to-business customers isalready emerging and is likely to extend to the business-to-consumer segment
through two-way digital communication enabled by smart grids and the
increased penetration of smart appliances and home-control technologies.
• Future adoption of electric vehicles will require e-mobility solutions for
private and fleet customers, spanning the development of charging infra-
structure (public charging stations and private charging boxes), power
supply, and automatic billing and data management.
Concluding Observations What does the above imply for the debate on retail competition in the Indian
context? Two primary considerations stand out, depending on whether one takes
a static or dynamic perspective.
For a static view, the New Zealand case illustrates the pressing need for strong
institutional support to make retail competition successful. In that country, the
public sector took an active interest to make it seamless for customers to switch
in and out of hiring various retail suppliers; it therefore set up mechanisms and
allocated resources and expertise, with great success. In the United States, retail
competition was not similarly supported by the public sector, and communica-tions between retail suppliers and customers were left to individual initiative on
both sides. The retail switching rate in the United States has been far lower as a
result. A study of the experience with retail competition in 27 European coun-
tries (Lima 2003) also concluded that retail competition itself had less to do
with customers’ tariff rates than did the bulk-procurement strategies of new-
entrant retail suppliers, which could pass on savings to customers and thereby
entice some switching. Most of the switching was done by industrial customers
who had sophisticated procurement departments and were able to analyze the
value propositions of alternative offers better than the typical residential cus-
tomer. European countries where some modest success with retail competitionwas observed also had dedicated public resources and institutional capacity to
support consumers.

8/20/2019 WB - India Discom Report - Feb15
http://slidepdf.com/reader/full/wb-india-discom-report-feb15 235/255
Separation of Carriage and Content in Distribution—Potential Benefits and International Experience 211
More Power to India • http://dx.doi.org/10.1596/978-1-4648-0233-1
From the dynamic perspective, if Europe is indeed taken as a bellwether for
the future of the centralized utility model, the relevance of the carriage and con-
tent model in the long run would have to be questioned. If there is a disruptive
technological innovation in the coming decade that allows distributed generationand power storage at affordable rates and grants complete independence from
the grid for a large number of low-tension consumers, this will be a game changer
for centralized utilities, their investors, and their regulators (The Economist 2013a). There is therefore a risk of new investments by the utility becoming
stranded, and revenues being hard to recover.
India is different in one critical respect from the other countries discussed
here: it has a shortage of power.6 However, this means there is even more risk of
customers “leapfrogging” to a new technological paradigm if one becomes avail-
able and deserting the utility or using it as backup only.7 Utilities that cannot
offer quality service to existing customers and that have a large unserved pool ofpotential customers are very vulnerable to any technological change that lets
consumers get reliable power at their own location.
On balance, given the constrained institutional capacity available to provide
the required consumer support, the still-developing regulatory capacity at state
level, and developments on the distributed generation front, it is probably wiser
for India to start with pilot projects for retail competition rather than make a
full-scale rollout at present.
Sources: Abbott, Holdaway, and Cohen 2007; Caplan and Brobeck 2012; Electricity Authority, Te Mana Hiko 2011;
Eurelectric 2013; Jenkins 2013; Lima 2003; The Economist 2013a, 2013b.
Notes
1. New Zealand introduced retail competition in 2010, whereas the United States and Europe did so nearly three decades ago, and are now dealing with a new raft of issues that pose existential threats to their conventional, utility-centric business model.
2. This draws upon ideas put forward by Anil Sardana, Managing Director of Tata Power, in a private communication.
3. The “old discom” was the signatory of the PPA, procuring bulk power (under Case 1 or Case 2 methods), and was responsible for both carriage and delivery of the con-
tent to the end user. The proposed “new discom” would be concerned only with the network, and would not necessarily be a good contractual counterpart with the generators because it no longer has relationships with customers, and therefore can-not be sure of secure offtake for the power it purchases. The new discom would therefore want to relieve itself of 25-year obligations to purchase power.
4. Depending on the electricity markets the retail supplier concept is implemented in, there may be limited or no response to the competitive bids seeking interested retail suppliers. In such cases, a single “appointed” retail supplier may be needed, acting as a temporary subcontractor to the public sector for a fee. This could be a transition mechanism for, say, three years, after which the customer database, collection rates, etc. would be published online as updated information provided to potential bidders
under a new bidding round, perhaps related to concentric circles so that new retail suppliers would not have to begin by taking on the entire customer base. After another three-year transition, during which customers would have a chance to assess
8/20/2019 WB - India Discom Report - Feb15
http://slidepdf.com/reader/full/wb-india-discom-report-feb15 236/255
212 Separation of Carriage and Content in Distribution—Potential Benefits and International Experience
More Power to India • http://dx.doi.org/10.1596/978-1-4648-0233-1
the performance of different retail suppliers operating in the small circles, various retail suppliers could step “across lines” and acquire customers outside their initially prescribed service territory limits (which were confined to the initial concentric circles).
5. Photovoltaic, battery storage, fuel cells, geothermal energy systems, wind, micro- turbines, and electric vehicle enhanced storage.
6. This also constrains retail competition because entrants cannot easily source power that is not already tied up in power purchase agreements.
7. Again, the analogy with mobile telephony is appropriate: mobile phones were long considered luxury items, and thus the rapid and deep penetration of mobile telephony in developing economies was predicted by very few observers.
References
Abbott, Malcolm, Graham Holdaway, and Anthony Cohen. 2007. “Scorecard onAustralia’s Electricity Market Reforms.” World Power (2007): 22–7.
Caplan, Elise, and Stephen Brobeck. 2012. Have Restructured Wholesale Electricity MarketsBenefitted Consumers? http://www.publicpower.org/files/PDFs/CFA_APPA_RTO_Article_12_12_12.pdf.
The Economist. 2013a. “How to Lose Half a Trillion Euros.” October 12.
———. 2013b. “Edison’s Revenge.” October 19.
Electricity Authority, Te Mana Hiko. 2011. Electricity in New Zealand . Wellington.
Eurelectric. 2013. Utilities: Power Houses of Innovation. Brussels.
Jenkins, Jesse. 2013. “Electricity Utilities Must Evolve or Die: Are They Up to the Task?”(blog), October 28. http://www.theenergycollective.com.
Lima, Haldane F. 2003. Retail Competition: The Brazilian Challenge to Empower Consumersto Choose Their Electricity Supplier . The George Washington University, Washington, DC.
8/20/2019 WB - India Discom Report - Feb15
http://slidepdf.com/reader/full/wb-india-discom-report-feb15 237/255
213More Power to India • http://dx.doi.org/10.1596/978-1-4648-0233-1
Productive Use of Electricity—
Experience from Indonesia
and Peru
Productive use of electricity has been promoted as part of rural electrification
initiatives in Indonesia and Peru to encourage the adoption of electricity for
income generation activities and improve the financial viability of rural electrifi-
cation. The effort in Indonesia, implemented under the framework of the World
Bank–supported Indonesia Rural Electrification Projects I & II in the early 1990s,
pioneered the application of Business Development Services (BDS) for produc-
tive uses of electricity. The project focused on outreach to small businesses
through nongovernmental organizations (NGOs), and developed a marketing
strategy for the electricity supplier, which addressed lack of information, tariff
barriers, and quality of service. Impact studies show that 66,000 enterprises were
assisted and over 20,000 jobs created.
The approach to promoting productive uses of electricity was replicated on a
pilot basis in Peru as part of a rural electrification project initiated by the govern-
ment in 2006. Before the project, rural communities faced multiple barriers to
increasing the use of electricity for production including limited technical and
management skills of rural producers, inadequate access to capital and financing,and perception of poor quality of grid supplied electricity, which reduced interest
in electrical equipment.
The Peru project signed a standard memorandum of understanding with three
distribution companies involved in the pilot, establishing the role, responsibilities,
and support to be provided by the distribution company and the to-be-contracted
NGOs and the coordination arrangements. As in Indonesia, the project
implemented an approach based on BDS techniques. The NGOs selected to
implement the productive uses activities used BDS methods to assist small and
home-based enterprises in gathering information, finding credit, and addressing
technology constraints through marketing and assistance campaigns. To promoteproductive uses of electricity, the NGOs followed a strategy that included
A P P E N D I X M
8/20/2019 WB - India Discom Report - Feb15
http://slidepdf.com/reader/full/wb-india-discom-report-feb15 238/255
214 Productive Use of Electricity—Experience from Indonesia and Peru
More Power to India • http://dx.doi.org/10.1596/978-1-4648-0233-1
market assessment; preparation of business plans, marketing to the community
and potential entrepreneurs, coordination with complementary institutions, and
links to the electricity distribution company.
By 2011, pilot project activities had helped over 4,970 families and micro-enterprises adopt electricity and use equipment to process cereals, coffee, cocoa,
baked goods, meat products, milk, wood and metal products, and handicrafts,
and to pump water for expanded agricultural production and processing. It
was expected that by project closing (June 2013), 9,000 families and micro-
enterprises would have been supported in adopting productive uses of
electricity.
The theme of this project has been integrated into government objectives—
Peru’s Ministry of Energy and Mines National Plan for Rural Electrification
includes capacity building for productive uses. A follow-up rural electrification
project to be implemented by the government will work to make promotion ofproductive uses an integral part of rural electrification activities of the General
Directorate of Rural Electrification rather than a separate pilot activity.
Source: Finucane, Bogach, and Garcia 2012.
Reference
Finucane, James, Bogach V. Susan, and Luis E. Garcia. 2012. Promoting Productive Uses ofElectricity in Rural Areas of Peru: Experience and Lessons Learned . World Bank,
Washington, DC.
8/20/2019 WB - India Discom Report - Feb15
http://slidepdf.com/reader/full/wb-india-discom-report-feb15 239/255
215More Power to India • http://dx.doi.org/10.1596/978-1-4648-0233-1
Regression Results—Governance
and Performance
A P P E N D I X N
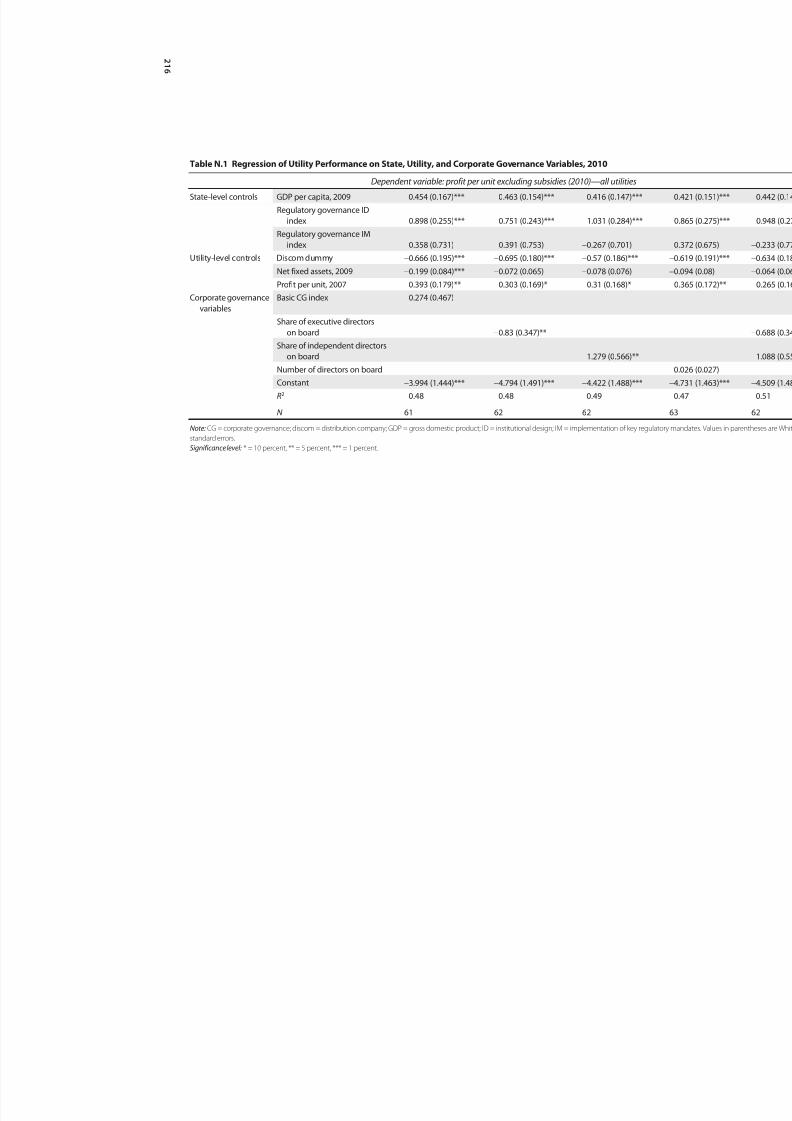
8/20/2019 WB - India Discom Report - Feb15
http://slidepdf.com/reader/full/wb-india-discom-report-feb15 240/255
2 1 6
Table N.1 Regression of Utility Performance on State, Utility, and Corporate Governance Variables, 2010
Dependent variable: profit per unit excluding subsidies (2010)—all utilities
State-level controls GDP per capita, 2009 0.454 (0.167)*** 0.463 (0.154)*** 0.416 (0.147)***
Regulatory governance ID
index 0.898 (0.255)*** 0.751 (0.243)*** 1.031 (0.284)***
Regulatory governance IM
index 0.358 (0.731) 0.391 (0.753) −0.267 (0.701)
Utility-level controls Discom dummy −0.666 (0.195)*** −0.695 (0.180)*** −0.57 (0.186)*** −
Net fixed assets, 2009 −
0.199 (0.084)*** −
0.072 (0.065) −
0.078 (0.076) −
Profit per unit, 2007 0.393 (0.179)** 0.303 (0.169)* 0.31 (0.168)*
Corporate governance
variables
Basic CG index 0.274 (0.467)
Share of executive directors
on board −0.83 (0.347)**
Share of independent directors
on board 1.279 (0.566)**
Number of directors on board
Constant −3.994 (1.444)*** −4.794 (1.491)*** −4.422 (1.488)*** −
R2 0.48 0.48 0.49
N 61 62 62 6
Note: CG = corporate governance; discom = distribution company; GDP = gross domestic product; ID = institutional design; IM = implementation of key regulatory
standard errors.
Significance level: * = 10 percent, ** = 5 percent, *** = 1 percent.

8/20/2019 WB - India Discom Report - Feb15
http://slidepdf.com/reader/full/wb-india-discom-report-feb15 241/255
2 1 7
Table N.2 Regression of Utility Performance on State, Utility, and Corporate Governance Variables, 2011
Dependent variable: profit per unit excluding subsidies (2011)—all utilities
State-level controls GDP per capita, 2010 0.288 (0.143)** 0.318 (0.137)** 0.289 (0.140)**
Regulatory governance ID index 0.638 (0.232)*** 0.621 (0.222)*** 0.77 (0.256)***
Regulatory governance IM index 1.197 (0.885) 0.93 (0.82) 0.745 (0.898)
Utility-level controls Discom dummy −0.68 (0.126)*** −0.704 (0.123)*** −0.654 (0.123)***
Net fixed assets, 2010 −0.095 (0.058) −0.081 (0.054) −0.094 (0.055)*
Profit per unit, 2007 0.254 (0.122)** 0.206 (0.118)* 0.228 (0.116)*
Corporate governance
variables
Basic CG index
−0.183 (0.372)
Share of executive directors on
board −0.522 (0.264)*
Share of independent directorson board 0.507 (0.39)
Number of directors on board
Constant −3.376 (1.694)* −3.536 (1.549)** −3.315 (1.661)*
R2 0.52 0.54 0.53
N 65 65 65
Note: CG = corporate governance; discom = distribution company; GDP = gross domestic product; ID = institutional design; IM = implementation of key regulatory
standard errors.
Significance level: * = 10 percent, ** = 5 percent, *** = 1 percent.
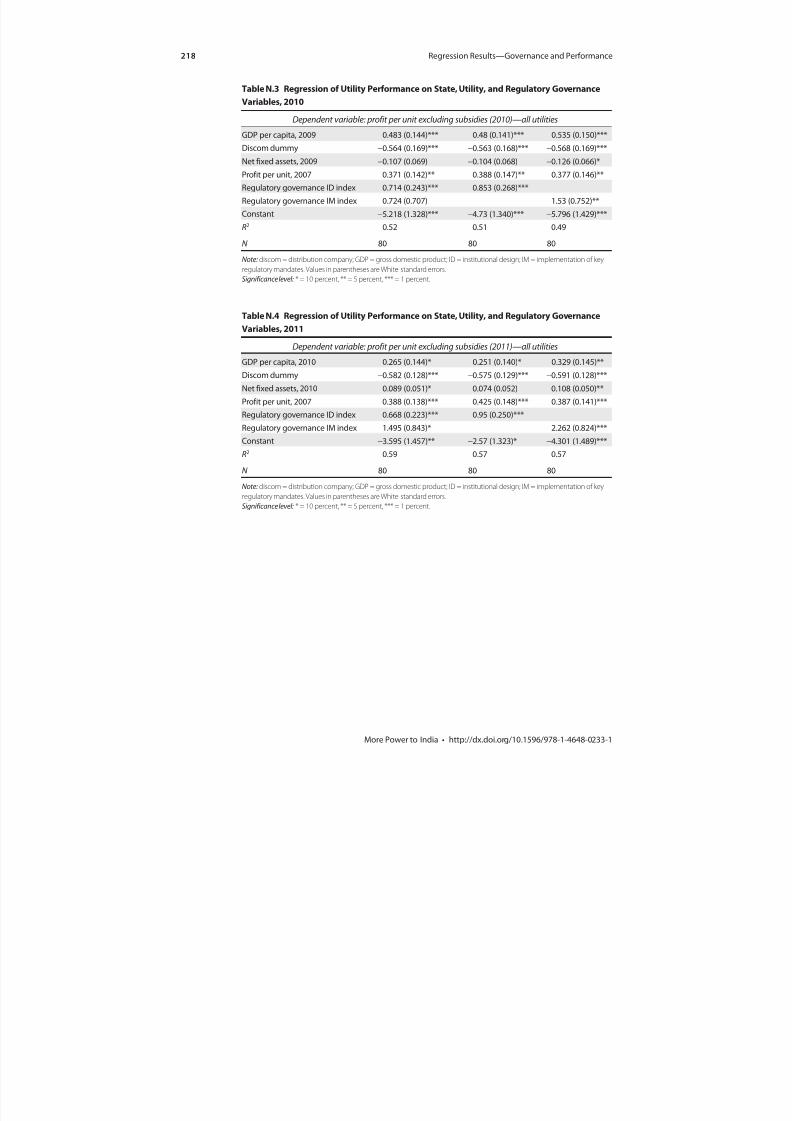
8/20/2019 WB - India Discom Report - Feb15
http://slidepdf.com/reader/full/wb-india-discom-report-feb15 242/255
218 Regression Results—Governance and Performance
More Power to India • http://dx.doi.org/10.1596/978-1-4648-0233-1
Table N.3 Regression of Utility Performance on State, Utility, and Regulatory Governance
Variables, 2010
Dependent variable: profit per unit excluding subsidies (2010)—all utilities
GDP per capita, 2009 0.483 (0.144)*** 0.48 (0.141)*** 0.535 (0.150)***Discom dummy −0.564 (0.169)*** −0.563 (0.168)*** −0.568 (0.169)***
Net fixed assets, 2009 −0.107 (0.069) −0.104 (0.068) −0.126 (0.066)*
Profit per unit, 2007 0.371 (0.142)** 0.388 (0.147)** 0.377 (0.146)**
Regulatory governance ID index 0.714 (0.243)*** 0.853 (0.268)***
Regulatory governance IM index 0.724 (0.707) 1.53 (0.752)**
Constant −5.218 (1.328)*** −4.73 (1.340)*** −5.796 (1.429)***
R2 0.52 0.51 0.49
N 80 80 80
Note: discom = distribution company; GDP = gross domestic product; ID = institutional design; IM = implementation of key
regulatory mandates. Values in parentheses are White standard errors.
Significance level: * = 10 percent, ** = 5 percent, *** = 1 percent.
Table N.4 Regression of Utility Performance on State, Utility, and Regulatory Governance
Variables, 2011
Dependent variable: profit per unit excluding subsidies (2011)—all utilities
GDP per capita, 2010 0.265 (0.144)* 0.251 (0.140)* 0.329 (0.145)**
Discom dummy −0.582 (0.128)*** −0.575 (0.129)*** −0.591 (0.128)***
Net fixed assets, 2010 −0.089 (0.051)* −0.074 (0.052) −0.108 (0.050)**
Profit per unit, 2007 0.388 (0.138)*** 0.425 (0.148)*** 0.387 (0.141)***
Regulatory governance ID index 0.668 (0.223)*** 0.95 (0.250)***
Regulatory governance IM index 1.495 (0.843)* 2.262 (0.824)***
Constant −3.595 (1.457)** −2.57 (1.323)* −4.301 (1.489)***
R2 0.59 0.57 0.57
N 80 80 80
Note: discom = distribution company; GDP = gross domestic product; ID = institutional design; IM = implementation of key
regulatory mandates. Values in parentheses are White standard errors.
Significance level: * = 10 percent, ** = 5 percent, *** = 1 percent.
8/20/2019 WB - India Discom Report - Feb15
http://slidepdf.com/reader/full/wb-india-discom-report-feb15 243/255
219More Power to India • http://dx.doi.org/10.1596/978-1-4648-0233-1
Overview of the India Power Sector
Review Databases
A major contribution of the India Power Sector Review (IPSR) is the creation of
a database that collates data at utility, state, and central levels covering both a
time series for 2003–11 and a cross-section at 2011. The data have been either
directly extracted from a published source (such as Power Finance Corporation’s
Performance Report of State Power Utilities, successive rounds of National
Sample Survey, and tariff schedules approved by state regulatory commissions of
various years); or obtained from interviews with utilities and regulators:
• Utility-level data on financial and operational performance, board structures
and composition, and indicators of compliance with good corporate gover-
nance practices.
• State-level data on the functioning and capacity of regulatory commissions;
tariff schedules for all states for several years; electrification rates; performance
of Rajiv Gandhi Grameen Vidyutikaran Yojana (RGGVY); and electricity sub-
sidy volumes and targeting.
• Central-level data have been aggregated on public-private partnership (PPP)
projects in the generation, transmission, and distribution subsectors since
1990.
A P P E N D I X O
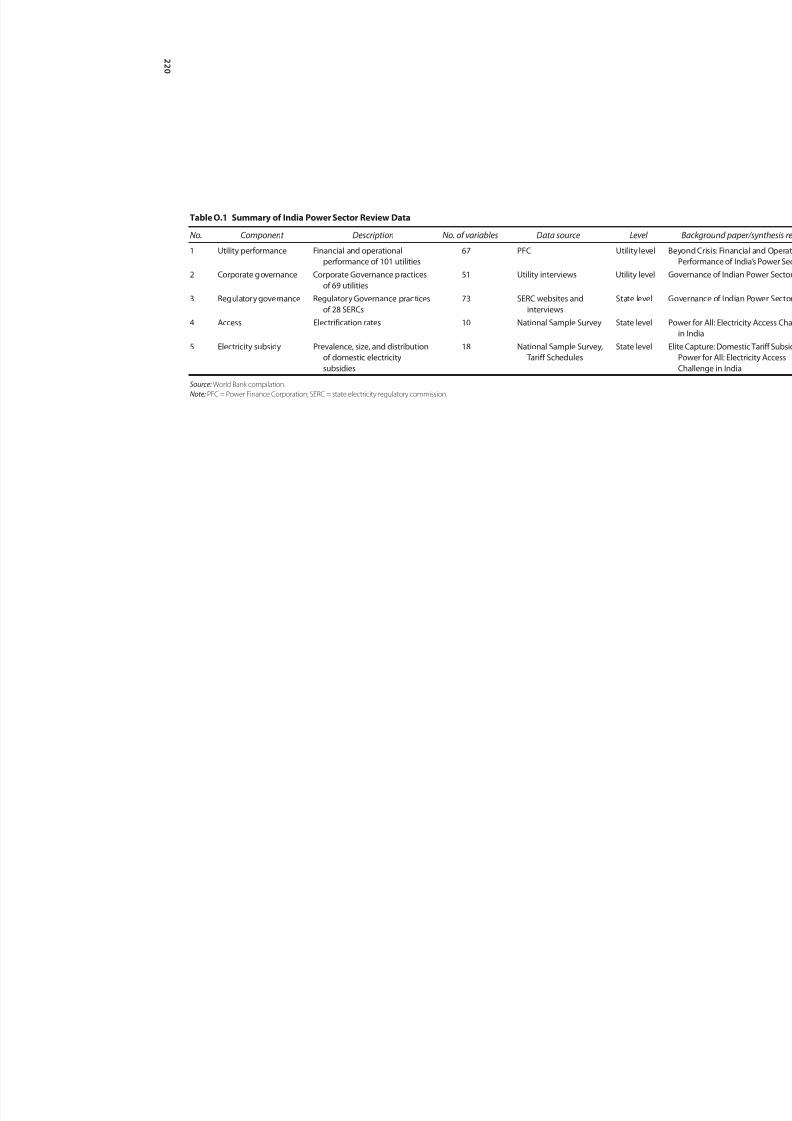
8/20/2019 WB - India Discom Report - Feb15
http://slidepdf.com/reader/full/wb-india-discom-report-feb15 244/255
2 2 0
Table O.1 Summary of India Power Sector Review Data
No. Component Description No. of variables Data source Level
1 Utility performance Financial and operational
performance of 101 utilities
67 PFC Utility level B
2 Corporate governance Corporate Governance practicesof 69 utilities
51 Utility interviews Utility level G
3 Regulatory governance Regulatory Governance practices
of 28 SERCs
73 SERC websites and
interviews
State level G
4 Access Electrification rates 10 National Sample Survey State level P
5 Electricity subsidy Prevalence, size, and distribution
of domestic electricity
subsidies
18 National Sample Survey,
Tariff Schedules
State level E
Source: World Bank compilation.
Note: PFC = Power Finance Corporation; SERC = state electricity regulatory commission.

8/20/2019 WB - India Discom Report - Feb15
http://slidepdf.com/reader/full/wb-india-discom-report-feb15 245/255
2 2 1
Table O.2 Utility-Level Data: Financial and Operational Performance
Indicator Description Unit Time serie
Total revenue Revenue from sale of power + Grants & Subsidies Booked +
Revenue from Trading + Other Revenue
Rs million 2003–11
Total revenue – Excluding subsidy Total Revenue – Subsidy Booked Rs million 2003–11
Revenue from sale of power Rs million 2003–11Other revenue Rs million 2003–11
Collection efficiency 100 × (Net Revenue from Sale of Energy – Change in Debtors
for Sale of Power)/Net Revenue from Sale of energy
% 2003–11
Total costs Operational Cost + Interest Rs million 2003–11
Operational costs Sum of power purchase, fuel, O&M costs, depreciation Rs million 2003–11
Power purchase cost Rs million 2003–11
O&M costs Sum of R&M, A&G, employee cost Rs million 2003–11
R&M costs Repair and maintenance costs Rs million 2003–11
A&G costs Administrative and general costs Rs million 2003–11
Employee costs Rs million 2003–11
Other costs Rs million 2003–11
Earnings before interest, taxes, depreciation and
amortization
Total revenue – (power purchase, fuel, O&M, other, costs
capitalized)
Rs million 2003–11
Depreciation Rs million 2003–11
Earnings before interest Rs million 2003–11
Interest Rs million 2003–11
Profit before tax Total Revenue – Total Expenses Rs million 2003–11
Provision for taxation Provision for taxation Rs million 2003–11
Profit after tax PBT-Provision for taxation Rs million 2003–11
Profit after tax excl subsidy booked PAT-subsidy booked Rs million 2003–11
Grants and subsidies booked Subsidy booked in utility accounts as arrears, with payment
promised by the state government
Rs million 2003–11
Grants and subsidies received Subsidy that is actually paid by the government to the utility Rs million 2003–11
Equity Rs million 2003–11
Reserves Rs million 2003–11
Accumulated profit/loss Profit/loss that is carried over to the next fiscal year Rs million 2003–11
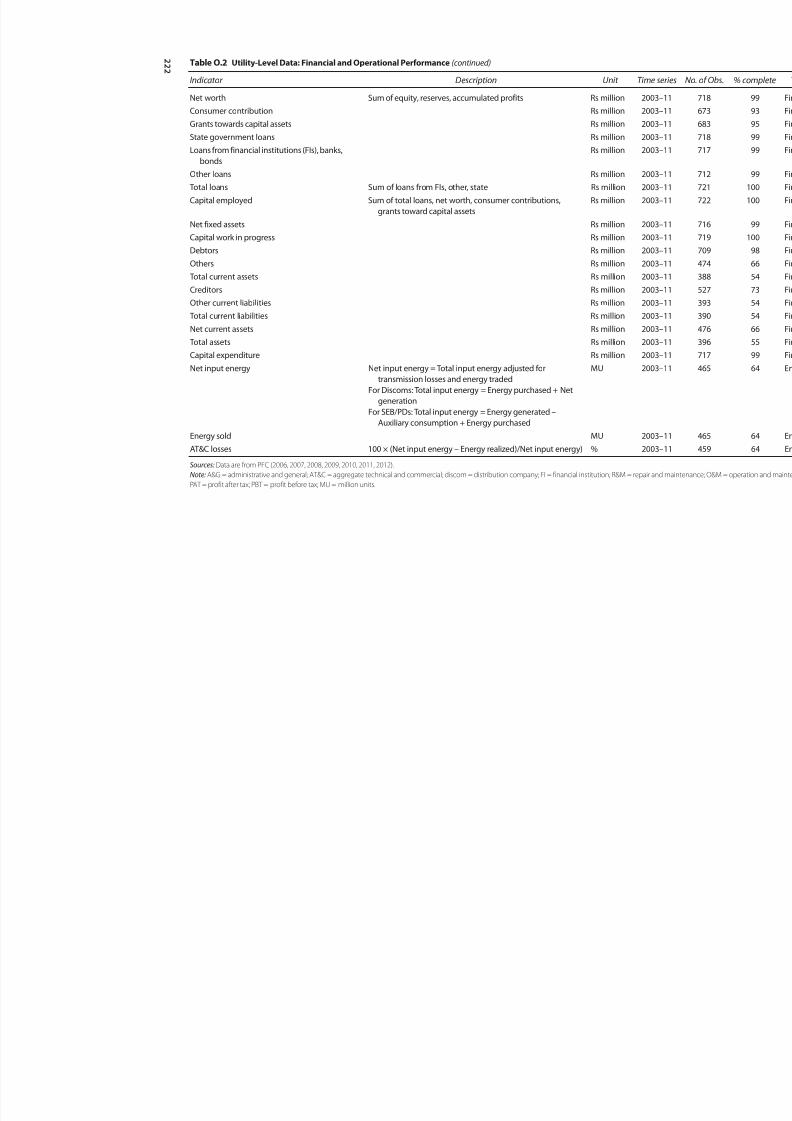
8/20/2019 WB - India Discom Report - Feb15
http://slidepdf.com/reader/full/wb-india-discom-report-feb15 246/255
2 2 2
Table O.2 Utility-Level Data: Financial and Operational Performance (continued)
Indicator Description Unit Time serie
Net worth Sum of equity, reserves, accumulated profits Rs million 2003–11
Consumer contribution Rs million 2003–11
Grants towards capital assets Rs million 2003–11
State government loans Rs million 2003–11Loans from financial institutions (FIs), banks,
bonds
Rs million 2003–11
Other loans Rs million 2003–11
Total loans Sum of loans from FIs, other, state Rs million 2003–11
Capital employed Sum of total loans, net worth, consumer contributions,
grants toward capital assets
Rs million 2003–11
Net fixed assets Rs million 2003–11
Capital work in progress Rs million 2003–11
Debtors Rs million 2003–11
Others Rs million 2003–11
Total current assets Rs million 2003–11
Creditors Rs million 2003–11
Other current liabilities Rs million 2003–11
Total current liabilities Rs million 2003–11
Net current assets Rs million 2003–11
Total assets Rs million 2003–11
Capital expenditure Rs million 2003–11
Net input energy Net input energy = Total input energy adjusted for
transmission losses and energy traded
For Discoms: Total input energy = Energy purchased + Net
generation
For SEB/PDs: Total input energy = Energy generated –Auxiliary consumption + Energy purchased
MU 2003–11
Energy sold MU 2003–11
AT&C losses 100 × (Net input energy – Energy realized)/Net input energy) % 2003–11
Sources: Data are from PFC (2006, 2007, 2008, 2009, 2010, 2011, 2012).
Note: A&G = administrative and general; AT&C = aggregate technical and commercial; discom = distribution company; FI = financial institution; R&M = repair and m
PAT = profit after tax; PBT = profit before tax; MU = million units.

8/20/2019 WB - India Discom Report - Feb15
http://slidepdf.com/reader/full/wb-india-discom-report-feb15 247/255
Overview of the India Power Sector Review Databases 223
More Power to India • http://dx.doi.org/10.1596/978-1-4648-0233-1
Table O.3 Utility-Level Data: Corporate Governance
Indicator Unit
Total data coverage
(69 utilities), % Theme
Is there a Board of Directors? Y/N 100 Board compositionNumber of Board Members # 95 Board composition
Number of Executive Directors on the Board # 94 Board composition
Number of Government (or holding company) Directors on the Board # 95 Board composition
Number of Independent Directors on the Board # 94 Board composition
Is Chairman an Executive Director? Y/N 95 Board composition
Is Chairman from IAS? (or, for holding company, does Chairman work
for government)
Y/N 62 Board composition
Is MD from IAS? Y/N 62 Board composition
Does the Chairman have other government responsibilities? Y/N 60 Board composition
What is the average tenure of the MD/CMD (over the past five years)? # 40 Board composition
Does the utility have an Audit committee? Y/N 99 Board functioning
Does the Board have an HR (or similar) committee? Y/N 61 Board functioning
Does the utility have other specialized Board committees? If yes,
which one?
Y/N 76 Board functioning
Is Audit committee headed by an Independent Director? Y/N 51 Audit
Does the utility use external auditors? Y/N 96 Audit
Is the utility audited by Comptroller and Auditor General of
India (CAG)?
Y/N 92 Audit
Is the audit published on the utility’s website? Y/N 99 Audit
Is utility prepared to adopt IFRS standards? Y/N 85 Audit
Are annual accounts published on the utility’s website? Y/N 99 Accounts
Are annual accounts generally prepared on time (i.e., within
6 months)?
Y/N 79 Accounts
Does the utility have ERP or integrated MIS? Y/N 65 Performance
management
Are targets given to employees for performance management? Y/N 79 Performance
management
Is there a regulatory affairs cell? Y/N 96 External
accountability
Is there a well-defined training policy for employees in place? Y/N 31 Performance
management
Are tariff petitions approved by government before filing? Y/N 78 External
accountabilityShare of Board that consists of Independent Directors % 94 Board composition
Share of Board that consists of Executive Directors % 94 Board composition
Share of Board that consists of Government Directors % 95 Board composition
Does utility follow Independent Director good practice of at least
33% independent or at least 50% if the Chairman is an Executive
Director?
Y/N 94 Board composition
Does utility follow Executive Director good practice of no more than
50% Executive Directors?
Y/N 94 Board composition
Does utility follow Government Director good practice of no more
than two Government Directors?
Y/N 95 Board composition
Source: Data compiled from public sources (state utility websites and annual reports) and, in some cases, interviews.Note: All data are for 2010. CMD = chairman and managing director; ERP = enterprise resource planning; HR = human resources; IAS = Indian
Administrative Service; IFRS = International Financial Reporting Standards; MD = managing director; MIS = management information system;
# = variable is measured in numbers.
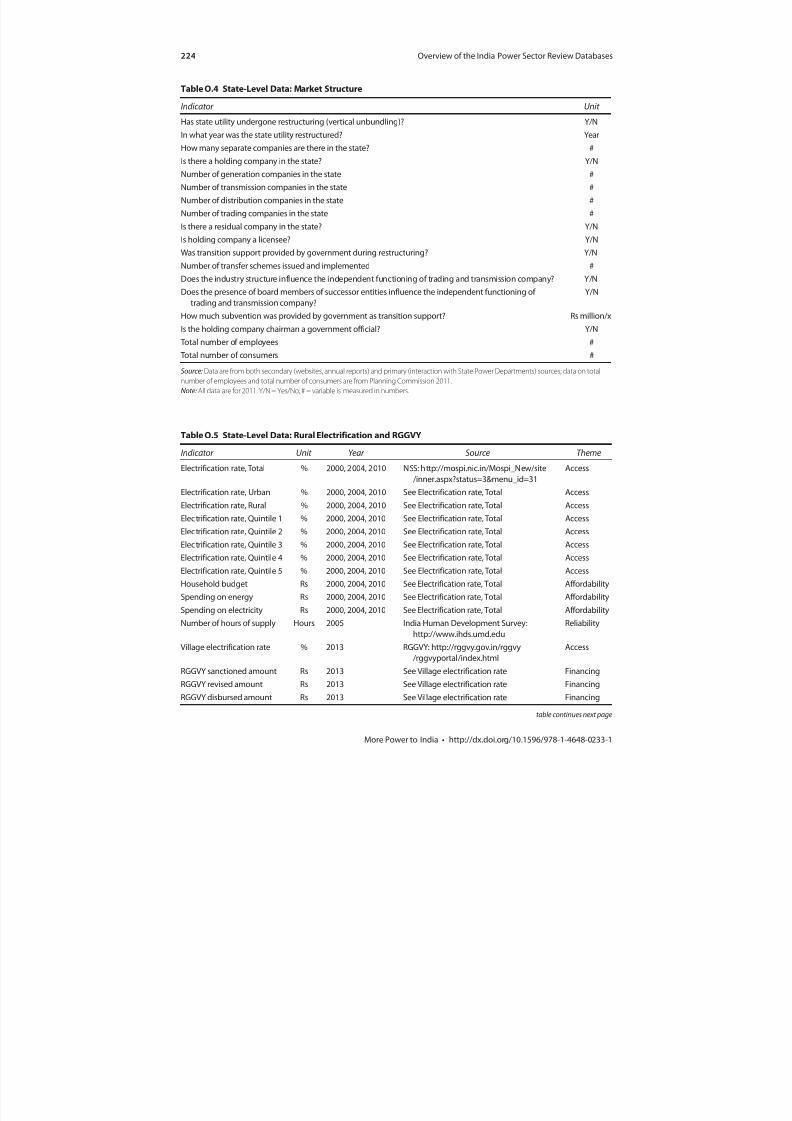
8/20/2019 WB - India Discom Report - Feb15
http://slidepdf.com/reader/full/wb-india-discom-report-feb15 248/255
224 Overview of the India Power Sector Review Databases
More Power to India • http://dx.doi.org/10.1596/978-1-4648-0233-1
Table O.5 State-Level Data: Rural Electrification and RGGVY
Indicator Unit Year Source Theme
Electrification rate, Total % 2000, 2004, 2010 NSS: http://mospi.nic.in/Mospi_New/site
/inner.aspx?status=3&menu_id=31
Access
Electrification rate, Urban % 2000, 2004, 2010 See Electrification rate, Total Access
Electrification rate, Rural % 2000, 2004, 2010 See Electrification rate, Total Access
Electrification rate, Quintile 1 % 2000, 2004, 2010 See Electrification rate, Total Access
Electrification rate, Quintile 2 % 2000, 2004, 2010 See Electrification rate, Total Access
Electrification rate, Quintile 3 % 2000, 2004, 2010 See Electrification rate, Total AccessElectrification rate, Quintile 4 % 2000, 2004, 2010 See Electrification rate, Total Access
Electrification rate, Quintile 5 % 2000, 2004, 2010 See Electrification rate, Total Access
Household budget Rs 2000, 2004, 2010 See Electrification rate, Total Affordability
Spending on energy Rs 2000, 2004, 2010 See Electrification rate, Total Affordability
Spending on electricity Rs 2000, 2004, 2010 See Electrification rate, Total Affordability
Number of hours of supply Hours 2005 India Human Development Survey:
http://www.ihds.umd.edu
Reliability
Village electrification rate % 2013 RGGVY: http://rggvy.gov.in/rggvy
/rggvyportal /index.html
Access
RGGVY sanctioned amount Rs 2013 See Village electrification rate Financing
RGGVY revised amount Rs 2013 See Village electrification rate FinancingRGGVY disbursed amount Rs 2013 See Village electrification rate Financing
table continues next page
Table O.4 State-Level Data: Market Structure
Indicator Unit
Has state utility undergone restructuring (vertical unbundling)? Y/N
In what year was the state utility restructured? YearHow many separate companies are there in the state? #
Is there a holding company in the state? Y/N
Number of generation companies in the state #
Number of transmission companies in the state #
Number of distribution companies in the state #
Number of trading companies in the state #
Is there a residual company in the state? Y/N
Is holding company a licensee? Y/N
Was transition support provided by government during restructuring? Y/N
Number of transfer schemes issued and implemented #
Does the industry structure influence the independent functioning of trading and transmission company? Y/N
Does the presence of board members of successor entities influence the independent functioning of
trading and transmission company?
Y/N
How much subvention was provided by government as transition support? Rs million/x
Is the holding company chairman a government official? Y/N
Total number of employees #
Total number of consumers #
Source: Data are from both secondary (websites, annual reports) and primary (interaction with State Power Departments) sources; data on total
number of employees and total number of consumers are from Planning Commission 2011.
Note: All data are for 2011. Y/N = Yes/No; # = variable is measured in numbers.

8/20/2019 WB - India Discom Report - Feb15
http://slidepdf.com/reader/full/wb-india-discom-report-feb15 249/255
Overview of the India Power Sector Review Databases 225
More Power to India • http://dx.doi.org/10.1596/978-1-4648-0233-1
Table O.6 State-Level Data: Tariff and Subsidiaries
Indicator Unit Theme
Average monthly electricity consumption, Total kWh Consumption
Average monthly electricity consumption, Urban kWh ConsumptionAverage monthly electricity consumption, Rural kWh Consumption
Average monthly electricity consumption, BPL kWh Consumption
Average monthly electricity consumption, APL kWh Consumption
Share of households in various electricity consumption brackets—and by income quintile % Consumption
Share of households that consume no electricity % Consumption
Share of total electricity consumption consumed by each income quintile % Consumption
Average tariff paid by households—across all households and by income quintile Rs Tariff
Average subsidy given on a subsidized kWh of electricity Rs Subsidy
Average cross-subsidy paid on an unsubsidized kWh of electricity Rs Subsidy
Share of electricity units that are subsidized % Subsidy
Average total monthly subsidy received by households—across all households and byincome quintile
Rs Subsidy
Average total monthly cross-subsidy paid by households—across all households and by
income quintile
Rs Subsidy
Share of total subsidies received by each income quintile % Subsidy
Share of households in each quintile that receive no subsidy % Subsidy
Share of households in each quintile that receive a subsidy on all consumption % Subsidy
Share of households that pay more in cross-subsidies than they receive in subsidies % Subsidy
Share of households that receive more in subsidies than they pay in cross-subsidies % Subsidy
Fiscal cost of subsidies Rs Fiscal
Fiscal receipts from cross-subsidies Rs Fiscal
Source: NSS: http://mospi.nic.in/Mospi_New/site/inner.aspx?status=3&menu_id=31.Note: All data are for 2010. APL = above poverty line; BPL = below poverty line; kWh = kilowatt-hour; RGGVY = Rajiv Gandhi Grameen Vidyutikaran
Yojana.
Table O.7 State-Level Data: Regulatory Governance
Question
Data availability
(out of 28 states)
Year SERC was created 28
Has SERC established chairman position? 28
Average tenure of chairman over past 10 years (or since SERC was created, if less than 10 years) 28
Number of filled SERC member positions (including chairman) 26
Number of staff at SERC 27
Number of professional staff at SERC 20
Size of SERC’s budget (Rs Lakh) 25
Budget per household connection 20
Primary source of SERC’s budget (state, own revenues, or both) 25
% of SERC budget from state 23
% of SERC budget from own revenues 23
Has state established SERC fund? 28
Does the state have a RIMS? 26 Total number of regulations notified 28
table continues next page

8/20/2019 WB - India Discom Report - Feb15
http://slidepdf.com/reader/full/wb-india-discom-report-feb15 250/255
226 Overview of the India Power Sector Review Databases
More Power to India • http://dx.doi.org/10.1596/978-1-4648-0233-1
Table O.7 State-Level Data: Regulatory Governance (continued)
Question
Data availability
(out of 28 states)
Are regulatory decisions published online? 28Has SERC issued supply code regulations? 28
Year SERC issued regulations on the electricity supply code 28
Has SERC notified trading regulations? 28
Has SERC issued metering regulations? 28
Metering rate 28
Has SERC issued MYT regulations? 28
Has SERC issued intra-state ABT regulations? 28
Has SERC issued OA regulations? 28
Year OA regulations and orders were issued by SERC 28
Has SERC determined OA surcharge? 28
Has SERC determined OA wheeling charges? 28
Has SERC determined OA transmission charges? 28
# of OA applications SERC has received 28
# of OA applications SERC has approved 28
# of OA applications SERC has implemented 28
Has SERC issued regulations on utilities’ standards of performance? 28
Do standards regulations have clearly defined penalties for noncompliance? 28
Are results of the standards of performance measurements published online? 28
Does SERC monitor compliance with performance standards? 25
Does SERC issue penalties for noncompliance? 25
Has SERC issued guidelines for setting up consumer grievance redressal forums? 28Have discoms established consumer grievance redressal forums? 28
Does SERC have a consumer ombudsman? 28
Does SERC have a consumer advocacy cell? 17
Does SERC hold public hearings before issuing a new tariff order? 28
Does SERC hold public hearings before notifying major regulations? 28
Is there an updated schedule of hearings available on the SERC website? 25
Does SERC publish annual reports? 26
Is the annual report published in the local language? 26
Is the annual report published on the website? 28
What is the most recent annual report available on the website? 26
Has SERC issued regulations on RPO of the distribution licensees? 28
Are the RPOs given as technology-specific targets (e.g., solar and non-solar)? 28
Does SERC monitor compliance with RPOs? 25
Does SERC issue penalties for noncompliance with the RPOs? 24
Has SERC issued regulations for energy efficiency and demand side management (DSM)? 28
Does SERC have any measures or incentives to promote consumer DSM? 24
Has SERC determined an FIT for various types of renewable energy generation? 28
Has SERC issued time of day metering regulations? 28
Does SERC have a provision for a differential or time of day tariff? 28
How many years did the SERC NOT receive tariff filings from every utility? 25
table continues next page
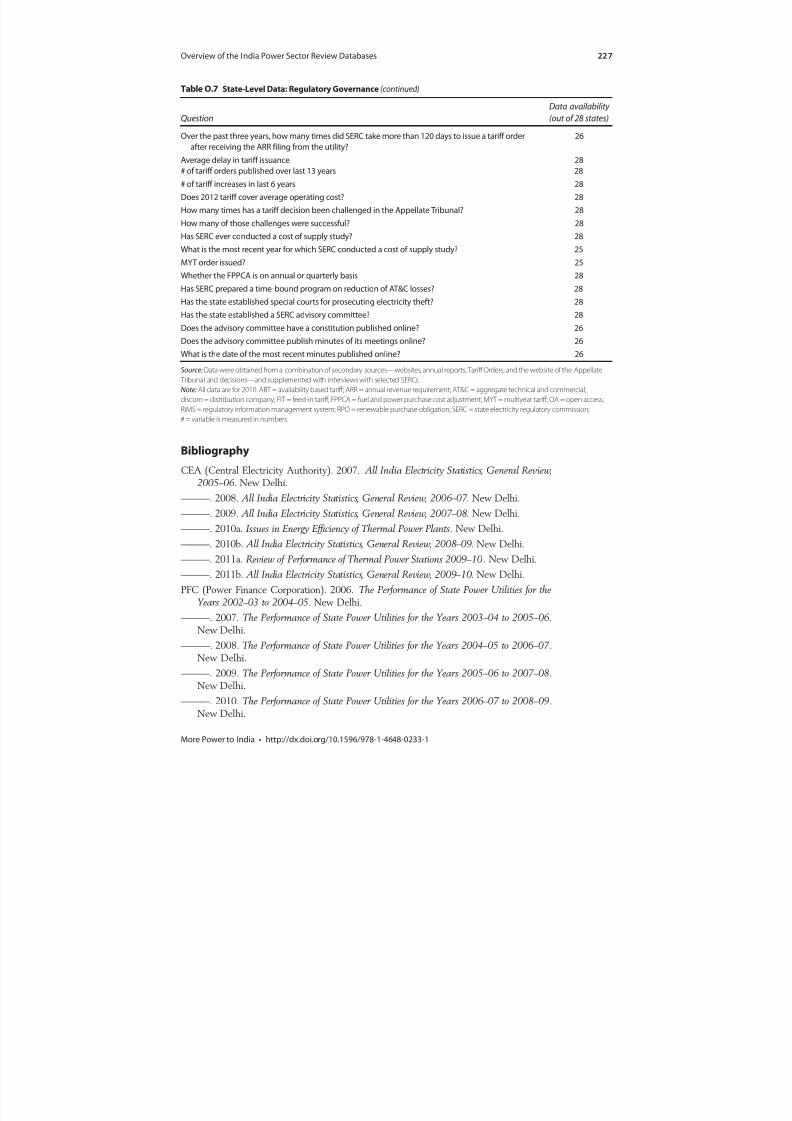
8/20/2019 WB - India Discom Report - Feb15
http://slidepdf.com/reader/full/wb-india-discom-report-feb15 251/255
Overview of the India Power Sector Review Databases 227
More Power to India • http://dx.doi.org/10.1596/978-1-4648-0233-1
Table O.7 State-Level Data: Regulatory Governance (continued)
Question
Data availability
(out of 28 states)
Over the past three years, how many times did SERC take more than 120 days to issue a tariff orderafter receiving the ARR filing from the utility?
26
Average delay in tariff issuance 28
# of tariff orders published over last 13 years 28
# of tariff increases in last 6 years 28
Does 2012 tariff cover average operating cost? 28
How many times has a tariff decision been challenged in the Appellate Tribunal? 28
How many of those challenges were successful? 28
Has SERC ever conducted a cost of supply study? 28
What is the most recent year for which SERC conducted a cost of supply study? 25
MYT order issued? 25
Whether the FPPCA is on annual or quarterly basis 28
Has SERC prepared a time-bound program on reduction of AT&C losses? 28
Has the state established special courts for prosecuting electricity theft? 28
Has the state established a SERC advisory committee? 28
Does the advisory committee have a constitution published online? 26
Does the advisory committee publish minutes of its meetings online? 26
What is the date of the most recent minutes published online? 26
Source: Data were obtained from a combination of secondary sources—websites, annual reports, Tariff Orders, and the website of the Appellate
Tribunal and decisions—and supplemented with interviews with selected SERCs.
Note: All data are for 2010. ABT = availability based tariff; ARR = annual revenue requirement; AT&C = aggregate technical and commercial;
discom = distribution company; FIT = feed-in tariff; FPPCA = fuel and power purchase cost adjustment; MYT = multiyear tariff; OA = open access;
RIMS = regulatory information management system; RPO = renewable purchase obligation; SERC = state electricity regulatory commission;# = variable is measured in numbers.
Bibliography
CEA (Central Electricity Authority). 2007. All India Electricity Statistics, General Review,2005–06. New Delhi.
———. 2008. All India Electricity Statistics, General Review, 2006–07 . New Delhi.
———. 2009. All India Electricity Statistics, General Review, 2007–08. New Delhi.
———. 2010a. Issues in Energy Efficiency of Thermal Power Plants. New Delhi.
———. 2010b. All India Electricity Statistics, General Review, 2008–09. New Delhi.———. 2011a. Review of Performance of Thermal Power Stations 2009–10. New Delhi.
———. 2011b. All India Electricity Statistics, General Review, 2009–10. New Delhi.
PFC (Power Finance Corporation). 2006. The Performance of State Power Utilities for theYears 2002–03 to 2004–05. New Delhi.
———. 2007. The Performance of State Power Utilities for the Years 2003–04 to 2005–06.New Delhi.
———. 2008. The Performance of State Power Utilities for the Years 2004–05 to 2006–07 .New Delhi.
———. 2009. The Performance of State Power Utilities for the Years 2005–06 to 2007–08.
New Delhi.———. 2010. The Performance of State Power Utilities for the Years 2006–07 to 2008–09.
New Delhi.
8/20/2019 WB - India Discom Report - Feb15
http://slidepdf.com/reader/full/wb-india-discom-report-feb15 252/255
228 Overview of the India Power Sector Review Databases
More Power to India • http://dx.doi.org/10.1596/978-1-4648-0233-1
———. 2011. The Performance of State Power Utilities for the Years 2007–08 to 2009–10.New Delhi.
———. 2012. The Performance of State Power Utilities for the Years 2008–09 to 2010–11.New Delhi.
Planning Commission. 2011. Annual Report 2011–12 on the Working of State Power Utilitiesand Electricity Departments. New Delhi: Government of India.
8/20/2019 WB - India Discom Report - Feb15
http://slidepdf.com/reader/full/wb-india-discom-report-feb15 253/255
229More Power to India • http://dx.doi.org/10.1596/978-1-4648-0233-1
Background Papers
Background paper 1: Banerjee, Sudeshna G., Doug Barnes, Bipul Singh, Kristy Mayer,and Hussain Samad. 2013. “Power for All: Electricity Access Challenge in India.”
World Bank, Washington, DC.
Background paper 2: Mayer, Kristy, Sudeshna G. Banerjee, and Chris Trimble. 2013.“Elite Capture: Domestic Tariff Subsidies in India.” World Bank, Washington, DC.
Background paper 3: Mukherjee, Mohua. 2013. “Private Sector Participation in theIndian Power Sector: Lessons from Two Decades of Experience.” World Bank,
Washington, DC.
Background paper 4: Pargal, Sheoli, and Kristy Mayer. 2013. “Governance of Indian PowerSector Utilities: An Ongoing Journey.” World Bank, Washington DC.
Background paper 5: Khurana, Mani, and Sudeshna G. Banerjee. 2013. “Beyond Crisis:Financial and Operational Performance of India’s Power Sector.” World Bank,
Washington, DC.
A P P E N D I X P

8/20/2019 WB - India Discom Report - Feb15
http://slidepdf.com/reader/full/wb-india-discom-report-feb15 254/255
More Power to India • http://dx.doi.org/10.1596/978-1-4648-0233-1
Environmental Benefits Statement
The World Bank Group is committed to reducing its environmental footprint.
In support of this commitment, the Publishing and Knowledge Division lever-
ages electronic publishing options and print-on-demand technology, which is
located in regional hubs worldwide. Together, these initiatives enable print runs
to be lowered and shipping distances decreased, resulting in reduced paper
consumption, chemical use, greenhouse gas emissions, and waste.
The Publishing and Knowledge Division follows the recommended standards
for paper use set by the Green Press Initiative. Whenever possible, books are
printed on 50 percent to 100 percent postconsumer recycled paper, and at least
50 percent of the fiber in our book paper is either unbleached or bleached using
Totally Chlorine Free (TCF), Processed Chlorine Free (PCF), or EnhancedElemental Chlorine Free (EECF) processes.
More information about the Bank’s environmental philosophy can be found
at http://crinfo.worldbank.org/wbcrinfo/node/4.
8/20/2019 WB - India Discom Report - Feb15
http://slidepdf.com/reader/full/wb-india-discom-report-feb15 255/255
Two decades after the liberalization of India’s economy and a decade after the passage of the forward-
looking Electricity Act of 2003, how has India’s power sector done? More Power to India: The Challenge of
Electricity Distribution assesses progress in implementing the government’s reform agenda and examines
the performance of the sector along different dimensions. The sector has come a long way, as shown in this
report, with significant achievements on many fronts. Several states, programs, and utilities could indeed
be beacons for others and are worthy of emulation.
Overall, however, the sector’s potential remains unrealized. The lack of reliable power is a leading concern
Recommended