Water Resources Data
APPENDIX 1
139
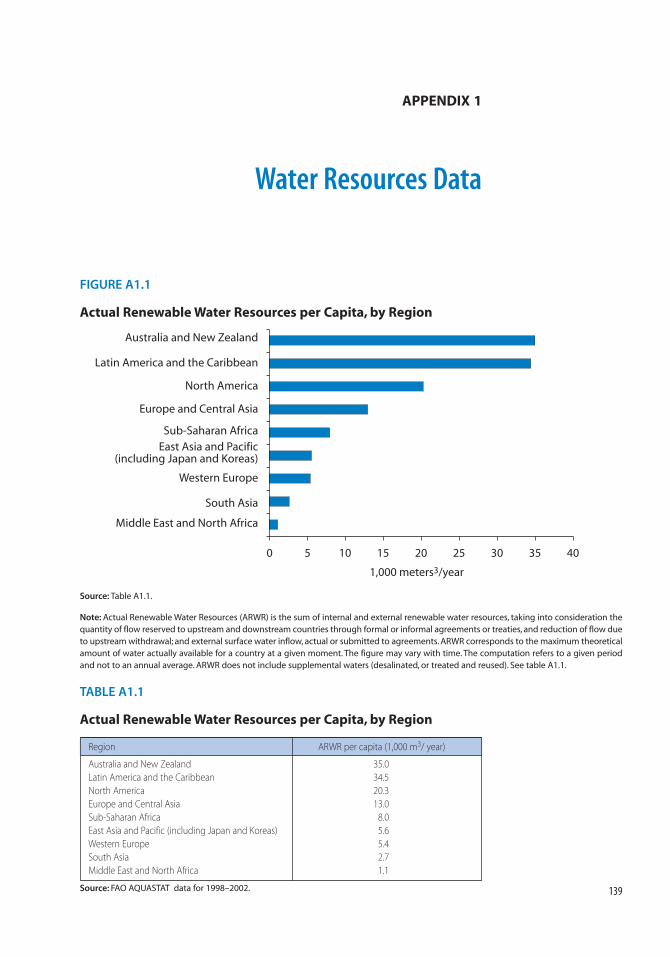
FIGURE A1.1
Actual Renewable Water Resources per Capita, by Region
0 5 10 15 20
1,000 meters3/year
25 30 35 40
Middle East and North Africa
South Asia
Western Europe
East Asia and Pacific(including Japan and Koreas)
Sub-Saharan Africa
Europe and Central Asia
North America
Latin America and the Caribbean
Australia and New Zealand
Source: Table A1.1.
Note: Actual Renewable Water Resources (ARWR) is the sum of internal and external renewable water resources, taking into consideration thequantity of flow reserved to upstream and downstream countries through formal or informal agreements or treaties, and reduction of flow dueto upstream withdrawal; and external surface water inflow, actual or submitted to agreements. ARWR corresponds to the maximum theoreticalamount of water actually available for a country at a given moment. The figure may vary with time. The computation refers to a given periodand not to an annual average. ARWR does not include supplemental waters (desalinated, or treated and reused). See table A1.1.
TABLE A1.1
Actual Renewable Water Resources per Capita, by Region
Region ARWR per capita (1,000 m3/ year)
Australia and New Zealand 35.0
Latin America and the Caribbean 34.5
North America 20.3
Europe and Central Asia 13.0
Sub-Saharan Africa 8.0
East Asia and Pacific (including Japan and Koreas) 5.6
Western Europe 5.4
South Asia 2.7
Middle East and North Africa 1.1
Source: FAO AQUASTAT data for 1998–2002.
06-App1_139-152 2/28/07 3:51 PM Page 139
140 Making the Most of Scarcity
FIGURE A1.2
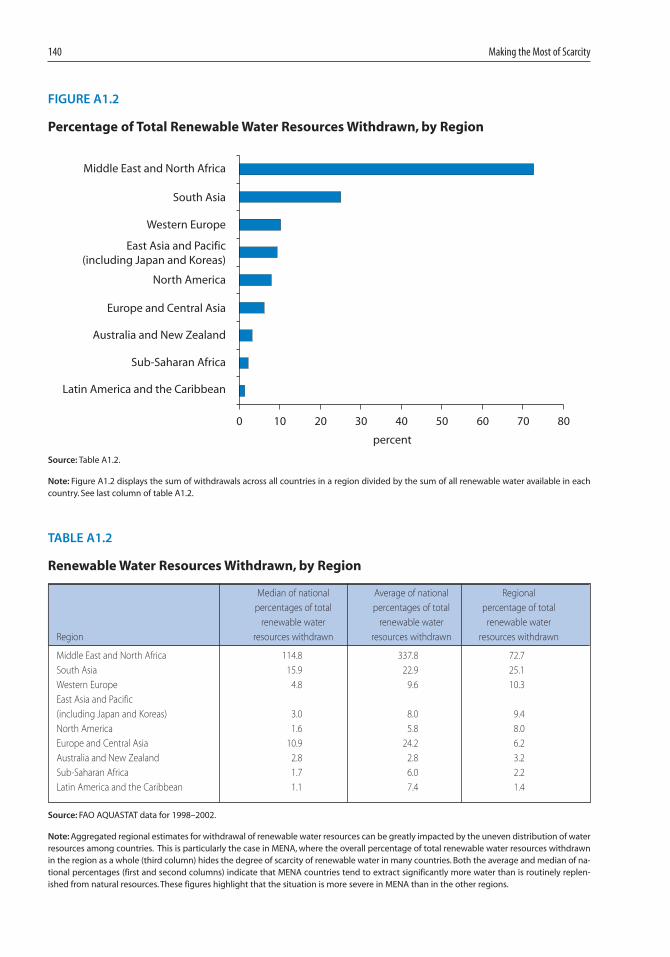
Percentage of Total Renewable Water Resources Withdrawn, by Region
0 10 20 30 40 50 60 70 80
Latin America and the Caribbean
Sub-Saharan Africa
Australia and New Zealand
Europe and Central Asia
North America
Western Europe
South Asia
Middle East and North Africa
percent
East Asia and Pacific(including Japan and Koreas)
Source: Table A1.2.
Note: Figure A1.2 displays the sum of withdrawals across all countries in a region divided by the sum of all renewable water available in eachcountry. See last column of table A1.2.
TABLE A1.2
Renewable Water Resources Withdrawn, by Region
Median of national Average of national Regional
percentages of total percentages of total percentage of total
renewable water renewable water renewable water
Region resources withdrawn resources withdrawn resources withdrawn
Middle East and North Africa 114.8 337.8 72.7
South Asia 15.9 22.9 25.1
Western Europe 4.8 9.6 10.3
East Asia and Pacific
(including Japan and Koreas) 3.0 8.0 9.4
North America 1.6 5.8 8.0
Europe and Central Asia 10.9 24.2 6.2
Australia and New Zealand 2.8 2.8 3.2
Sub-Saharan Africa 1.7 6.0 2.2
Latin America and the Caribbean 1.1 7.4 1.4
Source: FAO AQUASTAT data for 1998–2002.
Note: Aggregated regional estimates for withdrawal of renewable water resources can be greatly impacted by the uneven distribution of waterresources among countries. This is particularly the case in MENA, where the overall percentage of total renewable water resources withdrawnin the region as a whole (third column) hides the degree of scarcity of renewable water in many countries. Both the average and median of na-tional percentages (first and second columns) indicate that MENA countries tend to extract significantly more water than is routinely replen-ished from natural resources. These figures highlight that the situation is more severe in MENA than in the other regions.
06-App1_139-152 2/28/07 3:51 PM Page 140
Appendix 1: Water Resources Data 141
FIGURE A1.3
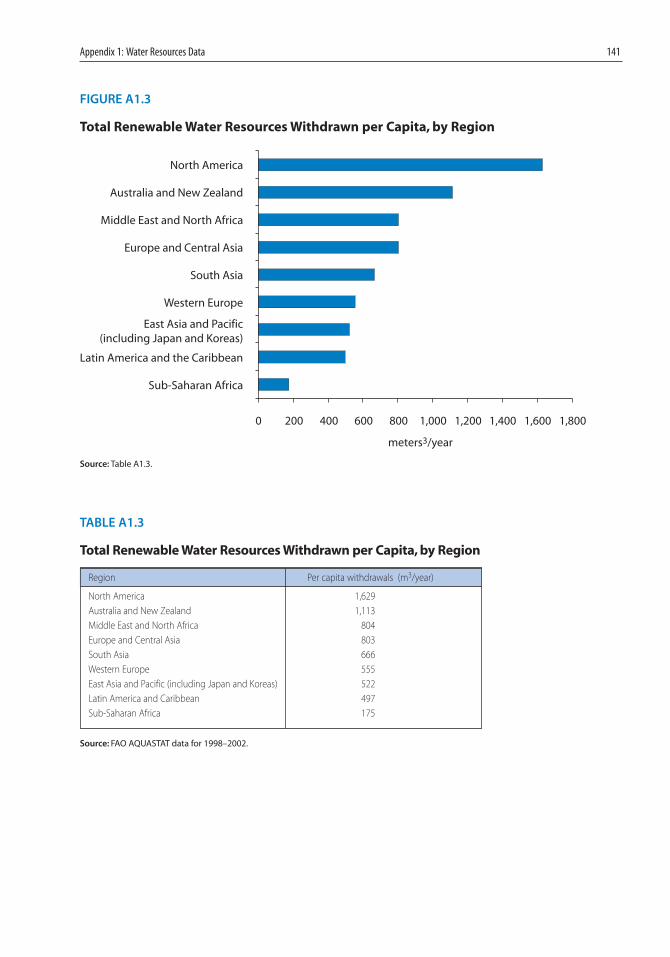
Total Renewable Water Resources Withdrawn per Capita, by Region
0 200 400 600 800 1,000 1,200 1,400 1,600 1,800
Sub-Saharan Africa
Latin America and the Caribbean
Western Europe
South Asia
Europe and Central Asia
Middle East and North Africa
Australia and New Zealand
North America
meters3/year
East Asia and Pacific(including Japan and Koreas)
Source: Table A1.3.
TABLE A1.3
Total Renewable Water Resources Withdrawn per Capita, by Region
Region Per capita withdrawals (m3/year)
North America 1,629
Australia and New Zealand 1,113
Middle East and North Africa 804
Europe and Central Asia 803
South Asia 666
Western Europe 555
East Asia and Pacific (including Japan and Koreas) 522
Latin America and Caribbean 497
Sub-Saharan Africa 175
Source: FAO AQUASTAT data for 1998–2002.
06-App1_139-152 2/28/07 3:51 PM Page 141
142 Making the Most of Scarcity
FIGURE A1.4
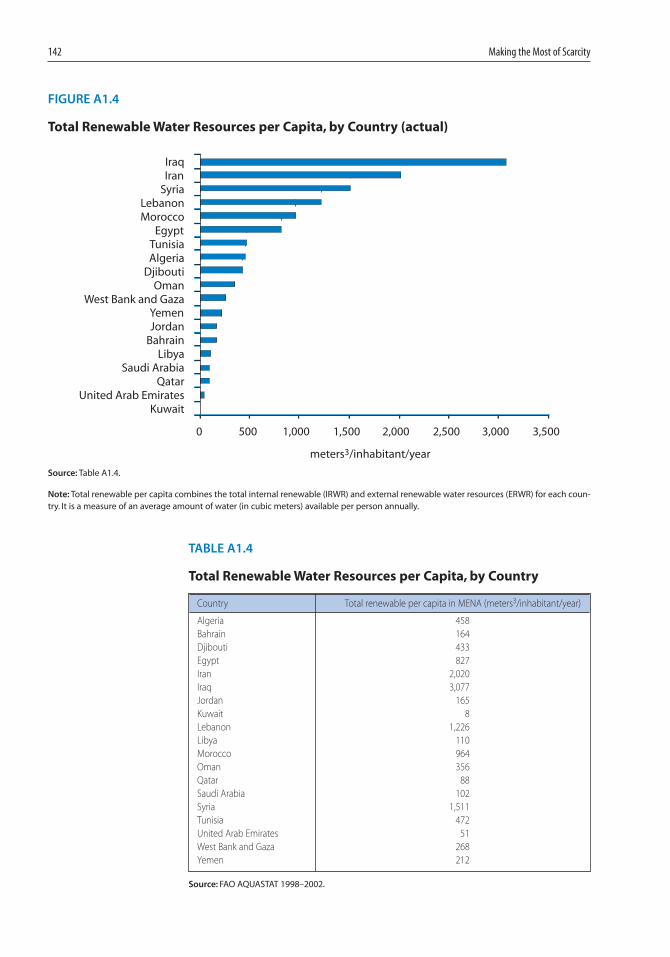
Total Renewable Water Resources per Capita, by Country (actual)
0 500 1,000 1,500 2,000 2,500 3,000 3,500
KuwaitUnited Arab Emirates
QatarSaudi Arabia
LibyaBahrainJordanYemen
West Bank and GazaOman
DjiboutiAlgeriaTunisia
EgyptMoroccoLebanon
SyriaIranIraq
meters3/inhabitant/year
Source: Table A1.4.
Note: Total renewable per capita combines the total internal renewable (IRWR) and external renewable water resources (ERWR) for each coun-try. It is a measure of an average amount of water (in cubic meters) available per person annually.
TABLE A1.4
Total Renewable Water Resources per Capita, by Country
Country Total renewable per capita in MENA (meters3/inhabitant/year)
Algeria 458
Bahrain 164
Djibouti 433
Egypt 827
Iran 2,020
Iraq 3,077
Jordan 165
Kuwait 8
Lebanon 1,226
Libya 110
Morocco 964
Oman 356
Qatar 88
Saudi Arabia 102
Syria 1,511
Tunisia 472
United Arab Emirates 51
West Bank and Gaza 268
Yemen 212
Source: FAO AQUASTAT 1998–2002.
06-App1_139-152 2/28/07 3:51 PM Page 142
Appendix 1: Water Resources Data 143
FIGURE A1.5A
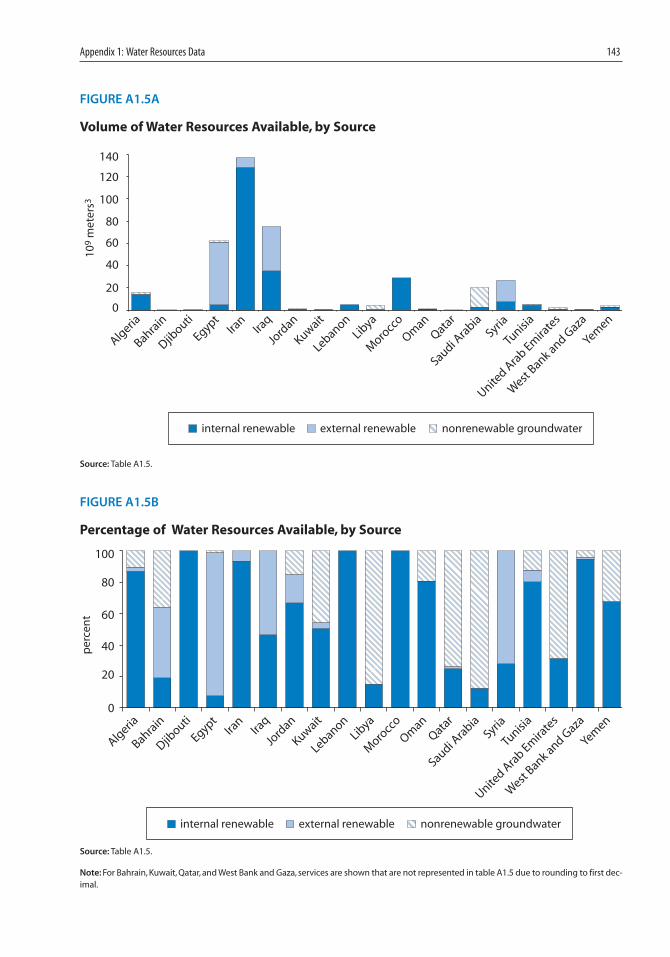
Volume of Water Resources Available, by Source
FIGURE A1.5B
Percentage of Water Resources Available, by Source
0
20
40
60
80
100
120
140
Algeria
Bahrain
Djibouti
EgyptIra
nIra
q
Jord
an
Kuwait
LebanonLib
ya
Moro
cco
Oman
Qatar
Saudi Ara
biaSyria
Tunisia
United A
rab Em
irate
s
West
Bank and Gaza
Yemen
internal renewable external renewable nonrenewable groundwater
109
met
ers3
Source: Table A1.5.
Source: Table A1.5.
Note: For Bahrain, Kuwait, Qatar, and West Bank and Gaza, services are shown that are not represented in table A1.5 due to rounding to first dec-imal.
0
20
40
60
80
100
Algeria
Bahrain
Djibouti
EgyptIra
nIra
q
Jord
an
Kuwait
LebanonLib
ya
Moro
cco
Oman
Qatar
Saudi Ara
biaSyria
Tunisia
United A
rab Em
irate
s
West
Bank and Gaza
Yemen
per
cen
t
internal renewable external renewable nonrenewable groundwater
06-App1_139-152 2/28/07 3:51 PM Page 143
144 Making the Most of Scarcity
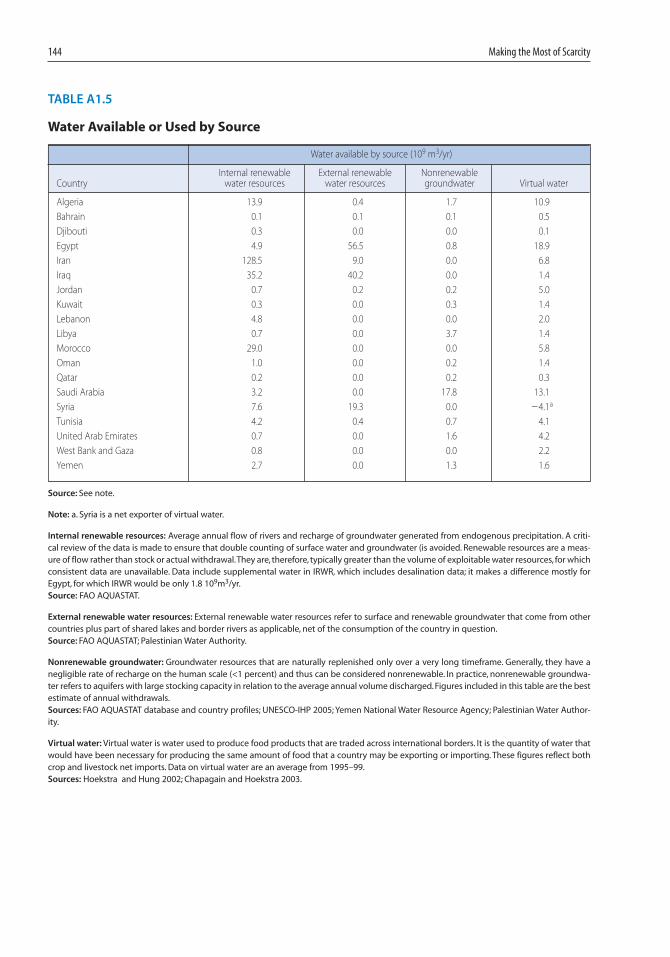
TABLE A1.5
Water Available or Used by Source
Water available by source (109 m3/yr)
Internal renewable External renewable Nonrenewable Country water resources water resources groundwater Virtual water
Algeria 13.9 0.4 1.7 10.9
Bahrain 0.1 0.1 0.1 0.5
Djibouti 0.3 0.0 0.0 0.1
Egypt 4.9 56.5 0.8 18.9
Iran 128.5 9.0 0.0 6.8
Iraq 35.2 40.2 0.0 1.4
Jordan 0.7 0.2 0.2 5.0
Kuwait 0.3 0.0 0.3 1.4
Lebanon 4.8 0.0 0.0 2.0
Libya 0.7 0.0 3.7 1.4
Morocco 29.0 0.0 0.0 5.8
Oman 1.0 0.0 0.2 1.4
Qatar 0.2 0.0 0.2 0.3
Saudi Arabia 3.2 0.0 17.8 13.1
Syria 7.6 19.3 0.0 �4.1a
Tunisia 4.2 0.4 0.7 4.1
United Arab Emirates 0.7 0.0 1.6 4.2
West Bank and Gaza 0.8 0.0 0.0 2.2
Yemen 2.7 0.0 1.3 1.6
Source: See note.
Note: a. Syria is a net exporter of virtual water.
Internal renewable resources: Average annual flow of rivers and recharge of groundwater generated from endogenous precipitation. A criti-cal review of the data is made to ensure that double counting of surface water and groundwater (is avoided. Renewable resources are a meas-ure of flow rather than stock or actual withdrawal.They are, therefore, typically greater than the volume of exploitable water resources, for whichconsistent data are unavailable. Data include supplemental water in IRWR, which includes desalination data; it makes a difference mostly forEgypt, for which IRWR would be only 1.8 109m3/yr.Source: FAO AQUASTAT.
External renewable water resources: External renewable water resources refer to surface and renewable groundwater that come from othercountries plus part of shared lakes and border rivers as applicable, net of the consumption of the country in question.Source: FAO AQUASTAT; Palestinian Water Authority.
Nonrenewable groundwater: Groundwater resources that are naturally replenished only over a very long timeframe. Generally, they have anegligible rate of recharge on the human scale (<1 percent) and thus can be considered nonrenewable. In practice, nonrenewable groundwa-ter refers to aquifers with large stocking capacity in relation to the average annual volume discharged. Figures included in this table are the bestestimate of annual withdrawals.Sources: FAO AQUASTAT database and country profiles; UNESCO-IHP 2005; Yemen National Water Resource Agency; Palestinian Water Author-ity.
Virtual water: Virtual water is water used to produce food products that are traded across international borders. It is the quantity of water thatwould have been necessary for producing the same amount of food that a country may be exporting or importing. These figures reflect bothcrop and livestock net imports. Data on virtual water are an average from 1995–99.Sources: Hoekstra and Hung 2002; Chapagain and Hoekstra 2003.
06-App1_139-152 2/28/07 3:51 PM Page 144
Appendix 1: Water Resources Data 145
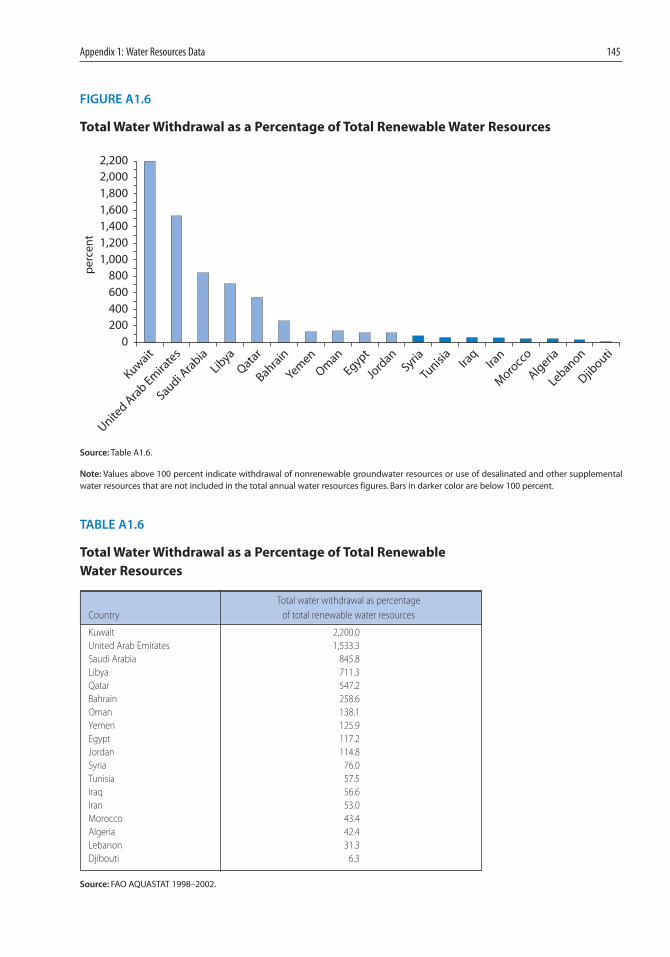
FIGURE A1.6
Total Water Withdrawal as a Percentage of Total Renewable Water Resources
0200400600800
1,0001,2001,4001,6001,8002,0002,200
Kuwait
United A
rab Em
irate
s
Saudi Ara
biaLib
yaQata
r
Bahrain
Yemen
Oman
Egypt
Jord
anSyria
Tunisia
Iraq
Iran
Moro
cco
Algeria
Lebanon
Djibouti
per
cen
t
Source: Table A1.6.
Note: Values above 100 percent indicate withdrawal of nonrenewable groundwater resources or use of desalinated and other supplementalwater resources that are not included in the total annual water resources figures. Bars in darker color are below 100 percent.
TABLE A1.6
Total Water Withdrawal as a Percentage of Total Renewable
Water Resources
Total water withdrawal as percentage
Country of total renewable water resources
Kuwait 2,200.0
United Arab Emirates 1,533.3
Saudi Arabia 845.8
Libya 711.3
Qatar 547.2
Bahrain 258.6
Oman 138.1
Yemen 125.9
Egypt 117.2
Jordan 114.8
Syria 76.0
Tunisia 57.5
Iraq 56.6
Iran 53.0
Morocco 43.4
Algeria 42.4
Lebanon 31.3
Djibouti 6.3
Source: FAO AQUASTAT 1998–2002.
06-App1_139-152 2/28/07 3:51 PM Page 145
146 Making the Most of Scarcity
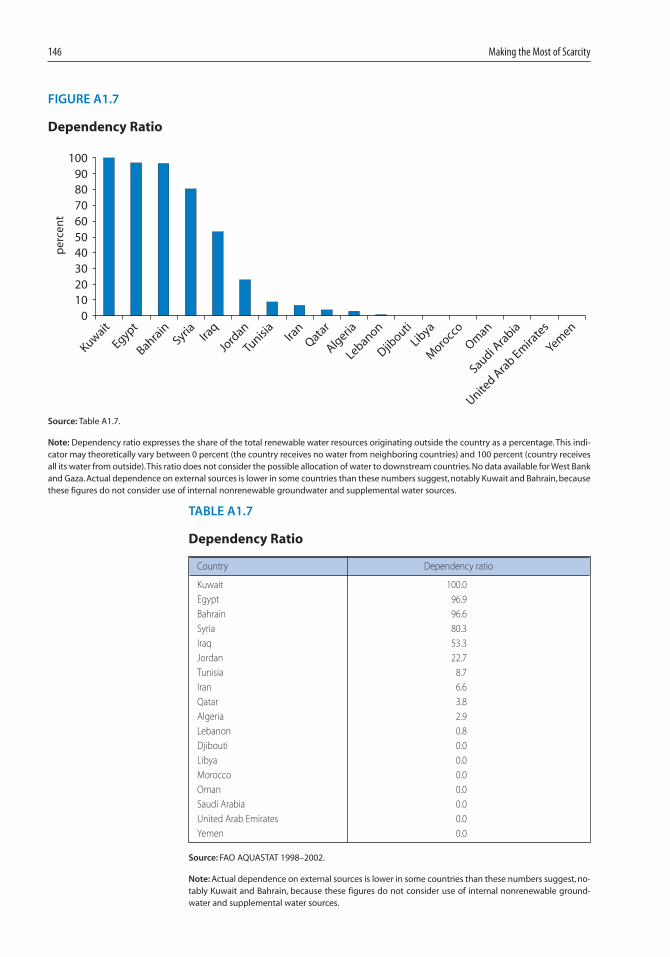
FIGURE A1.7
Dependency Ratio
0102030405060708090
100
Algeria
Bahrain
Djibouti
EgyptIra
nIra
q
Jord
an
Kuwait
LebanonLib
ya
Moro
cco
Oman
Qatar
Saudi Ara
biaSyria
Tunisia
United A
rab Em
irate
s
Yemen
per
cen
t
Source: Table A1.7.
Note: Dependency ratio expresses the share of the total renewable water resources originating outside the country as a percentage. This indi-cator may theoretically vary between 0 percent (the country receives no water from neighboring countries) and 100 percent (country receivesall its water from outside).This ratio does not consider the possible allocation of water to downstream countries. No data available for West Bankand Gaza. Actual dependence on external sources is lower in some countries than these numbers suggest, notably Kuwait and Bahrain, becausethese figures do not consider use of internal nonrenewable groundwater and supplemental water sources.
TABLE A1.7
Dependency Ratio
Country Dependency ratio
Kuwait 100.0
Egypt 96.9
Bahrain 96.6
Syria 80.3
Iraq 53.3
Jordan 22.7
Tunisia 8.7
Iran 6.6
Qatar 3.8
Algeria 2.9
Lebanon 0.8
Djibouti 0.0
Libya 0.0
Morocco 0.0
Oman 0.0
Saudi Arabia 0.0
United Arab Emirates 0.0
Yemen 0.0
Source: FAO AQUASTAT 1998–2002.
Note: Actual dependence on external sources is lower in some countries than these numbers suggest, no-tably Kuwait and Bahrain, because these figures do not consider use of internal nonrenewable ground-water and supplemental water sources.
06-App1_139-152 2/28/07 3:51 PM Page 146
Appendix 1: Water Resources Data 147
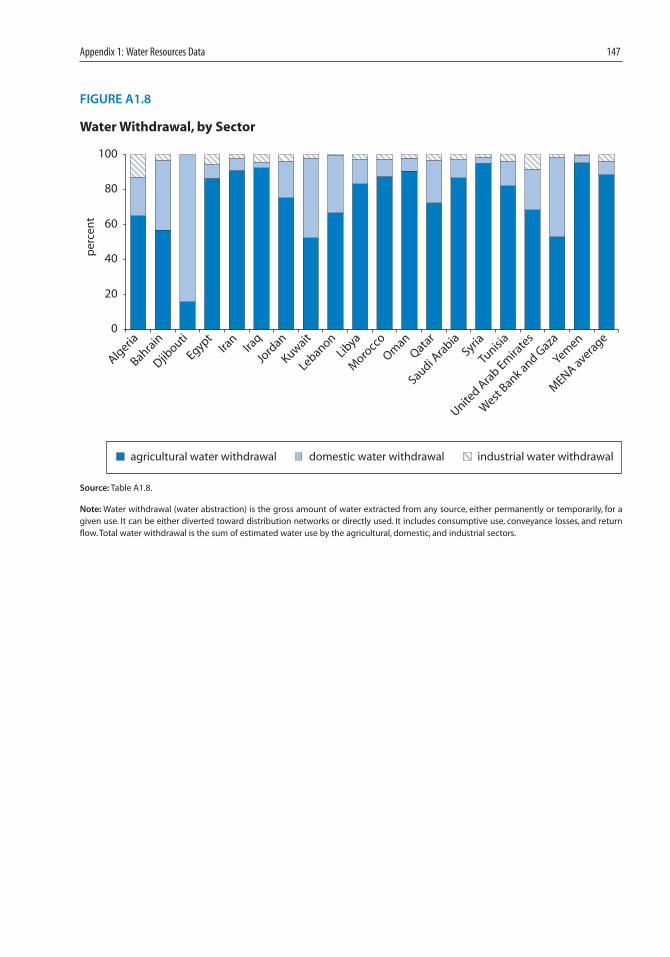
FIGURE A1.8
Water Withdrawal, by Sector
0
20
40
60
80
100
Algeria
Bahrain
Djibouti
EgyptIra
nIra
q
Jord
an
Kuwait
LebanonLib
ya
Moro
cco
Oman
Qatar
Saudi Ara
biaSyria
Tunisia
United A
rab Em
irate
s
West
Bank and Gaza
Yemen
MENA avera
ge
agricultural water withdrawal domestic water withdrawal industrial water withdrawal
per
cen
t
Source: Table A1.8.
Note: Water withdrawal (water abstraction) is the gross amount of water extracted from any source, either permanently or temporarily, for agiven use. It can be either diverted toward distribution networks or directly used. It includes consumptive use, conveyance losses, and returnflow. Total water withdrawal is the sum of estimated water use by the agricultural, domestic, and industrial sectors.
06-App1_139-152 2/28/07 3:51 PM Page 147
148 Making the Most of Scarcity
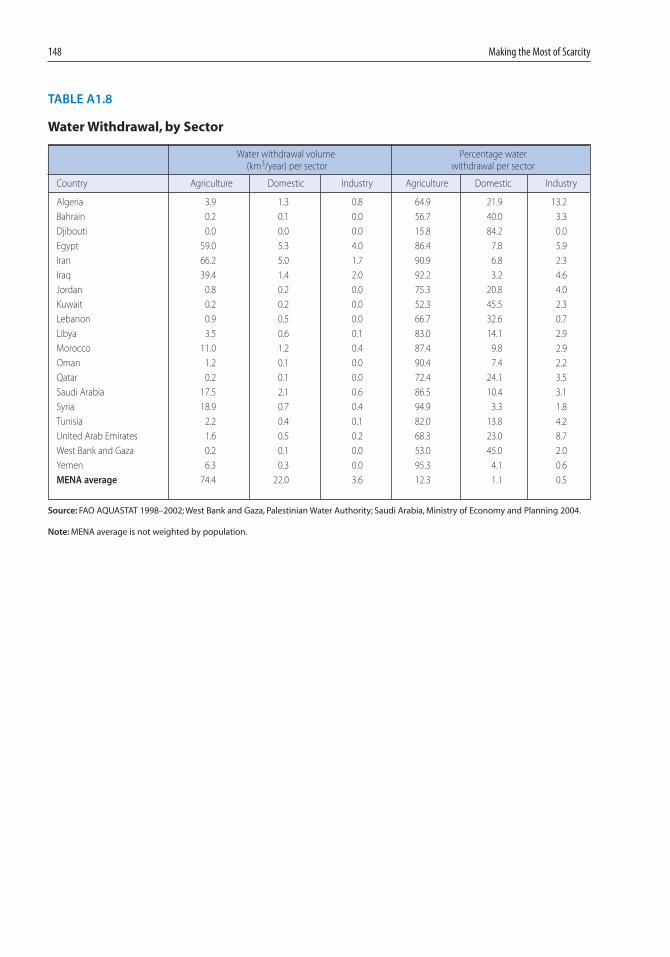
TABLE A1.8
Water Withdrawal, by Sector
Water withdrawal volume Percentage water (km3/year) per sector withdrawal per sector
Country Agriculture Domestic Industry Agriculture Domestic Industry
Algeria 3.9 1.3 0.8 64.9 21.9 13.2
Bahrain 0.2 0.1 0.0 56.7 40.0 3.3
Djibouti 0.0 0.0 0.0 15.8 84.2 0.0
Egypt 59.0 5.3 4.0 86.4 7.8 5.9
Iran 66.2 5.0 1.7 90.9 6.8 2.3
Iraq 39.4 1.4 2.0 92.2 3.2 4.6
Jordan 0.8 0.2 0.0 75.3 20.8 4.0
Kuwait 0.2 0.2 0.0 52.3 45.5 2.3
Lebanon 0.9 0.5 0.0 66.7 32.6 0.7
Libya 3.5 0.6 0.1 83.0 14.1 2.9
Morocco 11.0 1.2 0.4 87.4 9.8 2.9
Oman 1.2 0.1 0.0 90.4 7.4 2.2
Qatar 0.2 0.1 0.0 72.4 24.1 3.5
Saudi Arabia 17.5 2.1 0.6 86.5 10.4 3.1
Syria 18.9 0.7 0.4 94.9 3.3 1.8
Tunisia 2.2 0.4 0.1 82.0 13.8 4.2
United Arab Emirates 1.6 0.5 0.2 68.3 23.0 8.7
West Bank and Gaza 0.2 0.1 0.0 53.0 45.0 2.0
Yemen 6.3 0.3 0.0 95.3 4.1 0.6
MENA average 74.4 22.0 3.6 12.3 1.1 0.5
Source: FAO AQUASTAT 1998–2002; West Bank and Gaza, Palestinian Water Authority; Saudi Arabia, Ministry of Economy and Planning 2004.
Note: MENA average is not weighted by population.
06-App1_139-152 2/28/07 3:51 PM Page 148
Appendix 1: Water Resources Data 149
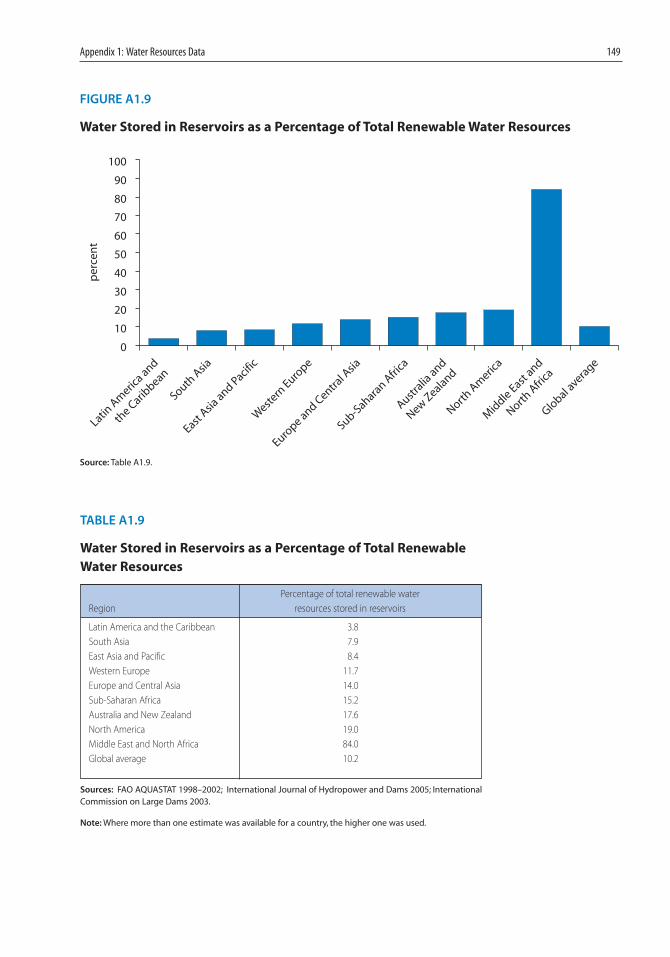
FIGURE A1.9
Water Stored in Reservoirs as a Percentage of Total Renewable Water Resources
0
10
20
30
40
50
60
70
80
90
100
Latin A
meric
a and
the C
aribbean
South A
sia
East Asia
and Pacific
Weste
rn Euro
pe
Europe and C
entral A
sia
Sub-Sahara
n Afri
ca
Australia
and
New Zealand
North A
meric
a
Mid
dle East and
North A
frica
Global a
verage
per
cen
t
Source: Table A1.9.
TABLE A1.9
Water Stored in Reservoirs as a Percentage of Total Renewable
Water Resources
Percentage of total renewable water
Region resources stored in reservoirs
Latin America and the Caribbean 3.8
South Asia 7.9
East Asia and Pacific 8.4
Western Europe 11.7
Europe and Central Asia 14.0
Sub-Saharan Africa 15.2
Australia and New Zealand 17.6
North America 19.0
Middle East and North Africa 84.0
Global average 10.2
Sources: FAO AQUASTAT 1998–2002; International Journal of Hydropower and Dams 2005; InternationalCommission on Large Dams 2003.
Note: Where more than one estimate was available for a country, the higher one was used.
06-App1_139-152 2/28/07 3:51 PM Page 149
150 Making the Most of Scarcity
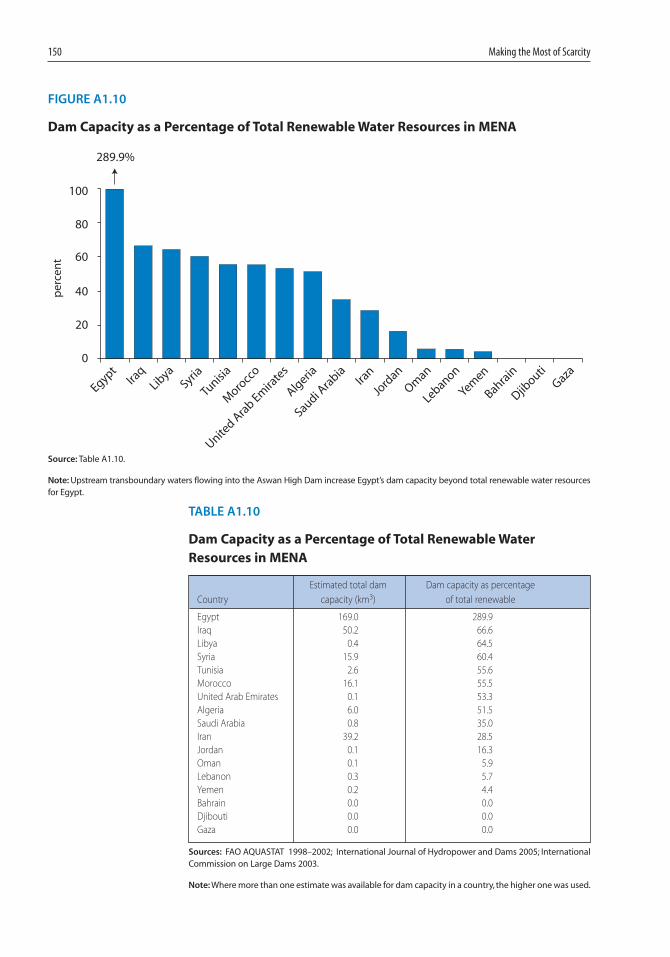
FIGURE A1.10
Dam Capacity as a Percentage of Total Renewable Water Resources in MENA
0
20
40
60
80
100
289.9%
EgyptIra
qLib
yaSyria
Tunisia
Moro
cco
United A
rab Em
irate
s
Algeria
Saudi Ara
biaIra
n
Jord
an
Oman
Lebanon
Yemen
Bahrain
Djibouti
Gaza
per
cen
t
Source: Table A1.10.
Note: Upstream transboundary waters flowing into the Aswan High Dam increase Egypt’s dam capacity beyond total renewable water resourcesfor Egypt.
TABLE A1.10
Dam Capacity as a Percentage of Total Renewable Water
Resources in MENA
Estimated total dam Dam capacity as percentage
Country capacity (km3) of total renewable
Egypt 169.0 289.9
Iraq 50.2 66.6
Libya 0.4 64.5
Syria 15.9 60.4
Tunisia 2.6 55.6
Morocco 16.1 55.5
United Arab Emirates 0.1 53.3
Algeria 6.0 51.5
Saudi Arabia 0.8 35.0
Iran 39.2 28.5
Jordan 0.1 16.3
Oman 0.1 5.9
Lebanon 0.3 5.7
Yemen 0.2 4.4
Bahrain 0.0 0.0
Djibouti 0.0 0.0
Gaza 0.0 0.0
Sources: FAO AQUASTAT 1998–2002; International Journal of Hydropower and Dams 2005; InternationalCommission on Large Dams 2003.
Note: Where more than one estimate was available for dam capacity in a country, the higher one was used.
06-App1_139-152 2/28/07 3:51 PM Page 150
Appendix 1: Water Resources Data 151
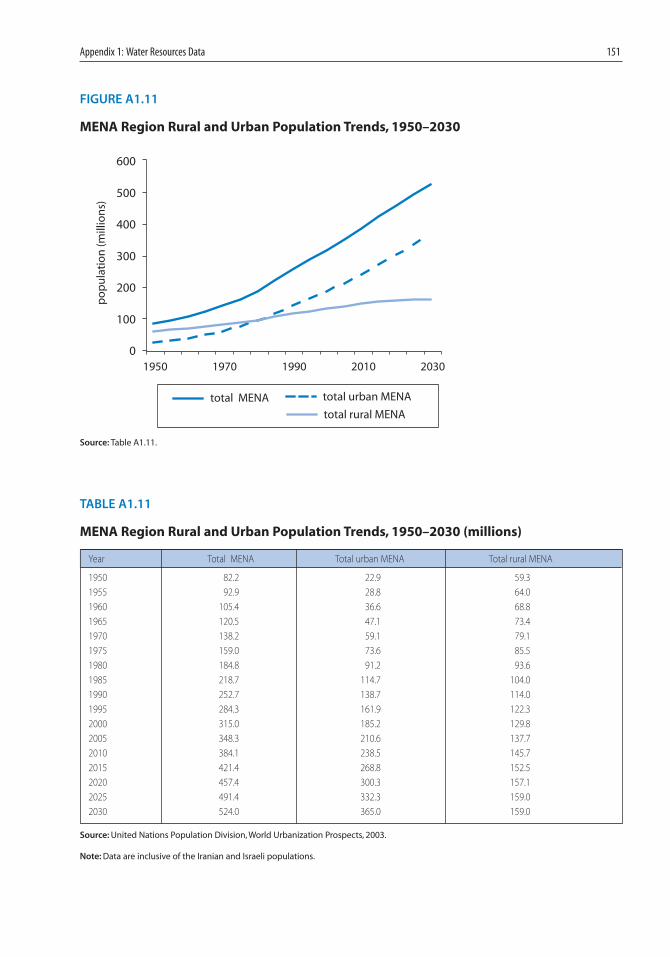
FIGURE A1.11
MENA Region Rural and Urban Population Trends, 1950–2030
0
100
200
300
400
500
600
1950 1970 1990 2010 2030
po
pu
lati
on
(mill
ion
s)
total MENA total urban MENA
total rural MENA
TABLE A1.11
MENA Region Rural and Urban Population Trends, 1950–2030 (millions)
Year Total MENA Total urban MENA Total rural MENA
1950 82.2 22.9 59.3
1955 92.9 28.8 64.0
1960 105.4 36.6 68.8
1965 120.5 47.1 73.4
1970 138.2 59.1 79.1
1975 159.0 73.6 85.5
1980 184.8 91.2 93.6
1985 218.7 114.7 104.0
1990 252.7 138.7 114.0
1995 284.3 161.9 122.3
2000 315.0 185.2 129.8
2005 348.3 210.6 137.7
2010 384.1 238.5 145.7
2015 421.4 268.8 152.5
2020 457.4 300.3 157.1
2025 491.4 332.3 159.0
2030 524.0 365.0 159.0
Source: United Nations Population Division, World Urbanization Prospects, 2003.
Note: Data are inclusive of the Iranian and Israeli populations.
Source: Table A1.11.
06-App1_139-152 2/28/07 3:51 PM Page 151

06-App1_139-152 2/28/07 3:51 PM Page 152
Water Services Data
APPENDIX 2
153
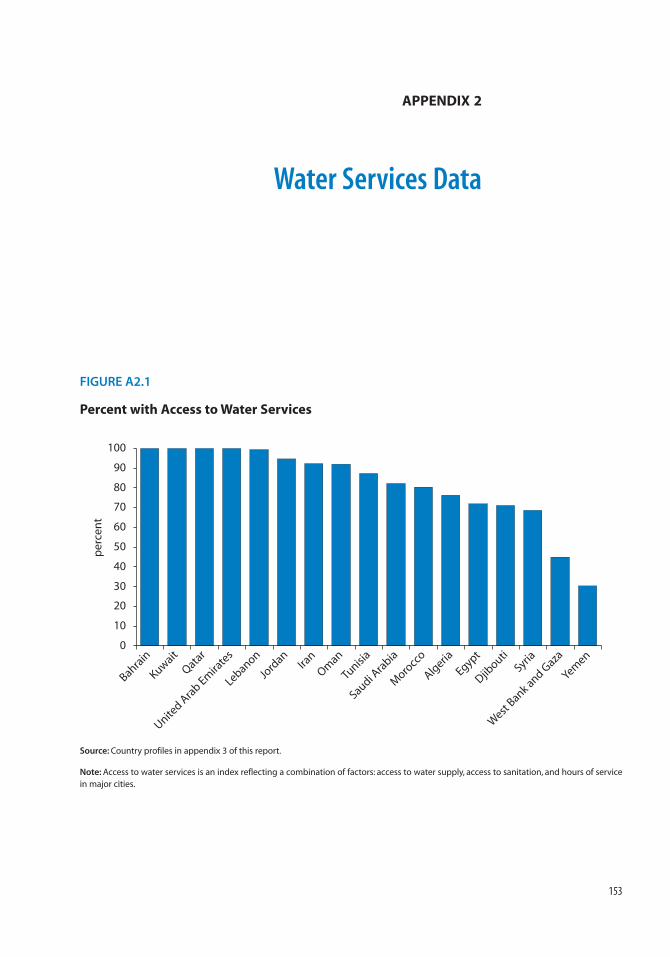
FIGURE A2.1
Percent with Access to Water Services
0
10
20
30
40
50
60
70
80
90
100
Bahrain
Kuwait
Qatar
United A
rab Em
irate
s
Lebanon
Jord
anIra
n
Oman
Tunisia
Saudi Ara
bia
Moro
cco
Algeria
Egypt
Djibouti
Syria
West
Bank and Gaza
Yemen
per
cen
t
Source: Country profiles in appendix 3 of this report.
Note: Access to water services is an index reflecting a combination of factors: access to water supply, access to sanitation, and hours of servicein major cities.
07-App2_153-158 2/28/07 3:51 PM Page 153
154 Making the Most of Scarcity
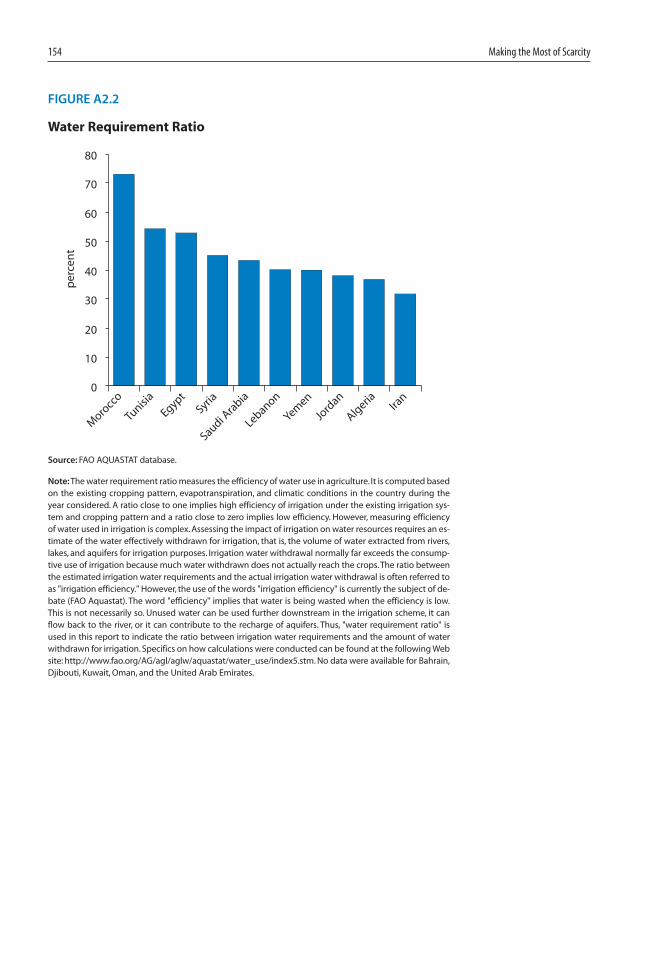
FIGURE A2.2
Water Requirement Ratio
0
10
20
30
40
50
60
70
80
Moro
cco
Tunisia
EgyptSyria
Saudi Ara
bia
Lebanon
Yemen
Jord
an
Algeria Ira
n
per
cen
t
Source: FAO AQUASTAT database.
Note: The water requirement ratio measures the efficiency of water use in agriculture. It is computed basedon the existing cropping pattern, evapotranspiration, and climatic conditions in the country during theyear considered. A ratio close to one implies high efficiency of irrigation under the existing irrigation sys-tem and cropping pattern and a ratio close to zero implies low efficiency. However, measuring efficiencyof water used in irrigation is complex. Assessing the impact of irrigation on water resources requires an es-timate of the water effectively withdrawn for irrigation, that is, the volume of water extracted from rivers,lakes, and aquifers for irrigation purposes. Irrigation water withdrawal normally far exceeds the consump-tive use of irrigation because much water withdrawn does not actually reach the crops.The ratio betweenthe estimated irrigation water requirements and the actual irrigation water withdrawal is often referred toas "irrigation efficiency." However, the use of the words "irrigation efficiency" is currently the subject of de-bate (FAO Aquastat). The word "efficiency" implies that water is being wasted when the efficiency is low.This is not necessarily so. Unused water can be used further downstream in the irrigation scheme, it canflow back to the river, or it can contribute to the recharge of aquifers. Thus, "water requirement ratio" isused in this report to indicate the ratio between irrigation water requirements and the amount of waterwithdrawn for irrigation. Specifics on how calculations were conducted can be found at the following Website: http://www.fao.org/AG/agl/aglw/aquastat/water_use/index5.stm. No data were available for Bahrain,Djibouti, Kuwait, Oman, and the United Arab Emirates.
07-App2_153-158 2/28/07 3:51 PM Page 154
Appendix 2: Water Services Data 155
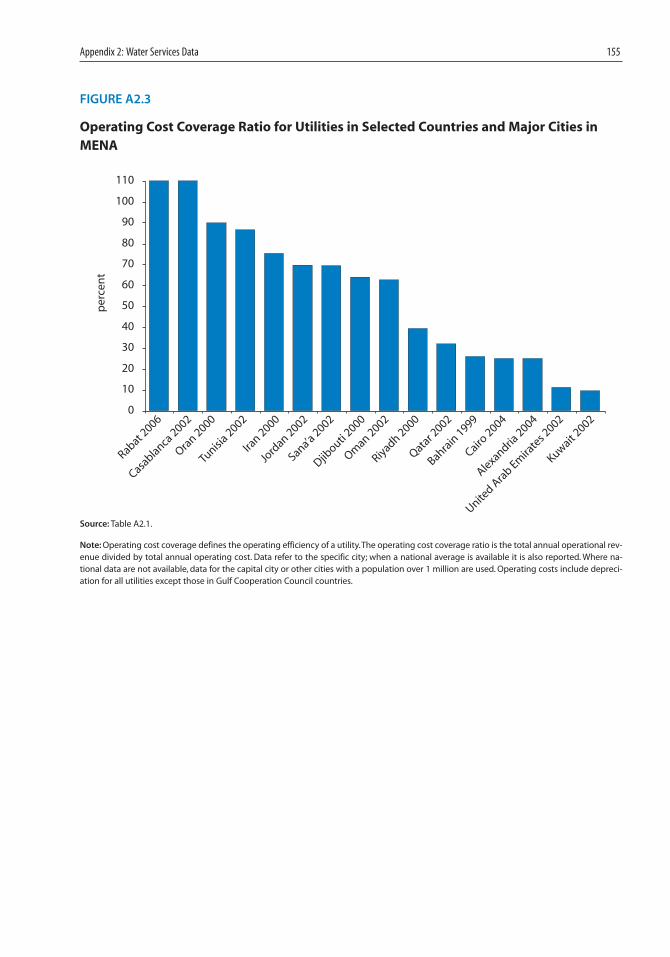
FIGURE A2.3
Operating Cost Coverage Ratio for Utilities in Selected Countries and Major Cities in
MENA
0
10
20
30
40
50
60
70
80
90
100
110
Rabat 2006
Casablanca
2002
Oran 2000
Tunisia 2002
Iran 2000
Jord
an 2002
Sana’a 2002
Djibouti
2000
Oman 2002
Riyadh 2000
Qatar 2
002
Bahrain
1999
Cairo 2004
Alexandria 2004
United A
rab Em
irate
s 2002
Kuwait 2002
per
cen
t
Source: Table A2.1.
Note: Operating cost coverage defines the operating efficiency of a utility.The operating cost coverage ratio is the total annual operational rev-enue divided by total annual operating cost. Data refer to the specific city; when a national average is available it is also reported. Where na-tional data are not available, data for the capital city or other cities with a population over 1 million are used. Operating costs include depreci-ation for all utilities except those in Gulf Cooperation Council countries.
07-App2_153-158 2/28/07 3:51 PM Page 155
156 Making the Most of Scarcity
TABLE A2.1
Sources for Operating Cost Coverage Ratios
Country and data year City and data year Operating cost coverage (ratio) Source
Morocco Rabat 2006 1.10 World Bank 2006e
Morocco Casablanca 2006 1.10 World Bank 2006e
Algeria Oran 2000 0.90 IBNET database
Tunisia 2002 n.a. 0.87 World Bank 2005g
Iran 2000 n.a. 0.75 World Bank 2005f
Jordan 2002 n.a. 0.70 Stone and Webster 2004
Yemen Sana'a 2002 0.69 Figure provided by Yemeni Water
Companies
Djibouti 2000 n.a. 0.64 World Bank 2004k
Oman 2002 n.a. 0.63 World Bank 2005l
Saudi Arabia Riyadh 2000 0.39 IBNET database
Saudi Arabia Medina 2000 0.34 IBNET database
Qatar 2002 n.a. 0.32 World Bank 2005l
Bahrain 1999 n.a. 0.26 World Bank 2005l
Egypt Cairo 2004 0.25 World Bank 2005b
Egypt Alexandria 2004 0.25 World Bank 2005b
United Arab Emirates 2002 n.a. 0.11 World Bank 2005l
Kuwait 2002 n.a. 0.10 Kuwait Ministry of Energy and Water 2003
Source: Appendix 3 of this report.
Note: n.a.= Not applicable.
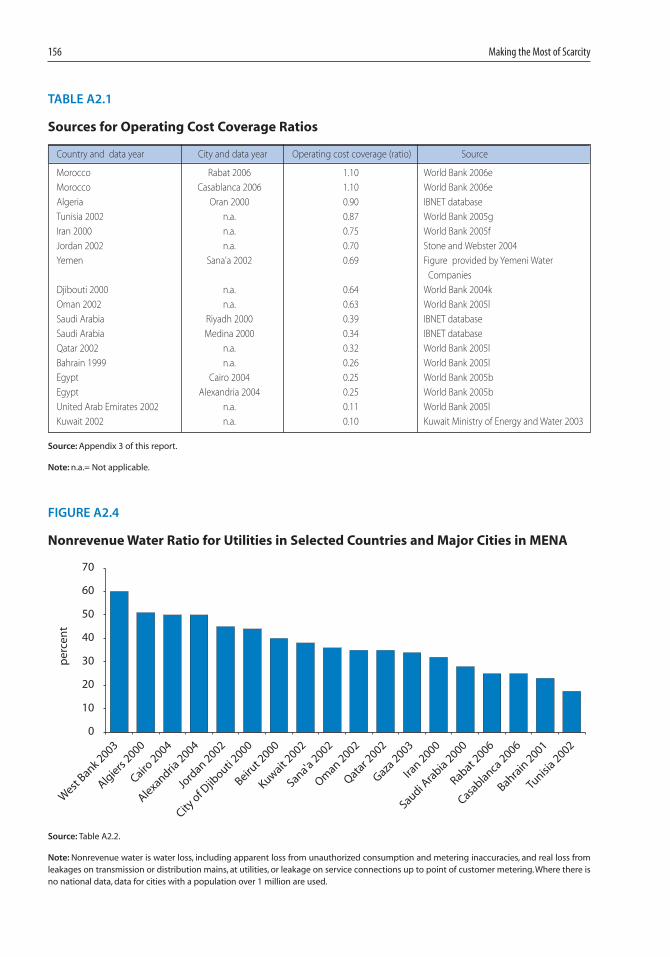
FIGURE A2.4
Nonrevenue Water Ratio for Utilities in Selected Countries and Major Cities in MENA
0
10
20
30
40
50
60
70
West
Bank 2003
Algiers
2000
Cairo 2004
Alexandria 2004
Jord
an 2002
City of D
jibouti
2000
Beirut 2
000
Kuwait 2002
Sana'a 2002
Oman 2002
Qatar 2
002
Gaza 2003
Iran 2000
Saudi Ara
bia 2000
Rabat 2006
Casablanca
2006
Bahrain
2001
Tunisia 2002
per
cen
t
Source: Table A2.2.
Note: Nonrevenue water is water loss, including apparent loss from unauthorized consumption and metering inaccuracies, and real loss fromleakages on transmission or distribution mains, at utilities, or leakage on service connections up to point of customer metering.Where there isno national data, data for cities with a population over 1 million are used.
07-App2_153-158 2/28/07 3:51 PM Page 156
Appendix 2: Water Services Data 157
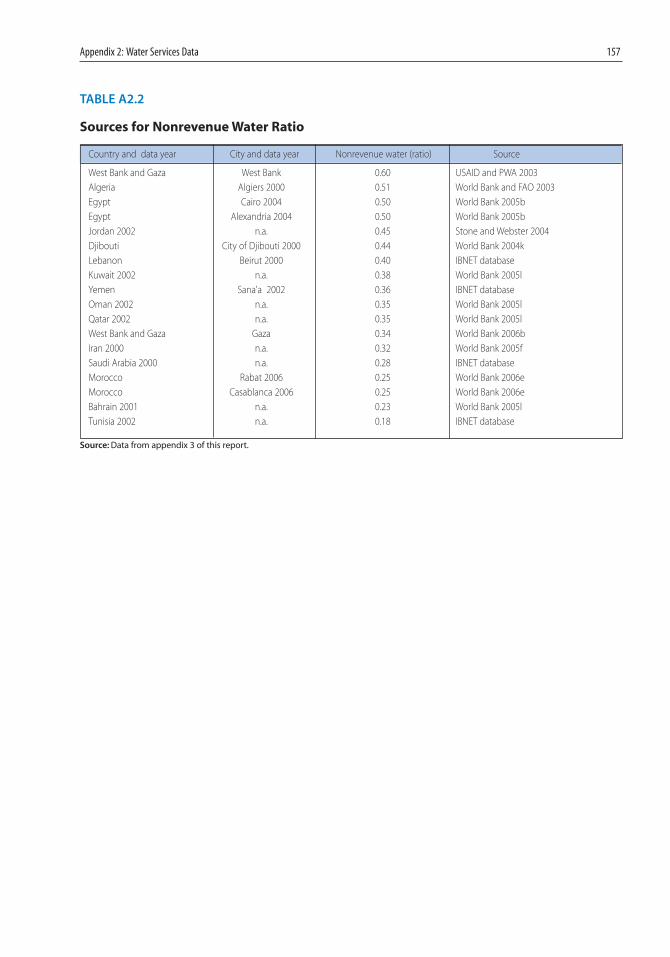
TABLE A2.2
Sources for Nonrevenue Water Ratio
Country and data year City and data year Nonrevenue water (ratio) Source
West Bank and Gaza West Bank 0.60 USAID and PWA 2003
Algeria Algiers 2000 0.51 World Bank and FAO 2003
Egypt Cairo 2004 0.50 World Bank 2005b
Egypt Alexandria 2004 0.50 World Bank 2005b
Jordan 2002 n.a. 0.45 Stone and Webster 2004
Djibouti City of Djibouti 2000 0.44 World Bank 2004k
Lebanon Beirut 2000 0.40 IBNET database
Kuwait 2002 n.a. 0.38 World Bank 2005l
Yemen Sana'a 2002 0.36 IBNET database
Oman 2002 n.a. 0.35 World Bank 2005l
Qatar 2002 n.a. 0.35 World Bank 2005l
West Bank and Gaza Gaza 0.34 World Bank 2006b
Iran 2000 n.a. 0.32 World Bank 2005f
Saudi Arabia 2000 n.a. 0.28 IBNET database
Morocco Rabat 2006 0.25 World Bank 2006e
Morocco Casablanca 2006 0.25 World Bank 2006e
Bahrain 2001 n.a. 0.23 World Bank 2005l
Tunisia 2002 n.a. 0.18 IBNET database
Source: Data from appendix 3 of this report.
07-App2_153-158 2/28/07 3:51 PM Page 157

07-App2_153-158 2/28/07 3:51 PM Page 158
Country Profiles
APPENDIX 3
159
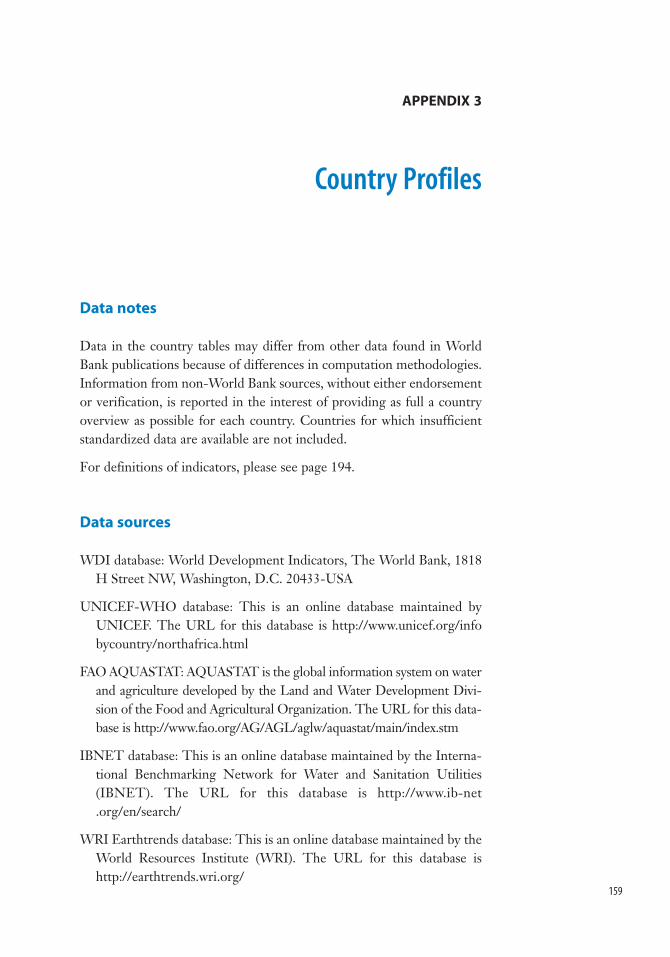
Data notes
Data in the country tables may differ from other data found in WorldBank publications because of differences in computation methodologies.Information from non-World Bank sources, without either endorsementor verification, is reported in the interest of providing as full a countryoverview as possible for each country. Countries for which insufficientstandardized data are available are not included.
For definitions of indicators, please see page 194.
Data sources
WDI database: World Development Indicators, The World Bank, 1818H Street NW, Washington, D.C. 20433-USA
UNICEF-WHO database: This is an online database maintained byUNICEF. The URL for this database is http://www.unicef.org/infobycountry/northafrica.html
FAO AQUASTAT: AQUASTAT is the global information system on waterand agriculture developed by the Land and Water Development Divi-sion of the Food and Agricultural Organization. The URL for this data-base is http://www.fao.org/AG/AGL/aglw/aquastat/main/index.stm
IBNET database: This is an online database maintained by the Interna-tional Benchmarking Network for Water and Sanitation Utilities(IBNET). The URL for this database is http://www.ib-net.org/en/search/
WRI Earthtrends database: This is an online database maintained by theWorld Resources Institute (WRI). The URL for this database ishttp://earthtrends.wri.org/
08-App3_159-198 2/28/07 3:51 PM Page 159

160 Making the Most of Scarcity
Algeria
Indicator Country MENA Source
Socioeconomic indicators
Total population (millions of people), 2004 32.4 294 WDI database
Urban population 19.2 172.5 WDI database
Rural population 13.2 121.5 WDI database
Population with access to improved drinking water (%), 2002 87 90 UNICEF-WHO database
Urban 92 96 UNICEF-WHO database
Rural 80 81 UNICEF-WHO database
Hours of access to tap water in Algiers (hours/day) 12 n.a. Expert opinion
Percentage of population with access to improved sanitation, 2002 92 76 UNICEF-WHO database
Urban 99 90 UNICEF-WHO database
Rural 82 57 UNICEF-WHO database
Under 5 mortality, per 1,000 live births, 2003 41 55.9 WDI database
Macroeconomic indicators
GNI per capita, Atlas method (current US$), 2004 2,280 2,000 WDI database
GDP (millions of constant US$ at 2000 prices), 2004 64,146 — WDI database
Share of agriculture in GDP (%), 2004 12.7 13.6 WDI database
Share of industry in GDP (%), 2004 73.5 39.2 WDI database
Share of oil in GDP (%), 2003 36.2 — WDI database
Average annual growth
Average annual growth of GDP at constant prices 4.2 4.3 WDI database
Average annual growth of GDP per capita at constant prices 2.6 2.5 WDI database
Average annual growth of population 1.6 1.9 WDI database
Land and water resources
Land area (million hectares) 238.2 948.9 FAO AQUASTAT
Average precipitation (mm/yr), 1998–2002 89 181.6 FAO AQUASTAT
Renewable water resources, 2002
Internal water resources
Surface water (1,000 million m3) 13.2 153.1 FAO AQUASTAT
Ground water (1,000 million m3) 1.7 77.2 FAO AQUASTAT
Total internal water resources (1,000 million m3) 13.9 198.7 FAO AQUASTAT
Total external water resources (1,000 million m3) 0.4 85.5 FAO AQUASTAT
Total renewable water resources (1,000 million m3) 14.3 284.3 FAO AQUASTAT
Exploitable water resources (1,000 million m3) 11.2 108.0 FAO AQUASTAT
Per capita renewable water resource available (1,000 m3) 0.44 1.1 FAO AQUASTAT
Total renewable water resources as % of total water use 235.9 133.0 FAO AQUASTAT
Dependency ratio (%) 2.9 — FAO AQUASTAT
Water withdrawals, 2002
Agricultural (1,000 million m3) 3.9 188.3 FAO AQUASTAT
Domestic (1,000 million m3) 1.3 17.5 FAO AQUASTAT
Industrial (1,000 million m3) 0.8 7.9 FAO AQUASTAT
Total withdrawals (1,000 million m3) 6.1 213.8 FAO AQUASTAT
Virtual water
Virtual water imports in crops (1,000 million m3) 9.8 57.8 Hoekstra and Hung 2002
Virtual water imports in livestock (1,000 million m3) 1.1 14.4 Chapagain and Hoekstra
2003
Total virtual water (1,000 million m3) 10.9 74.4 Hoekstra and Hung 2002;
Chapagain and Hoekstra
2003
Supplemental (desalinated and retreated and reused),
(1,000 million m3) 0 4.8 FAO AQUASTAT
08-App3_159-198 2/28/07 3:51 PM Page 160
Appendix 3: Country Profiles 161
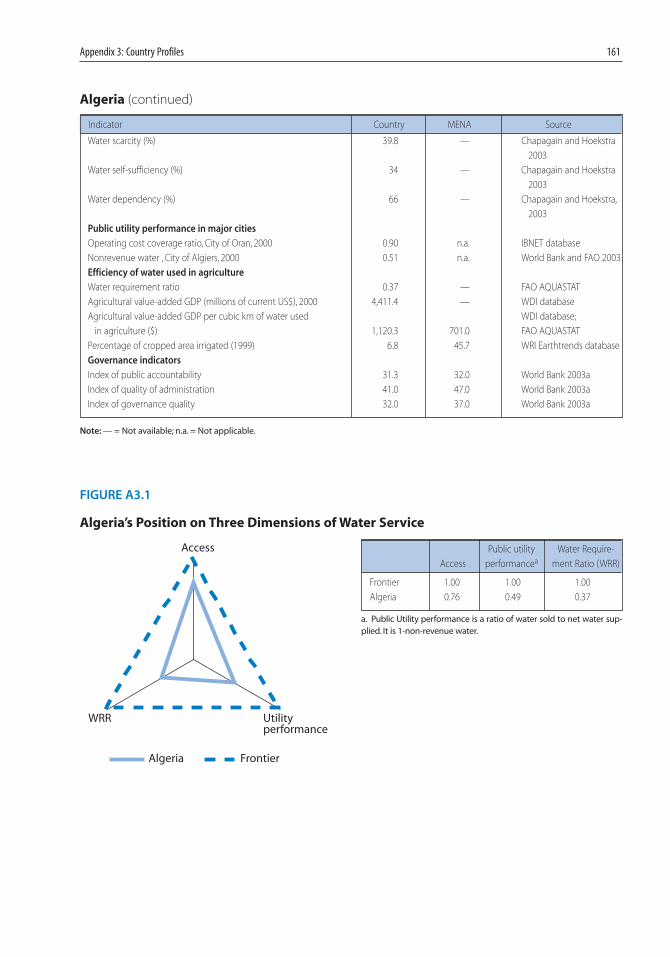
Algeria (continued)
Indicator Country MENA Source
Water scarcity (%) 39.8 — Chapagain and Hoekstra
2003
Water self-sufficiency (%) 34 — Chapagain and Hoekstra
2003
Water dependency (%) 66 — Chapagain and Hoekstra,
2003
Public utility performance in major cities
Operating cost coverage ratio, City of Oran, 2000 0.90 n.a. IBNET database
Nonrevenue water , City of Algiers, 2000 0.51 n.a. World Bank and FAO 2003
Efficiency of water used in agriculture
Water requirement ratio 0.37 — FAO AQUASTAT
Agricultural value-added GDP (millions of current US$), 2000 4,411.4 — WDI database
Agricultural value-added GDP per cubic km of water used WDI database;
in agriculture ($) 1,120.3 701.0 FAO AQUASTAT
Percentage of cropped area irrigated (1999) 6.8 45.7 WRI Earthtrends database
Governance indicators
Index of public accountability 31.3 32.0 World Bank 2003a
Index of quality of administration 41.0 47.0 World Bank 2003a
Index of governance quality 32.0 37.0 World Bank 2003a
Note: — = Not available; n.a. = Not applicable.
FIGURE A3.1
Algeria’s Position on Three Dimensions of Water Service
Algeria Frontier
Access
Utilityperformance
WRR
Public utility Water Require-
Access performancea ment Ratio (WRR)
Frontier 1.00 1.00 1.00
Algeria 0.76 0.49 0.37
a. Public Utility performance is a ratio of water sold to net water sup-plied. It is 1-non-revenue water.
08-App3_159-198 2/28/07 3:51 PM Page 161
162 Making the Most of Scarcity
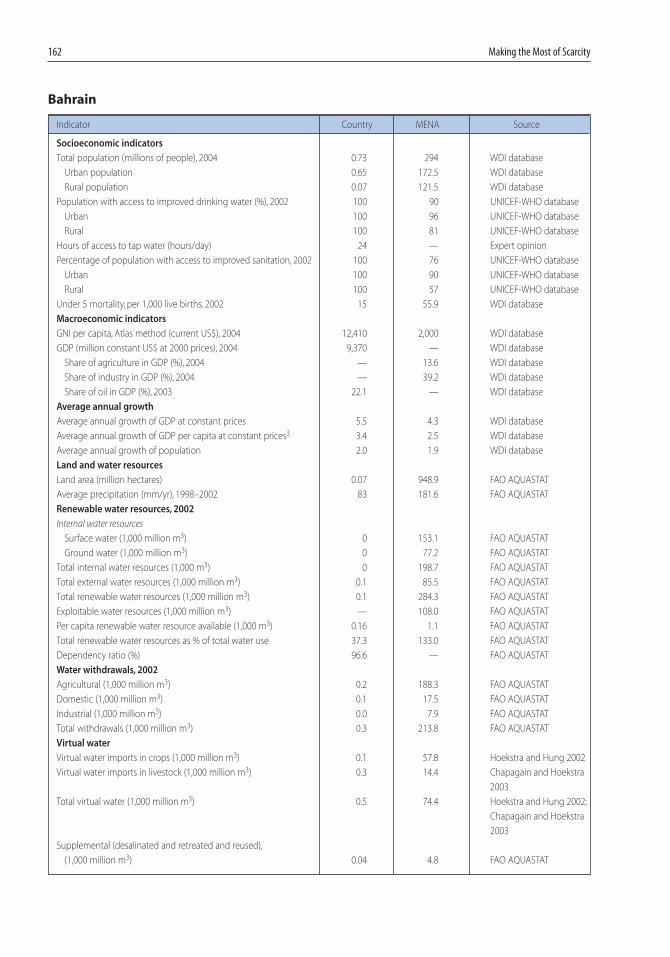
Bahrain
Indicator Country MENA Source
Socioeconomic indicators
Total population (millions of people), 2004 0.73 294 WDI database
Urban population 0.65 172.5 WDI database
Rural population 0.07 121.5 WDI database
Population with access to improved drinking water (%), 2002 100 90 UNICEF-WHO database
Urban 100 96 UNICEF-WHO database
Rural 100 81 UNICEF-WHO database
Hours of access to tap water (hours/day) 24 — Expert opinion
Percentage of population with access to improved sanitation, 2002 100 76 UNICEF-WHO database
Urban 100 90 UNICEF-WHO database
Rural 100 57 UNICEF-WHO database
Under 5 mortality, per 1,000 live births, 2002 15 55.9 WDI database
Macroeconomic indicators
GNI per capita, Atlas method (current US$), 2004 12,410 2,000 WDI database
GDP (million constant US$ at 2000 prices), 2004 9,370 — WDI database
Share of agriculture in GDP (%), 2004 — 13.6 WDI database
Share of industry in GDP (%), 2004 — 39.2 WDI database
Share of oil in GDP (%), 2003 22.1 — WDI database
Average annual growth
Average annual growth of GDP at constant prices 5.5 4.3 WDI database
Average annual growth of GDP per capita at constant prices3 3.4 2.5 WDI database
Average annual growth of population 2.0 1.9 WDI database
Land and water resources
Land area (million hectares) 0.07 948.9 FAO AQUASTAT
Average precipitation (mm/yr), 1998–2002 83 181.6 FAO AQUASTAT
Renewable water resources, 2002
Internal water resources
Surface water (1,000 million m3) 0 153.1 FAO AQUASTAT
Ground water (1,000 million m3) 0 77.2 FAO AQUASTAT
Total internal water resources (1,000 m3) 0 198.7 FAO AQUASTAT
Total external water resources (1,000 million m3) 0.1 85.5 FAO AQUASTAT
Total renewable water resources (1,000 million m3) 0.1 284.3 FAO AQUASTAT
Exploitable water resources (1,000 million m3) — 108.0 FAO AQUASTAT
Per capita renewable water resource available (1,000 m3) 0.16 1.1 FAO AQUASTAT
Total renewable water resources as % of total water use 37.3 133.0 FAO AQUASTAT
Dependency ratio (%) 96.6 — FAO AQUASTAT
Water withdrawals, 2002
Agricultural (1,000 million m3) 0.2 188.3 FAO AQUASTAT
Domestic (1,000 million m3) 0.1 17.5 FAO AQUASTAT
Industrial (1,000 million m3) 0.0 7.9 FAO AQUASTAT
Total withdrawals (1,000 million m3) 0.3 213.8 FAO AQUASTAT
Virtual water
Virtual water imports in crops (1,000 million m3) 0.1 57.8 Hoekstra and Hung 2002
Virtual water imports in livestock (1,000 million m3) 0.3 14.4 Chapagain and Hoekstra
2003
Total virtual water (1,000 million m3) 0.5 74.4 Hoekstra and Hung 2002;
Chapagain and Hoekstra
2003
Supplemental (desalinated and retreated and reused),
(1,000 million m3) 0.04 4.8 FAO AQUASTAT
08-App3_159-198 2/28/07 3:51 PM Page 162

Appendix 3: Country Profiles 163
Bahrain (continued)
Indicator Country MENA Source
Water scarcity (%) 236.3 — Chapagain and Hoekstra
2003
Water self-sufficiency (%) 37 — Chapagain and Hoekstra
2003
Water dependency (%) 63 — Chapagain and Hoekstra
2003
Public utility performance in major cities
Operating cost coverage ratio, 1999 0.26 n.a. World Bank 2005l
Nonrevenue water, 2001 0.23 n.a. World Bank 2005l
Efficiency of water used in agriculture
Water requirement ratio — —
Agricultural value-added GDP (millions of current US$), 2000 50.5 — WDI database
Agricultural value-added GDP per cubic km of water used WDI database;
in agriculture ($) 296.9 701.0 FAO AQUASTAT
Percentage of cropped area irrigated (1999) 83.3 45.7 WRI Earthtrends database
Governance indicators
Index of public accountability 31.5 32.0 World Bank 2003a
Index of quality of administration 66.0 47.0 World Bank 2003a
Index of governance quality 50.0 37.0 World Bank 2003a
Note: — = Not available; n.a. = Not applicable.
FIGURE A3.2
Bahrain’s Position on Three Dimensions of Water Service
Bahrain Frontier
Access
Utilityperformance
WRR
Public utility Water Require-
Access performancea ment Ratio (WRR)
Frontier 1.00 1.00 1.00
Bahrain 1.00 0.77 —
a. Public Utility performance is a ratio of water sold to net water sup-plied. It is 1-non-revenue water.
Note: The value for WRR in the figure is set to 0 because the actual number is not available.
08-App3_159-198 2/28/07 3:51 PM Page 163
164 Making the Most of Scarcity
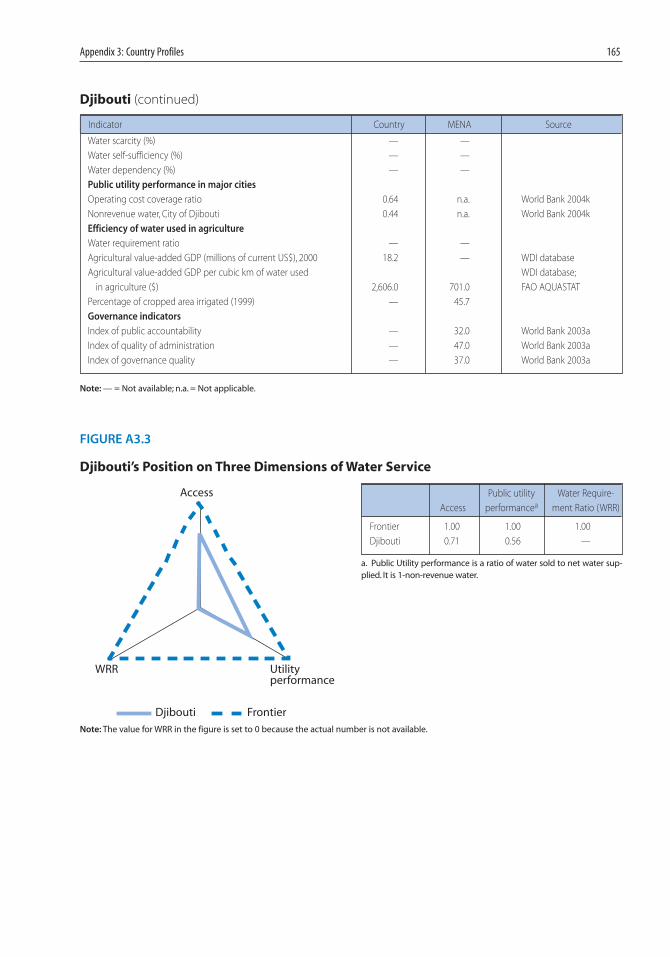
Djibouti
Indicator Country MENA Source
Socioeconomic indicators
Total population (millions of people), 2004 0.72 294 WDI database
Urban population 0.61 172.5 WDI database
Rural population 0.11 121.5 WDI database
Population with access to improved drinking water (%), 2002 80 90 UNICEF-WHO database
Urban 82 96 UNICEF-WHO database
Rural 67 81 UNICEF-WHO database
Hours of access to tap water in City of Djibouti (hours/day) 20 — Expert opinion
Percentage of population with access to improved sanitation, 2002 50 76 UNICEF-WHO database
Urban 55 90 UNICEF-WHO database
Rural 27 57 UNICEF-WHO database
Under 5 mortality, per 1,000 live births, 2003 138 55.9 WDI database
Macroeconomic indicators
GNI per capita, Atlas method (current US$), 2004 1,030 2,000 WDI database
GDP (million constant US$ at 2000 prices), 2004 616 — WDI database
Share of agriculture in GDP (%), 2004 3.7 13.6 WDI database
Share of industry in GDP (%), 2004 14.2 39.2 WDI database
Share of oil in GDP (%), 2003 — —
Average annual growth
Average annual growth of GDP at constant prices 2.3 4.3 WDI database
Average annual growth of GDP per capita at constant prices 0.4 2.5 WDI database
Average annual growth of population 1.9 1.9 WDI database
Land and water resources
Land area (million hectares) 2.3 948.9 FAO AQUASTAT
Average precipitation (mm/yr), 1998–2002 220 181.6 FAO AQUASTAT
Renewable water resources, 2002
Internal water resources
Surface water (1,000 million m3) 0.3 153.1 FAO AQUASTAT
Ground water (1,000 million m3) 0 77.2 FAO AQUASTAT
Total internal water resources (1,000 million m3) 0.3 198.7 FAO AQUASTAT
Total external water resources (1,000 million m3) 0.0 85.5 FAO AQUASTAT
Total renewable water resources (1,000 million m3) 0.3 284.3 FAO AQUASTAT
Exploitable water resources (1,000 million m3) — 108.0 FAO AQUASTAT
Per capita renewable water resource available (1,000 m3) 0.4 1.1 FAO AQUASTAT
Total renewable water resources as % of total water use 1578.9 133.0 FAO AQUASTAT
Dependency ratio (%) 0.00 — FAO AQUASTAT
Water withdrawals, 2002
Agricultural (1,000 million m3) 0.00 188.3 FAO AQUASTAT
Domestic (1,000 million m3) 0.02 17.5 FAO AQUASTAT
Industrial (1,000 million m3) 0.00 7.9 FAO AQUASTAT
Total withdrawals (1,000 million m3) 0.02 213.8 FAO AQUASTAT
Virtual water
Virtual water imports in crops (1,000 million m3) 0.1 57.8 Hoekstra and Hung 2002
Virtual water imports in livestock (1,000 million m3) 0.0 14.4 Chapagain and Hoekstra
2003
Total virtual water (1,000 million m3) 0.1 74.4 Hoekstra and Hung 2002;
Chapagain and Hoekstra
2003
Supplemental (desalinated and retreated and reused),
(1,000 million m3) 0 4.8 FAO AQUASTAT
08-App3_159-198 2/28/07 3:51 PM Page 164
Appendix 3: Country Profiles 165
Djibouti (continued)
Indicator Country MENA Source
Water scarcity (%) — —
Water self-sufficiency (%) — —
Water dependency (%) — —
Public utility performance in major cities
Operating cost coverage ratio 0.64 n.a. World Bank 2004k
Nonrevenue water, City of Djibouti 0.44 n.a. World Bank 2004k
Efficiency of water used in agriculture
Water requirement ratio — —
Agricultural value-added GDP (millions of current US$), 2000 18.2 — WDI database
Agricultural value-added GDP per cubic km of water used WDI database;
in agriculture ($) 2,606.0 701.0 FAO AQUASTAT
Percentage of cropped area irrigated (1999) — 45.7
Governance indicators
Index of public accountability — 32.0 World Bank 2003a
Index of quality of administration — 47.0 World Bank 2003a
Index of governance quality — 37.0 World Bank 2003a
Note: — = Not available; n.a. = Not applicable.
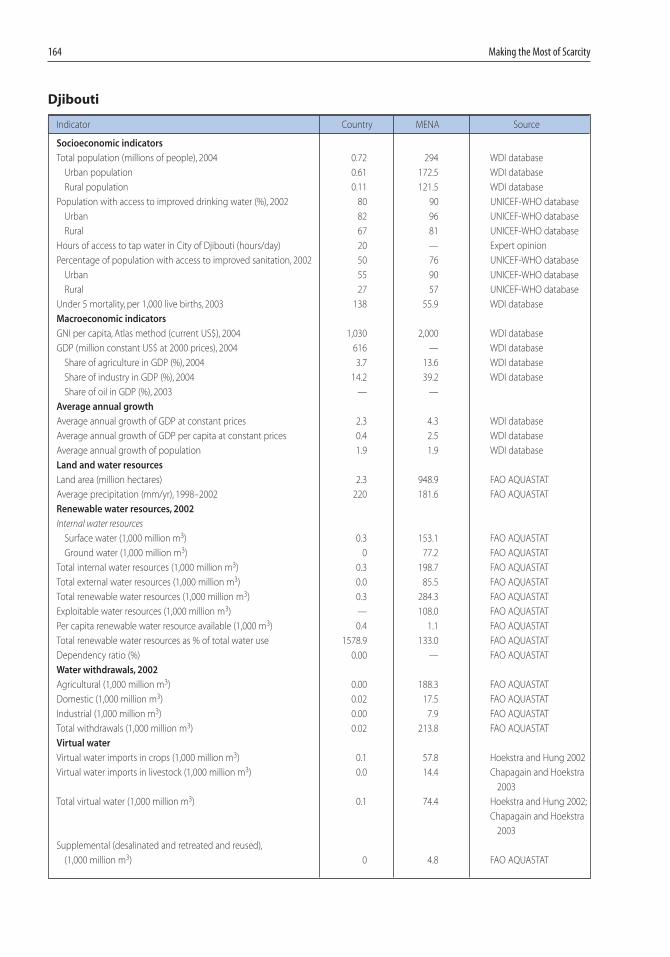
FIGURE A3.3
Djibouti’s Position on Three Dimensions of Water Service
Djibouti Frontier
Access
Utilityperformance
WRR
Public utility Water Require-
Access performancea ment Ratio (WRR)
Frontier 1.00 1.00 1.00
Djibouti 0.71 0.56 —
a. Public Utility performance is a ratio of water sold to net water sup-plied. It is 1-non-revenue water.
Note: The value for WRR in the figure is set to 0 because the actual number is not available.
08-App3_159-198 2/28/07 3:51 PM Page 165

166 Making the Most of Scarcity
Egypt
Indicator Country MENA Source
Socioeconomic indicators
Total population (millions of people), 2004 68.7 294 WDI database
Urban population 29.0 172.5 WDI database
Rural population 39.7 121.5 WDI database
Population with access to improved drinking water (%), 2002 98 90 UNICEF-WHO database
Urban 100 96 UNICEF-WHO database
Rural 97 81 UNICEF-WHO database
Hours of access to tap water (hours/day) 12 — Expert opinion
Percentage of population with access to improved sanitation, 2002 68 76 UNICEF-WHO database
Urban 84 90 UNICEF-WHO database
Rural 56 57 UNICEF-WHO database
Under 5 mortality, per 1,000 live births; 2002 39 55.9 WDI database
Macroeconomic indicators
GNI per capita, Atlas method (current US$), 2004 1,310 2,000 WDI database
GDP (million constant US$ at 2000 prices), 2004 114,312 — WDI database
Share of agriculture in GDP (%), 2004 15.5 13.6 WDI database
Share of industry in GDP (%), 2004 32.1 39.2 WDI database
Share of oil in GDP (%), 2003 — —
Average annual growth
Average annual growth of GDP at constant prices 3.8 4.3 WDI database
Average annual growth of GDP per capita at constant prices 2.0 2.5 WDI database
Average annual growth of population 1.8 1.9 WDI database
Land and water resources
Land area (million hectares) 100.1 948.9 FAO AQUASTAT
Average precipitation (mm/yr), 1998–2002 51 181.6 FAO AQUASTAT
Renewable water resources, 2002
Internal water resources
Surface water (1,000 million m3) 0.5 153.1 FAO AQUASTAT
Ground water (1,000 million m3) 1.3 77.2 FAO AQUASTAT
Total internal water resources (1,000 million m3) 1.8 198.7 FAO AQUASTAT
Total external water resources(1,000 million m3) 56.5 85.5 FAO AQUASTAT
Total renewable water resources (1,000 million m3) 58.3 284.3 FAO AQUASTAT
Exploitable water resources (1,000 million m3) 0.5 108.0 FAO AQUASTAT
Per capita renewable water resource available (1,000 m3) 0.8 1.1 FAO AQUASTAT
Total renewable water resources as % of total water use 85.4 133.0 FAO AQUASTAT
Dependency ratio (%) 96.9 — WDI database
Water withdrawals, 2002
Agricultural (1,000 million m3) 59.0 188.3 WDI database
Domestic (1,000 million m3) 5.3 17.5 WDI database
Industrial (1,000 million m3) 4.0 7.9 WDI database
Total withdrawals (1,000 million m3) 68.3 213.8 WDI database
Virtual water
Virtual water imports in crops (1,000 million m3) 16,035.5 57.8 Hoekstra and Hung 2002
Virtual water imports in livestock (1,000 million m3) 2,897.0 14.4 Chapagain and Hoekstra
2003
Total virtual water (1,000 million m3) 18.9 74.4 Hoekstra and Hung 2002;
Chapagain and Hoekstra
2003
Supplemental (desalinated and retreated and reused),
(1,000 million m3) 3.1 4.8 FAO AQUASTAT
08-App3_159-198 2/28/07 3:51 PM Page 166

Appendix 3: Country Profiles 167
Egypt (continued)
Indicator Country MENA Source
Water scarcity (%) 105.8 — Chapagain and Hoekstra
2003
Water self-sufficiency (%) 77 — Chapagain and Hoekstra
2003
Water dependency (%) 23 — Chapagain and Hoekstra
2003
Public utility performance in major cities
Operating cost coverage ratio for all utilities in Egypt 0.25 n.a. World Bank 2005b
Nonrevenue water, Alexandria and Cairo 0.50 n.a. World Bank 2005b
Efficiency of water used in agriculture
Water requirement ratio 0.53 — FAO AQUASTAT
Agricultural value-added GDP (millions of current US$), 2000 15,513.0 — WDI database
Agricultural value-added GDP per cubic km of water used WDI database;
in agriculture ($) 288.1 701.0 FAO AQUASTAT
Percentage of cropped area irrigated (1999) 100.0 45.7 WRI Earthtrends database
Governance indicators
Index of public accountability 30.0 32.0 World Bank 2003a
Index of quality of administration 38.0 47.0 World Bank 2003a
Index of governance quality 30.0 37.0 World Bank 2003a
Note: — = Not available; n.a. = Not applicable.
FIGURE A3.4
Egypt’s Position on Three Dimensions of Water Service
Egypt Frontier
Access
Utilityperformance
WRR
Public utility Water Require-
Access performancea ment Ratio (WRR)
Frontier 1.00 1.00 1.00
Egypt 0.72 0.50 0.53
a. Public Utility performance is a ratio of water sold to net water sup-plied. It is 1-non-revenue water.
08-App3_159-198 2/28/07 3:51 PM Page 167
168 Making the Most of Scarcity
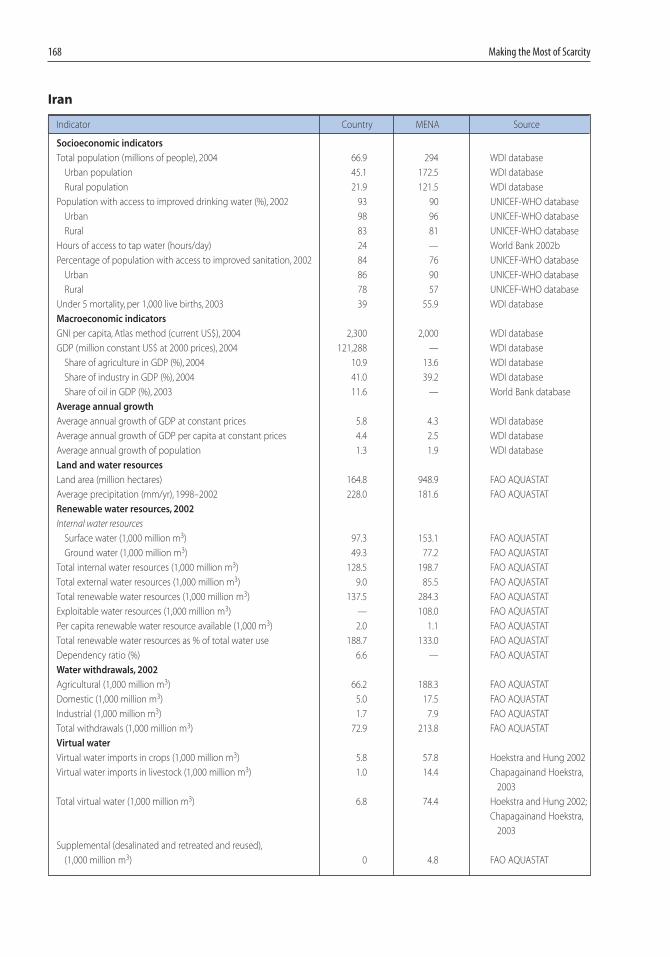
Iran
Indicator Country MENA Source
Socioeconomic indicators
Total population (millions of people), 2004 66.9 294 WDI database
Urban population 45.1 172.5 WDI database
Rural population 21.9 121.5 WDI database
Population with access to improved drinking water (%), 2002 93 90 UNICEF-WHO database
Urban 98 96 UNICEF-WHO database
Rural 83 81 UNICEF-WHO database
Hours of access to tap water (hours/day) 24 — World Bank 2002b
Percentage of population with access to improved sanitation, 2002 84 76 UNICEF-WHO database
Urban 86 90 UNICEF-WHO database
Rural 78 57 UNICEF-WHO database
Under 5 mortality, per 1,000 live births, 2003 39 55.9 WDI database
Macroeconomic indicators
GNI per capita, Atlas method (current US$), 2004 2,300 2,000 WDI database
GDP (million constant US$ at 2000 prices), 2004 121,288 — WDI database
Share of agriculture in GDP (%), 2004 10.9 13.6 WDI database
Share of industry in GDP (%), 2004 41.0 39.2 WDI database
Share of oil in GDP (%), 2003 11.6 — World Bank database
Average annual growth
Average annual growth of GDP at constant prices 5.8 4.3 WDI database
Average annual growth of GDP per capita at constant prices 4.4 2.5 WDI database
Average annual growth of population 1.3 1.9 WDI database
Land and water resources
Land area (million hectares) 164.8 948.9 FAO AQUASTAT
Average precipitation (mm/yr), 1998–2002 228.0 181.6 FAO AQUASTAT
Renewable water resources, 2002
Internal water resources
Surface water (1,000 million m3) 97.3 153.1 FAO AQUASTAT
Ground water (1,000 million m3) 49.3 77.2 FAO AQUASTAT
Total internal water resources (1,000 million m3) 128.5 198.7 FAO AQUASTAT
Total external water resources (1,000 million m3) 9.0 85.5 FAO AQUASTAT
Total renewable water resources (1,000 million m3) 137.5 284.3 FAO AQUASTAT
Exploitable water resources (1,000 million m3) — 108.0 FAO AQUASTAT
Per capita renewable water resource available (1,000 m3) 2.0 1.1 FAO AQUASTAT
Total renewable water resources as % of total water use 188.7 133.0 FAO AQUASTAT
Dependency ratio (%) 6.6 — FAO AQUASTAT
Water withdrawals, 2002
Agricultural (1,000 million m3) 66.2 188.3 FAO AQUASTAT
Domestic (1,000 million m3) 5.0 17.5 FAO AQUASTAT
Industrial (1,000 million m3) 1.7 7.9 FAO AQUASTAT
Total withdrawals (1,000 million m3) 72.9 213.8 FAO AQUASTAT
Virtual water
Virtual water imports in crops (1,000 million m3) 5.8 57.8 Hoekstra and Hung 2002
Virtual water imports in livestock (1,000 million m3) 1.0 14.4 Chapagainand Hoekstra,
2003
Total virtual water (1,000 million m3) 6.8 74.4 Hoekstra and Hung 2002;
Chapagainand Hoekstra,
2003
Supplemental (desalinated and retreated and reused),
(1,000 million m3) 0 4.8 FAO AQUASTAT
08-App3_159-198 2/28/07 3:51 PM Page 168
Appendix 3: Country Profiles 169
Iran (continued)
Indicator Country MENA Source
Water scarcity (%) 52.8 — Chapagain and Hoekstra
2003
Water self-sufficiency (%) 91 — Chapagain and Hoekstra
2003
Water dependency (%) 9 — Chapagain and Hoekstra
2003
Public utility performance in major cities
Hours of access to tap water (hours/day), Tehran 24 n.a. World Bank 2002b
Operating cost coverage ratio, Tehran 0.83 n.a. World Bank 2002b
Nonrevenue water, Tehran 0.39 n.a. World Bank 2002b
Hours of access to tap water (hours/day), Ahwaz 24 n.a. World Bank 2002b
Operating cost coverage ratio, Ahwaz 0.78 n.a. World Bank 2002b
Nonrevenue water (unaccounted for Water, UFW), Ahwaz 0.46 n.a. World Bank 2002b
Hours of access to tap water (hours/day), Shiraz 24 n.a. World Bank 2002b
Operating cost coverage ratio, Shiraz 0.65 n.a. World Bank 2002b
Nonrevenue water (UFW), Shiraz 0.28 n.a. World Bank 2002b
Operating cost coverage ratio, all utilities 0.75 n.a. World Bank 2002b
Nonrevenue water (UFW), all utilities 0.32 n.a. World Bank 2002b
Efficiency of water used in agriculture
Water requirement ratio 0.32 — FAO AQUASTAT
Agricultural value-added GDP (millions of current US$), 2000 13,807.2 — WDI database
Agricultural value-added GDP per cubic km of water used WDI database;
in agriculture ($) 208.5 701.0 FAO AQUASTAT
Percentage of cropped area irrigated (1999) 39.3 45.7 WRI Earthtrends database
Governance indicators
Index of public accountability 44.0 32.0 World Bank 2003a
Index of quality of administration 29.7 47.0 World Bank 2003a
Index of governance quality 30.0 37.0 World Bank 2003a
Note: — = Not available; n.a. = Not applicable.
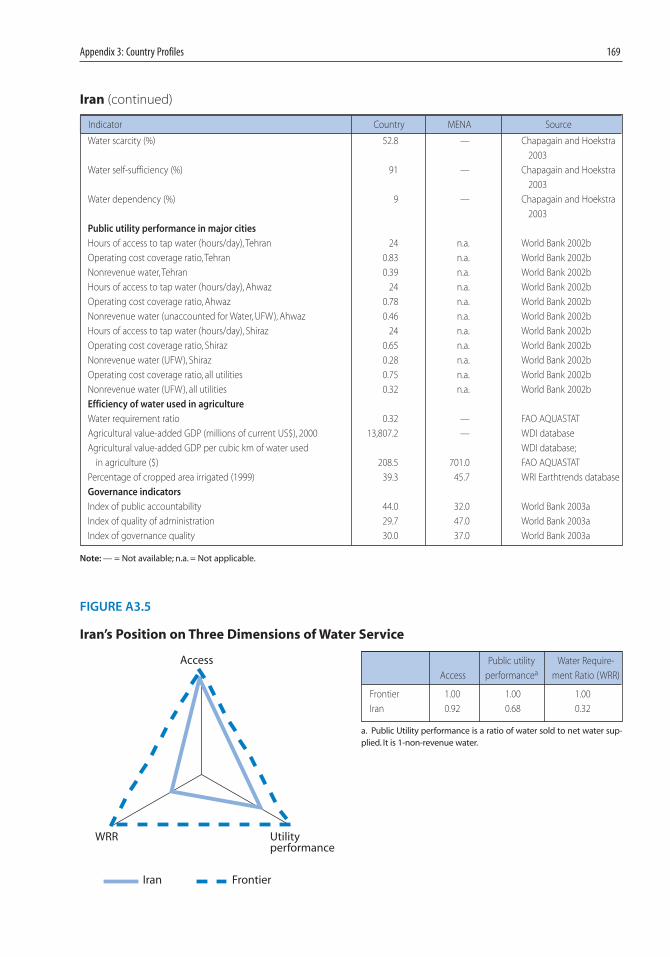
FIGURE A3.5
Iran’s Position on Three Dimensions of Water Service
Iran Frontier
Access
Utilityperformance
WRR
Public utility Water Require-
Access performancea ment Ratio (WRR)
Frontier 1.00 1.00 1.00
Iran 0.92 0.68 0.32
a. Public Utility performance is a ratio of water sold to net water sup-plied. It is 1-non-revenue water.
08-App3_159-198 2/28/07 3:51 PM Page 169
170 Making the Most of Scarcity
Jordan
Indicator Country MENA Source
Socioeconomic indicators
Total population (millions of people), 2004 5.4 294 WDI database
Urban population 4.3 172.5 WDI database
Rural population 1.1 121.5 WDI database
Population with access to improved drinking water (%), 2002 91 90 UNICEF-WHO database
Urban 91 96 UNICEF-WHO database
Rural 91 81 UNICEF-WHO database
Hours of access to tap water (hours/day) 24 — Expert opinion
Percentage of population with access to improved sanitation, 2002 93 76 UNICEF-WHO database
Urban 94 90 UNICEF-WHO database
Rural 85 57 UNICEF-WHO database
Under 5 mortality, per 1,000 live births, 2003 28.0 55.9 WHO-UNICEF
Macroeconomic indicators
GNI per capita, Atlas method (current US$), 2004 2,140 2,000 WDI database
GDP (million constant US$ at 2000 prices), 2004 10,378 — WDI database
Share of agriculture in GDP (%), 2004 2.1 13.6 WDI database
Share of industry in GDP (%), 2004 25.3 39.2 WDI database
Share of oil in GDP (%), 2003 — —
Average annual growth
Average annual growth of GDP at constant prices 5.1 4.3 WDI database
Average annual growth of GDP per capita at constant prices 2.2 2.5 WDI database
Average annual growth of population 2.8 1.9 WDI database
Land and water resources
Land area (million hectares) 8.9 948.9 FAO AQUASTAT
Average precipitation (mm/yr), 1998–2002 111 181.6 FAO AQUASTAT
Renewable water resources, 2002
Internal water resources
Surface water (1,000 million m3) 0.4 153.1 FAO AQUASTAT
Ground water (1,000 million m3) 0.5 77.2 FAO AQUASTAT
Total internal water resources (1,000 million m3) 0.7 198.7 FAO AQUASTAT
Total external water resources (1,000 million m3) 0.2 85.5 FAO AQUASTAT
Total renewable water resources (1,000 million m3) 0.9 284.3 FAO AQUASTAT
Exploitable water resources (1,000 million m3) — 108.0 FAO AQUASTAT
Per capita renewable water resource available (1,000 m3) 0.2 1.1 FAO AQUASTAT
Total renewable water resources as % of total water use 87.1 133.0 FAO AQUASTAT
Dependency ratio (%) 22.7 — FAO AQUASTAT
Water withdrawals, 2002
Agricultural (1,000 million m3) 0.8 188.3 FAO AQUASTAT
Domestic (1,000 million m3) 0.2 17.5 FAO AQUASTAT
Industrial (1,000 million m3) 0.0 7.9 FAO AQUASTAT
Total withdrawals (1,000 million m3) 1.0 213.8 FAO AQUASTAT
Virtual water
Virtual water imports in crops (1,000 million m3) 4.5 57.8 Hoekstra and Hung 2002
Virtual water imports in livestock (1,000 million m3) 0.6 14.4 Chapagain and Hoekstra
2003
Total virtual water (1,000 million m3) 5.0 74.4 Hoekstra and Hung 2002;
Chapagain and Hoekstra
2003
Supplemental (desalinated and retreated and reused),
(1,000 million m3) 0.1 4.8 FAO AQUASTAT
08-App3_159-198 2/28/07 3:51 PM Page 170
Appendix 3: Country Profiles 171
Jordan (continued)
Indicator Country MENA Source
Water scarcity (%) 114.5 — Chapagain and Hoekstra
2003
Water self-sufficiency (%) 17 — Chapagain and Hoekstra
2003
Water dependency (%) 83 — Chapagain and Hoekstra
2003
Public utility performance in major cities
Operating cost coverage ratio, 2002 0.70 n.a. Stone and Webster 2004
Unaccounted for water, all utilities, 2002 0.45 n.a. Stone and Webster 2004
Efficiency of water used in agriculture
Water requirement ratio 0.38 — FAO AQUASTAT
Agricultural value-added GDP (millions of current US$), 2000 165.0 — WDI database
Agricultural value-added GDP per cubic km of water used WDI database;
in agriculture ($) 217.1 701.0 FAO AQUASTAT
Percentage of cropped area irrigated (1999) 19.4 45.7 WRI Earthtrends database
Governance indicators
Index of public accountability 45.0 32.0 World Bank 2003a
Index of quality of administration 50.7 47.0 World Bank 2003a
Index of governance quality 44.0 37.0 World Bank 2003a
Note: — = Not available; n.a. = Not applicable.
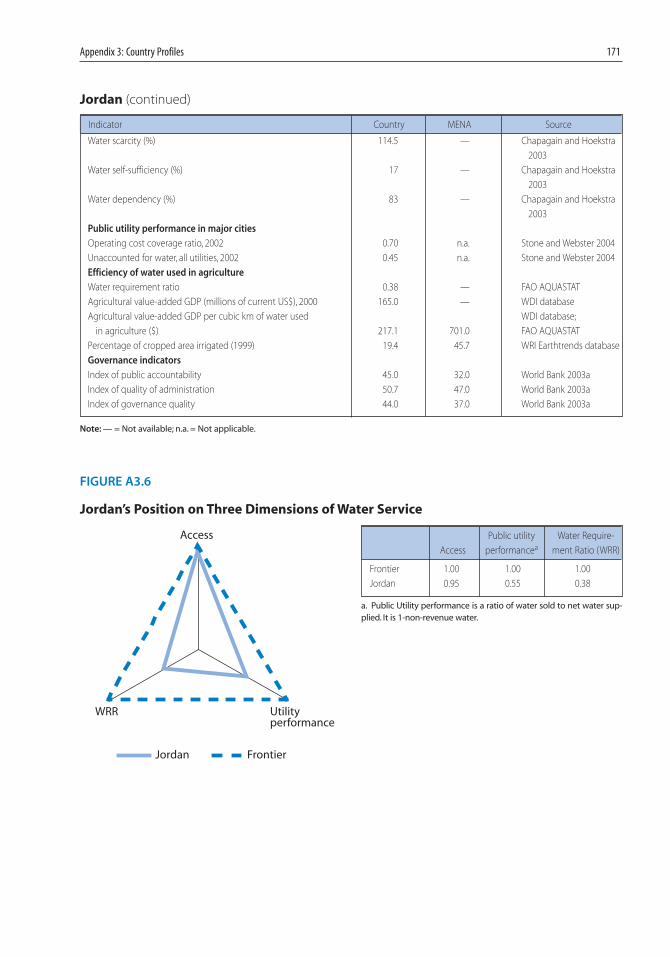
FIGURE A3.6
Jordan’s Position on Three Dimensions of Water Service
Jordan Frontier
Access
Utilityperformance
WRR
Public utility Water Require-
Access performancea ment Ratio (WRR)
Frontier 1.00 1.00 1.00
Jordan 0.95 0.55 0.38
a. Public Utility performance is a ratio of water sold to net water sup-plied. It is 1-non-revenue water.
08-App3_159-198 2/28/07 3:51 PM Page 171
172 Making the Most of Scarcity
Kuwait
Indicator Country MENA Source
Socioeconomic indicators
Total population (millions of people), 2004 2.46 294 WDI database
Urban population 2.37 172.5 WDI database
Rural population 0.09 121.5 WDI database
Population with access to improved drinking water (%), 2002 100 90 UNICEF-WHO database
Urban 100 96 UNICEF-WHO database
Rural 100 81 UNICEF-WHO database
Hours of access to tap water (hours/day) 24 — Expert opinion
Percentage of population with access to improved sanitation, 2002 100 76 UNICEF-WHO database
Urban 100 90 UNICEF-WHO database
Rural 100 57 UNICEF-WHO database
Under 5 mortality, per 1,000 live births, 2002 9.0 55.9 WDI database
Macroeconomic indicators
GNI per capita, Atlas method (current US$), 2004 17,970 2,000 WDI database
GDP (million constant US$ at 2000 prices), 2004 40,111 — WDI database
Share of agriculture in GDP (%), 2004 — 13.6 WDI database
Share of industry in GDP (%), 2004 — 39.2 WDI database
Share of oil in GDP (%), 2000 57.4 — IMF Report
Average annual growth
Average annual growth of GDP at constant prices 3.1 4.3 WDI database
Average annual growth of GDP per capita at constant prices -0.2 2.5 WDI database
Average annual growth of population 3.1 1.9 WDI database
Land and water resources
Land area (million hectares) 1.8 948.9 FAO AQUASTAT
Average precipitation (mm/yr), 1998–2002 121 181.6 FAO AQUASTAT
Renewable water resources, 2002
Internal water resources
Surface water (1,000 million m3) 0 153.1 FAO AQUASTAT
Ground water (1,000 million m3) 0 77.2 FAO AQUASTAT
Total internal water resources (1,000 million m3) 0 198.7 FAO AQUASTAT
Total external water resources (1,000 million m3) 0.0 85.5 FAO AQUASTAT
Total renewable water resources (1,000 million m3) 0.0 284.3 FAO AQUASTAT
Exploitable water resources (1,000 million m3) — 108.0 FAO AQUASTAT
Per capita renewable water resource available (1,000 m3) 0.1 1.1 FAO AQUASTAT
Total renewable water resources as % of total water use 4.5 133.0 FAO AQUASTAT
Dependency ratio (%) 100.0 — FAO AQUASTAT
Water withdrawals, 2002
Agricultural (1,000 million m3) 0.2 188.3 FAO AQUASTAT
Domestic (1,000 million m3) 0.2 17.5 FAO AQUASTAT
Industrial (1,000 million m3) 0.0 7.9 FAO AQUASTAT
Total withdrawals (1,000 million m3) 0.4 213.8 FAO AQUASTAT
Virtual water
Virtual water imports in crops (1,000 million m3) 0.5 57.8 Hoekstra and Hung 2002
Virtual water imports in livestock (1,000 million m3) 0.9 14.4 Chapagain and Hoekstra
2003
Total virtual water (1,000 million m3) 1.4 74.4 Hoekstra and Hung 2002;
Chapagain and Hoekstra
2003
Supplemental (desalinated and retreated and reused),
(1,000 million m3) 0.3 4.8 FAO AQUASTAT
08-App3_159-198 2/28/07 3:51 PM Page 172
Appendix 3: Country Profiles 173
Kuwait (continued)
Indicator Country MENA Source
Water scarcity (%) 2,070 — Chapagain and Hoekstra
2003
Water self-sufficiency (%) 23 — Chapagain and Hoekstra
`` 2003
Water dependency (%) 77 — Chapagain and Hoekstra
2003
Public utility performance in major cities
Operating cost coverage ratio; 2002 0.10 n.a. Kuwait Ministry of Energy
and Water 2003
Nonrevenue water, whole country, 2002 0.38 n.a. World Bank 2005l
Efficiency of water used in agriculture
Water requirement ratio5 — —
Agricultural value-added GDP (millions of current US$), 2000 114.3 — WDI database
Agricultural value-added GDP per cubic km of water used WDI database;
in agriculture ($) 496.9 701.0 FAO AQUASTAT
Percentage of cropped area irrigated (1999) 100.0 45.7 WRI Earthtrends database
Governance indicators
Index of public accountability 44.0 32.0 World Bank 2003a
Index of quality of administration 56.5 47.0 World Bank 2003a
Index of governance quality 48.5 37.0 World Bank 2003a
Note: — = Not available; n.a. = Not applicable.
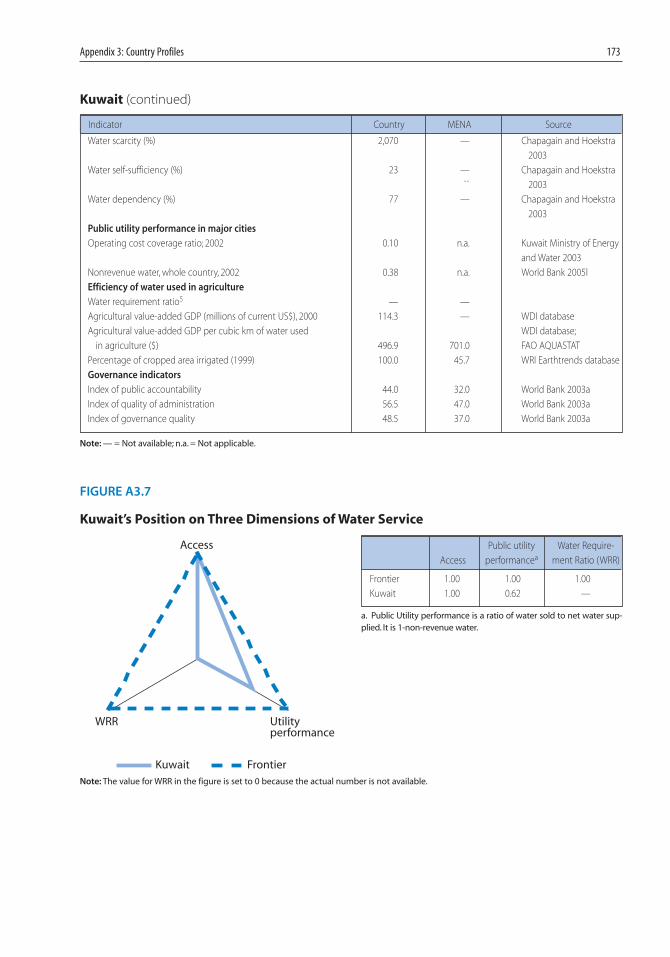
FIGURE A3.7
Kuwait’s Position on Three Dimensions of Water Service
Kuwait Frontier
Access
Utilityperformance
WRR
Public utility Water Require-
Access performancea ment Ratio (WRR)
Frontier 1.00 1.00 1.00
Kuwait 1.00 0.62 —
a. Public Utility performance is a ratio of water sold to net water sup-plied. It is 1-non-revenue water.
Note: The value for WRR in the figure is set to 0 because the actual number is not available.
08-App3_159-198 2/28/07 3:51 PM Page 173

174 Making the Most of Scarcity
Lebanon
Indicator Country MENA Source
Socioeconomic indicators
Total population (millions of people), 2004 4.55 294 WDI database
Urban population 3.99 172.5 WDI database
Rural population 0.56 121.5 WDI database
Population with access to improved drinking water (%), 2002 100 90 UNICEF-WHO database
Urban 100 96 UNICEF-WHO database
Rural 100 81 UNICEF-WHO database
Hours of access to tap water in Beirut (hours/day) 24 — Expert opinion
Percentage of population with access to improved sanitation, 2002 98 76 UNICEF-WHO database
Urban 100 90 UNICEF-WHO database
Rural 87 57 UNICEF-WHO database
Under 5 mortality, per 1,000 live births, 2003 31.0 55.9 WDI database
Macroeconomic indicators
GNI per capita, Atlas method (current US$), 2004 4,980 2,000 WDI database
GDP (million constant US$ at 2000 prices), 2004 19,848 — WDI database
Share of agriculture in GDP (%), 2004 12.9 13.6 WDI database
Share of industry in GDP (%), 2004 19.1 39.2 WDI database
Share of oil in GDP (%), 2003 — —
Average annual growth
Average annual growth of GDP at constant prices 3.9 4.3 WDI database
Average annual growth of GDP per capita at constant prices 2.6 2.5 WDI database
Average annual growth of population 1.3 1.9 WDI database
Land and water resources
Land area (million hectares) 1.0 948.9 FAO AQUASTAT
Average precipitation (mm/yr), 1998–2002 661 181.6 FAO AQUASTAT
Renewable water resources, 2002
Internal water resources
Surface water (1,000 million m3) 4.1 153.1 FAO AQUASTAT
Ground water (1,000 million m3) 3.2 77.2 FAO AQUASTAT
Total internal water resources (1,000 million m3) 4.8 198.7 FAO AQUASTAT
Total external water resources (1,000 million m3) –0.4 85.5 FAO AQUASTAT
Total renewable water resources (1,000 million m3) 4.4 284.3 FAO AQUASTAT
Exploitable water resources (1,000 million m3) 2.2 108.0 FAO AQUASTAT
Per capita renewable water resource available (1,000 m3) 1.2 1.1 FAO AQUASTAT
Total renewable water resources as % of total water use 0.8 133.0 FAO AQUASTAT
Dependency ratio (%) 100 — FAO AQUASTAT
Water withdrawals, 2002
Agricultural (1,000 million m3) 0.9 188.3 FAO AQUASTAT
Domestic (1,000 million m3) 0.5 17.5 FAO AQUASTAT
Industrial (1,000 million m3) 0.0 7.9 FAO AQUASTAT
Total withdrawals (1,000 million m3) 1.4 213.8 FAO AQUASTAT
Virtual water
Virtual water imports in crops (1,000 million m3) 0.7 57.8 Hoekstra and Hung 2002
Virtual water imports in livestock (1,000 million m3) 1.3 14.4 Chapagain and Hoekstra
2003
Total virtual water (1,000 million m3) 2.0 74.4 Hoekstra and Hung 2002;
Chapagain and Hoekstra
2003
Supplemental (desalinated and retreated and reused),
(1,000 million m3) 0 4.8 FAO AQUASTAT
08-App3_159-198 2/28/07 3:51 PM Page 174
Appendix 3: Country Profiles 175
Lebanon (continued)
Indicator Country MENA Source
Water scarcity (%) 33.4 — Chapagain and Hoekstra
2003
Water self-sufficiency (%) 42 — Chapagain and Hoekstra
2003
Water dependency (%) 58 — Chapagain and Hoekstra
2003
Public utility performance in major cities
Operating cost coverage ratio — n.a.
Nonrevenue water, Beirut 0.4 n.a. IBNET database
Efficiency of water used in agriculture
Water requirement ratio 0.40 — FAO AQUASTAT
Agricultural value-added GDP (millions of current US$), 2000 1,800.1 — WDI database
Agricultural value-added GDP per cubic km of water used WDI database;
in agriculture ($) 1,956.7 701.0 FAO AQUASTAT
Percentage of cropped area irrigated (1999) 39.0 45.7 WRI Earthtrends database
Governance indicators
Index of public accountability 42.0 32.0 World Bank 2003a
Index of quality of administration 35.0 47.0 World Bank 2003a
Index of governance quality 32.0 37.0 World Bank 2003a
Note: — = Not available; n.a. = Not applicable.
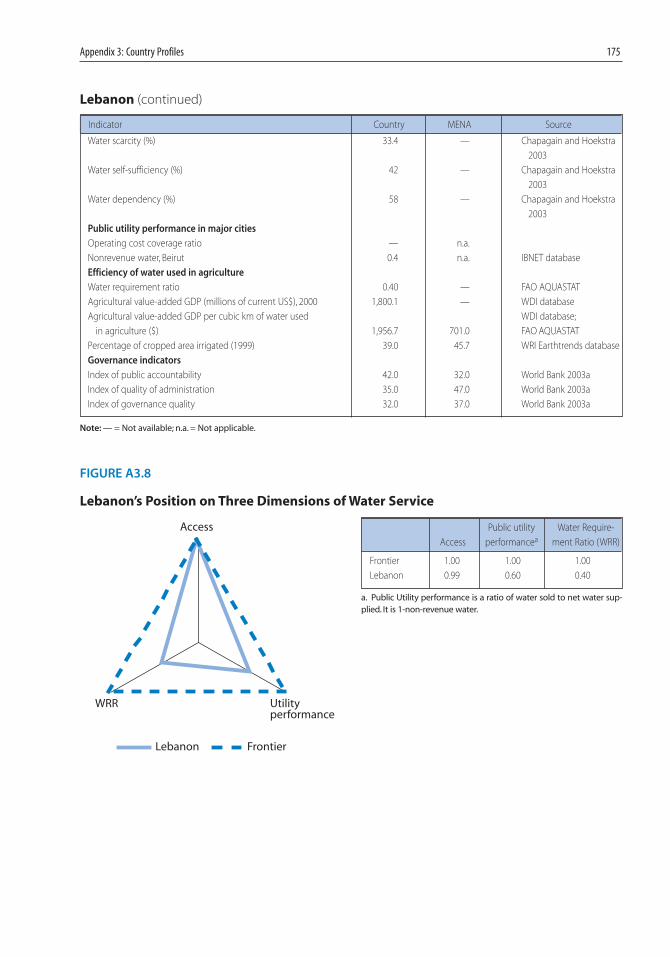
FIGURE A3.8
Lebanon’s Position on Three Dimensions of Water Service
Lebanon Frontier
Access
Utilityperformance
WRR
Public utility Water Require-
Access performancea ment Ratio (WRR)
Frontier 1.00 1.00 1.00
Lebanon 0.99 0.60 0.40
a. Public Utility performance is a ratio of water sold to net water sup-plied. It is 1-non-revenue water.
08-App3_159-198 2/28/07 3:51 PM Page 175
176 Making the Most of Scarcity
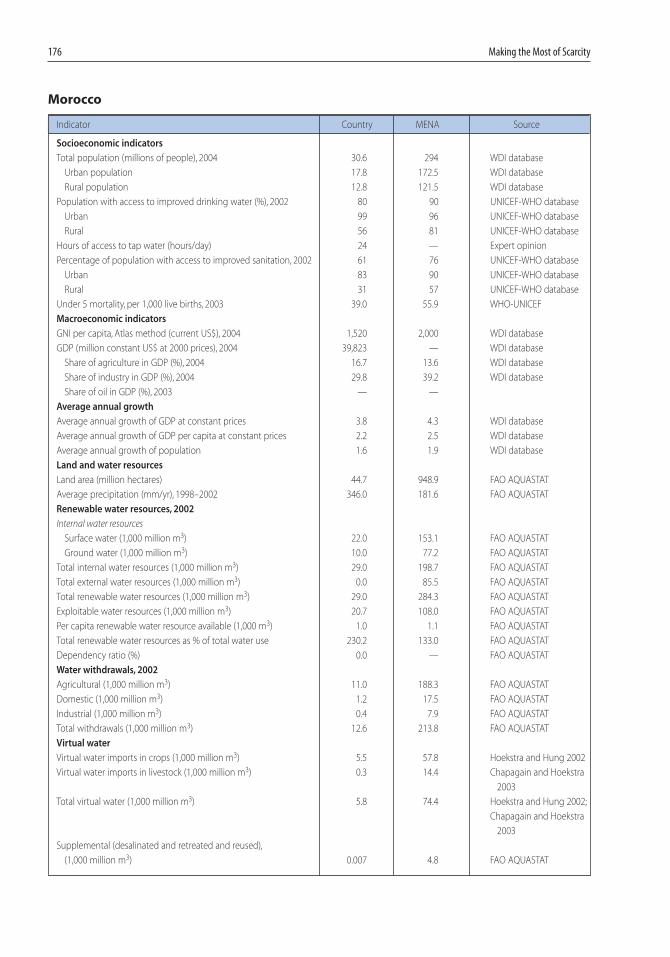
Morocco
Indicator Country MENA Source
Socioeconomic indicators
Total population (millions of people), 2004 30.6 294 WDI database
Urban population 17.8 172.5 WDI database
Rural population 12.8 121.5 WDI database
Population with access to improved drinking water (%), 2002 80 90 UNICEF-WHO database
Urban 99 96 UNICEF-WHO database
Rural 56 81 UNICEF-WHO database
Hours of access to tap water (hours/day) 24 — Expert opinion
Percentage of population with access to improved sanitation, 2002 61 76 UNICEF-WHO database
Urban 83 90 UNICEF-WHO database
Rural 31 57 UNICEF-WHO database
Under 5 mortality, per 1,000 live births, 2003 39.0 55.9 WHO-UNICEF
Macroeconomic indicators
GNI per capita, Atlas method (current US$), 2004 1,520 2,000 WDI database
GDP (million constant US$ at 2000 prices), 2004 39,823 — WDI database
Share of agriculture in GDP (%), 2004 16.7 13.6 WDI database
Share of industry in GDP (%), 2004 29.8 39.2 WDI database
Share of oil in GDP (%), 2003 — —
Average annual growth
Average annual growth of GDP at constant prices 3.8 4.3 WDI database
Average annual growth of GDP per capita at constant prices 2.2 2.5 WDI database
Average annual growth of population 1.6 1.9 WDI database
Land and water resources
Land area (million hectares) 44.7 948.9 FAO AQUASTAT
Average precipitation (mm/yr), 1998–2002 346.0 181.6 FAO AQUASTAT
Renewable water resources, 2002
Internal water resources
Surface water (1,000 million m3) 22.0 153.1 FAO AQUASTAT
Ground water (1,000 million m3) 10.0 77.2 FAO AQUASTAT
Total internal water resources (1,000 million m3) 29.0 198.7 FAO AQUASTAT
Total external water resources (1,000 million m3) 0.0 85.5 FAO AQUASTAT
Total renewable water resources (1,000 million m3) 29.0 284.3 FAO AQUASTAT
Exploitable water resources (1,000 million m3) 20.7 108.0 FAO AQUASTAT
Per capita renewable water resource available (1,000 m3) 1.0 1.1 FAO AQUASTAT
Total renewable water resources as % of total water use 230.2 133.0 FAO AQUASTAT
Dependency ratio (%) 0.0 — FAO AQUASTAT
Water withdrawals, 2002
Agricultural (1,000 million m3) 11.0 188.3 FAO AQUASTAT
Domestic (1,000 million m3) 1.2 17.5 FAO AQUASTAT
Industrial (1,000 million m3) 0.4 7.9 FAO AQUASTAT
Total withdrawals (1,000 million m3) 12.6 213.8 FAO AQUASTAT
Virtual water
Virtual water imports in crops (1,000 million m3) 5.5 57.8 Hoekstra and Hung 2002
Virtual water imports in livestock (1,000 million m3) 0.3 14.4 Chapagain and Hoekstra
2003
Total virtual water (1,000 million m3) 5.8 74.4 Hoekstra and Hung 2002;
Chapagain and Hoekstra
2003
Supplemental (desalinated and retreated and reused),
(1,000 million m3) 0.007 4.8 FAO AQUASTAT
08-App3_159-198 2/28/07 3:51 PM Page 176
Appendix 3: Country Profiles 177
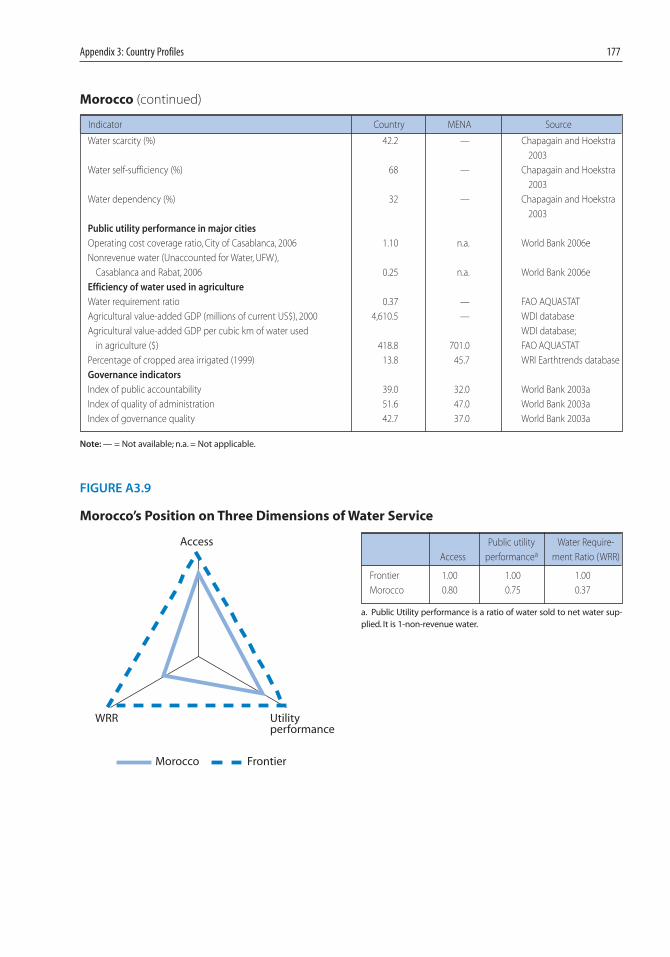
Morocco (continued)
Indicator Country MENA Source
Water scarcity (%) 42.2 — Chapagain and Hoekstra
2003
Water self-sufficiency (%) 68 — Chapagain and Hoekstra
2003
Water dependency (%) 32 — Chapagain and Hoekstra
2003
Public utility performance in major cities
Operating cost coverage ratio, City of Casablanca, 2006 1.10 n.a. World Bank 2006e
Nonrevenue water (Unaccounted for Water, UFW),
Casablanca and Rabat, 2006 0.25 n.a. World Bank 2006e
Efficiency of water used in agriculture
Water requirement ratio 0.37 — FAO AQUASTAT
Agricultural value-added GDP (millions of current US$), 2000 4,610.5 — WDI database
Agricultural value-added GDP per cubic km of water used WDI database;
in agriculture ($) 418.8 701.0 FAO AQUASTAT
Percentage of cropped area irrigated (1999) 13.8 45.7 WRI Earthtrends database
Governance indicators
Index of public accountability 39.0 32.0 World Bank 2003a
Index of quality of administration 51.6 47.0 World Bank 2003a
Index of governance quality 42.7 37.0 World Bank 2003a
Note: — = Not available; n.a. = Not applicable.
FIGURE A3.9
Morocco’s Position on Three Dimensions of Water Service
Morocco Frontier
Access
Utilityperformance
WRR
Public utility Water Require-
Access performancea ment Ratio (WRR)
Frontier 1.00 1.00 1.00
Morocco 0.80 0.75 0.37
a. Public Utility performance is a ratio of water sold to net water sup-plied. It is 1-non-revenue water.
08-App3_159-198 2/28/07 3:51 PM Page 177

178 Making the Most of Scarcity
Oman
Indicator Country MENA Source
Socioeconomic indicators
Total population (millions of people), 2004 2.7 294 WDI database
Urban population 2.1 172.5 WDI database
Rural population 0.6 121.5 WDI database
Population with access to improved drinking water (%), 2002 79 90 UNICEF-WHO database
Urban 81 96 UNICEF-WHO database
Rural 72 81 UNICEF-WHO database
Hours of access to tap water (hours/day) 24 — Expert opinion
Percentage of population with access to improved sanitation, 2002 97 76 UNICEF-WHO database
Urban 97 90 UNICEF-WHO database
Rural 61 57 UNICEF-WHO database
Under 5 mortality, per 1,000 live births, 2003 12.0 55.9 WHO-UNICEF
Macroeconomic indicators
GNI per capita, Atlas method (current US$), 2004 7,890 2,000 WDI database
GDP (million constant US$ at 2000 prices), 2004 22,259 — WDI database
Share of agriculture in GDP (%), 2004 — 13.6 WDI database
Share of industry in GDP (%), 2004 — 39.2 WDI database
Share of oil in GDP (%), 2003 25.9 — WDI database
Average annual growth
Average annual growth of GDP at constant prices 4.3 4.3 WDI database
Average annual growth of GDP per capita at constant prices 1.7 2.5 WDI database
Average annual growth of population 2.5 1.9 WDI database
Land and water resources
Land area (million hectares) 31.0 948.9 FAO AQUASTAT
Average precipitation (mm/yr), 1998–2002 125 181.6 FAO AQUASTAT
Renewable water resources, 2002
Internal water resources
Surface water (1,000 million m3) 0.9 153.1 FAO AQUASTAT
Ground water (1,000 million m3) 1.0 77.2 FAO AQUASTAT
Total internal water resources (1,000 million m3) 1.0 198.7 FAO AQUASTAT
Total external water resources (1,000 million m3) 0.0 85.5 FAO AQUASTAT
Total renewable water resources (1,000 million m3) 1.0 284.3 FAO AQUASTAT
Exploitable water resources (1,000 million m3) — 108.0 FAO AQUASTAT
Per capita renewable water resource available (1,000 m3) 0.4 1.1 FAO AQUASTAT
Total renewable water resources as % of total water use 72.4 133.0 FAO AQUASTAT
Dependency ratio (%) 0.0 — FAO AQUASTAT
Water withdrawals, 2002
Agricultural (1,000 million m3) 1.2 188.3 FAO AQUASTAT
Domestic (1,000 million m3) 0.1 17.5 FAO AQUASTAT
Industrial (1,000 million m3) 0.0 7.9 FAO AQUASTAT
Total withdrawals (1,000 million m3) 1.4 213.8 FAO AQUASTAT
Virtual water
Virtual water imports in crops (1,000 million m3) 1.1 57.8 Hoekstra and Hung 2002
Virtual water imports in livestock (1,000 million m3) 0.3 14.4 Chapagain and Hoekstra
2003
Total virtual water (1,000 million m3) 1.4 74.4 Hoekstra and Hung 2002;
Chapagain and Hoekstra
2003
Supplemental (desalinated and retreated and reused),
(1,000 million m3) 0.0 4.8 FAO AQUASTAT
08-App3_159-198 2/28/07 3:51 PM Page 178

Appendix 3: Country Profiles 179
Oman (continued)
Indicator Country MENA Source
Water scarcity (%) 132.2 — Chapagain and Hoekstra
2003
Water self-sufficiency (%) 48 — Chapagain and Hoekstra
2003
Water dependency (%) 52 — Chapagain and Hoekstra
2003
Public utility performance in major cities
Operating cost coverage ratio 0.63 n.a. World Bank 2005l
Nonrevenue water, whole country 0.35 n.a. World Bank 2005l
Efficiency of water used in agriculture
Water requirement ratio — —
Agricultural value-added GDP (millions of current US$), 2000 373.7 — WDI database
Agricultural value-added GDP per cubic km of water used WDI database;
in agriculture ($) 304.5 701.0 FAO AQUASTAT
Percentage of cropped area irrigated (1999) 80.5 45.7 WRI Earthtrends database
Governance indicators
Index of public accountability 26.6 32.0 World Bank 2003a
Index of quality of administration 53.0 47.0 World Bank 2003a
Index of governance quality 39.0 37.0 World Bank 2003a
Note: — = Not available; n.a. = Not applicable.
FIGURE A3.10
Oman’s Position on Three Dimensions of Water Service
Oman Frontier
Access
Utilityperformance
WRR
Public utility Water Require-
Access performancea ment Ratio (WRR)
Frontier 1.00 1.00 1.00
Oman 0.92 0.65 —
a. Public Utility performance is a ratio of water sold to net water sup-plied. It is 1-non-revenue water.
Note: The value for WRR in the figure is set to 0 because the actual number is not available.
08-App3_159-198 2/28/07 3:51 PM Page 179
180 Making the Most of Scarcity
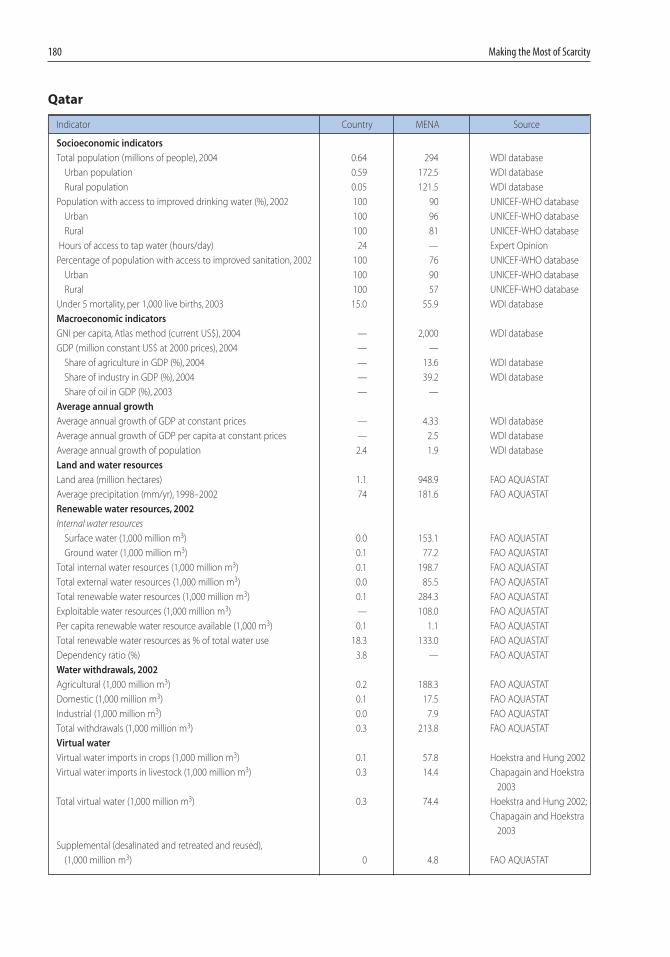
Qatar
Indicator Country MENA Source
Socioeconomic indicators
Total population (millions of people), 2004 0.64 294 WDI database
Urban population 0.59 172.5 WDI database
Rural population 0.05 121.5 WDI database
Population with access to improved drinking water (%), 2002 100 90 UNICEF-WHO database
Urban 100 96 UNICEF-WHO database
Rural 100 81 UNICEF-WHO database
Hours of access to tap water (hours/day) 24 — Expert Opinion
Percentage of population with access to improved sanitation, 2002 100 76 UNICEF-WHO database
Urban 100 90 UNICEF-WHO database
Rural 100 57 UNICEF-WHO database
Under 5 mortality, per 1,000 live births, 2003 15.0 55.9 WDI database
Macroeconomic indicators
GNI per capita, Atlas method (current US$), 2004 — 2,000 WDI database
GDP (million constant US$ at 2000 prices), 2004 — —
Share of agriculture in GDP (%), 2004 — 13.6 WDI database
Share of industry in GDP (%), 2004 — 39.2 WDI database
Share of oil in GDP (%), 2003 — —
Average annual growth
Average annual growth of GDP at constant prices — 4.33 WDI database
Average annual growth of GDP per capita at constant prices — 2.5 WDI database
Average annual growth of population 2.4 1.9 WDI database
Land and water resources
Land area (million hectares) 1.1 948.9 FAO AQUASTAT
Average precipitation (mm/yr), 1998–2002 74 181.6 FAO AQUASTAT
Renewable water resources, 2002
Internal water resources
Surface water (1,000 million m3) 0.0 153.1 FAO AQUASTAT
Ground water (1,000 million m3) 0.1 77.2 FAO AQUASTAT
Total internal water resources (1,000 million m3) 0.1 198.7 FAO AQUASTAT
Total external water resources (1,000 million m3) 0.0 85.5 FAO AQUASTAT
Total renewable water resources (1,000 million m3) 0.1 284.3 FAO AQUASTAT
Exploitable water resources (1,000 million m3) — 108.0 FAO AQUASTAT
Per capita renewable water resource available (1,000 m3) 0.1 1.1 FAO AQUASTAT
Total renewable water resources as % of total water use 18.3 133.0 FAO AQUASTAT
Dependency ratio (%) 3.8 — FAO AQUASTAT
Water withdrawals, 2002
Agricultural (1,000 million m3) 0.2 188.3 FAO AQUASTAT
Domestic (1,000 million m3) 0.1 17.5 FAO AQUASTAT
Industrial (1,000 million m3) 0.0 7.9 FAO AQUASTAT
Total withdrawals (1,000 million m3) 0.3 213.8 FAO AQUASTAT
Virtual water
Virtual water imports in crops (1,000 million m3) 0.1 57.8 Hoekstra and Hung 2002
Virtual water imports in livestock (1,000 million m3) 0.3 14.4 Chapagain and Hoekstra
2003
Total virtual water (1,000 million m3) 0.3 74.4 Hoekstra and Hung 2002;
Chapagain and Hoekstra
2003
Supplemental (desalinated and retreated and reused),
(1,000 million m3) 0 4.8 FAO AQUASTAT
08-App3_159-198 2/28/07 3:51 PM Page 180
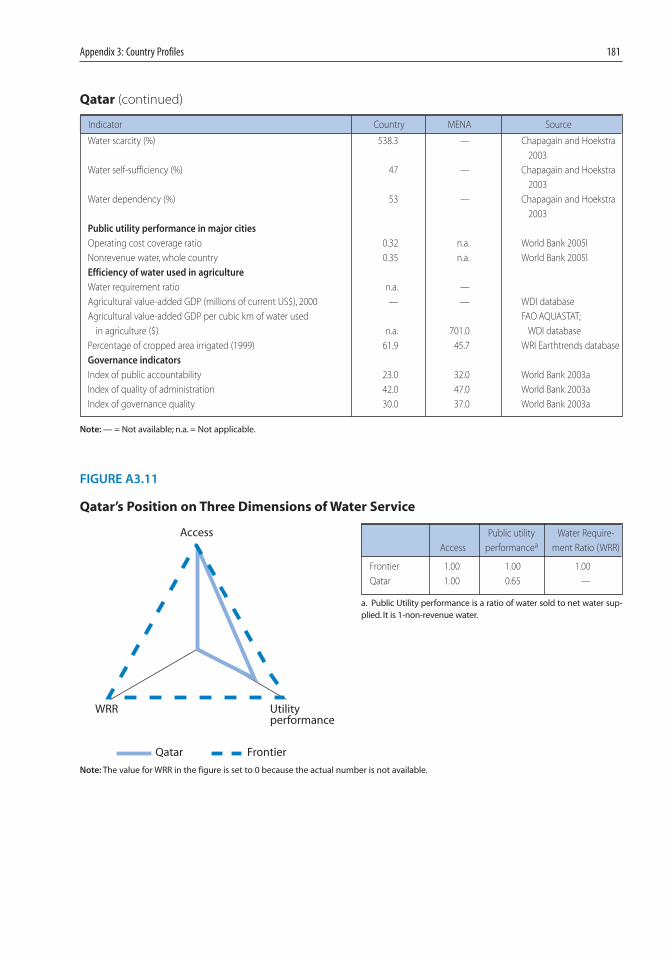
Appendix 3: Country Profiles 181
Qatar (continued)
Indicator Country MENA Source
Water scarcity (%) 538.3 — Chapagain and Hoekstra
2003
Water self-sufficiency (%) 47 — Chapagain and Hoekstra
2003
Water dependency (%) 53 — Chapagain and Hoekstra
2003
Public utility performance in major cities
Operating cost coverage ratio 0.32 n.a. World Bank 2005l
Nonrevenue water, whole country 0.35 n.a. World Bank 2005l
Efficiency of water used in agriculture
Water requirement ratio n.a. —
Agricultural value-added GDP (millions of current US$), 2000 — — WDI database
Agricultural value-added GDP per cubic km of water used FAO AQUASTAT;
in agriculture ($) n.a. 701.0 WDI database
Percentage of cropped area irrigated (1999) 61.9 45.7 WRI Earthtrends database
Governance indicators
Index of public accountability 23.0 32.0 World Bank 2003a
Index of quality of administration 42.0 47.0 World Bank 2003a
Index of governance quality 30.0 37.0 World Bank 2003a
Note: — = Not available; n.a. = Not applicable.
FIGURE A3.11
Qatar’s Position on Three Dimensions of Water Service
Qatar Frontier
Access
Utilityperformance
WRR
Public utility Water Require-
Access performancea ment Ratio (WRR)
Frontier 1.00 1.00 1.00
Qatar 1.00 0.65 —
a. Public Utility performance is a ratio of water sold to net water sup-plied. It is 1-non-revenue water.
Note: The value for WRR in the figure is set to 0 because the actual number is not available.
08-App3_159-198 2/28/07 3:51 PM Page 181
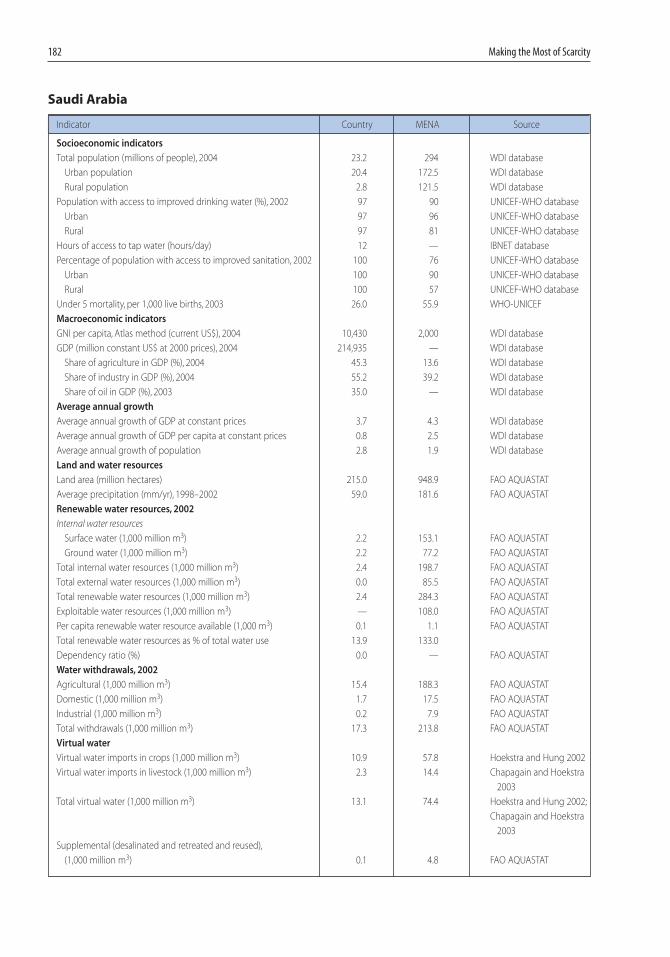
182 Making the Most of Scarcity
Saudi Arabia
Indicator Country MENA Source
Socioeconomic indicators
Total population (millions of people), 2004 23.2 294 WDI database
Urban population 20.4 172.5 WDI database
Rural population 2.8 121.5 WDI database
Population with access to improved drinking water (%), 2002 97 90 UNICEF-WHO database
Urban 97 96 UNICEF-WHO database
Rural 97 81 UNICEF-WHO database
Hours of access to tap water (hours/day) 12 — IBNET database
Percentage of population with access to improved sanitation, 2002 100 76 UNICEF-WHO database
Urban 100 90 UNICEF-WHO database
Rural 100 57 UNICEF-WHO database
Under 5 mortality, per 1,000 live births, 2003 26.0 55.9 WHO-UNICEF
Macroeconomic indicators
GNI per capita, Atlas method (current US$), 2004 10,430 2,000 WDI database
GDP (million constant US$ at 2000 prices), 2004 214,935 — WDI database
Share of agriculture in GDP (%), 2004 45.3 13.6 WDI database
Share of industry in GDP (%), 2004 55.2 39.2 WDI database
Share of oil in GDP (%), 2003 35.0 — WDI database
Average annual growth
Average annual growth of GDP at constant prices 3.7 4.3 WDI database
Average annual growth of GDP per capita at constant prices 0.8 2.5 WDI database
Average annual growth of population 2.8 1.9 WDI database
Land and water resources
Land area (million hectares) 215.0 948.9 FAO AQUASTAT
Average precipitation (mm/yr), 1998–2002 59.0 181.6 FAO AQUASTAT
Renewable water resources, 2002
Internal water resources
Surface water (1,000 million m3) 2.2 153.1 FAO AQUASTAT
Ground water (1,000 million m3) 2.2 77.2 FAO AQUASTAT
Total internal water resources (1,000 million m3) 2.4 198.7 FAO AQUASTAT
Total external water resources (1,000 million m3) 0.0 85.5 FAO AQUASTAT
Total renewable water resources (1,000 million m3) 2.4 284.3 FAO AQUASTAT
Exploitable water resources (1,000 million m3) — 108.0 FAO AQUASTAT
Per capita renewable water resource available (1,000 m3) 0.1 1.1 FAO AQUASTAT
Total renewable water resources as % of total water use 13.9 133.0
Dependency ratio (%) 0.0 — FAO AQUASTAT
Water withdrawals, 2002
Agricultural (1,000 million m3) 15.4 188.3 FAO AQUASTAT
Domestic (1,000 million m3) 1.7 17.5 FAO AQUASTAT
Industrial (1,000 million m3) 0.2 7.9 FAO AQUASTAT
Total withdrawals (1,000 million m3) 17.3 213.8 FAO AQUASTAT
Virtual water
Virtual water imports in crops (1,000 million m3) 10.9 57.8 Hoekstra and Hung 2002
Virtual water imports in livestock (1,000 million m3) 2.3 14.4 Chapagain and Hoekstra
2003
Total virtual water (1,000 million m3) 13.1 74.4 Hoekstra and Hung 2002;
Chapagain and Hoekstra
2003
Supplemental (desalinated and retreated and reused),
(1,000 million m3) 0.1 4.8 FAO AQUASTAT
08-App3_159-198 2/28/07 3:51 PM Page 182
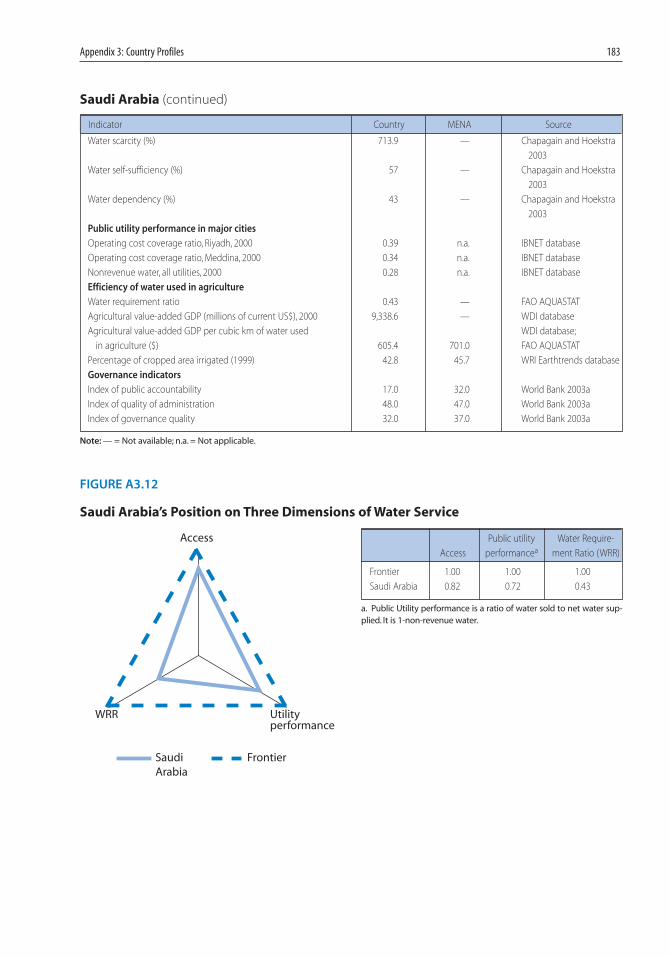
Appendix 3: Country Profiles 183
Saudi Arabia (continued)
Indicator Country MENA Source
Water scarcity (%) 713.9 — Chapagain and Hoekstra
2003
Water self-sufficiency (%) 57 — Chapagain and Hoekstra
2003
Water dependency (%) 43 — Chapagain and Hoekstra
2003
Public utility performance in major cities
Operating cost coverage ratio, Riyadh, 2000 0.39 n.a. IBNET database
Operating cost coverage ratio, Meddina, 2000 0.34 n.a. IBNET database
Nonrevenue water, all utilities, 2000 0.28 n.a. IBNET database
Efficiency of water used in agriculture
Water requirement ratio 0.43 — FAO AQUASTAT
Agricultural value-added GDP (millions of current US$), 2000 9,338.6 — WDI database
Agricultural value-added GDP per cubic km of water used WDI database;
in agriculture ($) 605.4 701.0 FAO AQUASTAT
Percentage of cropped area irrigated (1999) 42.8 45.7 WRI Earthtrends database
Governance indicators
Index of public accountability 17.0 32.0 World Bank 2003a
Index of quality of administration 48.0 47.0 World Bank 2003a
Index of governance quality 32.0 37.0 World Bank 2003a
Note: — = Not available; n.a. = Not applicable.
FIGURE A3.12
Saudi Arabia’s Position on Three Dimensions of Water Service
SaudiArabia
Frontier
Access
Utilityperformance
WRR
Public utility Water Require-
Access performancea ment Ratio (WRR)
Frontier 1.00 1.00 1.00
Saudi Arabia 0.82 0.72 0.43
a. Public Utility performance is a ratio of water sold to net water sup-plied. It is 1-non-revenue water.
08-App3_159-198 2/28/07 3:51 PM Page 183
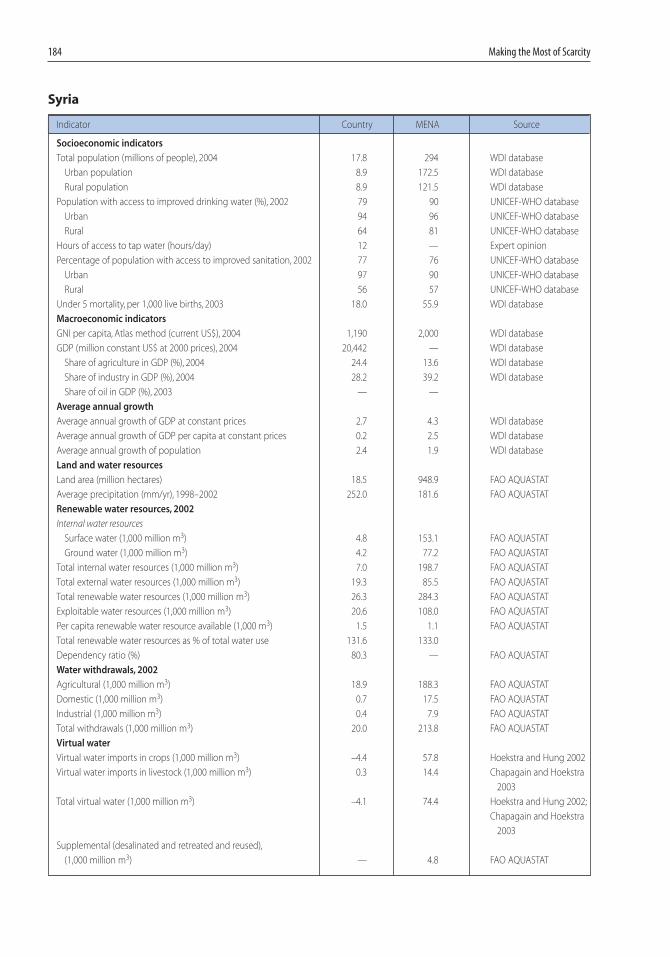
184 Making the Most of Scarcity
Syria
Indicator Country MENA Source
Socioeconomic indicators
Total population (millions of people), 2004 17.8 294 WDI database
Urban population 8.9 172.5 WDI database
Rural population 8.9 121.5 WDI database
Population with access to improved drinking water (%), 2002 79 90 UNICEF-WHO database
Urban 94 96 UNICEF-WHO database
Rural 64 81 UNICEF-WHO database
Hours of access to tap water (hours/day) 12 — Expert opinion
Percentage of population with access to improved sanitation, 2002 77 76 UNICEF-WHO database
Urban 97 90 UNICEF-WHO database
Rural 56 57 UNICEF-WHO database
Under 5 mortality, per 1,000 live births, 2003 18.0 55.9 WDI database
Macroeconomic indicators
GNI per capita, Atlas method (current US$), 2004 1,190 2,000 WDI database
GDP (million constant US$ at 2000 prices), 2004 20,442 — WDI database
Share of agriculture in GDP (%), 2004 24.4 13.6 WDI database
Share of industry in GDP (%), 2004 28.2 39.2 WDI database
Share of oil in GDP (%), 2003 — —
Average annual growth
Average annual growth of GDP at constant prices 2.7 4.3 WDI database
Average annual growth of GDP per capita at constant prices 0.2 2.5 WDI database
Average annual growth of population 2.4 1.9 WDI database
Land and water resources
Land area (million hectares) 18.5 948.9 FAO AQUASTAT
Average precipitation (mm/yr), 1998–2002 252.0 181.6 FAO AQUASTAT
Renewable water resources, 2002
Internal water resources
Surface water (1,000 million m3) 4.8 153.1 FAO AQUASTAT
Ground water (1,000 million m3) 4.2 77.2 FAO AQUASTAT
Total internal water resources (1,000 million m3) 7.0 198.7 FAO AQUASTAT
Total external water resources (1,000 million m3) 19.3 85.5 FAO AQUASTAT
Total renewable water resources (1,000 million m3) 26.3 284.3 FAO AQUASTAT
Exploitable water resources (1,000 million m3) 20.6 108.0 FAO AQUASTAT
Per capita renewable water resource available (1,000 m3) 1.5 1.1 FAO AQUASTAT
Total renewable water resources as % of total water use 131.6 133.0
Dependency ratio (%) 80.3 — FAO AQUASTAT
Water withdrawals, 2002
Agricultural (1,000 million m3) 18.9 188.3 FAO AQUASTAT
Domestic (1,000 million m3) 0.7 17.5 FAO AQUASTAT
Industrial (1,000 million m3) 0.4 7.9 FAO AQUASTAT
Total withdrawals (1,000 million m3) 20.0 213.8 FAO AQUASTAT
Virtual water
Virtual water imports in crops (1,000 million m3) –4.4 57.8 Hoekstra and Hung 2002
Virtual water imports in livestock (1,000 million m3) 0.3 14.4 Chapagain and Hoekstra
2003
Total virtual water (1,000 million m3) –4.1 74.4 Hoekstra and Hung 2002;
Chapagain and Hoekstra
2003
Supplemental (desalinated and retreated and reused),
(1,000 million m3) — 4.8 FAO AQUASTAT
08-App3_159-198 2/28/07 3:51 PM Page 184
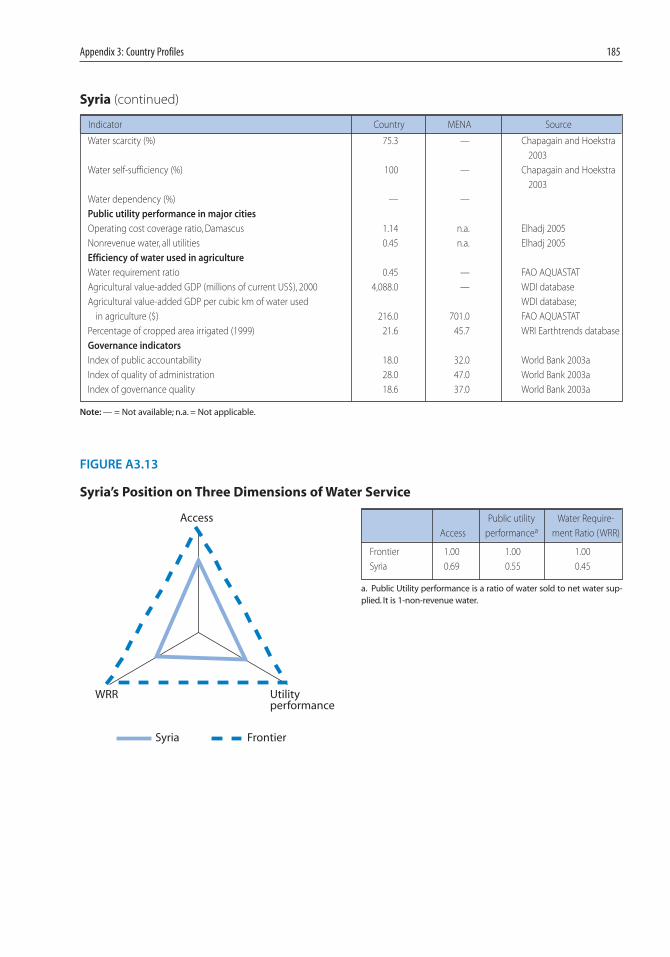
Appendix 3: Country Profiles 185
Syria (continued)
Indicator Country MENA Source
Water scarcity (%) 75.3 — Chapagain and Hoekstra
2003
Water self-sufficiency (%) 100 — Chapagain and Hoekstra
2003
Water dependency (%) — —
Public utility performance in major cities
Operating cost coverage ratio, Damascus 1.14 n.a. Elhadj 2005
Nonrevenue water, all utilities 0.45 n.a. Elhadj 2005
Efficiency of water used in agriculture
Water requirement ratio 0.45 — FAO AQUASTAT
Agricultural value-added GDP (millions of current US$), 2000 4,088.0 — WDI database
Agricultural value-added GDP per cubic km of water used WDI database;
in agriculture ($) 216.0 701.0 FAO AQUASTAT
Percentage of cropped area irrigated (1999) 21.6 45.7 WRI Earthtrends database
Governance indicators
Index of public accountability 18.0 32.0 World Bank 2003a
Index of quality of administration 28.0 47.0 World Bank 2003a
Index of governance quality 18.6 37.0 World Bank 2003a
Note: — = Not available; n.a. = Not applicable.
FIGURE A3.13
Syria’s Position on Three Dimensions of Water Service
Syria Frontier
Access
Utilityperformance
WRR
Public utility Water Require-
Access performancea ment Ratio (WRR)
Frontier 1.00 1.00 1.00
Syria 0.69 0.55 0.45
a. Public Utility performance is a ratio of water sold to net water sup-plied. It is 1-non-revenue water.
08-App3_159-198 2/28/07 3:51 PM Page 185

186 Making the Most of Scarcity
Tunisia
Indicator Country MENA Source
Socioeconomic indicators
Total population (millions of people), 2004 10.0 294 WDI database
Urban population 6.4 172.5 WDI database
Rural population 3.6 121.5 WDI database
Population with access to improved drinking water (%), 2002 82 90 UNICEF-WHO database
Urban 94 96 UNICEF-WHO database
Rural 60 81 UNICEF-WHO database
Hours of access to tap water (hours/day) 24 — Expert opinion
Percentage of population with access to improved sanitation, 2002 80 76 UNICEF-WHO database
Urban 90 90 UNICEF-WHO database
Rural 62 57 UNICEF-WHO database
Under 5 mortality, per 1,000 live births, 2003 24.0 55.9 WDI database
Macroeconomic indicators
GNI per capita, Atlas method (current US$), 2004 2630 2000 WDI database
GDP (million constant US$ at 2000 prices), 2004 23,174 — WDI database
Share of agriculture in GDP (%), 2004 12.6 13.6 WDI database
Share of industry in GDP (%), 2004 27.8 39.2 WDI database
Share of oil in GDP (%), 2003 — —
Average annual growth
Average annual growth of GDP at constant prices 4.5 4.3 WDI database
Average annual growth of GDP per capita at constant prices 3.3 2.5 WDI database
Average annual growth of population 1.2 1.9 WDI database
Land and water resources
Land area (million hectares) 16.4 948.9 FAO AQUASTAT
Average precipitation (mm/yr), 1998–2002 207.0 181.6 FAO AQUASTAT
Renewable water resources, 2002
Internal water resources
Surface water (1,000 million m3) 3.1 153.1 FAO AQUASTAT
Ground water (1,000 million m3) 1.5 77.2 FAO AQUASTAT
Total internal water resources (1,000 million m3) 4.2 198.7 FAO AQUASTAT
Total external water resources (1,000 million m3) 0.4 85.5 FAO AQUASTAT
Total renewable water resources (1,000 million m3) 4.6 284.3 FAO AQUASTAT
Exploitable water resources (1,000 million m3) 3.6 108.0 FAO AQUASTAT
Per capita renewable water resource available (1,000 m3) 0.5 1.1 FAO AQUASTAT
Total renewable water resources as % of total water use 174.1 133.0 FAO AQUASTAT
Dependency ratio (%) 8.7 — FAO AQUASTAT
Water withdrawals, 2002
Agricultural (1,000 million m3) 2.2 188.3 FAO AQUASTAT
Domestic (1,000 million m3) 0.4 17.5 FAO AQUASTAT
Industrial (1,000 million m3) 0.1 7.9 FAO AQUASTAT
Total withdrawals (1,000 million m3) 2.6 213.8 FAO AQUASTAT
Virtual water
Virtual water imports in crops (1,000 million m3) 3.9 57.8 Hoekstra and Hung 2002
Virtual water imports in livestock (1,000 million m3) 0.3 14.4 Chapagain and Hoekstra
2003
Total virtual water (1,000 million m3) 4.1 74.4 Hoekstra and Hung 2002;
Chapagain and Hoekstra
2003
Supplemental (desalinated and retreated and reused),
(1,000 million m3) 2.9 4.8 FAO AQUASTAT
08-App3_159-198 2/28/07 3:51 PM Page 186
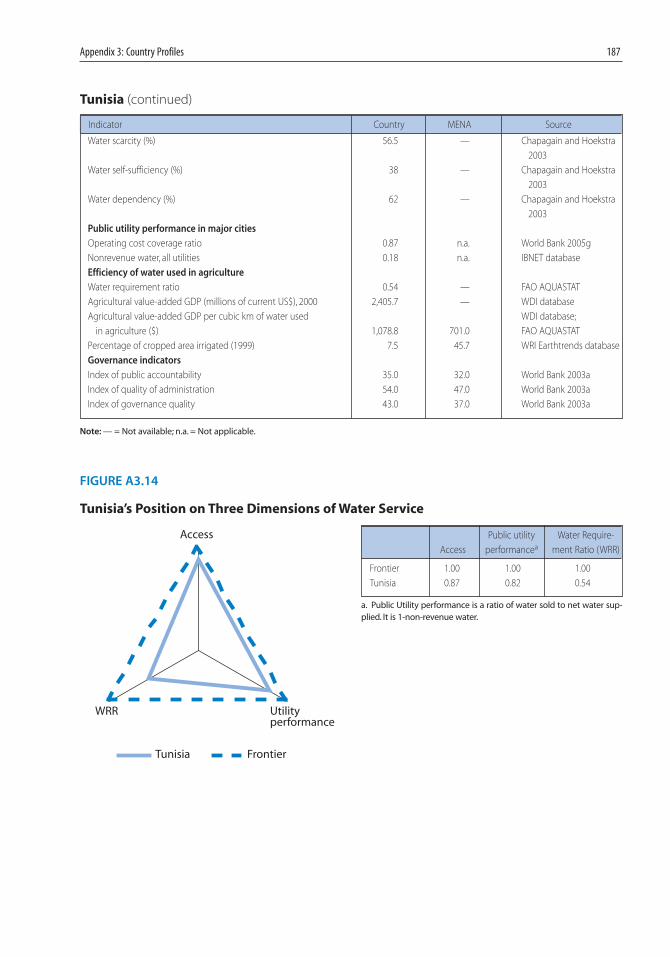
Appendix 3: Country Profiles 187
Tunisia (continued)
Indicator Country MENA Source
Water scarcity (%) 56.5 — Chapagain and Hoekstra
2003
Water self-sufficiency (%) 38 — Chapagain and Hoekstra
2003
Water dependency (%) 62 — Chapagain and Hoekstra
2003
Public utility performance in major cities
Operating cost coverage ratio 0.87 n.a. World Bank 2005g
Nonrevenue water, all utilities 0.18 n.a. IBNET database
Efficiency of water used in agriculture
Water requirement ratio 0.54 — FAO AQUASTAT
Agricultural value-added GDP (millions of current US$), 2000 2,405.7 — WDI database
Agricultural value-added GDP per cubic km of water used WDI database;
in agriculture ($) 1,078.8 701.0 FAO AQUASTAT
Percentage of cropped area irrigated (1999) 7.5 45.7 WRI Earthtrends database
Governance indicators
Index of public accountability 35.0 32.0 World Bank 2003a
Index of quality of administration 54.0 47.0 World Bank 2003a
Index of governance quality 43.0 37.0 World Bank 2003a
Note: — = Not available; n.a. = Not applicable.
FIGURE A3.14
Tunisia’s Position on Three Dimensions of Water Service
Tunisia Frontier
Access
Utilityperformance
WRR
Public utility Water Require-
Access performancea ment Ratio (WRR)
Frontier 1.00 1.00 1.00
Tunisia 0.87 0.82 0.54
a. Public Utility performance is a ratio of water sold to net water sup-plied. It is 1-non-revenue water.
08-App3_159-198 2/28/07 3:51 PM Page 187
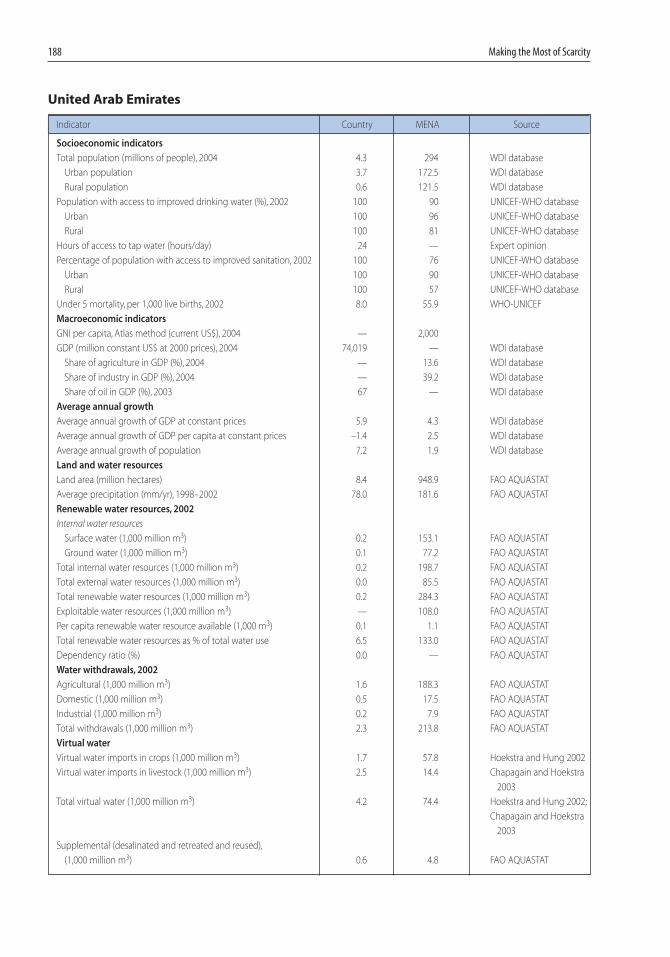
188 Making the Most of Scarcity
United Arab Emirates
Indicator Country MENA Source
Socioeconomic indicators
Total population (millions of people), 2004 4.3 294 WDI database
Urban population 3.7 172.5 WDI database
Rural population 0.6 121.5 WDI database
Population with access to improved drinking water (%), 2002 100 90 UNICEF-WHO database
Urban 100 96 UNICEF-WHO database
Rural 100 81 UNICEF-WHO database
Hours of access to tap water (hours/day) 24 — Expert opinion
Percentage of population with access to improved sanitation, 2002 100 76 UNICEF-WHO database
Urban 100 90 UNICEF-WHO database
Rural 100 57 UNICEF-WHO database
Under 5 mortality, per 1,000 live births, 2002 8.0 55.9 WHO-UNICEF
Macroeconomic indicators
GNI per capita, Atlas method (current US$), 2004 — 2,000
GDP (million constant US$ at 2000 prices), 2004 74,019 — WDI database
Share of agriculture in GDP (%), 2004 — 13.6 WDI database
Share of industry in GDP (%), 2004 — 39.2 WDI database
Share of oil in GDP (%), 2003 67 — WDI database
Average annual growth
Average annual growth of GDP at constant prices 5.9 4.3 WDI database
Average annual growth of GDP per capita at constant prices –1.4 2.5 WDI database
Average annual growth of population 7.2 1.9 WDI database
Land and water resources
Land area (million hectares) 8.4 948.9 FAO AQUASTAT
Average precipitation (mm/yr), 1998–2002 78.0 181.6 FAO AQUASTAT
Renewable water resources, 2002
Internal water resources
Surface water (1,000 million m3) 0.2 153.1 FAO AQUASTAT
Ground water (1,000 million m3) 0.1 77.2 FAO AQUASTAT
Total internal water resources (1,000 million m3) 0.2 198.7 FAO AQUASTAT
Total external water resources (1,000 million m3) 0.0 85.5 FAO AQUASTAT
Total renewable water resources (1,000 million m3) 0.2 284.3 FAO AQUASTAT
Exploitable water resources (1,000 million m3) — 108.0 FAO AQUASTAT
Per capita renewable water resource available (1,000 m3) 0.1 1.1 FAO AQUASTAT
Total renewable water resources as % of total water use 6.5 133.0 FAO AQUASTAT
Dependency ratio (%) 0.0 — FAO AQUASTAT
Water withdrawals, 2002
Agricultural (1,000 million m3) 1.6 188.3 FAO AQUASTAT
Domestic (1,000 million m3) 0.5 17.5 FAO AQUASTAT
Industrial (1,000 million m3) 0.2 7.9 FAO AQUASTAT
Total withdrawals (1,000 million m3) 2.3 213.8 FAO AQUASTAT
Virtual water
Virtual water imports in crops (1,000 million m3) 1.7 57.8 Hoekstra and Hung 2002
Virtual water imports in livestock (1,000 million m3) 2.5 14.4 Chapagain and Hoekstra
2003
Total virtual water (1,000 million m3) 4.2 74.4 Hoekstra and Hung 2002;
Chapagain and Hoekstra
2003
Supplemental (desalinated and retreated and reused),
(1,000 million m3) 0.6 4.8 FAO AQUASTAT
08-App3_159-198 2/28/07 3:51 PM Page 188
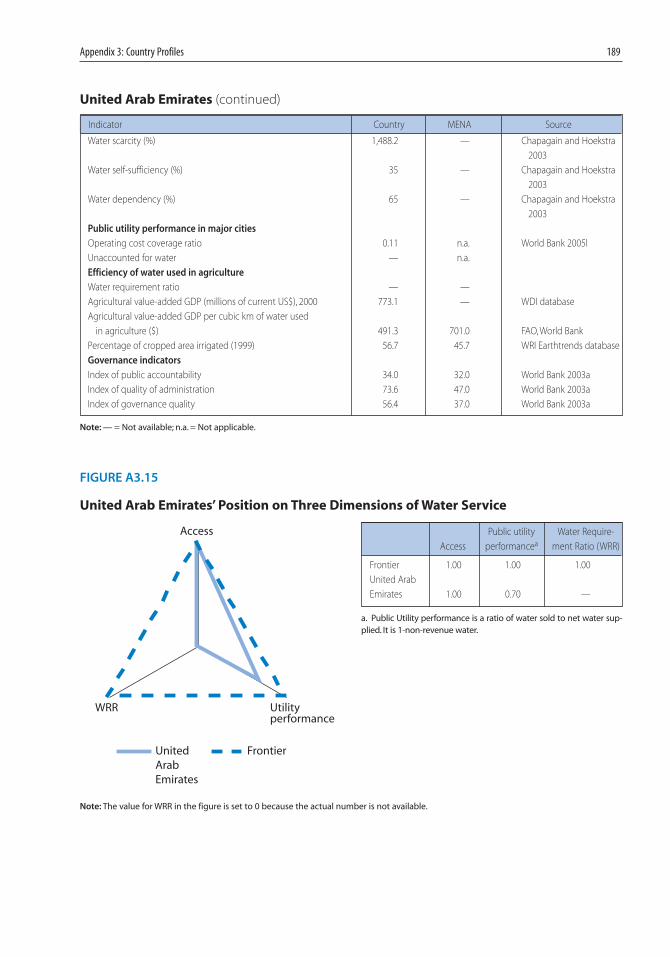
Appendix 3: Country Profiles 189
United Arab Emirates (continued)
Indicator Country MENA Source
Water scarcity (%) 1,488.2 — Chapagain and Hoekstra
2003
Water self-sufficiency (%) 35 — Chapagain and Hoekstra
2003
Water dependency (%) 65 — Chapagain and Hoekstra
2003
Public utility performance in major cities
Operating cost coverage ratio 0.11 n.a. World Bank 2005l
Unaccounted for water — n.a.
Efficiency of water used in agriculture
Water requirement ratio — —
Agricultural value-added GDP (millions of current US$), 2000 773.1 — WDI database
Agricultural value-added GDP per cubic km of water used
in agriculture ($) 491.3 701.0 FAO, World Bank
Percentage of cropped area irrigated (1999) 56.7 45.7 WRI Earthtrends database
Governance indicators
Index of public accountability 34.0 32.0 World Bank 2003a
Index of quality of administration 73.6 47.0 World Bank 2003a
Index of governance quality 56.4 37.0 World Bank 2003a
Note: — = Not available; n.a. = Not applicable.
FIGURE A3.15
United Arab Emirates’ Position on Three Dimensions of Water Service
UnitedArabEmirates
Frontier
Access
Utilityperformance
WRR
Public utility Water Require-
Access performancea ment Ratio (WRR)
Frontier 1.00 1.00 1.00
United Arab
Emirates 1.00 0.70 —
a. Public Utility performance is a ratio of water sold to net water sup-plied. It is 1-non-revenue water.
Note: The value for WRR in the figure is set to 0 because the actual number is not available.
08-App3_159-198 2/28/07 3:51 PM Page 189
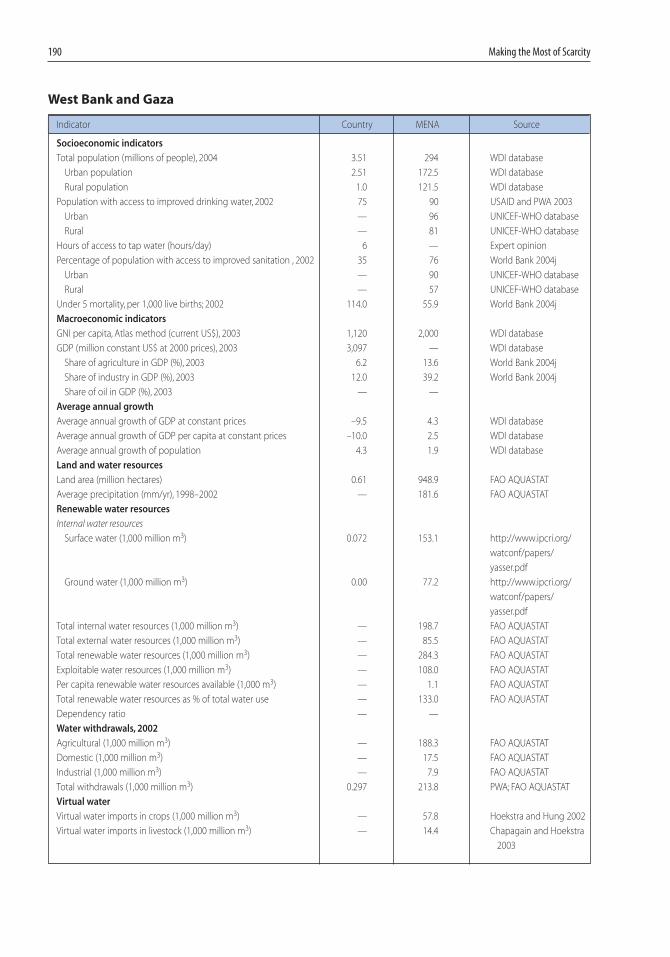
190 Making the Most of Scarcity
West Bank and Gaza
Indicator Country MENA Source
Socioeconomic indicators
Total population (millions of people), 2004 3.51 294 WDI database
Urban population 2.51 172.5 WDI database
Rural population 1.0 121.5 WDI database
Population with access to improved drinking water, 2002 75 90 USAID and PWA 2003
Urban — 96 UNICEF-WHO database
Rural — 81 UNICEF-WHO database
Hours of access to tap water (hours/day) 6 — Expert opinion
Percentage of population with access to improved sanitation , 2002 35 76 World Bank 2004j
Urban — 90 UNICEF-WHO database
Rural — 57 UNICEF-WHO database
Under 5 mortality, per 1,000 live births; 2002 114.0 55.9 World Bank 2004j
Macroeconomic indicators
GNI per capita, Atlas method (current US$), 2003 1,120 2,000 WDI database
GDP (million constant US$ at 2000 prices), 2003 3,097 — WDI database
Share of agriculture in GDP (%), 2003 6.2 13.6 World Bank 2004j
Share of industry in GDP (%), 2003 12.0 39.2 World Bank 2004j
Share of oil in GDP (%), 2003 — —
Average annual growth
Average annual growth of GDP at constant prices –9.5 4.3 WDI database
Average annual growth of GDP per capita at constant prices –10.0 2.5 WDI database
Average annual growth of population 4.3 1.9 WDI database
Land and water resources
Land area (million hectares) 0.61 948.9 FAO AQUASTAT
Average precipitation (mm/yr), 1998–2002 — 181.6 FAO AQUASTAT
Renewable water resources
Internal water resources
Surface water (1,000 million m3) 0.072 153.1 http://www.ipcri.org/
watconf/papers/
yasser.pdf
Ground water (1,000 million m3) 0.00 77.2 http://www.ipcri.org/
watconf/papers/
yasser.pdf
Total internal water resources (1,000 million m3) — 198.7 FAO AQUASTAT
Total external water resources (1,000 million m3) — 85.5 FAO AQUASTAT
Total renewable water resources (1,000 million m3) — 284.3 FAO AQUASTAT
Exploitable water resources (1,000 million m3) — 108.0 FAO AQUASTAT
Per capita renewable water resources available (1,000 m3) — 1.1 FAO AQUASTAT
Total renewable water resources as % of total water use — 133.0 FAO AQUASTAT
Dependency ratio — —
Water withdrawals, 2002
Agricultural (1,000 million m3) — 188.3 FAO AQUASTAT
Domestic (1,000 million m3) — 17.5 FAO AQUASTAT
Industrial (1,000 million m3) — 7.9 FAO AQUASTAT
Total withdrawals (1,000 million m3) 0.297 213.8 PWA; FAO AQUASTAT
Virtual water
Virtual water imports in crops (1,000 million m3) — 57.8 Hoekstra and Hung 2002
Virtual water imports in livestock (1,000 million m3) — 14.4 Chapagain and Hoekstra
2003
08-App3_159-198 2/28/07 3:51 PM Page 190
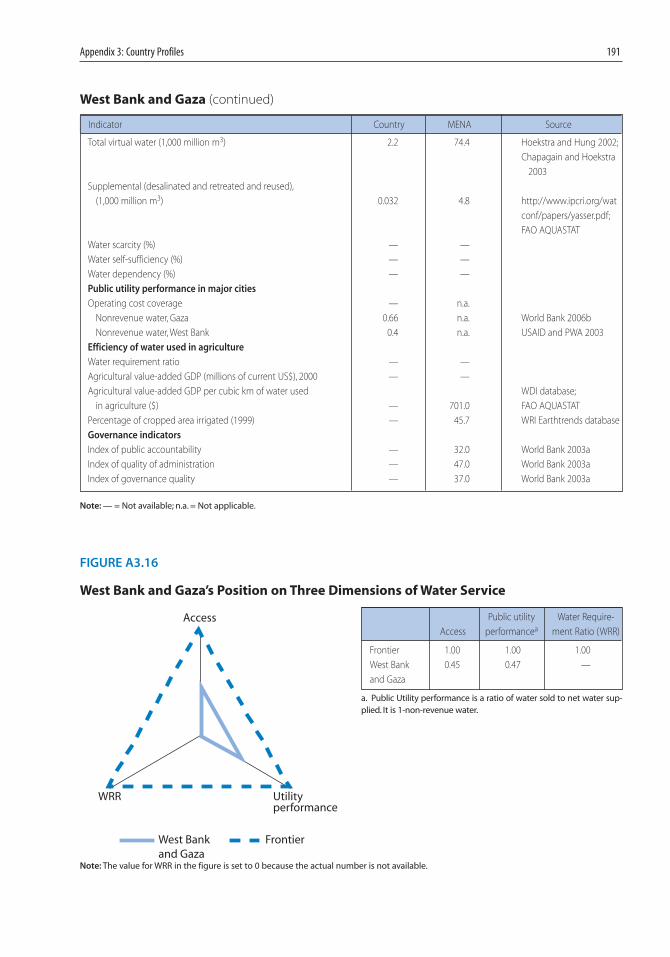
Appendix 3: Country Profiles 191
West Bank and Gaza (continued)
Indicator Country MENA Source
Total virtual water (1,000 million m3) 2.2 74.4 Hoekstra and Hung 2002;
Chapagain and Hoekstra
2003
Supplemental (desalinated and retreated and reused),
(1,000 million m3) 0.032 4.8 http://www.ipcri.org/wat
conf/papers/yasser.pdf;
FAO AQUASTAT
Water scarcity (%) — —
Water self-sufficiency (%) — —
Water dependency (%) — —
Public utility performance in major cities
Operating cost coverage — n.a.
Nonrevenue water, Gaza 0.66 n.a. World Bank 2006b
Nonrevenue water, West Bank 0.4 n.a. USAID and PWA 2003
Efficiency of water used in agriculture
Water requirement ratio — —
Agricultural value-added GDP (millions of current US$), 2000 — —
Agricultural value-added GDP per cubic km of water used WDI database;
in agriculture ($) — 701.0 FAO AQUASTAT
Percentage of cropped area irrigated (1999) — 45.7 WRI Earthtrends database
Governance indicators
Index of public accountability — 32.0 World Bank 2003a
Index of quality of administration — 47.0 World Bank 2003a
Index of governance quality — 37.0 World Bank 2003a
Note: — = Not available; n.a. = Not applicable.
FIGURE A3.16
West Bank and Gaza’s Position on Three Dimensions of Water Service
West Bankand Gaza
Frontier
Access
Utilityperformance
WRR
Public utility Water Require-
Access performancea ment Ratio (WRR)
Frontier 1.00 1.00 1.00
West Bank 0.45 0.47 —
and Gaza
a. Public Utility performance is a ratio of water sold to net water sup-plied. It is 1-non-revenue water.
Note: The value for WRR in the figure is set to 0 because the actual number is not available.
08-App3_159-198 2/28/07 3:51 PM Page 191
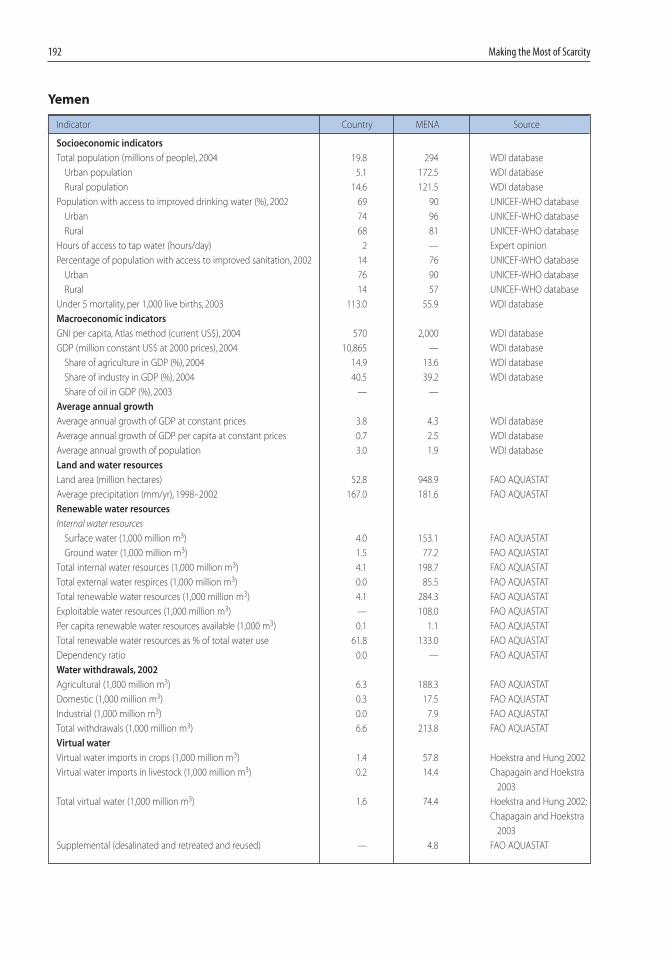
Yemen
Indicator Country MENA Source
Socioeconomic indicators
Total population (millions of people), 2004 19.8 294 WDI database
Urban population 5.1 172.5 WDI database
Rural population 14.6 121.5 WDI database
Population with access to improved drinking water (%), 2002 69 90 UNICEF-WHO database
Urban 74 96 UNICEF-WHO database
Rural 68 81 UNICEF-WHO database
Hours of access to tap water (hours/day) 2 — Expert opinion
Percentage of population with access to improved sanitation, 2002 14 76 UNICEF-WHO database
Urban 76 90 UNICEF-WHO database
Rural 14 57 UNICEF-WHO database
Under 5 mortality, per 1,000 live births, 2003 113.0 55.9 WDI database
Macroeconomic indicators
GNI per capita, Atlas method (current US$), 2004 570 2,000 WDI database
GDP (million constant US$ at 2000 prices), 2004 10,865 — WDI database
Share of agriculture in GDP (%), 2004 14.9 13.6 WDI database
Share of industry in GDP (%), 2004 40.5 39.2 WDI database
Share of oil in GDP (%), 2003 — —
Average annual growth
Average annual growth of GDP at constant prices 3.8 4.3 WDI database
Average annual growth of GDP per capita at constant prices 0.7 2.5 WDI database
Average annual growth of population 3.0 1.9 WDI database
Land and water resources
Land area (million hectares) 52.8 948.9 FAO AQUASTAT
Average precipitation (mm/yr), 1998–2002 167.0 181.6 FAO AQUASTAT
Renewable water resources
Internal water resources
Surface water (1,000 million m3) 4.0 153.1 FAO AQUASTAT
Ground water (1,000 million m3) 1.5 77.2 FAO AQUASTAT
Total internal water resources (1,000 million m3) 4.1 198.7 FAO AQUASTAT
Total external water respirces (1,000 million m3) 0.0 85.5 FAO AQUASTAT
Total renewable water resources (1,000 million m3) 4.1 284.3 FAO AQUASTAT
Exploitable water resources (1,000 million m3) — 108.0 FAO AQUASTAT
Per capita renewable water resources available (1,000 m3) 0.1 1.1 FAO AQUASTAT
Total renewable water resources as % of total water use 61.8 133.0 FAO AQUASTAT
Dependency ratio 0.0 — FAO AQUASTAT
Water withdrawals, 2002
Agricultural (1,000 million m3) 6.3 188.3 FAO AQUASTAT
Domestic (1,000 million m3) 0.3 17.5 FAO AQUASTAT
Industrial (1,000 million m3) 0.0 7.9 FAO AQUASTAT
Total withdrawals (1,000 million m3) 6.6 213.8 FAO AQUASTAT
Virtual water
Virtual water imports in crops (1,000 million m3) 1.4 57.8 Hoekstra and Hung 2002
Virtual water imports in livestock (1,000 million m3) 0.2 14.4 Chapagain and Hoekstra
2003
Total virtual water (1,000 million m3) 1.6 74.4 Hoekstra and Hung 2002;
Chapagain and Hoekstra
2003
Supplemental (desalinated and retreated and reused) — 4.8 FAO AQUASTAT
192 Making the Most of Scarcity
08-App3_159-198 2/28/07 3:51 PM Page 192
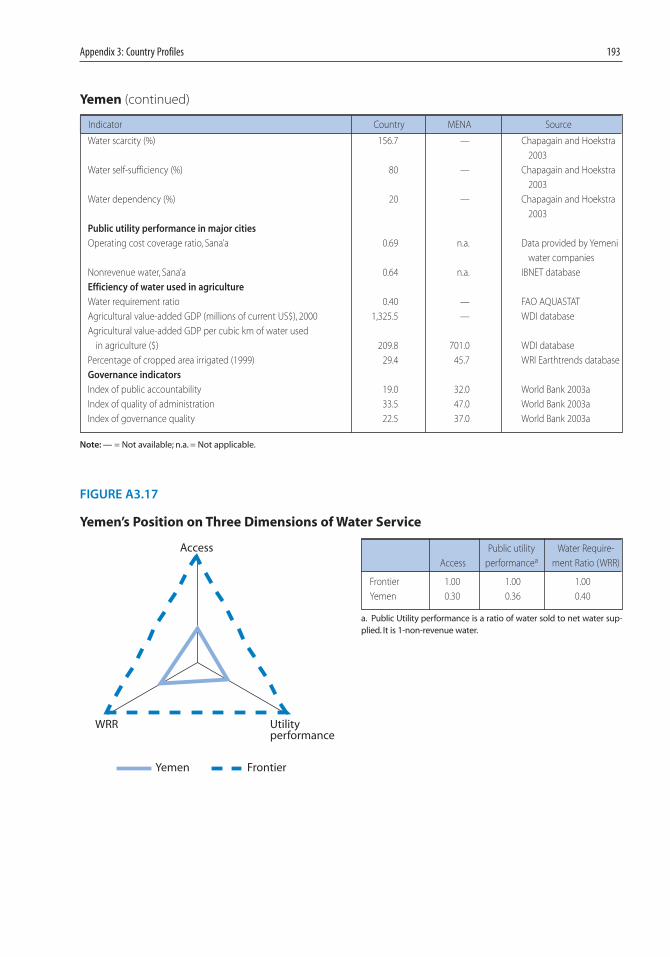
Appendix 3: Country Profiles 193
Yemen (continued)
Indicator Country MENA Source
Water scarcity (%) 156.7 — Chapagain and Hoekstra
2003
Water self-sufficiency (%) 80 — Chapagain and Hoekstra
2003
Water dependency (%) 20 — Chapagain and Hoekstra
2003
Public utility performance in major cities
Operating cost coverage ratio, Sana’a 0.69 n.a. Data provided by Yemeni
water companies
Nonrevenue water, Sana’a 0.64 n.a. IBNET database
Efficiency of water used in agriculture
Water requirement ratio 0.40 — FAO AQUASTAT
Agricultural value-added GDP (millions of current US$), 2000 1,325.5 — WDI database
Agricultural value-added GDP per cubic km of water used
in agriculture ($) 209.8 701.0 WDI database
Percentage of cropped area irrigated (1999) 29.4 45.7 WRI Earthtrends database
Governance indicators
Index of public accountability 19.0 32.0 World Bank 2003a
Index of quality of administration 33.5 47.0 World Bank 2003a
Index of governance quality 22.5 37.0 World Bank 2003a
Note: — = Not available; n.a. = Not applicable.
FIGURE A3.17
Yemen’s Position on Three Dimensions of Water Service
Yemen Frontier
Access
Utilityperformance
WRR
Public utility Water Require-
Access performancea ment Ratio (WRR)
Frontier 1.00 1.00 1.00
Yemen 0.30 0.36 0.40
a. Public Utility performance is a ratio of water sold to net water sup-plied. It is 1-non-revenue water.
08-App3_159-198 2/28/07 3:51 PM Page 193
194 Making the Most of Scarcity
Definitions of indicators
Total population: Total of an economy includes all residents regardless oflegal status or citizenship –except for refugees not permanently settled inthe country of asylum who are generally considered part of the popula-tion of their country of origin.
Urban population: Urban population is the midyear population of areasdefined as urban in each country and reported to the United Nations.
Rural population: Rural population is calculated as the difference be-tween total population and urban population.
Access to improved water: Access to improved water refers to the per-centage of population with reasonable access to an adequate amount ofwater from an improved source such as household connection, publicstandpipe, borehole, protected well or spring or rainwater collection.
Access to improved sanitation facilities: Access to improved sanitationfacilities refers to the percentage of population with access to at least exc-reta disposal facilities that can effectively prevent human, animal, and in-sect contact with excreta.
GNI Per capita Atlas method: GNI per capita is the gross national in-come divided by mid year population. GNI per capita in U.S. dollars isconverted using World Bank Atlas Method.
GDP: GDP is the sum of value added by all resident producers plus anyproduct taxes (less subsidies) not included in the valuation of output.
Average annual growth: Growth rates are calculated as annual averagesand represented as percentages. The average annual growth is computedas average of the annual growth rates for the last five years.
GDP per capita: GDP per capita is the GDP divided by the mid yearpopulation.
Under 5 Mortality rate: Under five mortality rate is the probability thata newborn baby will die before reaching age five, if subject to currentage-specific mortality rates.
Land area: Land area is the country’s total area excluding area under in-
08-App3_159-198 2/28/07 3:51 PM Page 194
Appendix 3: Country Profiles 195
land water bodies, national claims to the continental shelf, and exclusiveeconomic zones.
Average precipitation: Long-term double average over space and time ofthe precipitation falling on the country in a year, expressed in depth(mm/year).
Internal-Surface water: Surface water refers to long-term average an-nual volume of surface water generated by direct runoff from endoge-nous precipitation.
Internal-Groundwater: Groundwater refers to long-term annual aver-age groundwater recharge, generated from precipitation within theboundaries of the country. Renewable groundwater resources of thecountry are computed either by estimating annual infiltration rate (inarid countries) or by computing river base flow (in humid countries).
Total internal renewable water resources: This is the long-term averageannual flow of rivers and recharge of aquifers generated from endoge-nous precipitation. Double counting of surface water and groundwaterresources is avoided by deducting the overlap from the sum of the sur-face water and groundwater resources.
External renewable water resources: This is the sum of the total naturalexternal surface water resources and the external groundwater resources.
Total renewable water resources: This is the sum of internal renewablewater resources and external actual renewable water resources, whichtake into consideration the quantity of flow reserved to upstream anddownstream countries through formal or informal agreements or treatiesand possible reduction of external flow due to upstream water abstrac-tion. It corresponds to the maximum theoretical yearly amount of wateractually available for a country at a given moment. While natural re-sources are considered stable over time, actual resources may vary withtime and refer to a given period.
Total exploitable water resources: That part of the water resources whichis considered to be available for development, taking into considerationfactors such as: the economic and environmental feasibility of storingfloodwater behind dams or extracting groundwater, the physical possi-bility of catching water which naturally flows out to the sea, and the min-imum flow requirements for navigation, environmental services, aquaticlife, etc. It is also called water development potential. Methods to assess
08-App3_159-198 2/28/07 3:51 PM Page 195
196 Making the Most of Scarcity
exploitable water resources vary from country to country depending onthe country’s situation. In general, exploitable water resources are signif-icantly smaller than natural water resources.
Dependency ratio (%): That part of the total renewable water resourcesoriginating outside the country.
Agricultural water withdrawals: Gross amount of water extracted fromany source either permanently or temporarily for agricultural use. It canbe either diverted towards distribution networks or directly used. It in-cludes consumptive use, conveyance losses and return flow.
Domestic water withdrawals: Gross amount of water extracted from anysource either permanently or temporarily for domestic uses. It can be ei-ther diverted towards distribution networks or directly used. It includesconsumptive use, conveyance losses and return flow.
Industrial water withdrawals: Gross amount of water extracted fromany source either permanently or temporarily for industrial uses. It canbe either diverted towards distribution networks or directly used. It in-cludes consumptive use, conveyance losses and return flow.
Total water withdrawals: This is the sum of agricultural, industrial andother sectors and domestic water withdrawals less overlap if any.
Virtual water imports in crops: Virtual water imports in crops gives anindication of the quantity of water that could have been necessary forproducing the same amount of food crops which is imported in a waterscarce country.
Virtual water imports in livestock: Virtual water imports in livestockgives an indication of the quantity of water that could have been neces-sary for producing the same amount of livestock products which is im-ported in a water scarce country.
Total virtual water imports: Total virtual water imports gives an indica-tion of the quantity of water that could have been necessary for produc-ing the same amount of crops and livestock products which is importedin a water scarce country.
Supplemental (desalinated and reused): Freshwater produced by desali-nation of brackish water or saltwater and through reuse of urban or in-dustrial wastewaters (with or without treatment).
08-App3_159-198 2/28/07 3:51 PM Page 196
Appendix 3: Country Profiles 197
Water scarcity (%): The ratio of total water use to water availability.Water scarcity will generally range between zero and a hundred per cent,but can in exceptional cases (e.g. groundwater mining) be above a hun-dred per cent.
Water self-sufficiency (%): Self-sufficiency is a hundred per cent if allwater needed is available and indeed taken from within the national ter-ritory (when water dependency = 0). Water self-sufficiency approacheszero if a country relies heavily on virtual water imports.
Water dependency (%): This ratio measures the share of total renewablewater resources originating outside the country. It is the ratio of theamount of water flowing-in from neighboring countries to the sum oftotal internal renewable water resources and the amount of water flow-ing in from neighboring countries expressed as percentage.
Operating cost coverage ratio: This is the ratio of operational revenuesto operating costs for the water utility.
Nonreveue water (%): Difference between water supplied and watersold (i.e. volume of water “lost”) expressed as a percentage of net watersupplied.
Water requirement ratio: This is the ratio of the total irrigation waterrequirement for the country to the total agricultural water withdrawalsfor the country obtained from the country surveys. For a detailed de-scription of the computation of this ratio by FAO referhttp://www.fao.org/ag/agl/aglw/aquastat/water_use/index5.stm
Index of public accountability: This index measures four areas of ac-countability. First, level of openness of political institutions. Second, theextent to which free, fair and competitive political participation is exer-cised, civil liberties are assumed and respected, and press and voice freefrom control, violation, harassment and censorship. Third, the degree oftransparency and responsiveness of the government to its people.Fourth, the degree of political accountability in the public sphere. For adetailed methodology of construction of this index refer to World Bank2003a.
Index of quality of administration: This index measures the risk andlevel of corruption and black market activity, the degree and extent towhich certain rules and rights are protected and enforced (such as prop-erty rights or business regulations and procedures), quality of budgetary
08-App3_159-198 2/28/07 3:51 PM Page 197
198 Making the Most of Scarcity
process and public management, efficiency of revenue mobilization, theoverall quality of bureaucracy, and the independence of civil service frompolitical pressure. For a detailed methodology of construction of thisindex refer to World Bank 2003a.
Index of governance quality: This is a composite index constructedusing all the indicators for indices of public accountability and quality ofadministration. It thus assesses overall quality of governance givingequivalent weight to public accountability and quality of administrationin the public sector. For a detailed methodology of construction of thisindex refer to World Bank 2003a.
08-App3_159-198 2/28/07 3:51 PM Page 198

Case Studies:Mitigating Risks
and Conflict
APPENDIX 4
199
09-App4_199-206 2/28/07 3:52 PM Page 199
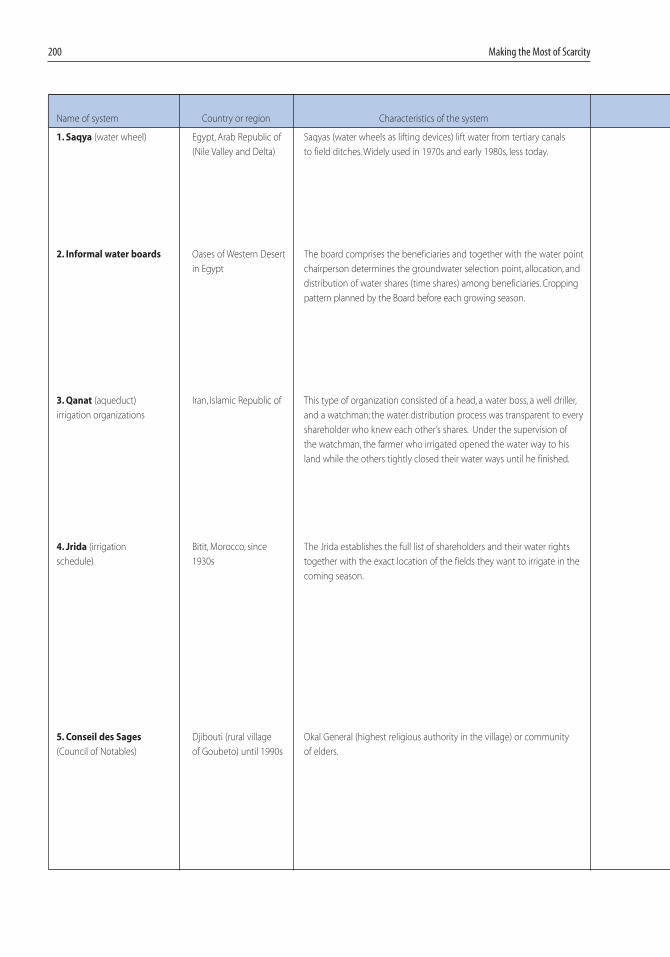
200 Making the Most of Scarcity
Name of system Country or region Characteristics of the system
1. Saqya (water wheel) Egypt, Arab Republic of Saqyas (water wheels as lifting devices) lift water from tertiary canals
(Nile Valley and Delta) to field ditches. Widely used in 1970s and early 1980s, less today.
2. Informal water boards Oases of Western Desert The board comprises the beneficiaries and together with the water point
in Egypt chairperson determines the groundwater selection point, allocation, and
distribution of water shares (time shares) among beneficiaries. Cropping
pattern planned by the Board before each growing season.
3. Qanat (aqueduct) Iran, Islamic Republic of This type of organization consisted of a head, a water boss, a well driller,
irrigation organizations and a watchman; the water distribution process was transparent to every
shareholder who knew each other’s shares. Under the supervision of
the watchman, the farmer who irrigated opened the water way to his
land while the others tightly closed their water ways until he finished.
4. Jrida (irrigation Bitit, Morocco, since The Jrida establishes the full list of shareholders and their water rights
schedule) 1930s together with the exact location of the fields they want to irrigate in the
coming season.
5. Conseil des Sages Djibouti (rural village Okal General (highest religious authority in the village) or community
(Council of Notables) of Goubeto) until 1990s of elders.
09-App4_199-206 2/28/07 3:52 PM Page 200
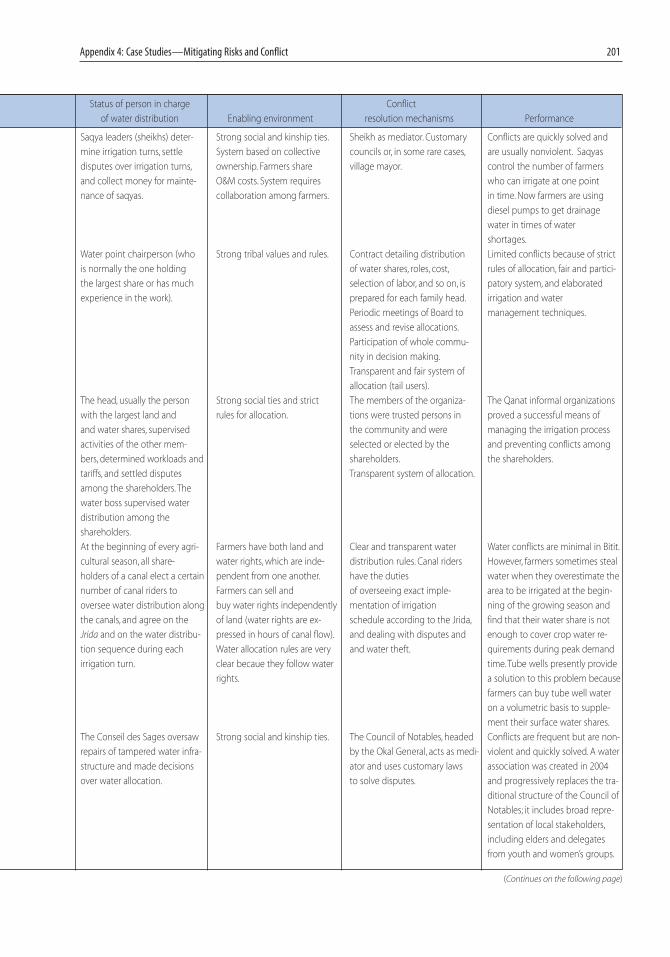
Appendix 4: Case Studies—Mitigating Risks and Conflict 201
Status of person in charge Conflict
of water distribution Enabling environment resolution mechanisms Performance
Saqya leaders (sheikhs) deter- Strong social and kinship ties. Sheikh as mediator. Customary Conflicts are quickly solved and
mine irrigation turns, settle System based on collective councils or, in some rare cases, are usually nonviolent. Saqyas
disputes over irrigation turns, ownership. Farmers share village mayor. control the number of farmers
and collect money for mainte- O&M costs. System requires who can irrigate at one point
nance of saqyas. collaboration among farmers. in time. Now farmers are using
diesel pumps to get drainage
water in times of water
shortages.
Water point chairperson (who Strong tribal values and rules. Contract detailing distribution Limited conflicts because of strict
is normally the one holding of water shares, roles, cost, rules of allocation, fair and partici-
the largest share or has much selection of labor, and so on, is patory system, and elaborated
experience in the work). prepared for each family head. irrigation and water
Periodic meetings of Board to management techniques.
assess and revise allocations.
Participation of whole commu-
nity in decision making.
Transparent and fair system of
allocation (tail users).
The head, usually the person Strong social ties and strict The members of the organiza- The Qanat informal organizations
with the largest land and rules for allocation. tions were trusted persons in proved a successful means of
and water shares, supervised the community and were managing the irrigation process
activities of the other mem- selected or elected by the and preventing conflicts among
bers, determined workloads and shareholders. the shareholders.
tariffs, and settled disputes Transparent system of allocation.
among the shareholders. The
water boss supervised water
distribution among the
shareholders.
At the beginning of every agri- Farmers have both land and Clear and transparent water Water conflicts are minimal in Bitit.
cultural season, all share- water rights, which are inde- distribution rules. Canal riders However, farmers sometimes steal
holders of a canal elect a certain pendent from one another. have the duties water when they overestimate the
number of canal riders to Farmers can sell and of overseeing exact imple- area to be irrigated at the begin-
oversee water distribution along buy water rights independently mentation of irrigation ning of the growing season and
the canals, and agree on the of land (water rights are ex- schedule according to the Jrida, find that their water share is not
Jrida and on the water distribu- pressed in hours of canal flow). and dealing with disputes and enough to cover crop water re-
tion sequence during each Water allocation rules are very and water theft. quirements during peak demand
irrigation turn. clear becaue they follow water time. Tube wells presently provide
rights. a solution to this problem because
farmers can buy tube well water
on a volumetric basis to supple-
ment their surface water shares.
The Conseil des Sages oversaw Strong social and kinship ties. The Council of Notables, headed Conflicts are frequent but are non-
repairs of tampered water infra- by the Okal General, acts as medi- violent and quickly solved. A water
structure and made decisions ator and uses customary laws association was created in 2004
over water allocation. to solve disputes. and progressively replaces the tra-
ditional structure of the Council of
Notables; it includes broad repre-
sentation of local stakeholders,
including elders and delegates
from youth and women’s groups.
(Continues on the following page)
09-App4_199-206 2/28/07 3:52 PM Page 201
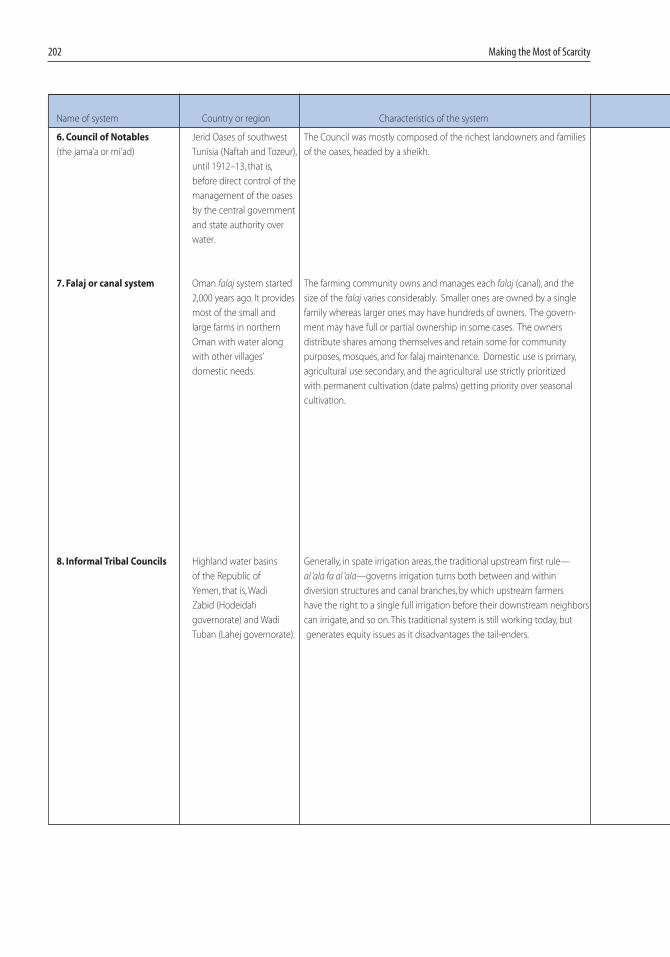
202 Making the Most of Scarcity
Name of system Country or region Characteristics of the system
6. Council of Notables Jerid Oases of southwest The Council was mostly composed of the richest landowners and families
(the jama’a or mi’ad) Tunisia (Naftah and Tozeur), of the oases, headed by a sheikh.
until 1912–13, that is,
before direct control of the
management of the oases
by the central government
and state authority over
water.
7. Falaj or canal system Oman falaj system started The farming community owns and manages each falaj (canal), and the
2,000 years ago. It provides size of the falaj varies considerably. Smaller ones are owned by a single
most of the small and family whereas larger ones may have hundreds of owners. The govern-
large farms in northern ment may have full or partial ownership in some cases. The owners
Oman with water along distribute shares among themselves and retain some for community
with other villages’ purposes, mosques, and for falaj maintenance. Domestic use is primary,
domestic needs. agricultural use secondary, and the agricultural use strictly prioritized
with permanent cultivation (date palms) getting priority over seasonal
cultivation.
8. Informal Tribal Councils Highland water basins Generally, in spate irrigation areas, the traditional upstream first rule—
of the Republic of al ‘ala fa al ‘ala—governs irrigation turns both between and within
Yemen, that is, Wadi diversion structures and canal branches, by which upstream farmers
Zabid (Hodeidah have the right to a single full irrigation before their downstream neighbors
governorate) and Wadi can irrigate, and so on. This traditional system is still working today, but
Tuban (Lahej governorate). generates equity issues as it disadvantages the tail-enders.
09-App4_199-206 2/28/07 3:52 PM Page 202
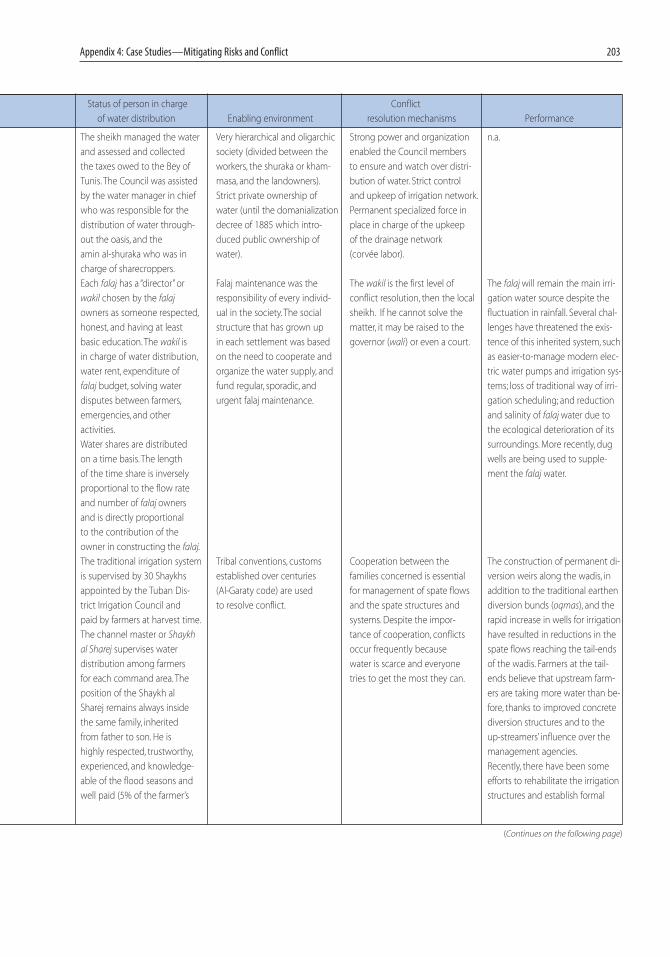
Appendix 4: Case Studies—Mitigating Risks and Conflict 203
Status of person in charge Conflict
of water distribution Enabling environment resolution mechanisms Performance
The sheikh managed the water Very hierarchical and oligarchic Strong power and organization n.a.
and assessed and collected society (divided between the enabled the Council members
the taxes owed to the Bey of workers, the shuraka or kham- to ensure and watch over distri-
Tunis. The Council was assisted masa, and the landowners). bution of water. Strict control
by the water manager in chief Strict private ownership of and upkeep of irrigation network.
who was responsible for the water (until the domanialization Permanent specialized force in
distribution of water through- decree of 1885 which intro- place in charge of the upkeep
out the oasis, and the duced public ownership of of the drainage network
amin al-shuraka who was in water). (corvée labor).
charge of sharecroppers.
Each falaj has a “director” or Falaj maintenance was the The wakil is the first level of The falaj will remain the main irri-
wakil chosen by the falaj responsibility of every individ- conflict resolution, then the local gation water source despite the
owners as someone respected, ual in the society. The social sheikh. If he cannot solve the fluctuation in rainfall. Several chal-
honest, and having at least structure that has grown up matter, it may be raised to the lenges have threatened the exis-
basic education. The wakil is in each settlement was based governor (wali) or even a court. tence of this inherited system, such
in charge of water distribution, on the need to cooperate and as easier-to-manage modern elec-
water rent, expenditure of organize the water supply, and tric water pumps and irrigation sys-
falaj budget, solving water fund regular, sporadic, and tems; loss of traditional way of irri-
disputes between farmers, urgent falaj maintenance. gation scheduling; and reduction
emergencies, and other and salinity of falaj water due to
activities. the ecological deterioration of its
Water shares are distributed surroundings. More recently, dug
on a time basis. The length wells are being used to supple-
of the time share is inversely ment the falaj water.
proportional to the flow rate
and number of falaj owners
and is directly proportional
to the contribution of the
owner in constructing the falaj.
The traditional irrigation system Tribal conventions, customs Cooperation between the The construction of permanent di-
is supervised by 30 Shaykhs established over centuries families concerned is essential version weirs along the wadis, in
appointed by the Tuban Dis- (Al-Garaty code) are used for management of spate flows addition to the traditional earthen
trict Irrigation Council and to resolve conflict. and the spate structures and diversion bunds (oqmas), and the
paid by farmers at harvest time. systems. Despite the impor- rapid increase in wells for irrigation
The channel master or Shaykh tance of cooperation, conflicts have resulted in reductions in the
al Sharej supervises water occur frequently because spate flows reaching the tail-ends
distribution among farmers water is scarce and everyone of the wadis. Farmers at the tail-
for each command area. The tries to get the most they can. ends believe that upstream farm-
position of the Shaykh al ers are taking more water than be-
Sharej remains always inside fore, thanks to improved concrete
the same family, inherited diversion structures and to the
from father to son. He is up-streamers’ influence over the
highly respected, trustworthy, management agencies.
experienced, and knowledge- Recently, there have been some
able of the flood seasons and efforts to rehabilitate the irrigation
well paid (5% of the farmer’s structures and establish formal
(Continues on the following page)
09-App4_199-206 2/28/07 3:52 PM Page 203

204 Making the Most of Scarcity
Name of system Country or region Characteristics of the system
Sources: Bahamish 2004; CEDARE, 2006; CENESTA n.d.; Wolf 2002.
Note: n.a. = Not applicable.
09-App4_199-206 2/28/07 3:52 PM Page 204
Appendix 4: Case Studies—Mitigating Risks and Conflict 205
Status of person in charge of water distribution Enabling environment Conflict resolution mechanisms Performance
crop). He safeguards the full Water User Associations as a mod-
share of water from the chan- ern and more organized method
nels under his control; appor- for spate management in Wadi
tions water fairly between Tuban.
secondary cahnnels according
to the customarily agreed
allocation of water; settles
water disputes between
farmers in the channels under
his control. He gathers and
organizes farmers to build
earth dikes and calculates
the costs and charges for
each farmer proportionally
to his irrigated area and finally
collects fees.
09-App4_199-206 2/28/07 3:52 PM Page 205

09-App4_199-206 2/28/07 3:52 PM Page 206
Recommended