Use and Application of Organophilic Clay Materials for Adsorption of Petroleum and to Address Pipeline and Storage Facility Related Water Issues
* Unique stone-core design
November 2016
Water Issues
Objectives
Presentation Outline
� Problem Statement – Pathways� Problem Statement – Pathways� Introduction to AquaBlok / AquaGate� Overview of Various Applications� Summary/Questions/Discussion
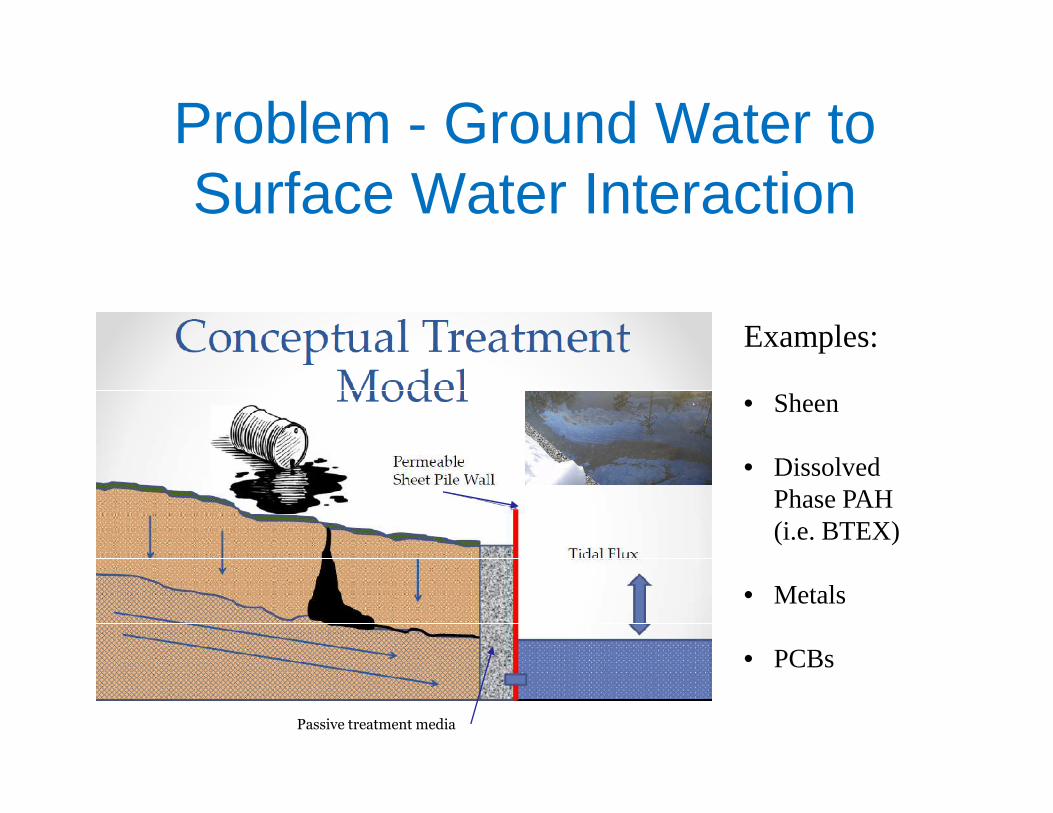
Problem - Ground Water to Surface Water Interaction
Examples:
• Sheen• Sheen
• Dissolved Phase PAH (i.e. BTEX)
• Metals
• PCBs
Passive treatment media
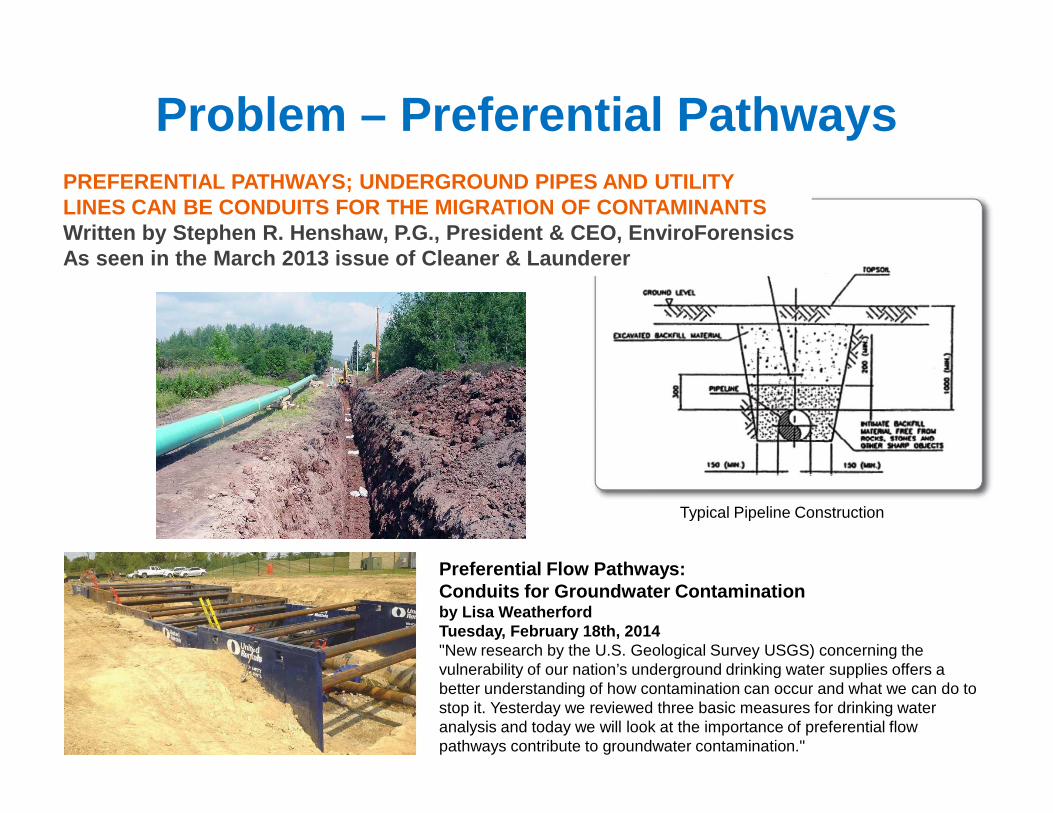
Problem – Preferential PathwaysPREFERENTIAL PATHWAYS; UNDERGROUND PIPES AND UTILIT Y LINES CAN BE CONDUITS FOR THE MIGRATION OF CONTAMIN ANTSWritten by Stephen R. Henshaw, P.G., President & CE O, EnviroForensicsAs seen in the March 2013 issue of Cleaner & Launde rer
Preferential Flow Pathways: Conduits for Groundwater Contamination by Lisa WeatherfordTuesday, February 18th, 2014"New research by the U.S. Geological Survey USGS) concerning the vulnerability of our nation’s underground drinking water supplies offers a better understanding of how contamination can occur and what we can do to stop it. Yesterday we reviewed three basic measures for drinking water analysis and today we will look at the importance of preferential flow pathways contribute to groundwater contamination."
Typical Pipeline Construction
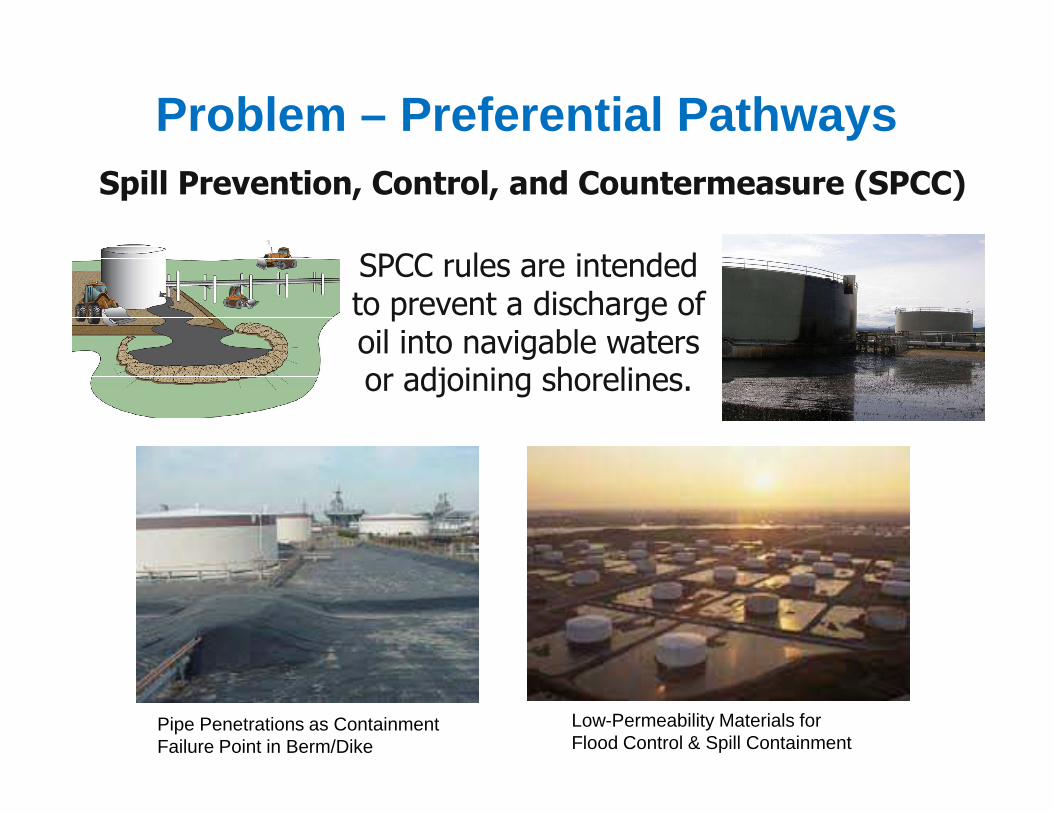
Problem – Preferential Pathways
SPCC rules are intended to prevent a discharge of oil into navigable waters or adjoining shorelines.
Spill Prevention, Control, and Countermeasure (SPCC)
Pipe Penetrations as Containment Failure Point in Berm/Dike
Low-Permeability Materials for Flood Control & Spill Containment
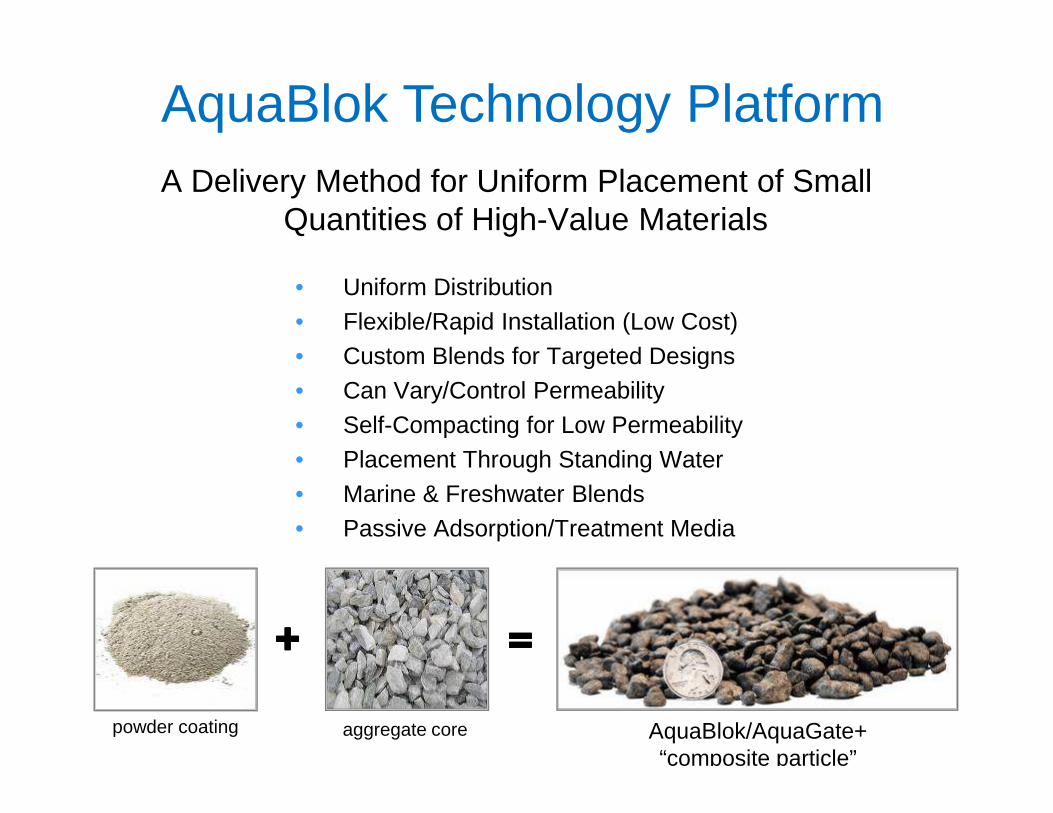
AquaBlok Technology PlatformA Delivery Method for Uniform Placement of Small
Quantities of High-Value Materials
• Uniform Distribution• Flexible/Rapid Installation (Low Cost)• Custom Blends for Targeted Designs • Can Vary/Control Permeability
powder coating AquaBlok/AquaGate+ “composite particle”
++++
aggregate core
====
• Self-Compacting for Low Permeability• Placement Through Standing Water • Marine & Freshwater Blends• Passive Adsorption/Treatment Media
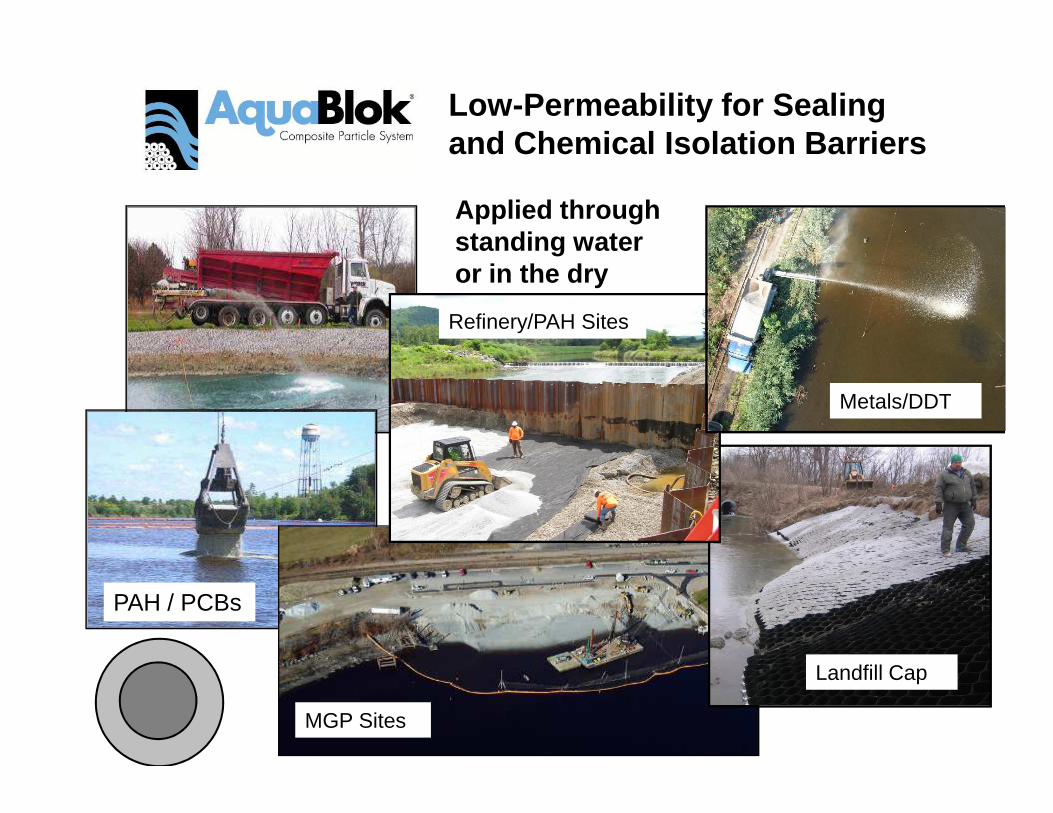
Low -Permeability for Sealing and Chemical Isolation Barriers
Applied throughstanding wateror in the dry
Refinery/PAH Sites
Metals/DDT
MGP Sites
PAH / PCBs
Landfill Cap
Metals/DDT
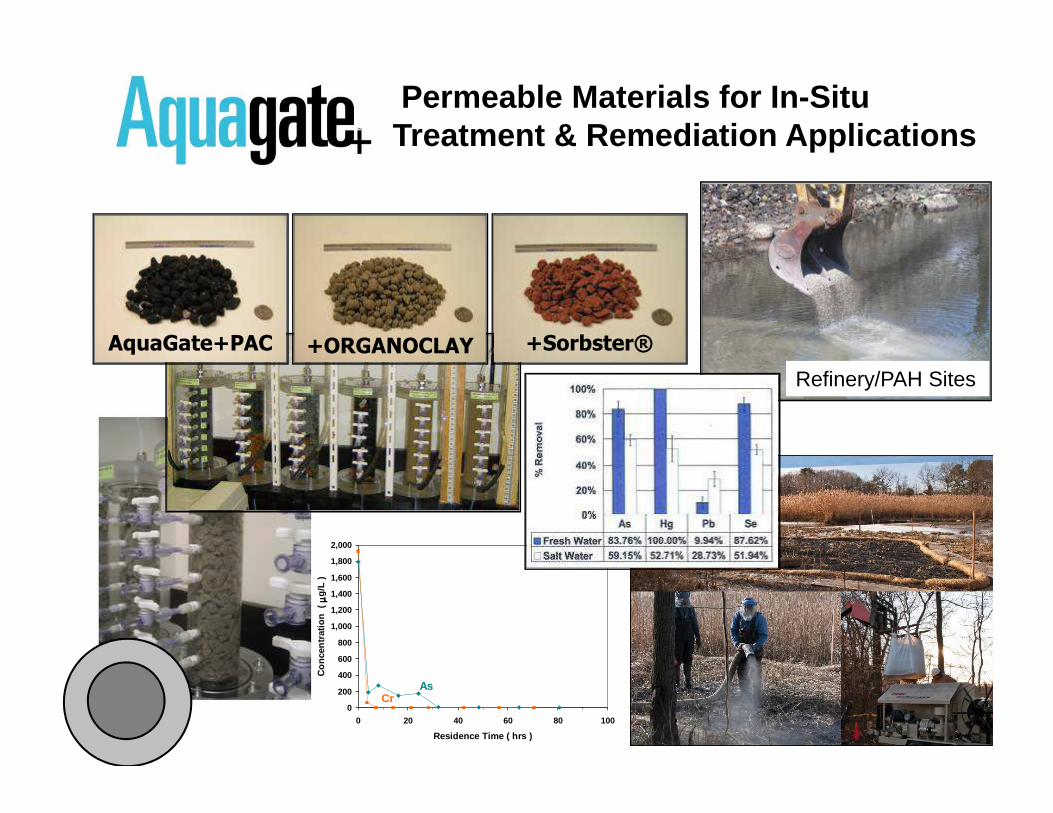
Permeable Materials for In-Situ Treatment & Remediation Applications
+Sorbster®+ORGANOCLAY AquaGate+PAC
Refinery/PAH Sites
0
200
400
600
800
1,000
1,200
1,400
1,600
1,800
2,000
0 20 40 60 80 100
Residence Time ( hrs )
Con
cent
ratio
n (
µµ µµ
g/L
)
AsCr
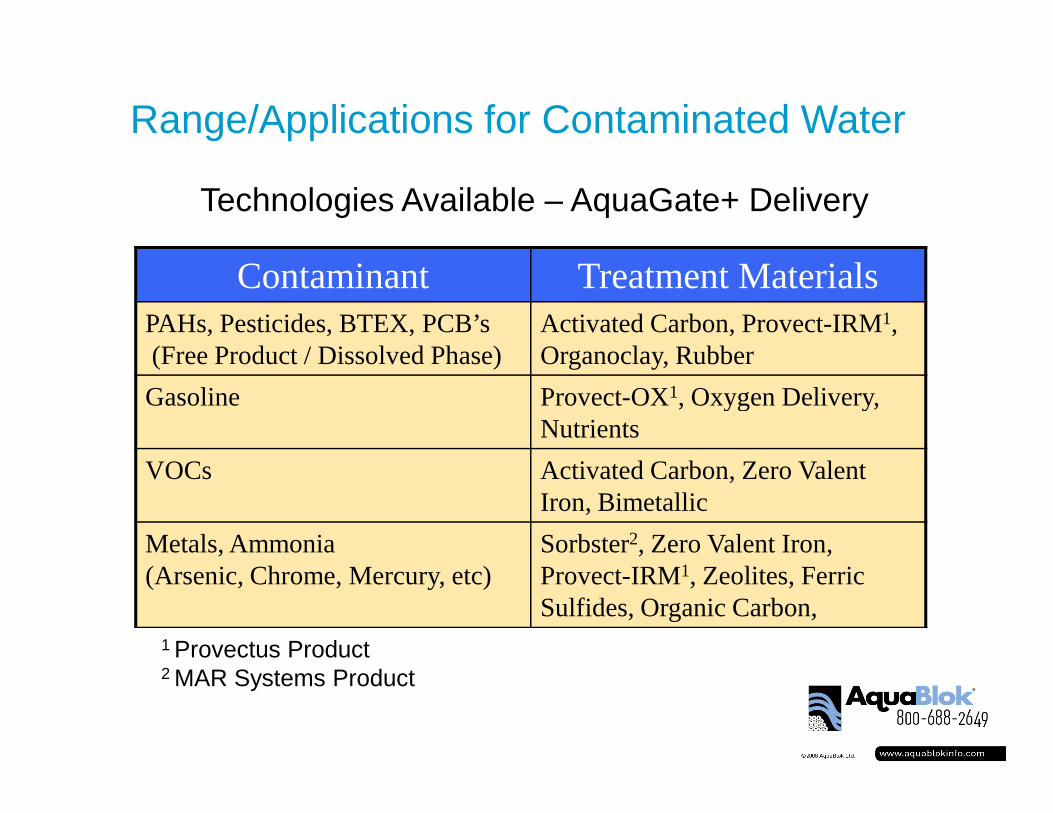
Range/Applications for Contaminated Water
Technologies Available – AquaGate+ Delivery
Contaminant Treatment MaterialsPAHs, Pesticides, BTEX, PCB’s(Free Product / Dissolved Phase)
Activated Carbon, Provect-IRM1, Organoclay, Rubber
Gasoline Provect-OX1, Oxygen Delivery,
9
Gasoline Provect-OX , Oxygen Delivery, Nutrients
VOCs Activated Carbon, Zero Valent Iron, Bimetallic
Metals, Ammonia(Arsenic, Chrome, Mercury, etc)
Sorbster2, Zero Valent Iron, Provect-IRM1, Zeolites, Ferric Sulfides, Organic Carbon,
1 Provectus Product2 MAR Systems Product
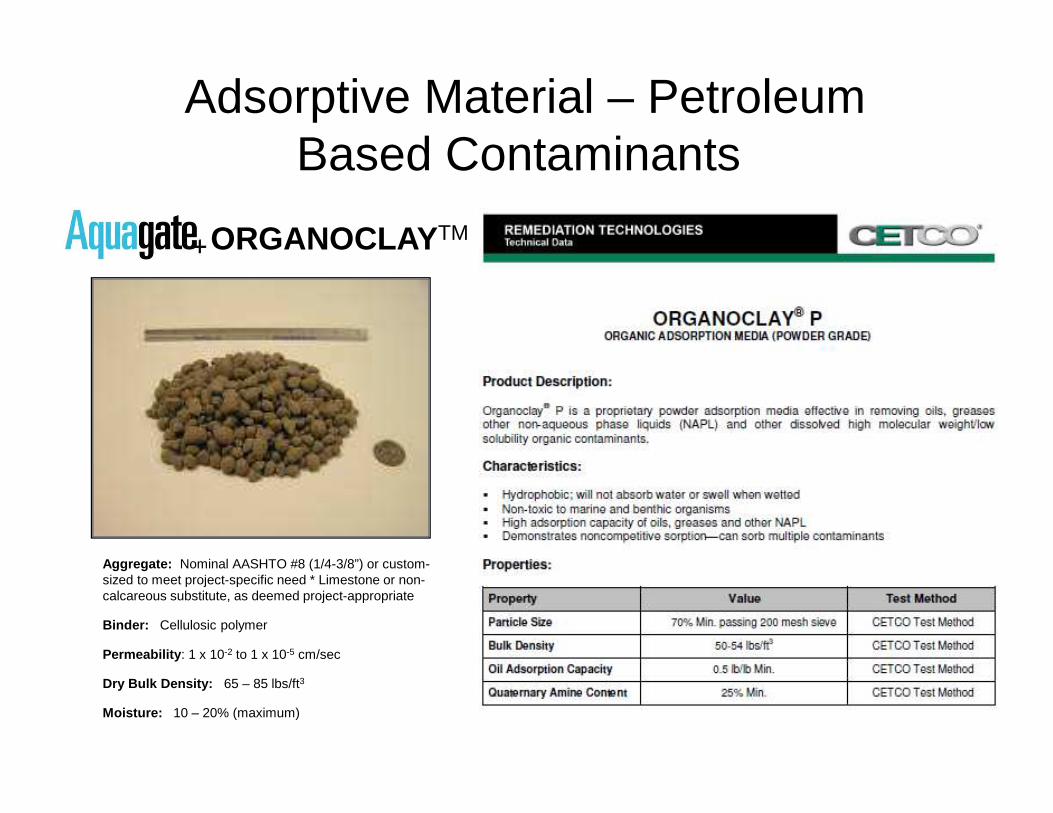
Adsorptive Material – Petroleum Based Contaminants
ORGANOCLAY TM
Aggregate: Nominal AASHTO #8 (1/4-3/8”) or custom-sized to meet project-specific need * Limestone or non-calcareous substitute, as deemed project-appropriate
Binder: Cellulosic polymer
Permeability : 1 x 10⁻² to 1 x 10⁻⁵ cm/sec
Dry Bulk Density: 65 – 85 lbs/ft3
Moisture: 10 – 20% (maximum)
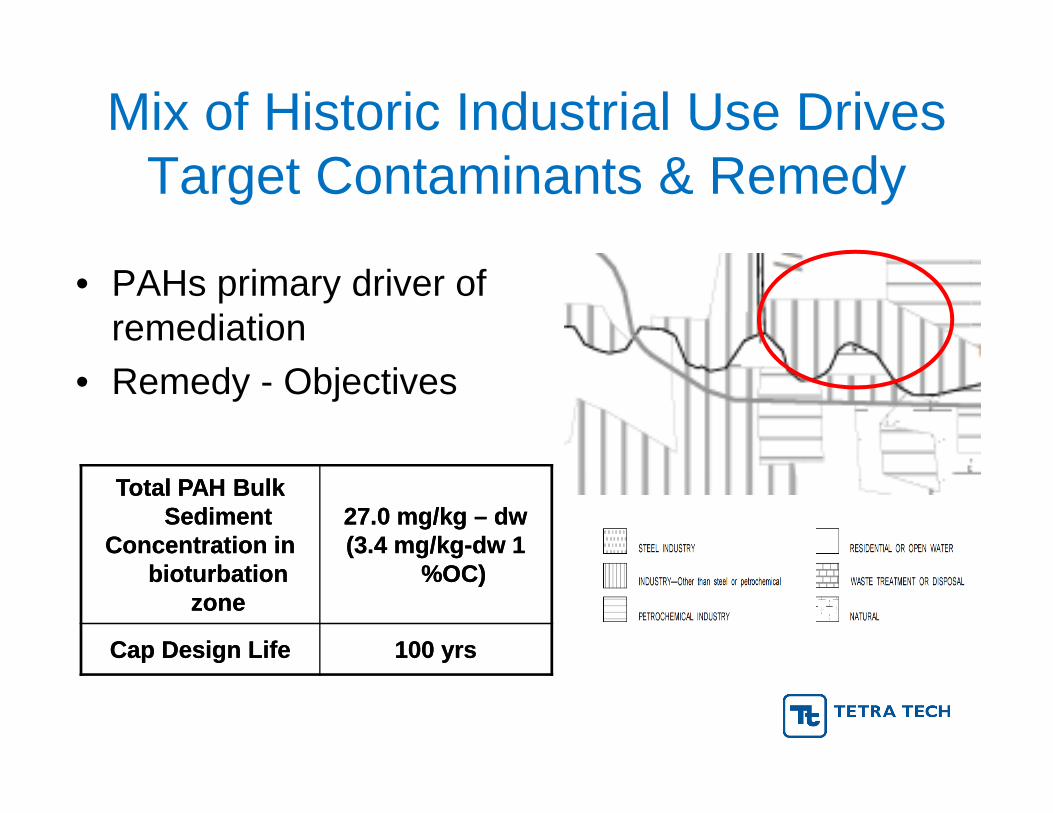
Mix of Historic Industrial Use Drives Target Contaminants & Remedy
• PAHs primary driver of remediation
• Remedy - Objectives
Total PAH Bulk Total PAH Bulk SedimentSediment
Concentration in Concentration in bioturbationbioturbation
zonezone
27.0 mg/kg 27.0 mg/kg –– dwdw(3.4 mg/kg(3.4 mg/kg--dwdw 1 1
%OC)%OC)
Cap Design LifeCap Design Life 100 100 yrsyrs
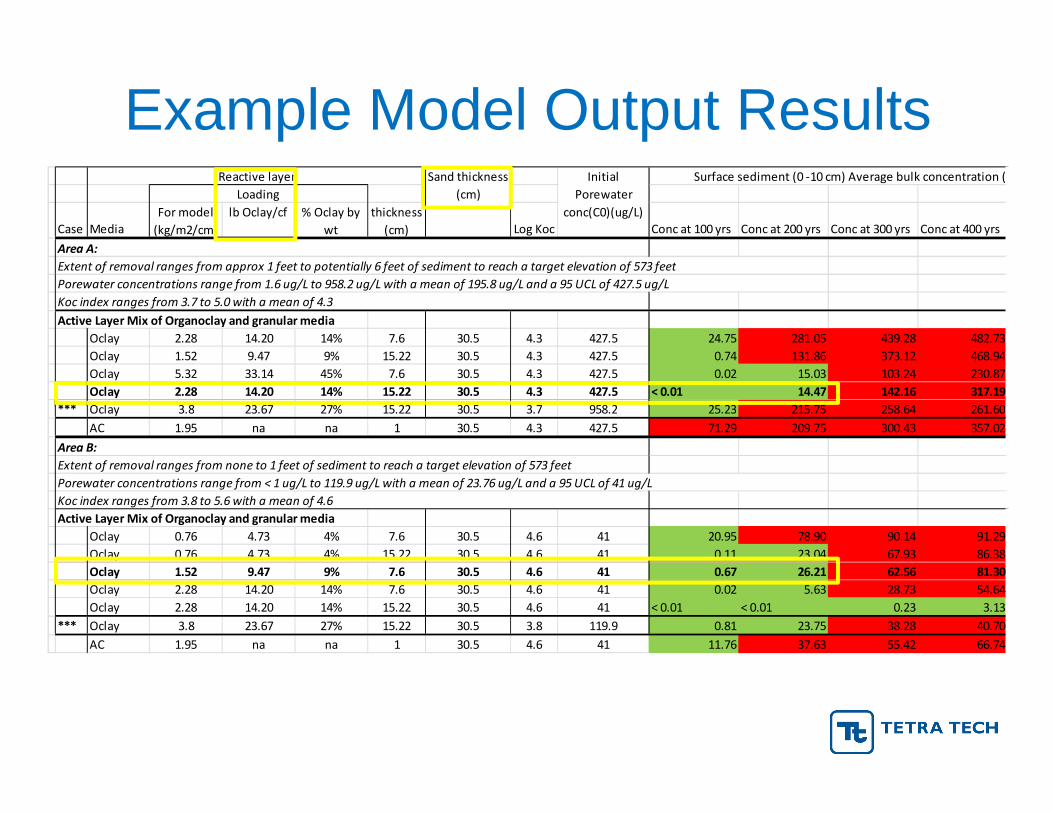
Example Model Output Results
Case Media
For model
(kg/m2/cm)
lb Oclay/cf % Oclay by
wt
thickness
(cm) Log Koc Conc at 100 yrs Conc at 200 yrs Conc at 300 yrs Conc at 400 yrs
Active Layer Mix of Organoclay and granular media
Oclay 2.28 14.20 14% 7.6 30.5 4.3 427.5 24.75 281.05 439.28 482.73
Oclay 1.52 9.47 9% 15.22 30.5 4.3 427.5 0.74 131.86 373.12 468.94
Oclay 5.32 33.14 45% 7.6 30.5 4.3 427.5 0.02 15.03 103.24 230.87
Oclay 2.28 14.20 14% 15.22 30.5 4.3 427.5 < 0.01 14.47 142.16 317.19
*** Oclay 3.8 23.67 27% 15.22 30.5 3.7 958.2 25.23 215.75 258.64 261.60
Area A:
Koc index ranges from 3.7 to 5.0 with a mean of 4.3
Extent of removal ranges from approx 1 feet to potentially 6 feet of sediment to reach a target elevation of 573 feet
Porewater concentrations range from 1.6 ug/L to 958.2 ug/L with a mean of 195.8 ug/L and a 95 UCL of 427.5 ug/L
Reactive layer Sand thickness
(cm)
Initial
Porewater
conc(C0)(ug/L)
Surface sediment (0 -10 cm) Average bulk concentration (mg/Kg)*
Loading
*** Oclay 3.8 23.67 27% 15.22 30.5 3.7 958.2 25.23 215.75 258.64 261.60
AC 1.95 na na 1 30.5 4.3 427.5 71.29 209.75 300.43 357.02
Active Layer Mix of Organoclay and granular media
Oclay 0.76 4.73 4% 7.6 30.5 4.6 41 20.95 78.90 90.14 91.29
Oclay 0.76 4.73 4% 15.22 30.5 4.6 41 0.11 23.04 67.93 86.38
Oclay 1.52 9.47 9% 7.6 30.5 4.6 41 0.67 26.21 62.56 81.30
Oclay 2.28 14.20 14% 7.6 30.5 4.6 41 0.02 5.63 28.73 54.64
Oclay 2.28 14.20 14% 15.22 30.5 4.6 41 < 0.01 < 0.01 0.23 3.13
*** Oclay 3.8 23.67 27% 15.22 30.5 3.8 119.9 0.81 23.75 38.28 40.70
AC 1.95 na na 1 30.5 4.6 41 11.76 37.63 55.42 66.74
Area B:
Extent of removal ranges from none to 1 feet of sediment to reach a target elevation of 573 feet
Koc index ranges from 3.8 to 5.6 with a mean of 4.6
Porewater concentrations range from < 1 ug/L to 119.9 ug/L with a mean of 23.76 ug/L and a 95 UCL of 41 ug/L
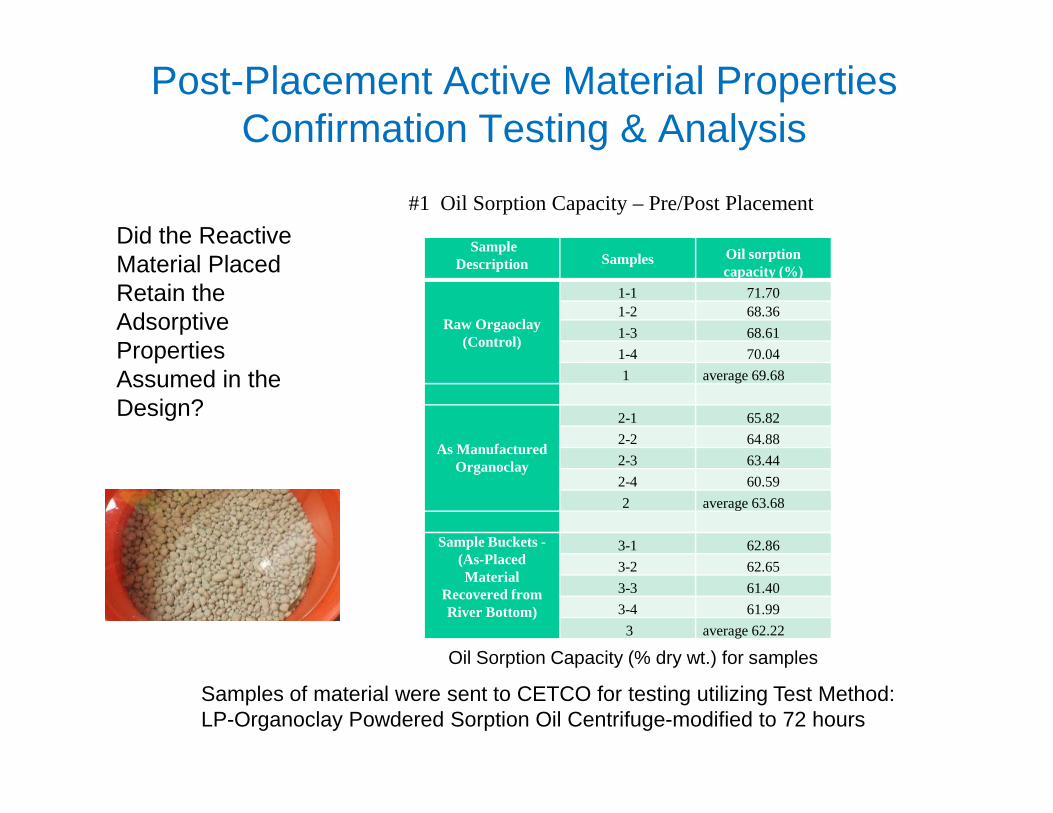
Post-Placement Active Material Properties Confirmation Testing & Analysis
Did the Reactive Material Placed Retain the Adsorptive Properties Assumed in the Design?
#1 Oil Sorption Capacity – Pre/Post Placement
Sample Description Samples Oil sorption
capacity (%)
Raw Orgaoclay (Control)
1-1 71.701-2 68.36
1-3 68.61
1-4 70.04
1 average 69.68
Samples of material were sent to CETCO for testing utilizing Test Method: LP-Organoclay Powdered Sorption Oil Centrifuge-modified to 72 hours
Design?
As Manufactured Organoclay
2-1 65.82
2-2 64.88
2-3 63.44
2-4 60.59
2 average 63.68
Sample Buckets -(As-Placed Material
Recovered from River Bottom)
3-1 62.86
3-2 62.65
3-3 61.40
3-4 61.99
3 average 62.22
Oil Sorption Capacity (% dry wt.) for samples
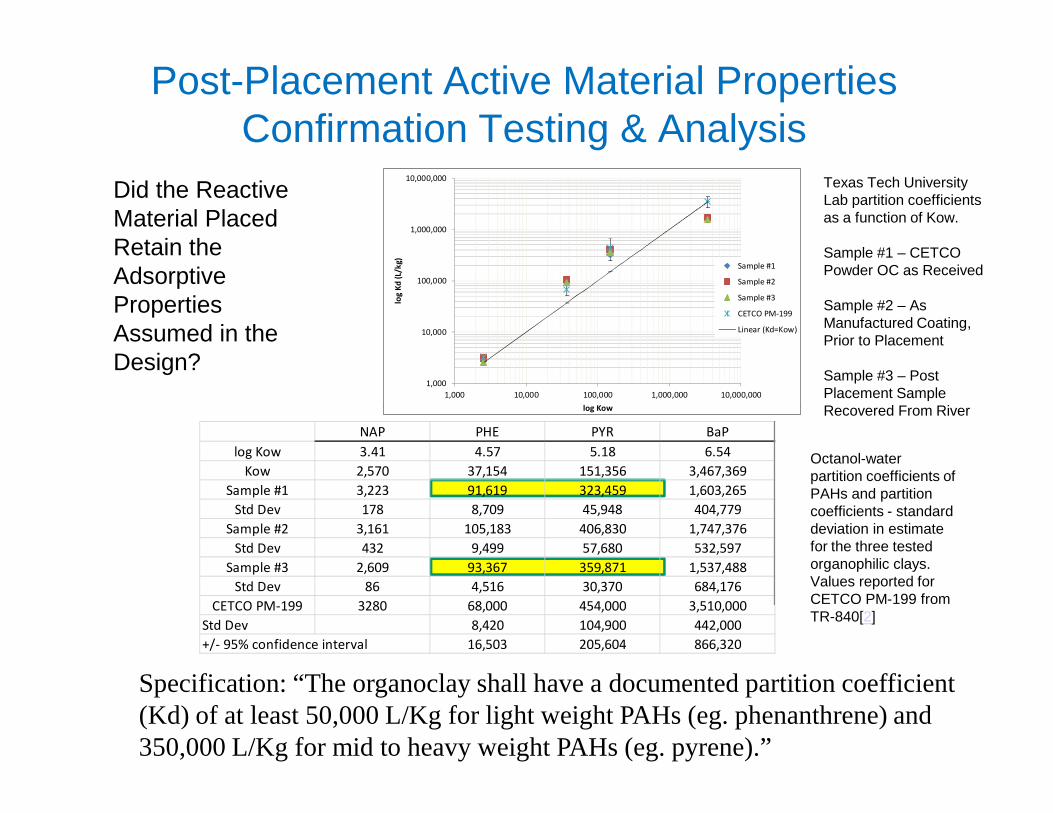
Post-Placement Active Material Properties Confirmation Testing & Analysis
1,000
10,000
100,000
1,000,000
10,000,000
1,000 10,000 100,000 1,000,000 10,000,000lo
g K
d (
L/k
g)log Kow
Sample #1
Sample #2
Sample #3
CETCO PM-199
Linear (Kd=Kow)
Texas Tech University Lab partition coefficients as a function of Kow.
Sample #1 – CETCO Powder OC as Received
Sample #2 – As Manufactured Coating, Prior to Placement
Sample #3 – Post Placement Sample Recovered From River
Did the Reactive Material Placed Retain the Adsorptive Properties Assumed in the Design?
log Kow Recovered From River
Specification: “The organoclay shall have a documented partition coefficient (Kd) of at least 50,000 L/Kg for light weight PAHs (eg. phenanthrene) and 350,000 L/Kg for mid to heavy weight PAHs (eg. pyrene).”
Octanol-water partition coefficients of PAHs and partition coefficients - standard deviation in estimate for the three tested organophilic clays. Values reported for CETCO PM-199 from TR-840[2]
NAP PHE PYR BaP
log Kow 3.41 4.57 5.18 6.54
Kow 2,570 37,154 151,356 3,467,369
Sample #1 3,223 91,619 323,459 1,603,265
Std Dev 178 8,709 45,948 404,779
Sample #2 3,161 105,183 406,830 1,747,376
Std Dev 432 9,499 57,680 532,597
Sample #3 2,609 93,367 359,871 1,537,488
Std Dev 86 4,516 30,370 684,176
CETCO PM-199 3280 68,000 454,000 3,510,000
Std Dev 8,420 104,900 442,000
+/- 95% confidence interval 16,503 205,604 866,320
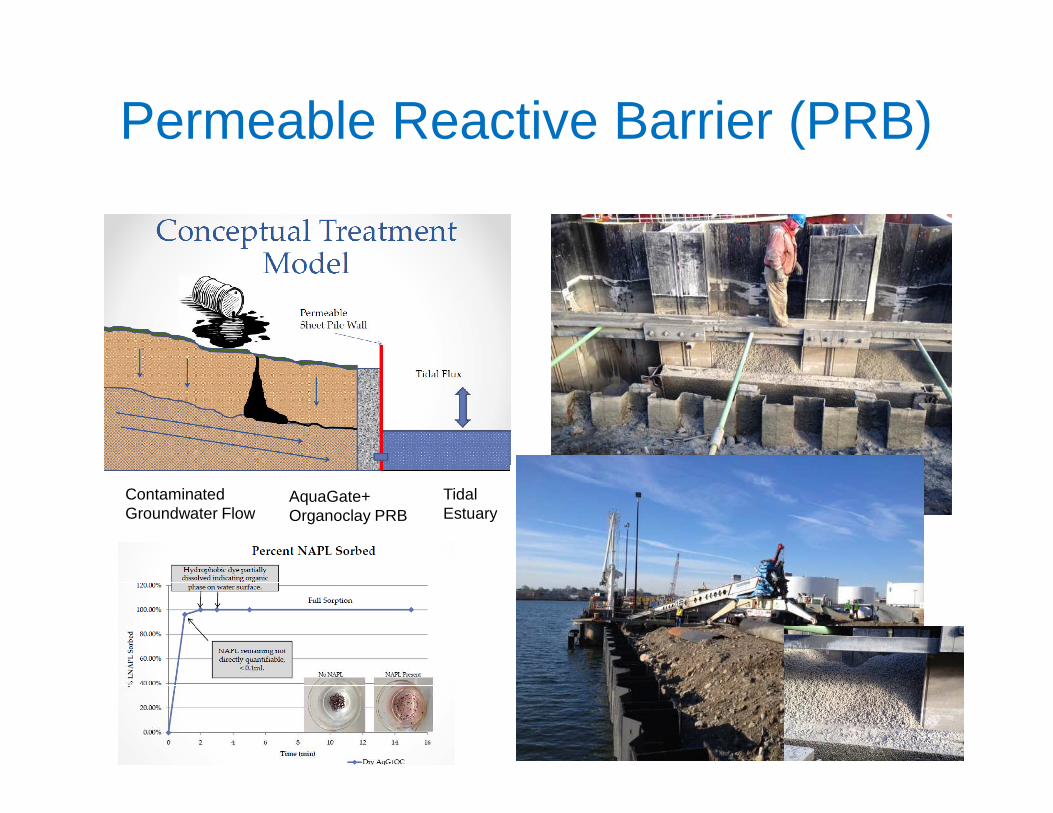
Permeable Reactive Barrier (PRB)
Contaminated Groundwater Flow
AquaGate+Organoclay PRB
Tidal Estuary
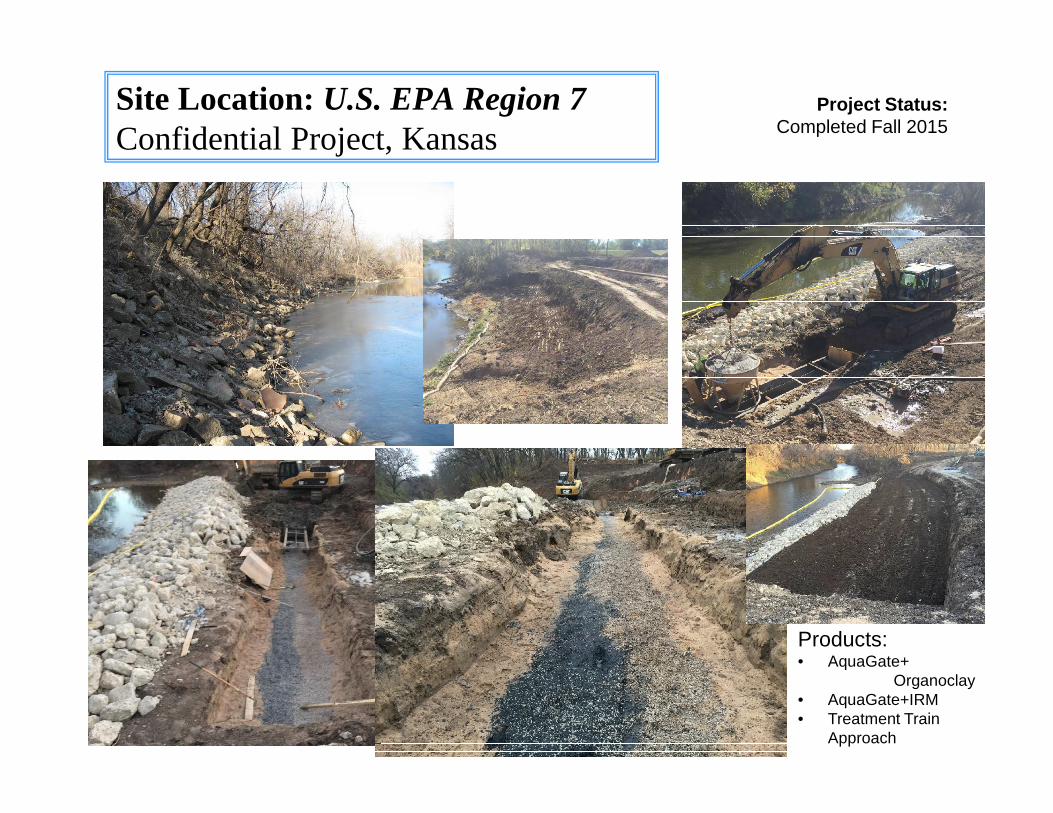
Site Location: U.S. EPA Region 7Confidential Project, Kansas
Project Status:Completed Fall 2015
Products:• AquaGate+
Organoclay• AquaGate+IRM• Treatment Train
Approach
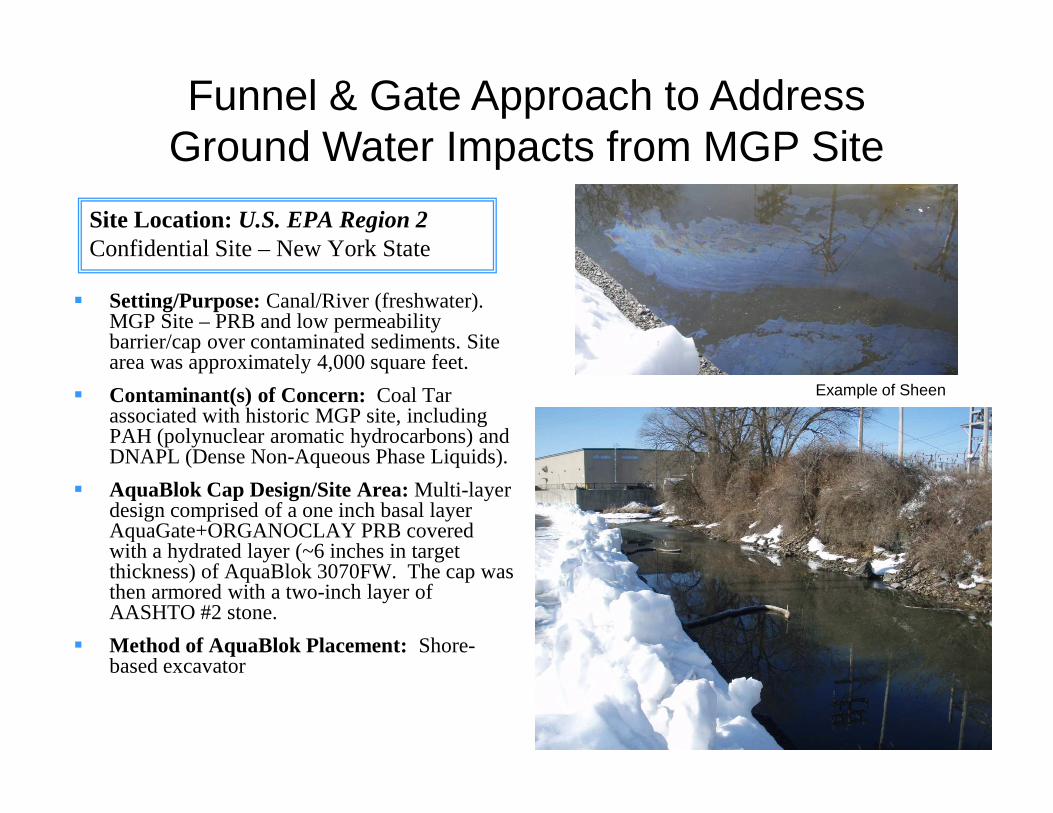
Site Location: U.S. EPA Region 2Confidential Site – New York State
� Setting/Purpose: Canal/River (freshwater). MGP Site – PRB and low permeability barrier/cap over contaminated sediments. Site area was approximately 4,000 square feet.
� Contaminant(s) of Concern: Coal Tar associated with historic MGP site, including
Funnel & Gate Approach to Address Ground Water Impacts from MGP Site
Example of Sheen
17
associated with historic MGP site, including PAH (polynuclear aromatic hydrocarbons) and DNAPL (Dense Non-Aqueous Phase Liquids).
� AquaBlok Cap Design/Site Area: Multi-layer design comprised of a one inch basal layer AquaGate+ORGANOCLAY PRB covered with a hydrated layer (~6 inches in target thickness) of AquaBlok 3070FW. The cap was then armored with a two-inch layer of AASHTO #2 stone.
� Method of AquaBlok Placement: Shore-based excavator
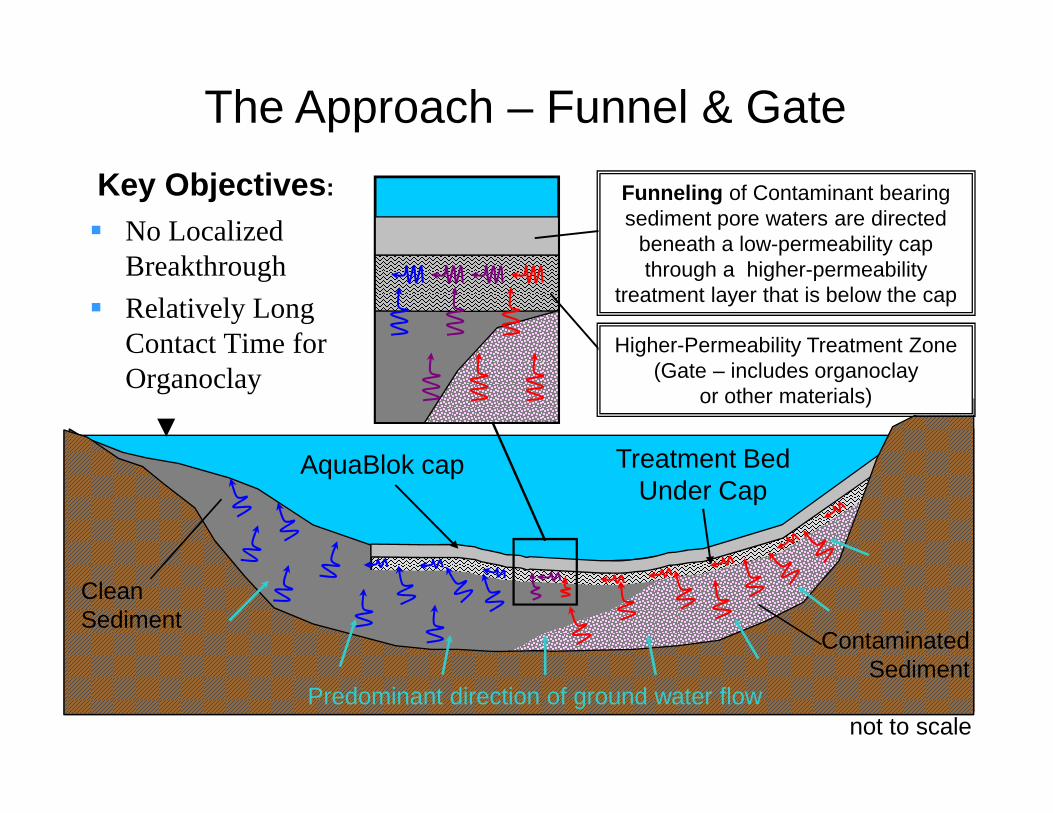
� No Localized Breakthrough
� Relatively Long Contact Time for Organoclay
Higher-Permeability Treatment Zone(Gate – includes organoclay
or other materials)
Funneling of Contaminant bearing sediment pore waters are directed
beneath a low-permeability cap through a higher-permeability
treatment layer that is below the cap
The Approach – Funnel & Gate
Key Objectives :
not to scalePredominant direction of ground water flow
AquaBlok cap Treatment Bed Under Cap
CleanSediment
ContaminatedSediment
or other materials)
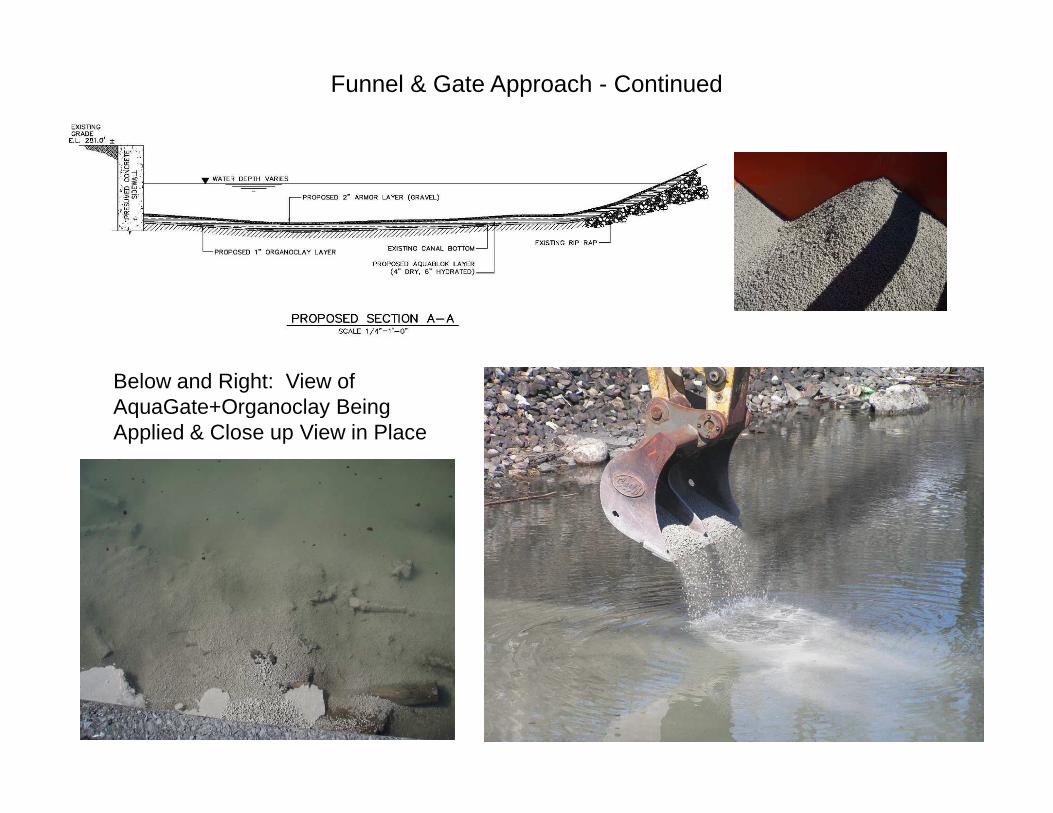
Funnel & Gate Approach - Continued
Below and Right: View of AquaGate+Organoclay Being
19
AquaGate+Organoclay Being Applied & Close up View in Place
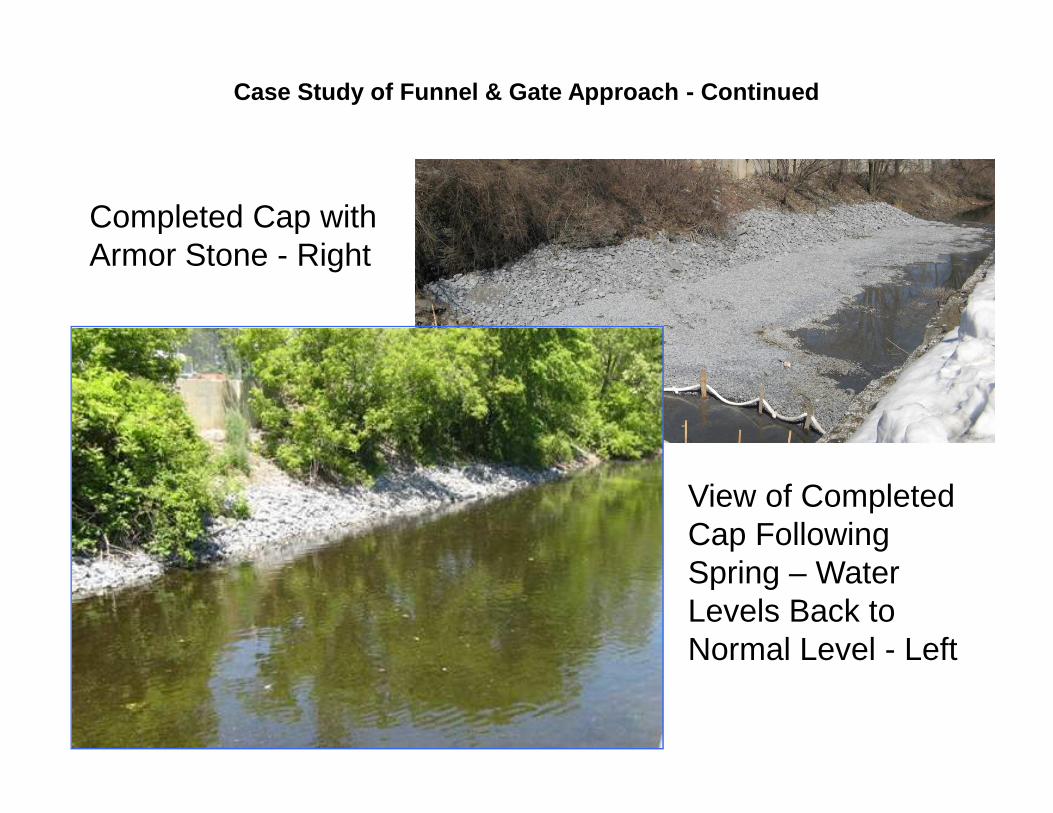
Case Study of Funnel & Gate Approach - Continued
Completed Cap with Armor Stone - Right
20
View of Completed Cap Following Spring – Water Levels Back to Normal Level - Left

Trench DamsPipeline & Utility -related Applications
L
W
Application Examples
Trench Dams/Anti-Seep Collars
beddingAquaBlok
L
H
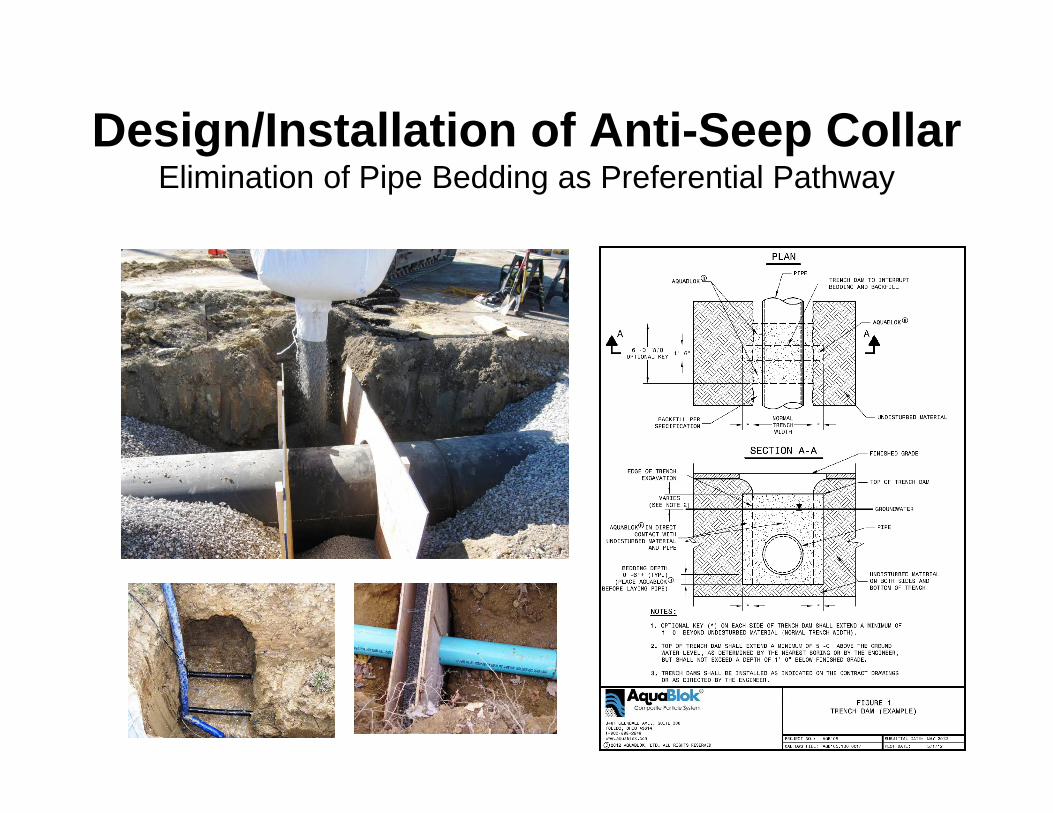
Design/Installation of Anti-Seep Collar Elimination of Pipe Bedding as Preferential Pathway
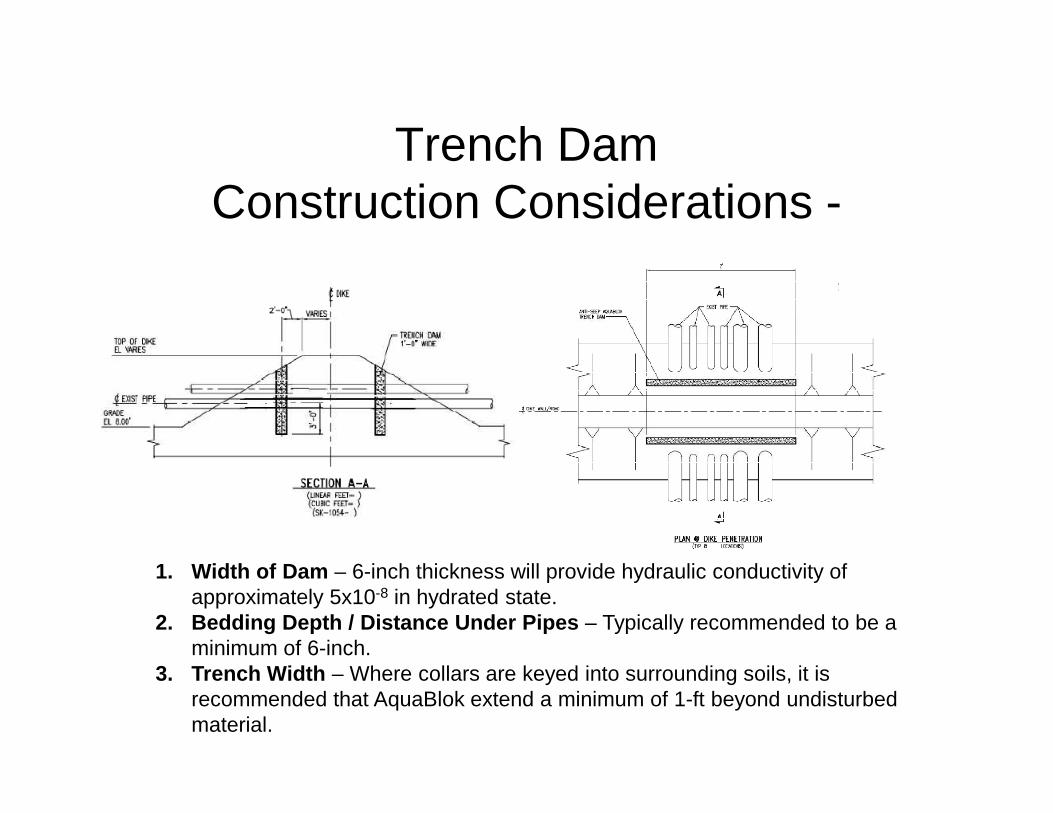
Trench Dam Construction Considerations -
1. Width of Dam – 6-inch thickness will provide hydraulic conductivity of approximately 5x10⁻⁸ in hydrated state.
2. Bedding Depth / Distance Under Pipes – Typically recommended to be a minimum of 6-inch.
3. Trench Width – Where collars are keyed into surrounding soils, it is recommended that AquaBlok extend a minimum of 1-ft beyond undisturbed material.
Application Examples
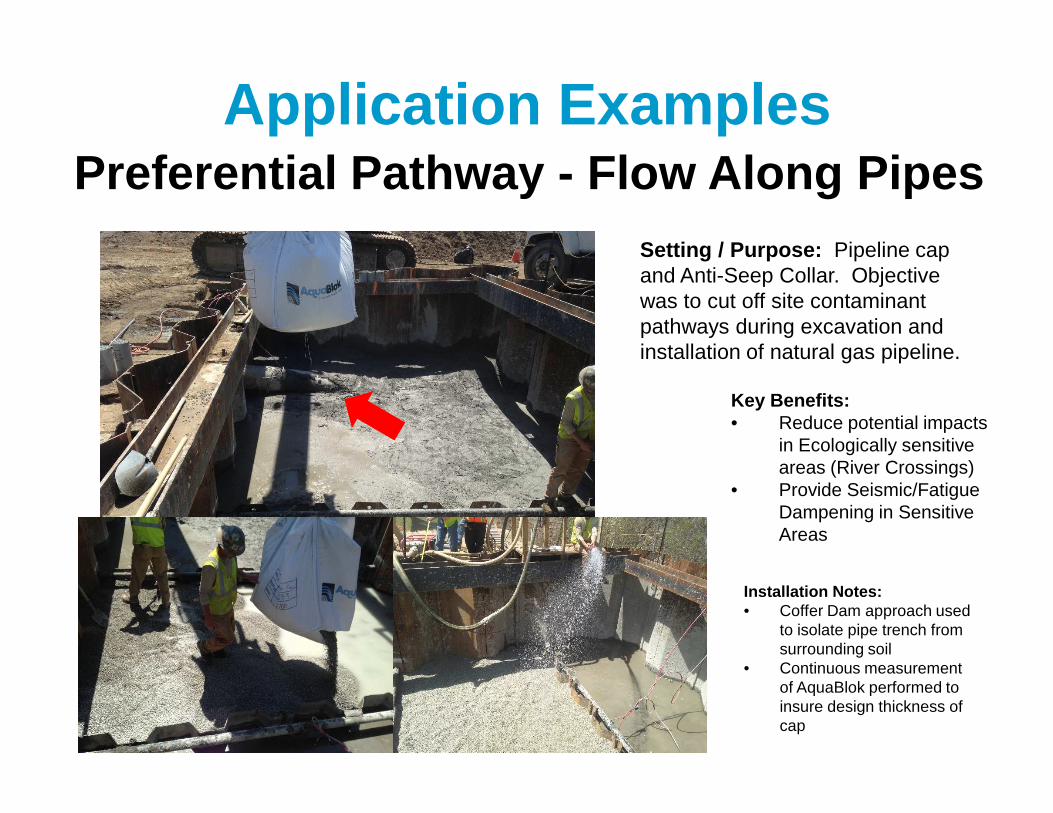
Setting / Purpose: Pipeline cap and Anti-Seep Collar. Objective was to cut off site contaminant pathways during excavation and installation of natural gas pipeline.
Preferential Pathway - Flow Along Pipes
Key Benefits:
Installation Notes: • Coffer Dam approach used
to isolate pipe trench from surrounding soil
• Continuous measurement of AquaBlok performed to insure design thickness of cap
Key Benefits: • Reduce potential impacts
in Ecologically sensitive areas (River Crossings)
• Provide Seismic/Fatigue Dampening in Sensitive Areas
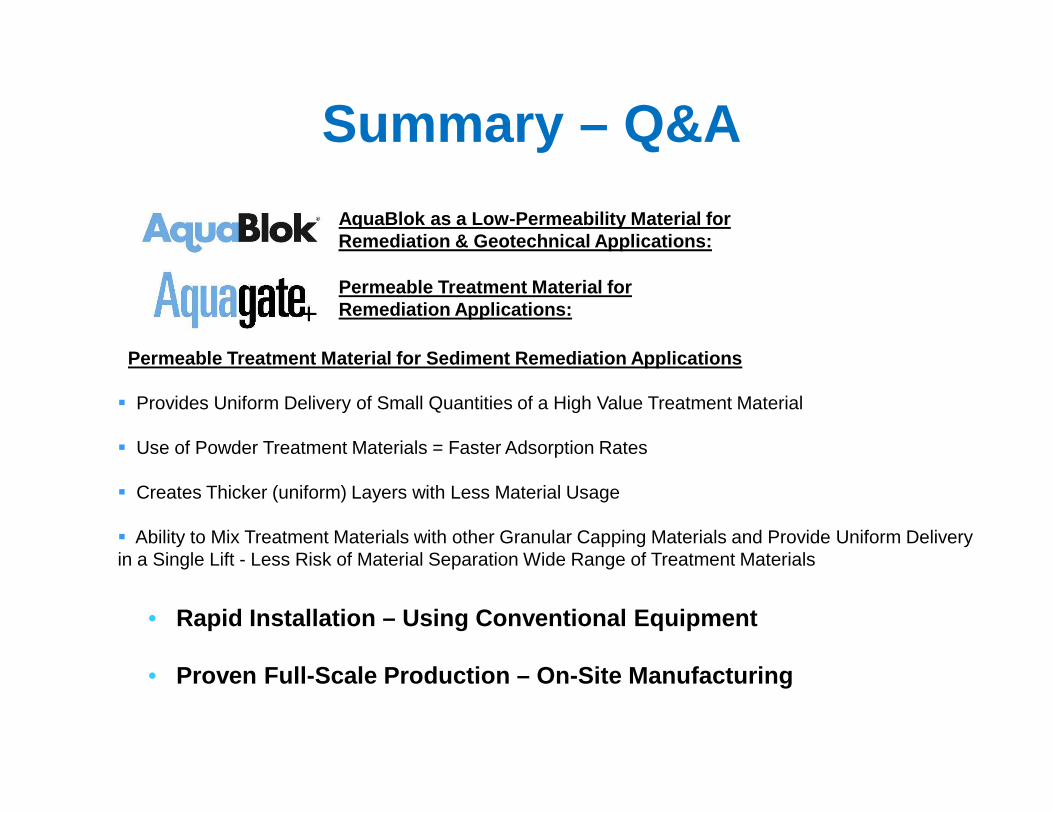
Summary – Q&A
AquaBlok as a Low-Permeability Material for Remediation & Geotechnical Applications:
Permeable Treatment Material for Remediation Applications:
Permeable Treatment Material for Sediment Remediati on Applications
� Provides Uniform Delivery of Small Quantities of a High Value Treatment Material � Provides Uniform Delivery of Small Quantities of a High Value Treatment Material
� Use of Powder Treatment Materials = Faster Adsorption Rates
� Creates Thicker (uniform) Layers with Less Material Usage
� Ability to Mix Treatment Materials with other Granular Capping Materials and Provide Uniform Delivery in a Single Lift - Less Risk of Material Separation Wide Range of Treatment Materials
• Rapid Installation – Using Conventional Equipment
• Proven Full-Scale Production – On-Site Manufacturing
Recommended