----- -I
I
IT
by
Chingmiin Chern
andAlexis Ostapen ko
October 1970--
Unsymmetrical Plate Girders
U I
Fritz Engineering Laboratory Report No. 328.9
L HIG
UNSYMMETRICAL
PLATE GIRDERSUNDER SHEAR AND MOMENT
Unsymmetrical Plate Girders
UNSYMMETRICAL PLATE GIRDERS UNDER SHEAR AND MOMENT
by
Chingmiin Chern
and
Alexis Ostapenko
This work was conducted as part of the projectUnsymmetrical Plate Girders, sponsored by the AmericanIron and Steel Institute, the Pennsylvania Departmentof Transportation, the Federal Highway Administrationof the U.S. Department of Transportation, and theWelding Research Council. The findings and conclusionsexpressed in this report are those of the authors, andnot necessarily those of the sponsors.
Department of Civil EngineeringFritz Engineering L'aboratory:.
Le~igh University .Bethlehem, Pennsylvania
October 1970
Fritz ~ngineer1ng Laboratory Report No. 328.9
<I. ,\
-····-1
TABLE OF CONTENTS
ABSTRACT . • • • . . . . . . . . . . . . . . . . . . . . . .Page No.
1
1 c INTRODUCTION......... ~ • • • • • • • • • • • • • • •• 2
ANALYTICAL MODEL ANO INTERNAL FORCES . . . . . . . . . . . . . . 6
3. ULTIMATE STRENGTH.• (I • • • • • • • • • • • • • • • • • • • • 14
40 COMPARISON WITH TEST RESULTS . . • • • • . • • • • • . . . • • . 23
CONCLUSIONS . . . . . . . . . . . . . . . . . . . . . . . . . . 26
6 '" ACKNOWLEDGEMENTS. • • • • • • • • • • • • • • • • • • • • • • • 2 7
7. APPENDIX I. - REFERENCES · · . • • . • • . . • • • • . . . • •• 28
8", APPENDIX II. - NOTATION . . . . . . . . . . . . . . . . . . . . 31
9 Q T.i\BLES AND FIGURES • • • • • " • • • • • • • • • • • • • • • •• 35
UNSYMMETRICAL PLATE GIRDERS UNDER SHEAR AND MOMENT
by
Chingmiin Chern l
and
Alexis Ostapenko 2
ABSTRACT
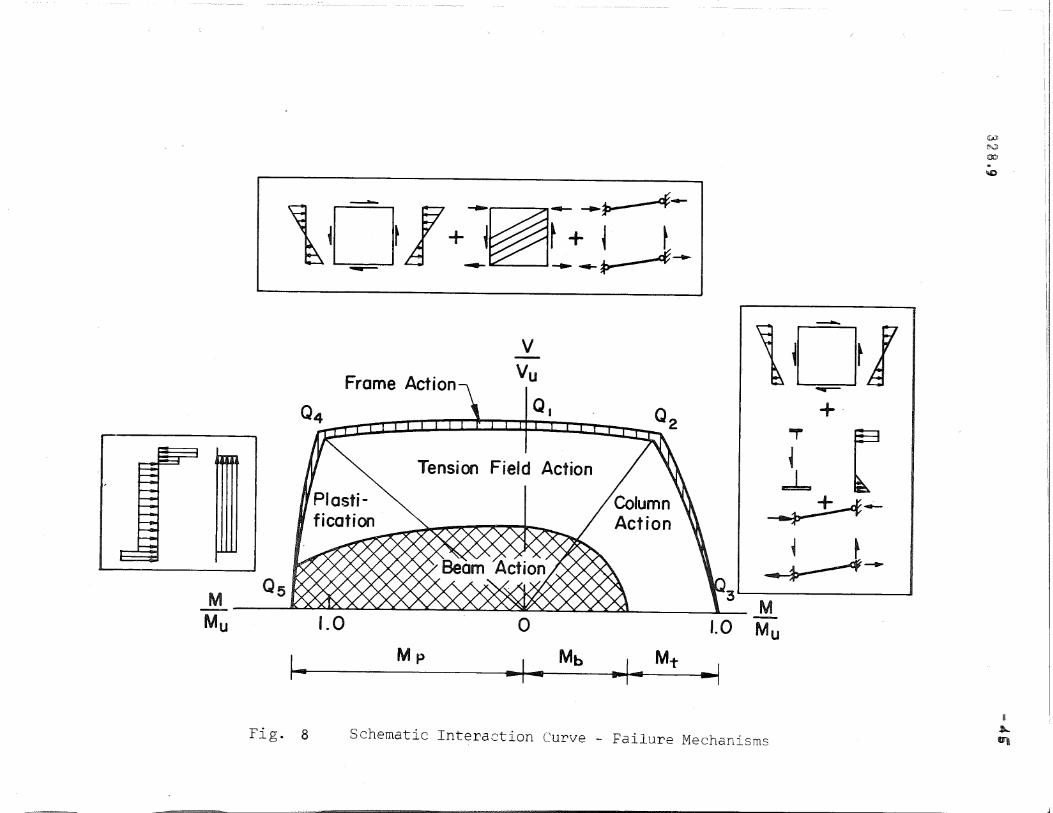
A method of determining the ultimate static strength of
transversely stiffened plate girders subjected to a combination of
shear and bending is presented. The method is applicable to homo-
geneous and hybrid girders with symmetrical or unsymmetrical cross
section. The ultimate strength is assumed to be given by the sum
of,three contributions: beam action, tension field action and frame
The behavior of a girder panel is described by a continuous inter-
action curve which is divided into three parts: web failure portion,
compression flange buckling portion and tension flange yield portion,
The theoretical ultimate loads compare well with the results of th,e
available fifty-three tests on symmetrical and unsymmetrical plate
girders. The average deviation is 5% with the extreme deviation
of 15%1l
lAssistant Professor of Civil Engineering, North Dakota State University,Fargo, N.D., formerly Research Assistant at Lehigh University, Bethlehem,Pennsylvania
2Professor of Civil Engineering, Fritz Engineering Laboratory Departmentof Civil Engineering, Lehigh University, Bethlehem, Pennsylv~nia
(1)
328.9 ~2
1. INTRODUCTION
A plate girder in a building or in a bridge has a majority of its
panels subjected to Bome combination of shear and moment; only a few panels
would ordinarily be under pure moment or shear. Yet, most of the theoretical
and experimental research conducted so far on the ultimate strength of plate
gi"rdera has dealt with the simpler cases of pure moment or shear, and the
'*case of combined loads has been treated due to its complexity as some
plausible transition between these 'two strengths.
In 1961, Basler sugges~~d that the moment capacity of a piate
girder section be given by the yield strength of the flanges plus the yield
capacity of the web reduced by a shear stress assumed to be uniform. The
effect of web buckling was neglected and the approach is thus valid only
for webs with very low depth-thickness ratios. To overcome this difficulty
it was proposed that the shear capacity V (including the post-bucklingu
strength) be not reduced by bending up to M = 0.75 of the pure bending moment
M , causing yielding of the tension flange, and the moment capacity M bey y
not reduced by shear up to V = 0.60 of the pure shear strength V. Theu
transition between the two result~ng points was assumed to be a straight
line. If applicable, the moment from this interaction diagram should be
reduced to M which is primarily controlled by the strength of the compressionu
flange. (4) This interaction relationship was then adopted by the AISC
*Hereafter, whenever there is no possibility of confusion, "combination ofmoment and shear" will be called "combined loads."
l

328.9
Specification. (2) Reference 24 introduced a modification of the method by
replacing the tension flange yield moment M with the ultimate moment for.Y
pure bending Mu
.
In 1968, Akita and Fujii arrived at another interaction relation-
h " " f h' "h I" (1) h d " dS 1p cons1sting 0 tree stra1g t 1nes. Teen pOlnts were assume to
be given by the ultimate strengths for pure shear Vu
and pure moment Mv
'
One of the intermediate two points was defined by the shear causing pure
shear buckling of the web and by the moment produced by the yield~d flanges.
The other point was given by the ultimate shear of the web computed assuming
the flanges to be of zero rigidit~ and the moment produced by the flanges
yielded under the axial forces due to bending and the tension field action.
The method neglects the possibility that the compression flange may buckle
laterally.
In all the above described studies, only girder panels with
symmetrical cross sections were considered. However, in many practical
plate girders the cross section is unsymmetrical, that is, the centroidal
axis is not at the mid-depth of the web; most typically, this is the case
for composite and orthotropic deck girders. So far, the only consideration
given to unsymmetrical girders is an adaptation of Basler's interaction
relationship(4) in Reference 24.
The purpose of the present study is to describe a new method which
gives the ultimate strength of a plate girder panel directly for any com-
bination of moment and shear and is applicable to unsymmetrical, symmetrical,
homogeneous, and hybrid girders. The analytical model of the method and the
assumed pattern of the girder behavior are given next.
Due to the complexity of the force interletlan in I plate girder
panel, an exact analysis of its behavior under load has been impossible,
and recourse had to be taken to represent the panel in the form of a model
as closely to the true state as possible and formulating the desired strength
equations on it. Defficiencies of the analytical models employed by previous
researchers have been pointed out. The model proposed here, although not
perfect, provides a means for explaining cases which could not be handledbefore.
The model for combined loads represents an interaction between the
models which have been developed in the course of this research for the(7) . (8)
case$of pure shear and pure bending. The web plate is assumed to be
flat until it buckles under the combined effect of increasing stresses due
to shear and moment. The Post-buckling strength of the web is aSSumed to
be in the form of the tension field action analogous to, but not the same
as, in References 1 and 3. The Contribution of it is limited by the yielding
of the web plate and both, shear and moment, are taken into accOunt.
The flanges together with an effective area of the web contribute
to the shear strength by forming a plastic mechanism with hinges at the
stiffeners (Frame Action). The etfect of the axial forces in the flanges
is included. The axial strength of the flanges in yielding or buckling
(Ia teral or torsional) controls the magni tude of the moment on:i:he panel.
The horizontal component of the tension field force reduces the flange
capacity available to carry the moment. When the flange bUckling capacity
is reached before the full capacity of the web or frame action is developed,
the reduction of the moment due to their presence is proportionately smaller.
328.9-s
The modes of behavior described above are equally valid whether
the larger portion of the web is in tension or compression, except that
a full plastification of the web may be possible as the web portion under
compression becomes smaller. Depending on whether or not the flanges fail
before the shear capacity of the panel is developed, two types of interaction
between shear and moment are possible; shear capacity r"educed(,by moment, and
moment capacity reduced by shear. One or the other will control the design.
A complete interaction relationship is thus established .
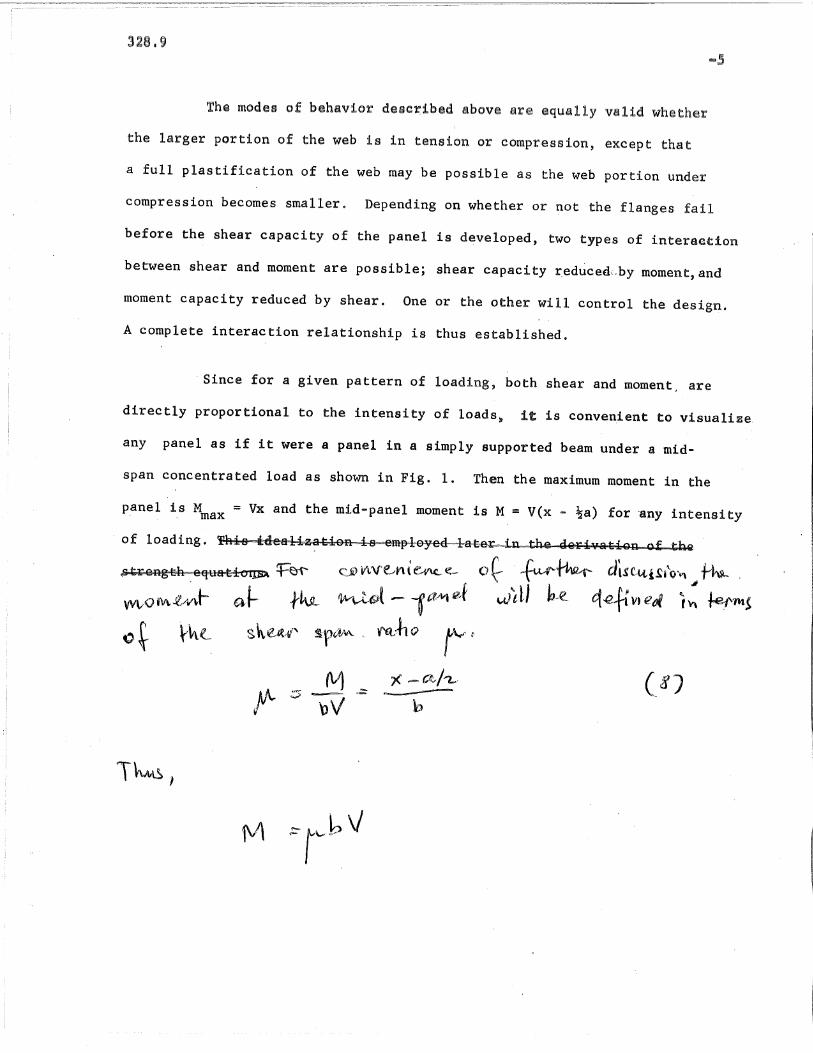
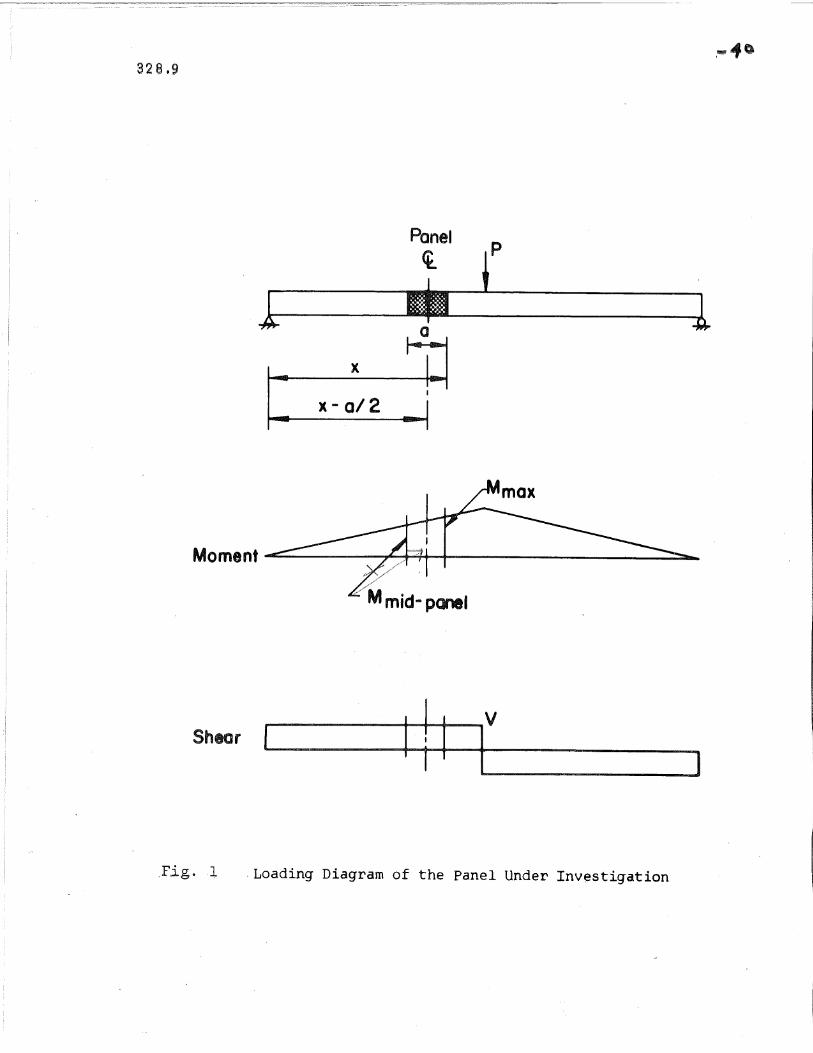
. Since for a given pattern of loading, both shear and moment~ are
directly proportional to the intensity of loads. it is convenient to visualize.
any panel as if it were a panel in a simply supported beam under a mid-
span concentrated load as shown in Fig. 1. Then the maximum moment in the
p.anel 1.8 Mmax = Vx and the mid-panel moment is M = V(x - ~a) for "any intensity
of loading. ihie ttieali...za-tion- is --emp1-oyedlat-e:r-=.in- the-,le-rivat:iQ'Q o-f tbQ
,su@Flgtb e tim"rst h' eJ yew Ct,,,,,-f". 0 -K-r00 UuPLL i tJ. ,. Jt~J1 -~~ - i-aNi e..f ""I'll} h.e A-e f'1 VI eat rV\ fe.1'.nt'VV\,rorv"..e/V\tr a-r fli\JLr"-~ '1 TI ;>
o ~ th~ Sh,~A,V' SpCtM. V'Q,·ho /"'~
(8)
328.9 -6
2. ANALYTICAL MODEL AND INTERNAL FORCES
The static ultimate ~tren8th of a girder panel under combined
shear and bending
given by a sum of
shear V . (b) the'fC'
action shear Vfc.
expressed by means of shear force is assumed to be
the following three contributions: (a) the beam action
tension field action shear V ; and (c) the framecrc
(1)
Each of the shears in Eq.l is computed considering the effect of the bend
*ing moment.
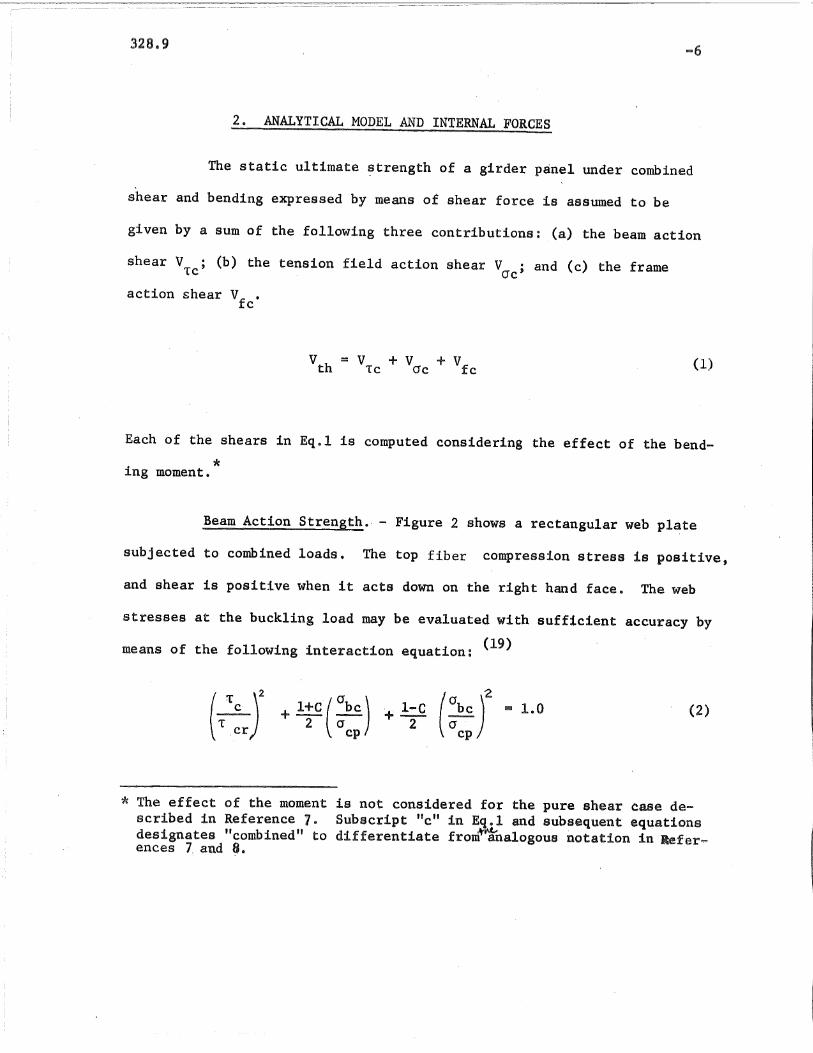
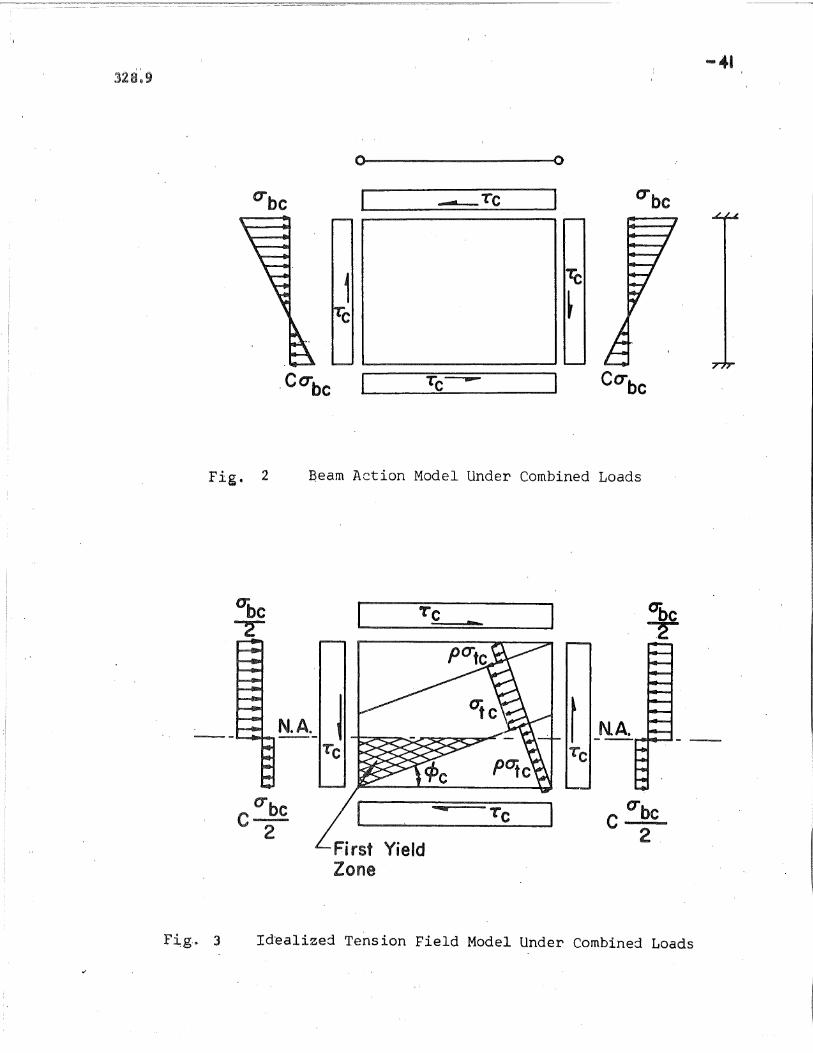
Beam Action Strength •. - Figure 2 shows a rectangular web pl~te
subjected to combined loads. The top fiber compression stress is positive,
and shear 1s positive when it acts down on the right hand face. The web
stresses at the buckling load may be evaluated with sufficient accuracy by
means of the following interaction equation: (19)
(:r )2T:r
(2)
* The effect of the moment is not considered for the pure shear case described in Reference 7. Subscript lie" in E'll.l and subsequent equationsdesignates "combined" to differentiate from~ analogous notation in Ref'erences 7., and ~ •
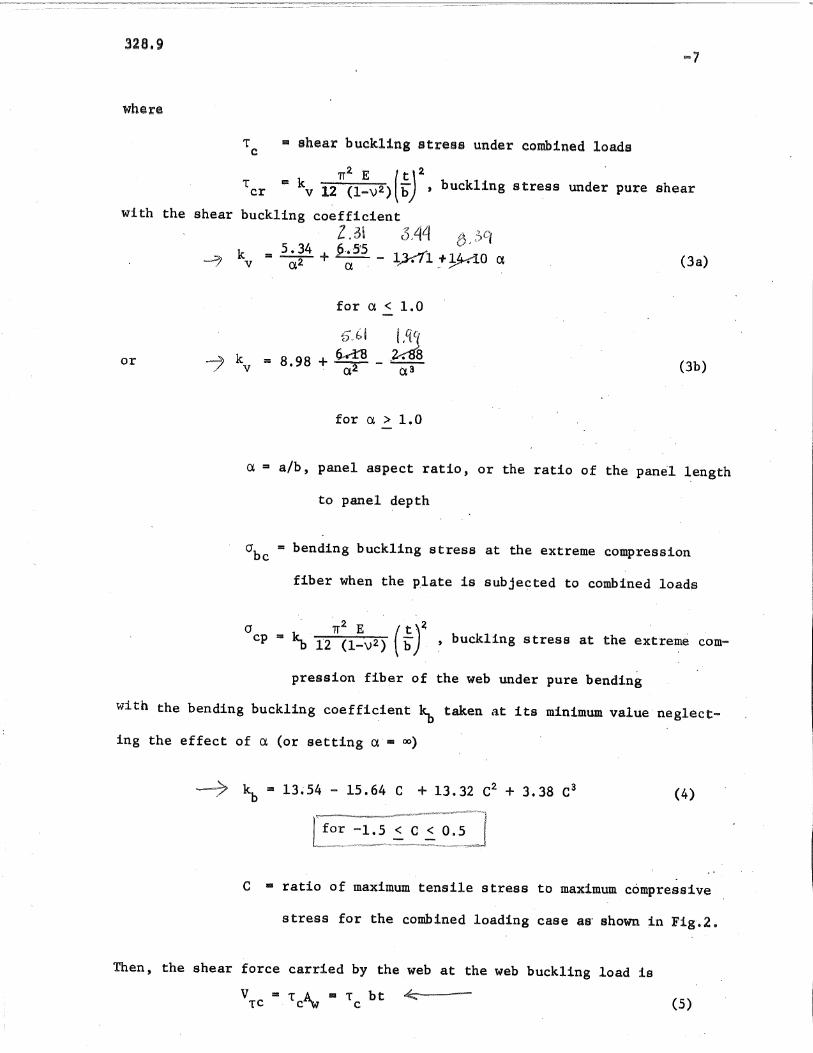
where
t ~ shear bucklins stress under combined loadsc
Lcr = kv 12TI~l~V2)(~)2, buckling stress under pure shear
with the shear buckling coefficient
2.31 ~)A4 8.:)C}
o Lv = 5;J +;5 - 1./ _+,!..4<10 ex (3a)
for ex < 1.0
or (3b)
for ex > 1.0
ex = alb, panel aspect ratio, or the ratio of the panel length
to panel depth
abc bending buckling stress at the extreme compression
fiber ~hen the plate is subje~ted to combined load~
a ~2 E (-bt)~cp .. ~ 12 (l-v2) , buckling stress at the extreme com-
pression fib~r of the web under pure bending
with the bending buckling coefficient ~ taken at its minimum value neglect
ing the effect of ex (or setting ex • 00)
-7' ~ = l3~54 - 15.64 C + 13.32 C2 + 3.38 C3
for -1.5 < C < 0.5
(4)
C • ratio of maximum tensile stress to maximum compressive
s tress for the combined loading case as' shown ~n Fig'.2.
Then, the shear force carried by the web at the web buckling load is
VTC := TcAw • LC
bt ~ (5)
328.9-8
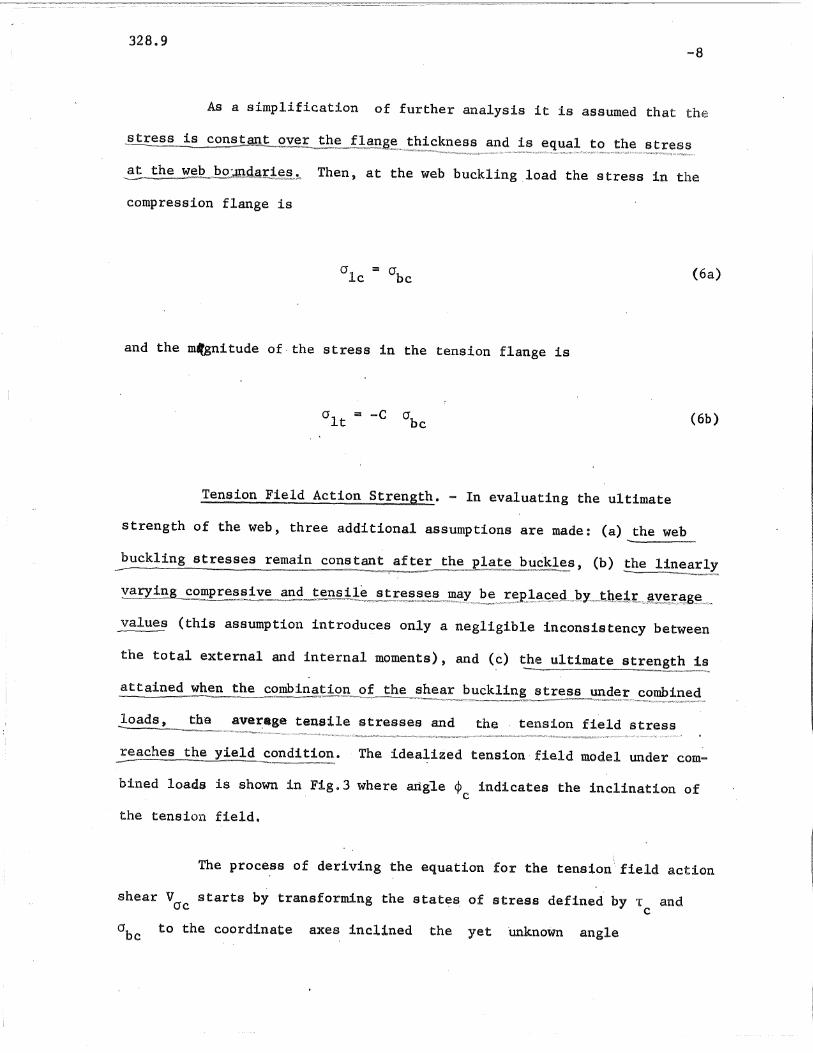
As a simplification of further analysis it is assumed that the
stress is const~h~!~~~~~_~!l!_!~~~!~_~~~~~~_
E the=we"b=,~slQ~!~~~L~~ Then, at the web buckling .load the stress in the
compression flange is
(6a)
and the m~nitude of· the stress in the tension flange is
(6b)
Tension Field Action Strength. - In evaluating the ultimate
st engt of t e wee, thr e additiona as umpti nsreade (a) ~thee
buckling stresses remain constant after the plate buckles, (b) the linearly------ ~_===___=-==_~~~~,~=~~!!:~~;;::-~-..;::~;;;~'~'Y.'"N~~~:r........ """'---- ""=:c.-.:--=_..~.=_.. =
values (this assumption introduces only a negligible inconsistency between
the total external and internal moments), and (c) the ultimate strength is~ ~ -:to
attained when the combination of the shear buckling stress under combined=="'"" ~=n:.:==.~~ ..,... ., ~~~~,-:;r.-~~:::::-o:=~~~,~~~~~.~..;'~~,~~_,;,:",~~.~,":,:,,:"~~~"'~~i;;:~J~;:.~;:r-;:'.'.'r.";"~."':~::"".',~r~,7::::'~'-"''';:'$::-:;:-::~7/'''/::~~-::Y'::I'~~'_7.~~"7.''''.'~)..~~
ave~age tensile stresses and the tension field stress
reaches the yiel~ ~~l.1.?ition. The idealized tension field model under com
bined loads is shown in Fig.3 where angle ¢ indicates the inclination ofc
the tension field.
The process of deriving the equation for the tension field action
shear V starts by transforming the stat~~ of stress defined by T andcrc c
abc to the coordinate axes inclined the yet Unknown angle
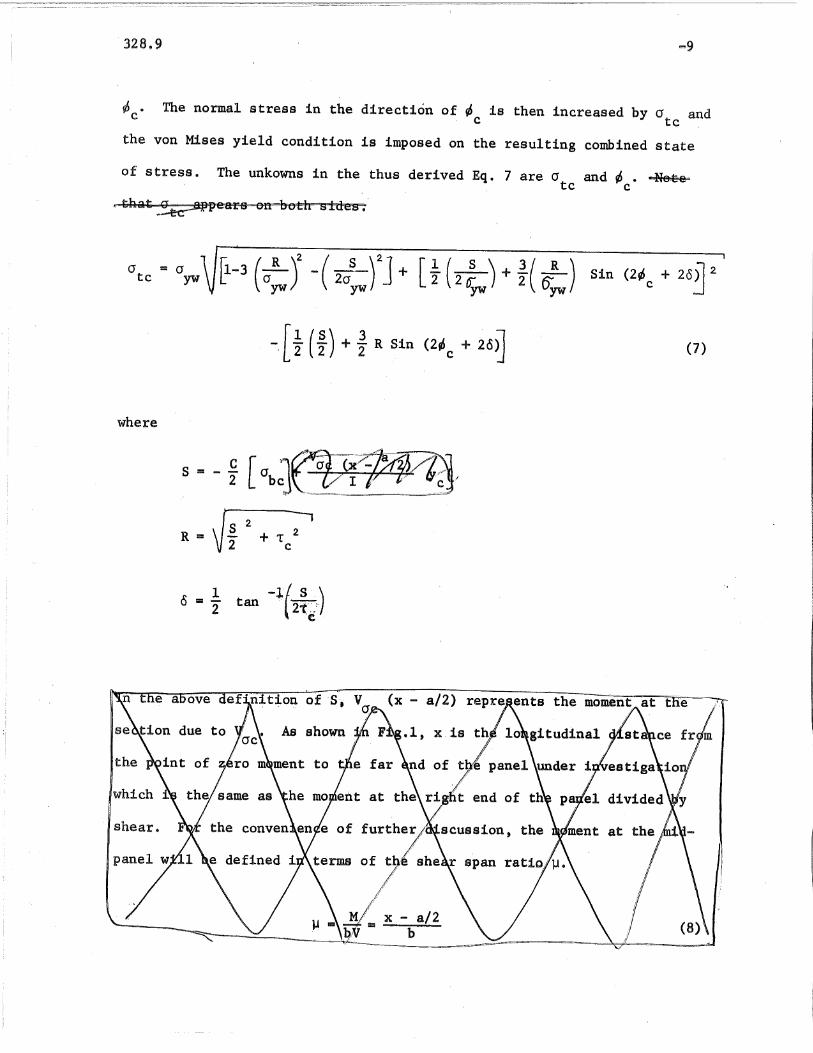
~. The normal stress in the direction of ¢ is then increased by a andC c tc
the von Mises yield condition is imposed on the resulting combined state
of stress. The unkowns in the thus derived Eq. 7 are a and ¢ . ..Ns-tetc c
R =
where
s = - ~ [ Ob~J~<1~1
vt 2 + Tc:'
(7)
10=2
-1'( s .)tan "2-t.",,,:"e'
of t9'/
!I.. ///x - a/2• ,=-_..........
b;· b
328.9
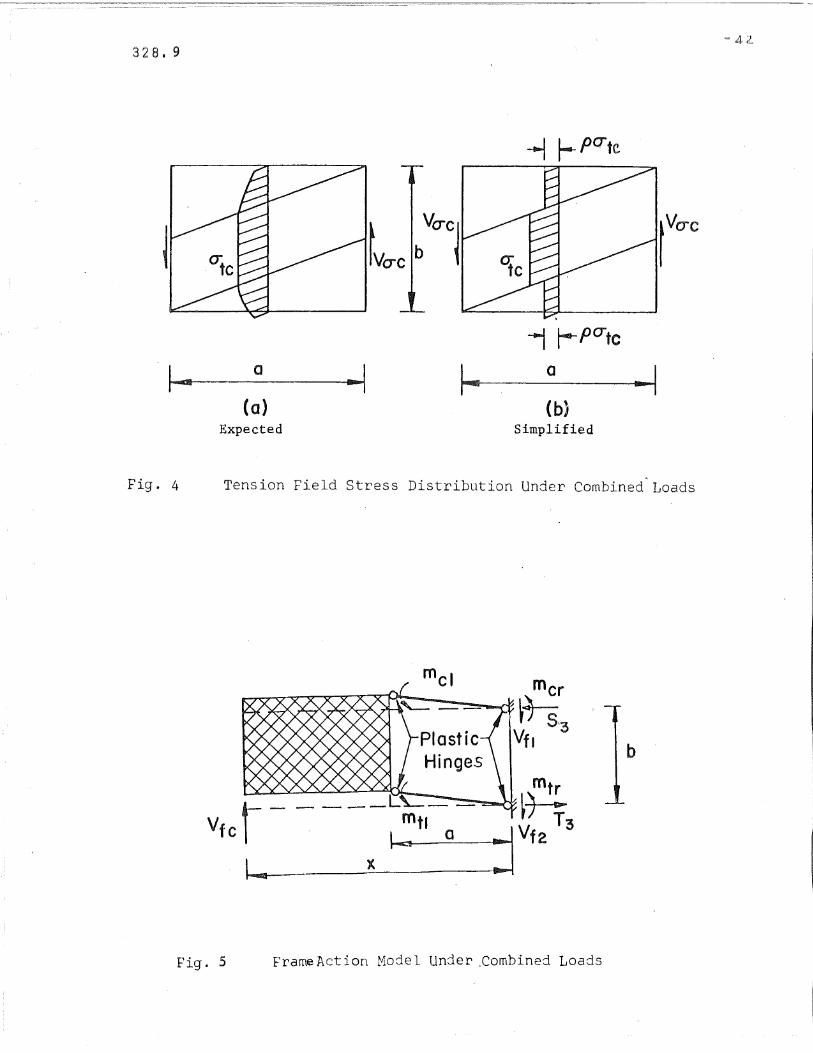
The tension field shear is found from the stress diagram in
Fig o 4b to be
-10
v =! A a [Sin 2~ac 2 w tc c (1 - p) a + (1 -~) a Cos 2 ~cJ (9)
As shown in Reference 6, a conservative estimate of the parameter
p for a plate girder is
p = 0.5 (10)
With parameter p being assumed constant and the panel having the
given geometrical and material properties, cr is a function of ~ only.tc c
Equation 1 thus can be rewritten as
v = V (rh)crc ·qc 't'c
in which ep is the only variable. The maximum value of V is obtainedc Oc
by setting the derivative of the function with respect to ~equal toc
zero,
This gives the following expression for ¢. , the value of ¢ for whichco c
V is a maximum:ac
328.9
a a[Sin 2~ + (1 - p) a Cos 2~ ] tc
co co a ~co
+ 2 [Cos 2~ '- (1 - p) a Sin 2~ ] ate = 0co - co
-11
(11)
Equation 11 can be solved for ¢ by iteration~co (An iteration method is
explained in the Appendix of Ref.7). Substituting ~co back into Eqs. 7
and 9, the maximum tension field contribution becomes
where
1= - A a2 w tc [Sin 2 ~co - (1 - p) a + (1 - p) a Cos 2 ~coJ (12)
[1:. (~) + 1- R Sin (2 ~ + 20)J2 2 2 co (13)
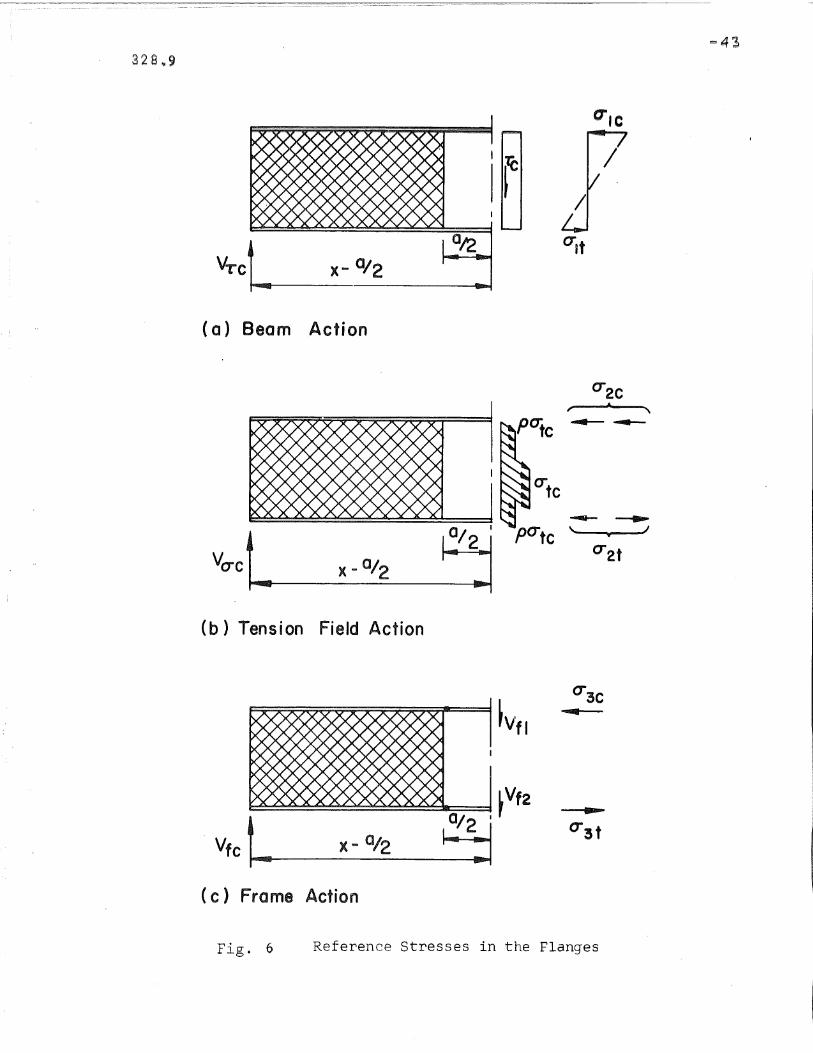
Flange stresses under the optimum tension field shear are shown in(j)
Fig. 6b. There are two contributions: one comes from t~e hor_izontal.com-:-(p
fonent oU.J:u,unsfon .Uej !: ££:., nd t2Lyth r¥=2~S"! n!?\Y2t :
1ibrium for the tension f~d action shear. Thus, the stress in the com-
pression flange is
V a Aw02c = ~ Oc + tc [1 + Cos 2~ - (1 - p) a Sin 2~ JAfe 4 Afc co co
328.9
and the stress in the tension flange is
= ~ Vae _ ate ~ [1 + Cos 2~ - (1 - p) a Sin 2~ ]Aft 4 Af~ co co
Let
-12
1H=-cr
2 tcAw [1 + Cos 2¢ - (1 - p) a Sin 2$ ]
co co (14)
represent the horizontal component of the tension field force which is
equally carried by the top and bottom flanges.
0Ze = _1_ [11 V +! H]Afc oc 2
[11 V _! HJcrc 2
(15a)
(ISb)
Frame Action Strength. - Analogously to the frame action strength
developed in Ref. 7 for the case of pur~ shear, it is ,assumed for the case
of combined loads that the maximum shear contribution of the flanges is
reached when the plastic hinges form at both ends of the flanges to develop
a panel mechanism shown in Fig.5.
(16)
where mel and mer are, respectively, the plastic moments of the compression
flange at the left and right sides of' the panel modified for the effect of
--~-------- -----------------------
328,9 ~13
the axial force in the flange.
moments in the tension flange~
m land m are the analogous plastict tr
Since the cross section of each flange
is unsymmetrical being assumed to consist of the flange proper and an
effective portion of the web (see Refs. 7 and 8) ,the axial force 1n-
fluences the plastic moments at the left and right sides of the panel
to a different degree and they are, therefore, not equal to each othero
The compression and tension flange stresses, 03c and 03t' are produced by this
action, as shown in Fig .. 6'c,
(17a)
(17b)
Reference Stresses in the Flanges. - The following flange stresses
serve as reference stresses to describe the behavior of a girder panel under
combined shear and bending:
(a) aBe
the sum of the compression flange stresses
contributed by the beam,tension field, and
frame actions.
(lJ)
(c)
a -- the sum of the tension flange stresses canst
tributed by the beam, tension field, and frame
actions.
a -- the maximum stress that the compression flangecf
can resist. It is taken to be equal to the
328.9
(d) ayt
-14
buckling stress of a col,umn formed by the
compression flange with a portion of the web
1 t(3,7,8)P a e.
the maximum stress that the tension flange can
resist. If the strain hardening is neglected,
it is equal to the yield stress of the tension
flange.
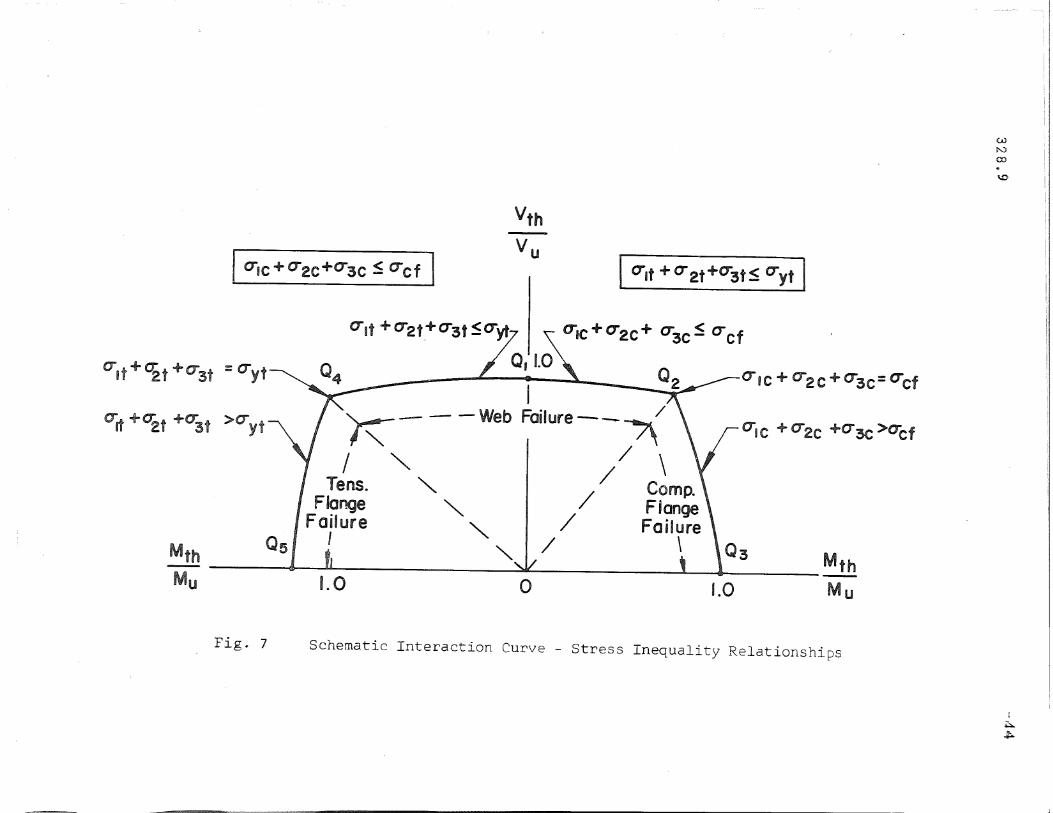
3. ULTIMATE STRENGTH
The failure of a panel subjected to a combination of shear and
moment, may be due to the failure of the web, buckling of the compression, _. ~~= ---=~--~. -", ~ .. ,. ~
other mode of failure is determined by comparing reference stresses in
the flanges and selecting the lower as the controlling one. The regions
for each of the three modes of failure are shown in Fig.7 where the she~r
is plotted against moment at the controlling ultimate condition. The
non-dimensionalizing values V and M are, respectively, the ultimate shearu u
capacity.with the moment equal to zero (Ref.7) and the ultimate moment
capacity with the shear equal to zero (Ref. B). As seen in the figure, the
interaction curve represents a series of stress inequality relationships.
The interaction curve is separated by the ordinate V/V into two portions:u
the larger portion of the web in compression and the larger portion of the
web in tension, as indicated in the figure by portions Q -Q -Q and Q _1 2 3 1
Q -Q, respectively.4 5
-15
Larger Portion of the Web in Compression (QI-Q2-QS)' - The
ultimate strength equations are formulated from the conditions in
specific portions of the interaction curve.
(a) At point Ql in Fig. 7, the panel is under pure shear, that is, M = O.
The capacity will be limited by the web plate failure and Vth
= V . (7)u
(b) Portion between Ql and Q2. The panel is under high shear and relatively
low moment. When the web is stressed to its ultimate capacity under
combined loads, the total stress a introduced to the compression flangese
is still less than the flange ul~imate carrying capacity a fO At thisc '
stage, the flange is strong enough to resist buckli~g, and the failure
mechanism of the panel is the web plate failure. Therefore, the ultimate
strength equations are
(l8a)
(lOb)
where V ,V ,and Vfc are obtained respectively from Eqs. 5,12 and 16.Tc crc
328.9
(c) At point Q2 the stress in the compression flange due to the ultimate
shear strength under combined loads is equal to the buckling stress
of the compression flange column, asc = acf' and failure may occur
simultaneously in the compression flange and in the web p~ate.
(d) Portion Q2 - Q3. If the web stress increased to the ultimate shear
strength, the compressive flange stress a would be greater thansc
0cf' the ultimate stress the compression flange can resist. There
fore, in this range, the web does not reach its ultimate shear strength,
and the panel fails due to the buckling of th'e, compression flange.
In order to calculate the panel strength, the following assumptions
sian field stress a ~ The stresses introduced to the compression- . .. ---=--===-=,.~~~"="..'_~._,,,,,,,,,,,,1;,.Q,,~~,,"
flange due to the post-buckling behavior are then
(19a)
strength. (7) When the panel is under the combined loads, the shear-----~~-
capacity of the flanges will be further reduced because of the axial
force~ acting on the flanges. Thus, the higher is the moment on~ ,_ ..~. =~""'~=~"""-''''''_''L",,'''''''' .,.~.,,~
328.9~17
,~he p~~:~"}?~r,~~~,c~e.~t:'~~~2yJ;£~~2!ly."~Jl=.~,:~2'!~': ~''''2S~.y£.~y.~~.Y.~.!.~£.~y~..::Therefore, no significant error will be introduced if cr
3cis assumed
to be a known quantity given by Eq. 17a.* Thus, the reference flange
stress due to the horizontal component of the tension field force be-
comes
(19b)
Observing that Eqs. l5a and 19b give the same stress 0Zc' the follow-
ing equation is obtained:
from which the horizontal component of the tension field force H' is
found by utilizing Eqs. 12 and 14.
H.... = S1 V'"Oc
where
(19c)
1 + Cos 2¢ - (1 - p) a Sin 2¢ ,co co:
~ = Sin 2~ - (1 - p) a+(l - p) a Cos 2~co co
The incomplete tens,ion field shear Va~ is from the above
*A correcting refinement can be made by varying the frame actioncontribution, for example linearly, from the full value of 03c atpoint Q2 to zero at point Qa-
328.9
v ,A
ac
-18
(19d)
Then, the ultimate strength equations for asc
> acf
(region Q2- Q3)
are:
and
Vth (x - ~ a) = ~b Vth
(1ge)
(19f)
(g) At point Q3, the panel is under pure bending, that is, Vth
= O,and
the failure mechanism will he due to the failure of the compression
flange acting as a column; M h = M .t u
Larger Portion of the Web in Tension (Q1-Q4-QS). --
(a) In the portion QI-Q4,(Ost < ayt ), the panel is under high shear
and relatively low moment. The panel behavior is similar to that
of the portion Q1-Q2, described above.
(b) At point Q4, the stress in the tension flange due to the ultimate
web shear strength under combined loads is equal to the tension
flange yield stress (a st = ayt ) and the panel will fail simultaneously
due to yielding of the tension flange and of the web plate.
(c) In the portion between Q4 and Qs, the panel is under shear and
high moment. The tension flange starts yielding before the web
328.9 -19
plate reaches its ultimate shear strength. Then, the yielding will
penetrate into the web and finally cause the plastification of the
cross section.
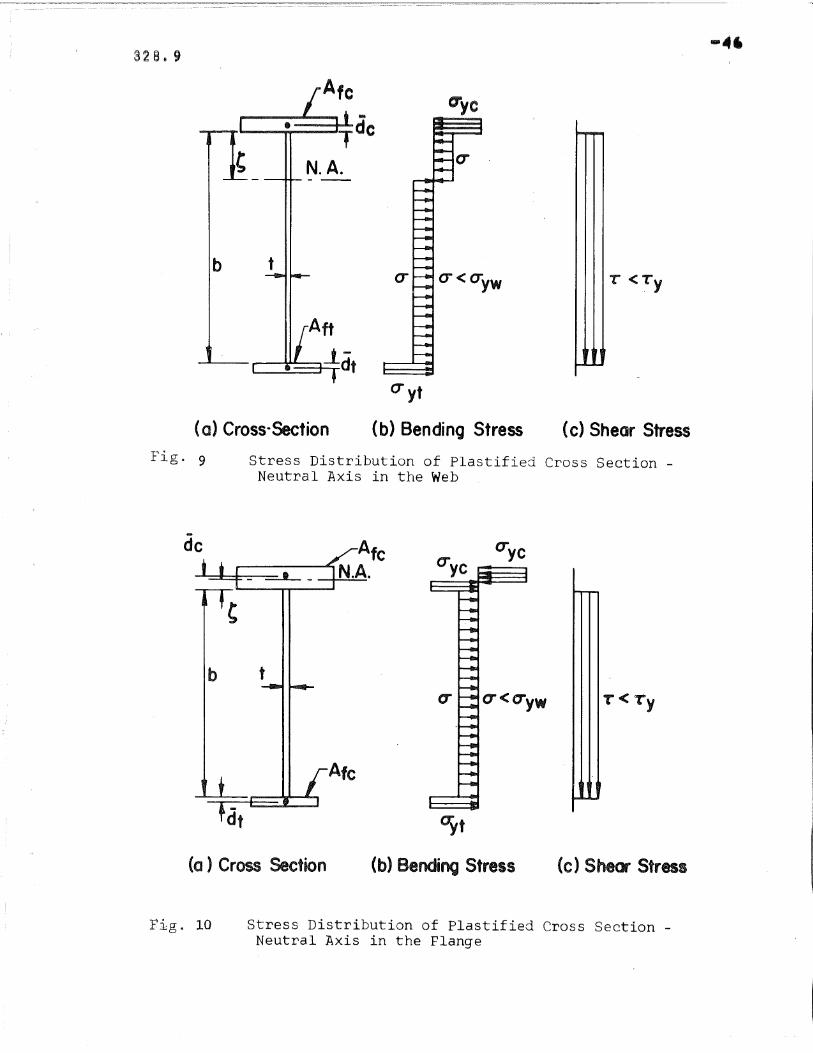
Based on the location of the neutral axis, the derivation of the
ultimate strength equations can be separated into two cases.
loads yields uniformly through the full depth, the average shear
stress, as shown in Fig. 9 , is
T = (20a)
where Vth is the shear force under investigation. Substituting T
from Eq. 20a into the von Mises yield condition, the web stress due
to bending is obtained.
a
....,
3 (0 Vt~ ) 2
yw W
(20b)
By setting the sum of the normal forces, acting on the cross section
shown in Fig. 9b, equal to zero, the location of the neutral axis
of a fully yielded cross section is expressed in.terms of nondimensional
*parameters nand p
= 0.5 _ 0.5 (p Png P7 1 4
p p)2 5
(ZOe)
* p's and n's are defined in Appendix II (Notation).
328.9-20
The shear force and the moment which act at the center of the panel
are then
and
where the plastic shear force of the web, V , isP
1V = T A = ~(J A
p y w y,j yw w
(20d)
(20e)
(20f)
axis of a fully yielded cross section shown in Fig. 10 is
p) 1P2 5 P
4n
h(21a)
The shear force Vth and the corresponding moment Mth
acting at the
center of the panel are
+ P (0.5 + n ) + P P (1 + ng
+ nf)]
7 g 2 5(21b)
328,9
and
-21
(2lc)
(d) At point Qs, the panel is under pure bending. As shown in Ref. 8,
the failure mechanism will be the plastification of the cross section,
MP
Yhere M is the plastic moment of the cross section.p
(22)
Maximum Moment in Panel. - Since under combined loads the moment
at one end of the panel is greater than the mid-panel moment for which the
.analysis is performed according to the above described procedure, it may
happen that this maximum panel moment will control the panel strength.
This is especially true for panels with large aspect ratios.
The shear producing the maximum panel moment may not exceed, de-
pending on the case, one of the following values:
M aV' < u-:i..S:th - )lb + ~a 0'cf
V' < /3 Vp
[ P ( + ) + P (n 2 _ n + 0.5>"th - ~ + ~ a PI 4 ng n e 7 g g
(23a)
(23b)
'328.9
or
+ P (0.5 + n ) + P P (1 + ng
+ nf)]
7 g 2 5
-22
(23c)
for the neutral axis in the web or in the compression flange, respectively.
These two equations (Eqs. 23b and 23c) are simply Eqs. 20d and 21b modified
for an increased shear span (from ~b to ~b + ~ a).
It seems reasonable and sufficiently accurate, mostly on the safe
side, to simplify the maximum panel moment limitation to keeping it below
the moment which would produce yielding according to the ordinary beam
theory.
I (JyfV' < --~-~--:--th - y b (~ + ~ a) (24)
where 0yf is the yield stress and y is the distance from the centroid to
the flange for either the compression or tension flange, whichever gives
•the smaller Vth and thus controls.
328.9-23
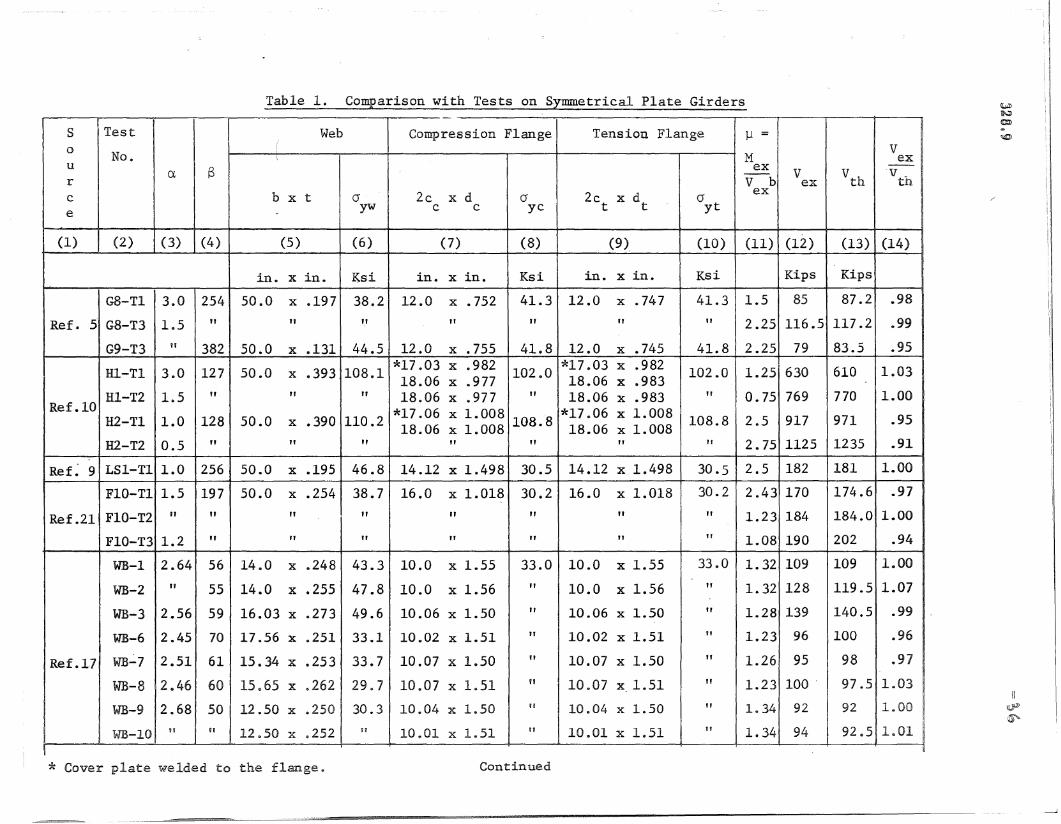
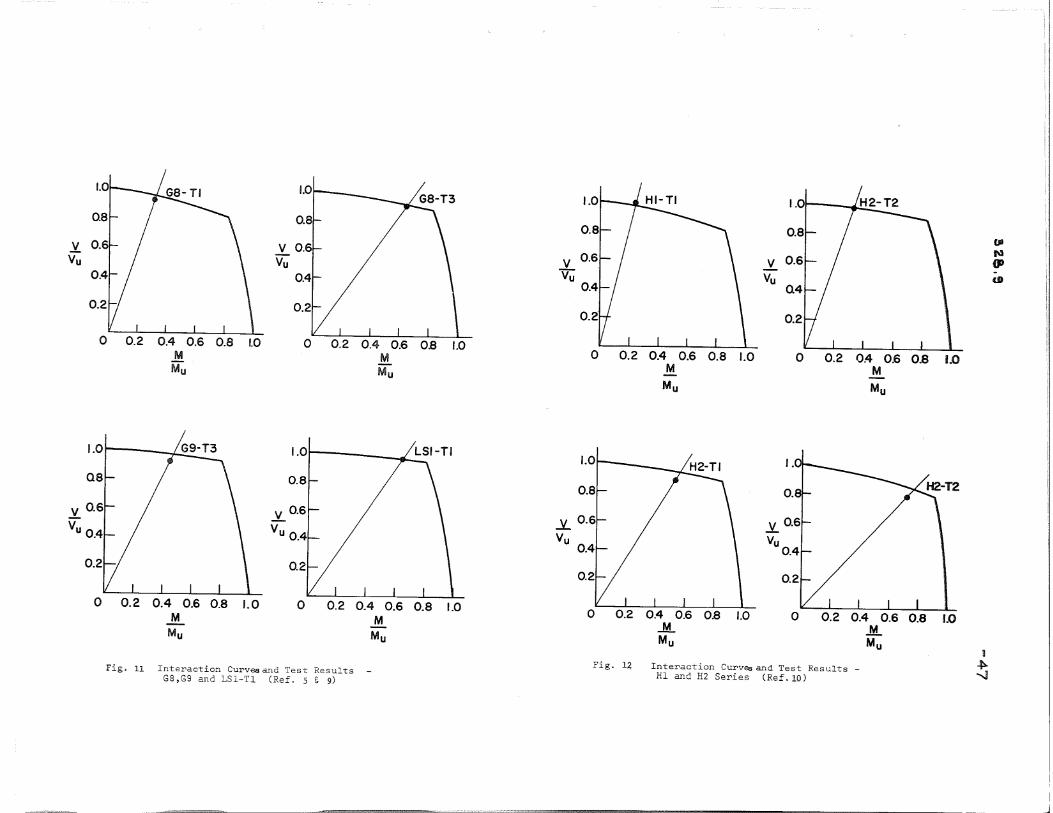
4. COMPARISON WITH TEST RESULTS
The ultimate strength theory was checked against the available
f ·f h · 1 1 · d (1,5,9,10,17,18,21)1 ty - tree tests on symrnetr~ca pate glr ers,
(13 16) . (12 23)hybrid girders, ----, and unsynnnetrical plate glrders. ' Tables 1
to 3 summarize the dimensions of the test panels, material properties,
the experimental ultimate loads, the ultimate loads fr,om·the theoretical
analysis, as well as a comparison between the experimental and predicted
ultimate loads. The test load is shown on the theoretical interaction
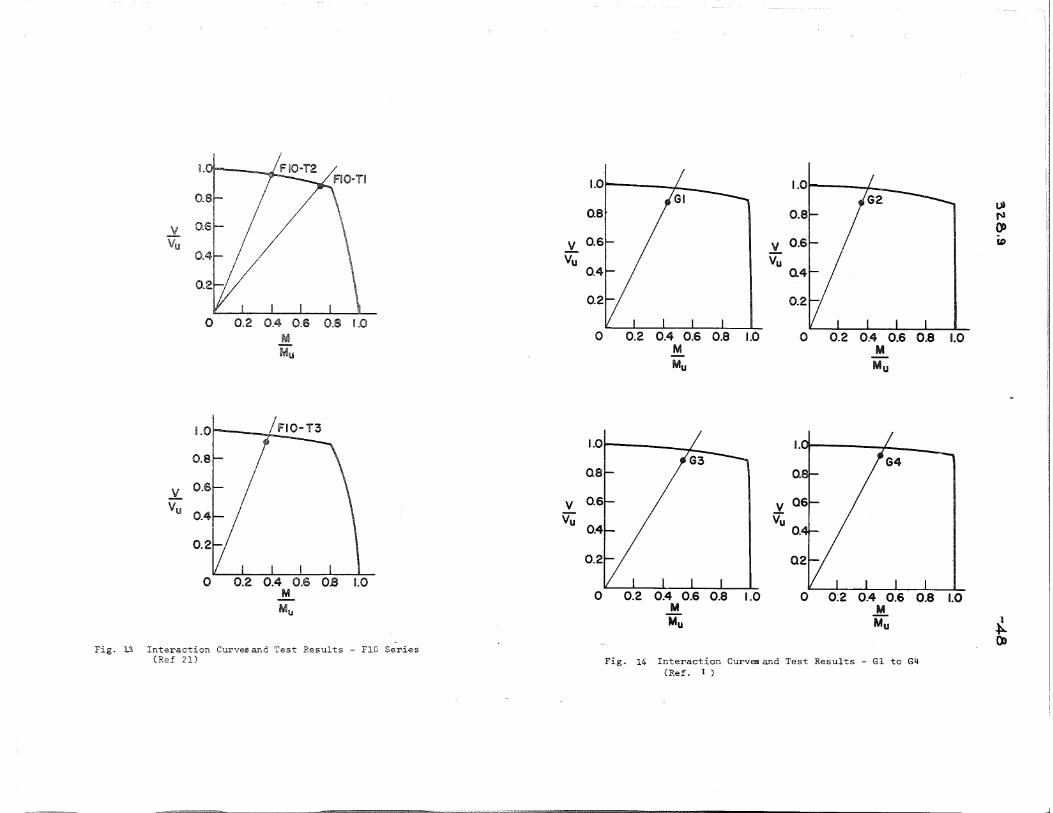
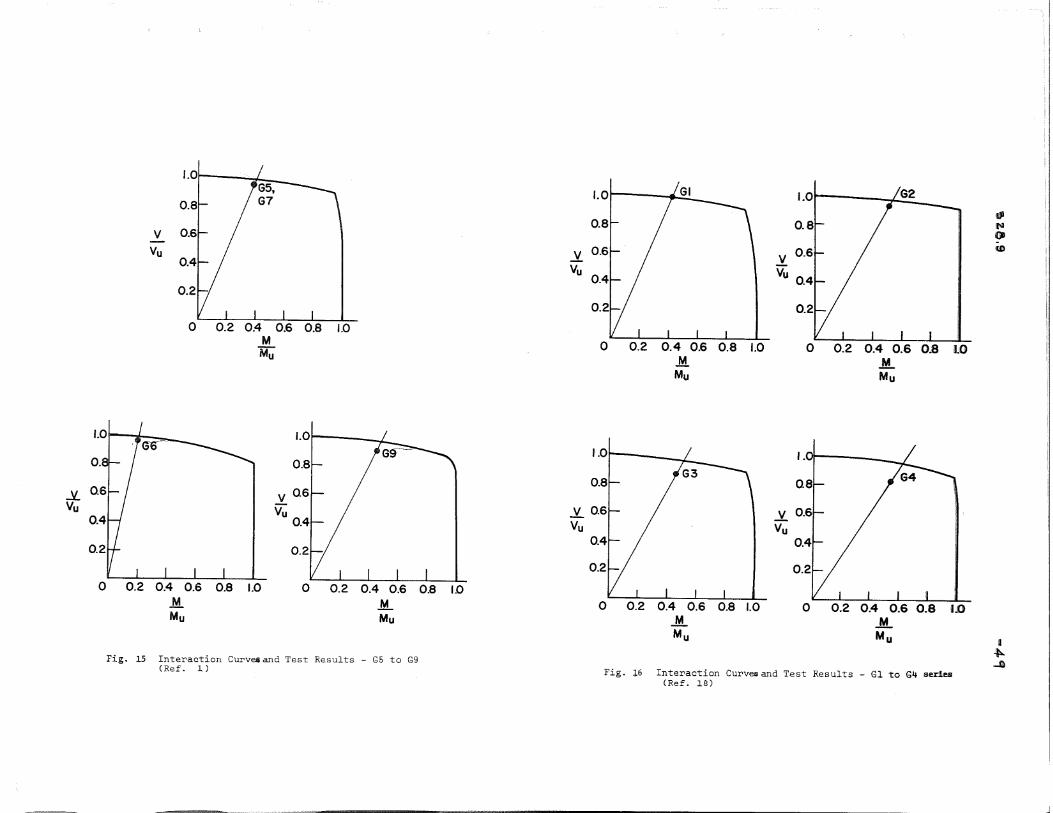
curves for each individual panel in Figs. 11 to 24.
Symmetrical girders with homogeneous material properties are
given in Table 1 and the interaction curves for each panel are shown in
Figs. 11 to 16. The mode of failure of all these panels except for one
is classified as the web failure (shear failure). The average deviation
of the available thirty-one test loads is 4% with the maximum deviation
of 12% (G4 in Reference 18).
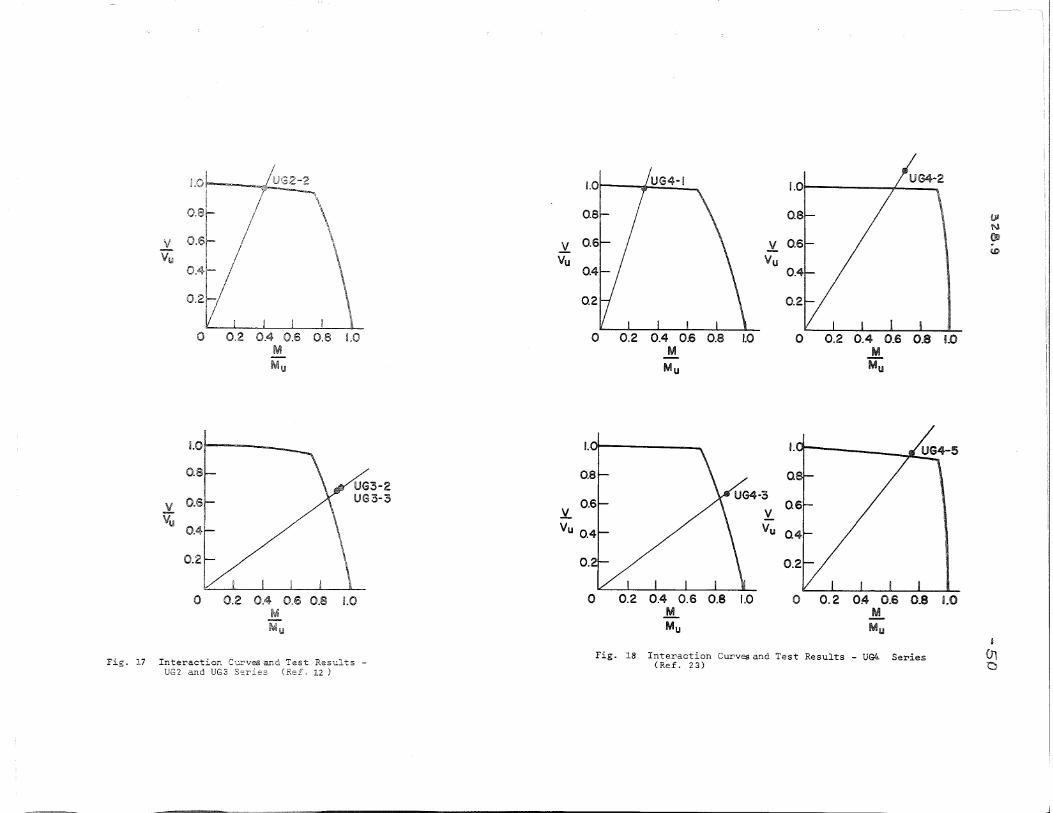
The comparison of the theory with tests on unsymmetrical plate
girders is made in Table 2 and Figs. 17 to 20. The tests on panels with
the smaller flange and, thus, the larger portion of the web, in compression
and faili~g in the web are shown in Table 2(a). The interaction diagrams
are in Figs. 17 and 18 (UG2.2 and UG4.1). The theory gives an over-
estimate of 1%.
Table 2(b) gives the girder panels with the smaller flange in
compression and subjected to high shear and high moment. The panel strength
for these cases was limited by the failure of the compression flange.
328.9
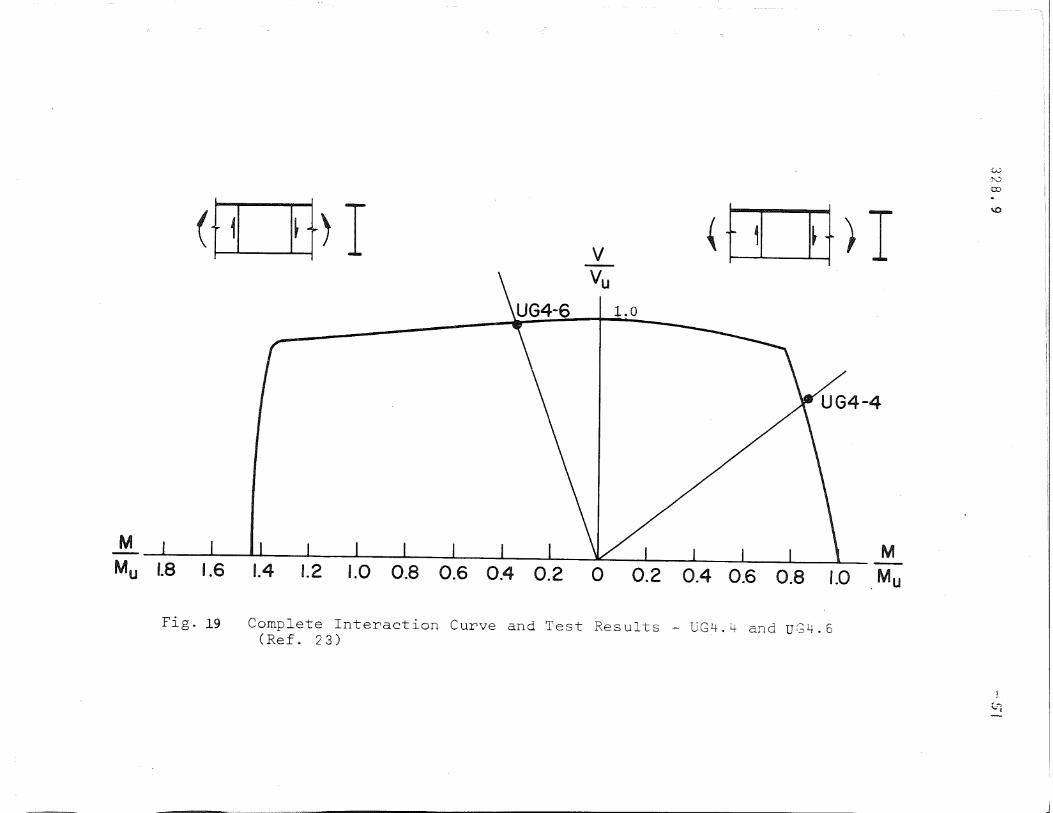
rhe interaction curves for these tests are shown in Figs~ 17,
18 and 19 where the reduction of the panel bending carrying capacity due
to the effect of shear, is illustrated. An average of 6% underestimate
is obtained for the four tests with the extreme deviation of 10% under~
estimate.
The girder panels with the smaller flange in tension and sub
jected primarily to shear are given in Table 2(c). The interaction
curves are in Figs. 18 and 19. The mode of failure is classified as
the web failure. An average deviation of 5% is obtained for the avail
able three tests with the maximum deviation of 12%.
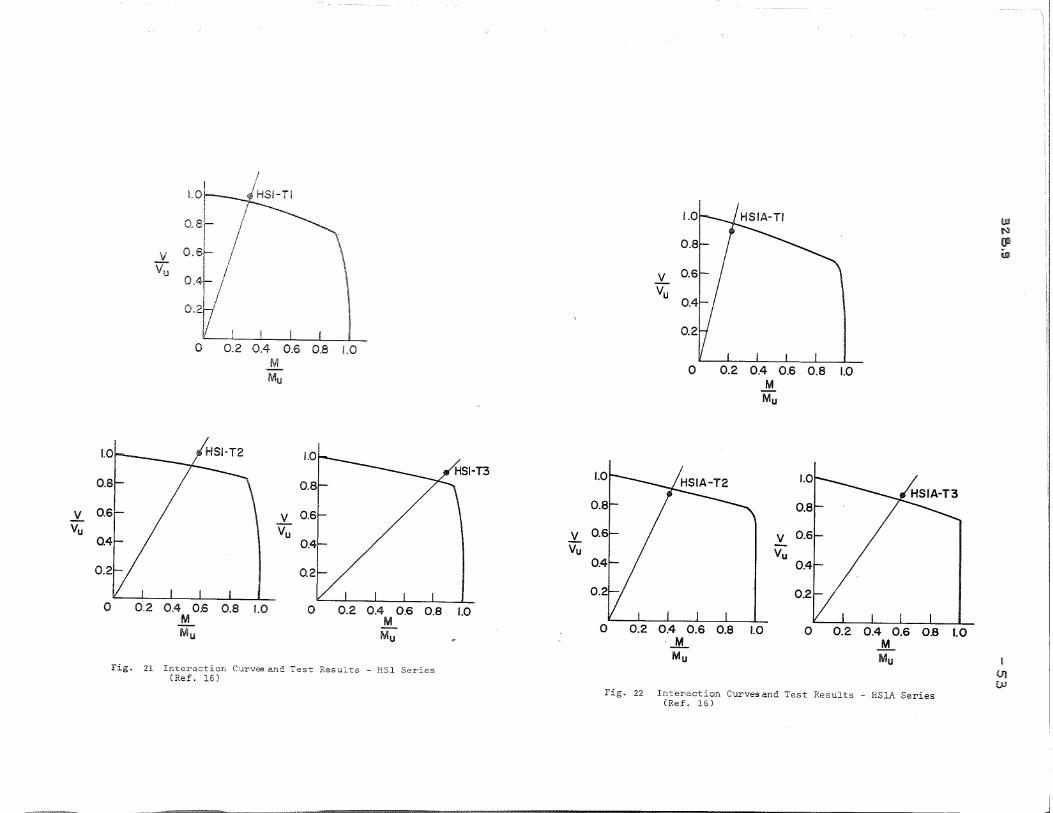
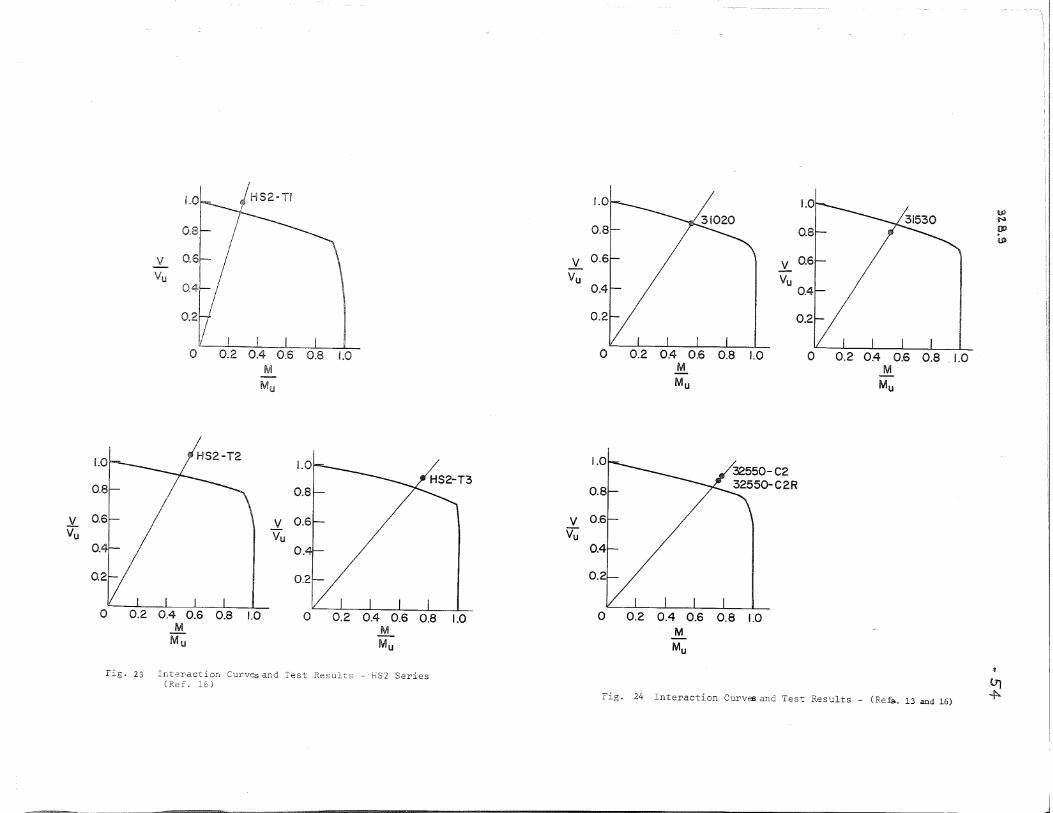
A comparison of the test results for symmetrical hybrid girders
with the predictions of the proposed approach is shown in Table 3. The
interaction curves fo~ the individual tested panels are given in Figs.
21 to 24. An average deviation from the available thirteen tests is 7%
with the maximum deviation of 15%.
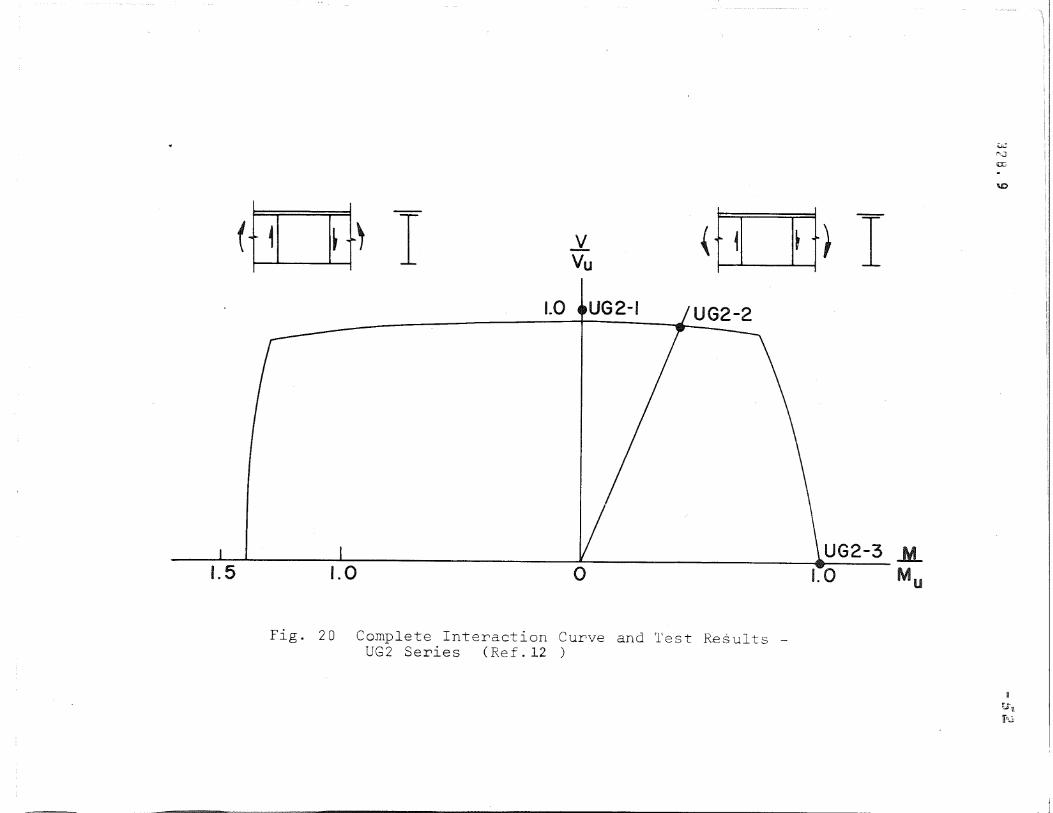
A comparison for girder panels with the same geometrical and
material properties, but subjected respectively to pure shear, a com
bination of shear and moment, and pure moment is shown in Fig. 20. A
good agreement between the test results and the computed values is ob
served.
The overall average deviation of the available fifty - three
test results (Tables 1 to 3) is 5% with the extreme deviation of 15%
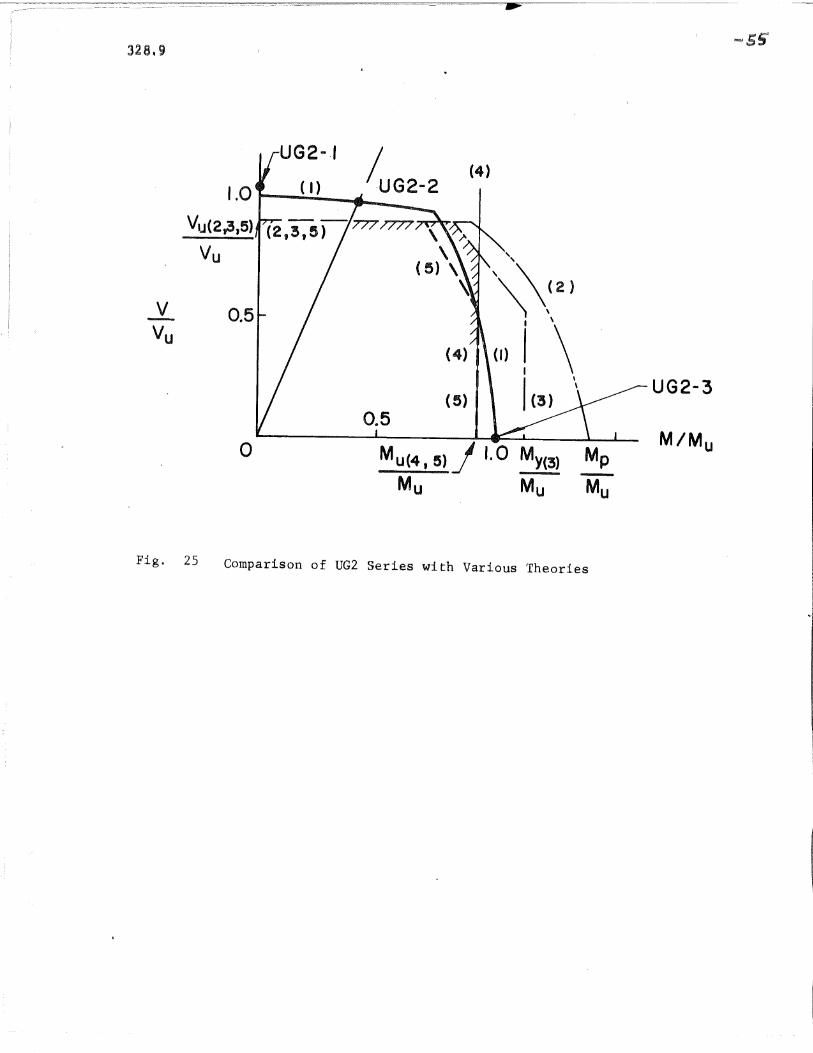
A comparison of some test results for unsymmetrical plate
girders with the proposed approach and with the approaches currently
32809
available (1970) is shown in Figo 250 As in all previous plots, the
-25
ordinate gives the shear force divided by the pure ultimate shear Vu
obtained by the proposed approach and the abscissa gives the moment
divided by the pure ultimate moment M 0 The test results for threeu
unsymmetrical panels, identical in all respects except for the type
of loading, .are shown by the heavy dots 0 The interaction diagram
according to the proposed approach is represented by curve (1)0 The
methods of References 2 and 4 were adjusted following the reasoning
of Reference 24 to make them applicable to unsymmetrical girders and
the corresponding interaction diagrams are given by curves (2) and
(3). The vertical line (4) represents a cut-off on the moment
capacity given by curve (3) and thus limits safe designs to the re-
gion indicated by cross hatching. The interaction diagram of Refer-
ence 24, curve (5), is the most conservative of those shown. The
method of Reference 1 is not included because it is not applicable
to unsymmetrical sections and cannot be readily modified as was done
here for the methods of References 2 and 40 It is seen in the figure
that the proposed approach gives the most consistent correlation with
the test results.
Compari.sons of interaction diagrams for p'anels of other
dimensions were also made and they consistently showed a greater
accuracy of the proposed method than of others.

5. CONCLUSIONS
The conclusions drawn as a result of this invistigation are
the following:
1. The ultimate strength of an unsymmetrical plate girder
panel depends on the direction of the moment which acts
on the panel, that is, whether the larger portion of
the web is in tension or in compression. ,The panel
capacity is greater when the larger portion of the web
is in tension.
2. The ultimate strength of a plate girder panel under
combined loads may be of two types: the shear ca
pacity is reduced by bending when the panel is sub
jected primarily to shear, and the bending capacity
is reduced by shear when the panel is subjected pri
marily to bendingo
3. The proposed approach gives a reliable means of de
termining the ultimate strength of homogeneous or
hybrid girders with symmetrical or unsymmetrical
cross section.
6• ACKNOWLEDGEMENTS
This report was prepared as part of a research project on
unsynunetrical plate girders conducted in the Departm~nt of Civil En.gi
neering, Fritz Engineering Laboratory, Lehigh University, Bethlehem,
Pennsylvania. Dr. David A. VanHorn is Chairman of the Department and
Dr. Lynn S. Beedle is Director of the Laboratory.
Appreciation is due to Mrs. A. Brumbelow for typing and to
Mr. J. M. Gera for drafting.
328,9-28
7 I) APPENDIX I =m REFERENCES
Jll' Akita, Yo, and Fujii 9 ToON ULTIMATE STRENGTH OF PLATE GIRDERS, Japan Shipbuilding andMarine May~ 1968.
2. 'American Institute of Steel ConstructionSPECIFICATION FOR THE DESIGN, FABRICATION AND ERECTION OFSTRUCTURAL STEEL FOR BUILDING~, AISC, New York, 1969.
'/3. Basler, KoSTRENGTH OF PLATE GIRDERS, PhDD. Dissertation, Lehigh. University,1959, available from University Microfilms, Ann Arbor, Michigan 0
J 4• Basler, K.STRENGTH OF PLATE GIRDERS IN COMBINED BENDING M~D SHEAR~ ProceedingsASCE, Vol. 87, ST7~ Part 1, October) 1961.
JS• Basler, K., Yen, B. T., Mueller, J. A., and Thurlimann, B.WEB BUCKLING TESTS ON WELDED PLATE GIRDERS, Welding ResearchCouncil, Bulletin Noo 64, Sept., 1960. .
6. Bergfelt, Ao~ and Hovik, JoTHIN-WALLED DEEP PLATE GIRDERS UNDER STATIC LOADS, Final Reportof the 8th Congress of the International Association for Bridgeand Structural En.gineering, held in New York, Sept., 19.68, ETH,Zurich Q
~7. Chern, C., and Ostapenko, A.ULTIMATE STRENGTH OF PLATE GIRDERS UNDER SHEAR, Fritz EngineeringLaboratory Report NOQ 32807, Lehigh University, Sept. 1969.
J S. Chern, C., and Ostapenko, A,BENDING STRENGTH OF UNSYMMETRICAL 'PLATE GIRDERS, F1;'itz EngineeringLaboratory Report NOQ 32808, Lehigh University, Sept., 19700
90 Cooper, P. BaBENDING AND SHEAR STRENGTH OF LONGITUDINALLY STIFFENED PLATEGIRDERS~ PhoDo Dissertation, Lehigh University, 1965, availablefrom University ~1:tcrofilms, Ann Arbor, Michigan.
10. Cooper, Pa Bo fi Le\fl:;l Ho So ~ and Yen, BQ T.WELDED CONSTRUCTIONAL ALLOY STEEL PLATE GIRDERS, Proceedings, ASCE,V90, STIl, Part I, Feb9' 1964.
11. Cooper, Pe BoPLATE GIRDEItS 9 Cllapter 8 in STRUCTURAL STEEL DESIGN, by L. Tall,et ale, Ronald Press Sl New York, 1964.

12.
13.
15.
17.
18.
19.
20.
21.
22.
Dimitri, Jp R~ and O~tap~fiko, At,PILOT TESTS ON THE ULTIMATE STATIC STRENGTH OF UNSYMMETRICAL PLATEGIRDERS, Fritz Engineering Laboratory Report No. 328.5, LehighUniversity, June, 1968.
Fielding, DG Jo, and Toprac, A. A.FATIGUE TESTS OF HYBRID PLATE GIRDERS UNDER COMBINED BENDINGAND SHEAR, Research Report No. 96-2, Center for Highway Research,The University of Texas, Austin, Texas, July 1967.
Fujii, T"ON AN IMPROVED THEORY FOR DR. BASLER'S THEORY, Final Report ofthe 8th Congress of the International Association for Bridge andStructural Engineering, held in New York, Sept., 1968, ETR, Zurich.
Kollbrunnzr, Co F" and Meister, M.AUSBEULEN, Springer-Verlag, Berlin", 1958.
Lew, He So and Toprac, Ao A.THE STATIC STRENGTH OF HYBRID PLATE GIRDERS, Report No. S.F.R.L.RPT. P550~11, Structural Fatigue Research Laboratory, Departmentof Civil Engineering, T~e University of Texas, Austin, Jan., 1968.
Lyse, I. and Godfrey, He JoINVESTIGATION OF WEB BUCKLING IN STEEL BEAMS, Trans. ASCE, Vol. 100,1935.
Nishino, Fe and Okumura, T.EXPERIMENTAL INVESTIGATION .OF STRENGTH OF PLATE GIRDERS IN SHEAR,Final Report of the 8th Congress of the International Associationfor Bridge and Structural Engineering, held in New York, Sept.,1968, ETR, Zurich.
Ostapenko, Ao and Dimitri, J. R.BUCKLING OF PLATE GIRDER WEBS, Fritz Engineering Laboratory ReportNoo 32803, Lehigh University (in preparation).
Owen, Do R. Jo, RockeYj K. C., and Skaloud, M.BEHAVIOR OF LONGITUDINALLY REINFORCED PLATE GIRDERS, Final Reportof the 8th Congress of the International Association for Bridgeand Structural Engineering, held in New York, Sept., 1968, ETR,Zurich 0
Patterson, p~ J0' and Yen, B. T.PROOF-TESTS OF TWO PLATE GIRDERS FOR DESIGN RECOMMENDATIONS, FritzEngineering Laboraotry Report No. 327.7, Lehigh University, June,19690
Rockey, Ko Co, and Skaloud, M.INFLUENCE OF FLANGE STIFFNESS UPON THE LOAD CAPACITY OF WEBS INSHEARs Final Report of the 8th Congress of the InternationalAssociation for Bridge and Structural Engineering, held in NewYork, Septa, 1968, ETR, Zurich.
32809 -30
vl230 Schueller, We, and Ostapenko, A.MAIN TESTS ON THE,ULTIMATE STATIC STRENGTH OF UNSYMMETRI~M~ PLATEGIRDERS, Fritz Engineering Laboratory Report No. 328.6, LehighUniversity, Aug., 1968 0
240 Vincent, Go SoTENTATIVE CRITERIA FOR LOAD FACTOR DESIGN OF STEEL HIGHWAY BRIDGES,American Iron and Steel Institute, Bulletin Noo IS, March 1969.
328.9 -31
8. APPENDIX II. - NOTATION
IG Lower Case Letters
a
b
cc
ct
dc
dc
\kv
mel' mer'
rotl
, mtr
t
Mmax
x = V
Panel width, that is, distance between transverse
stiffeners.
Panel depth, that is, distance between flanges.
Half width of the compression flangee
Half width of the tension flange.
Thickness of the compression flange
Distance from the compression flange-web junction to
the compression flange.
Thickness of the tension flange.
Distance from the tension flange-web junction to the
centroid of the tension flange.
Plate buckling coefficient under pure bending.
Plate buckling coefficient under pure shear.
Plastic moments developed in the compression and tension
flanges at the left and right sides of the panel due to
the frame action under combined loads.
Web thickness
Shear span, that is, the location of the far end of the
panel relative to the point of zero moment.
Distance from the neutral axis to the extreme compression
fiber of the web before buckling.
Distance from the neutral axis to the compression flange-
web junction for a fully yielded cross section.
Distance from the neutral axis to the extreme tensile fiber
328,9
2. .£EJ~lr Case
A Arf:.'8 of the plate girder cross section.
Afc Area of the compression flange.
.Aft Area of the tension flange.
A Area of the web,w
C The ratio of the maximum tensile stress (or minimum
compressive stress) to the maximum compressive stress
of the web plate (for a positive moment, C is the
ratio of the bottom fiber stress to the top fiber
stress). Note that C is negative when the bottom
fiber is in tension.
E
H
I·
M
Mma.x
MP
Mth
Mu
R
s
v
Modulus of elasticity.
Horizontal component of the tension field force; H',
for incomplete tension field.
Moment of inertia of the' cross section about the
horizontal centroidal axis,
Moment.
Maximum moment in panel.
Plastic moment f
Moment acting on the panel under Vth
.
Ultimate moment controlled by the capacity of the com-
pression flange, pure bending.
Parameter used in Eq.7.
Average stress in the tension portion of the web at
buckling.
Shear.
32-8.9
VT
Va
v'a
~33
Plastic shear of'the web 0
Ultimate shear strength of the panel under combined
loads.
Beam action shear; with subscript "Te" , under combined
loads.
Frame action shear; with subscript life", under combined
loads.
Tension field action shear; with subscript "ac", under
combined loads.
Incomplete tension field shear under combined loads.
3. Greek Letters
a = alb
S = bit
Aspect ratio, that is, panel length to depth ratio.
Web slenderness ratio, that is, web depth to thickness
ratio.
Parameter defined for Eqe7.
Strain; with subscript lty", yield strain.
Coefficient of effective web depth.
n , "'If'G'e Non-dimensional parameters: n = d Ib, nfe c
2cc
nh = t
y /b1'o
11 =
v
p
MbV Shear span ratio.
Poisson's ratio.
Coefficient of equivalent tension field stress in the elastic
triangular portion.
p , p ,. It
1 2Non-dimensional parameters: ,
1Af / A , P
C W 2
p = a / a ,P = a /a ,p = a/a1.+ YC yw 5 yt yw 7 yw
328.9
Ole' 0'2c'
°3c' crsc
°It' °Zt'
°3t' ast
abc
°Cf
0cp
° t
ayc
ayt
ayw
TC
Tcr
-34
Reference stresses in the compression flange.
Reference stresses in the tension flange.
Bending buckling stress under combined loads.
Critical stress of the compression flange column.
Plate buckling stress under pure bending.
Tension field stress in the fully yielded zone; with sub
script "e", under combined loads.
Yield stress of the compression flange.
Yield stress of the tension flange.
Yield stress of the web.
Shear buckling stress under combined loads.
Theoretical shear buckling stress under pure shear.
Inclination of the tension field; with subscript "e",
under combined loads;with subscript Irolr, the optimum
inclination of the tension field.
Ratio of the horizontal component to the vertical component
of the tension field force.
In general, subscript "ex" (experimental) refers to ultimate loads)moments)
and shears observed in tests.

328.9
9. TABLES AND FIGURES
-35
i; ; i --- I ;
Comparison with Tests on Symmetrical Plate Girders
source
Test
No.a s
Table 1.
Web
b x t 0"yw
Compression Flange
2c x d I 0"c c yc
Tension Flange
2c xd 1 crt t yt
l..l =
Mex
V bex
Ve "l:r
~}r",
Vth
Vex
·vth
WNItO>
~
(1) (2) (3) l (4) (5) (6) (7) (8) (9) (10) I (11) I (12) (13)1 (14)
in. x in. Ksi in. x in. Ksi in. x in. Ksi Kips i Kips
382150.0 x .131144.5112.0 x .755 141.8112.0 x .745 I 41.8
41.3112.0 x .747. G8-Tl I 3 •O 1254150.0 x .1971 38.211Z.O x .752
Ref. 51 G8-T3 1.5" " " II
G9-T3 I "
" "
41.3
"
1.5 85 87.2 .98
2.25 116.5 117.2 .99
2.25 79 83.5 .95
127150.0 x .393·1108.11*i~:g~ ~ :~~; 102.0 *i~:g~ ~ :~:~ '102.0
" " "18.06 x .977 " 18.06 x .983 "
1281 50.0 x .390 1110.21*i~:g~ ~ i:gg: 108.8 *i~:g~ ~ i:gg: I 108.8
Hl-TI 3.0
IHI-T2 1.5
Ref. 10HZ-II 1.0
H2-TZ 0.5 " " " " " " II
1.25 630 610 1.03
0.75 769 770 1.00
2.5 917 971 .95
2.75 1125 1235 .91
Ref~ gILS1-Tlll.O 2561 50.0 x .195 46.81 14.12 x 1.4981 30.5 114.12 x.I.498 30.5 2.5 1182 1181 11.00
38.7116.0 x 1.0181 30.2 116.0 x 1.018
Ref .21\ F10-T2 1 " I " I It I" I It
F10-T3 1.2" "I "I "
F10-TIll.S 197150.0 x .254
""
""
30.2
"H
2.43 170 174.6 .97
1.23 184 184.0 1.00
1.08 190 202 .94
WE-I 12.64 56 14.0 x .248 43.3 10.0 x 1.55
WB-2 " 55 14.0 x .255 47.8 10.0 x 1.56
WB-3 2.56 59 16.03 x .273 49.6 10.06 x 1.50
WB-6 2.45 70 17.56 x .251 33.1 10.02 x 1.51
Ref-Ill WB-7 2.51 61 15.34 x .253 33.7 10.07 x 1.50
WE-8 2.46 60 15065 x 0262 2907 10.07 x 1.51
WB-9 2.68 50 12.50 x .250 30.3 10.04 x 1.50
WB-IO II "I 12.50 x $252! H I 10 0 01 x ls51
33.0 10.0 x 1.55
" 10.0 x 1.56
" 10.06 x 1.50
VI 10.02 x 1.51
" 10.07 x 1.50
" 10 .. 07 x.1.51
" 10 .. 04 x 1 .. 50
tv 10.01 x 1.51
33.0
""""
"VI
u
1.32 109 109 1.00
1.32 128 119.5 1.07
1.28 139 140.5 .99
1.23 96 100 .96
1.26 95 98 .97
1.23 100· 97.5 1.03
1.34 92 92 1 .. 00
1.34 94 92.5 1 .. 01
If~
~
* Cover plate welded to the flange. Continued
------.J
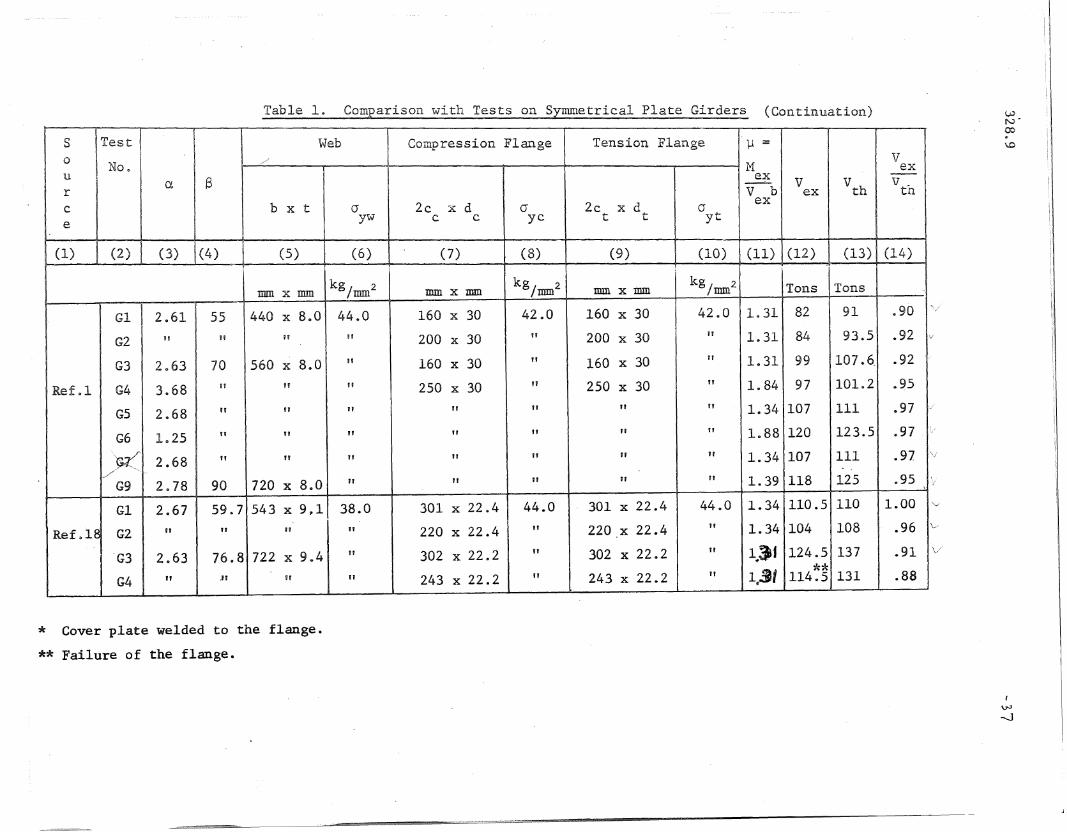
Table I. Comparison with Tests on Symmetrical Plate Girders (Continuation)
S Test Web Compression Flange Tension Flange 11 =0
No~./ V
UM ex
a S e~ V VthV r
r V b ex th
c b x t (J 2c x d (J 2c x d a ex
e yw c c yc t t yt
(1) (2) (3) (4) (5) (6) (7) (8) (9) (10) (11) (12) (13) (14)
mm x mIDkg/mm2 mm x mm kg/mm2 mm x mm kg Irrrrn2 Tons Tons
Gl I 2.61 55 440 x 8.0 44.0 160 x 30 42.0 160 x 30 4280 1.31 82 91 .90
G2 " " " 11 ZOO x 30 " 200 x 30 if 1.31 84 93.5 .92 -
G3 2063 70 560 x 800 " 160 x 30 rr 160 x 30 " 1.31 99 107 .6_ .92
Ref.l G4 3.68 tv n " 250 x 30 " 250 x 30 Ii' 1.84 97 101.2 .Q5
G5 2.68 " " " fI Ii' " " 1.34 107 III 097
G6 1.25 fI '" " " " II " 1.88 120 123.5 .97
':~ 2.68 VI " " " " " " 1.34 107 111 .97,/'"
G9 2.78 90 720 x 8.0 " " " " " 1.39 118 125 .95\
Gl 2.67 59.7 543 x 9,,1 38.0 301 x 22.4 44.0 301 x 22.4 44.0 1.34 110.5 110 1.00
Ref~18 G2 " " " " 220 x 22.4 " 220.x 22.4 " 1.34 104 108 .96
-G3 2.63 7608 722 x 904 " 302 x 22.2 " 302 x 22.2 " l~~t 124.5 137 .91
" jl " 131 **G4 " " 243 x 22.2 " 243 x 22.2 114.5 131 .88.
* Cover plate welded to the flange.
** Failure of the flange.
"--v'
WN-00
\.0
:1
\"J-.:J
-..J
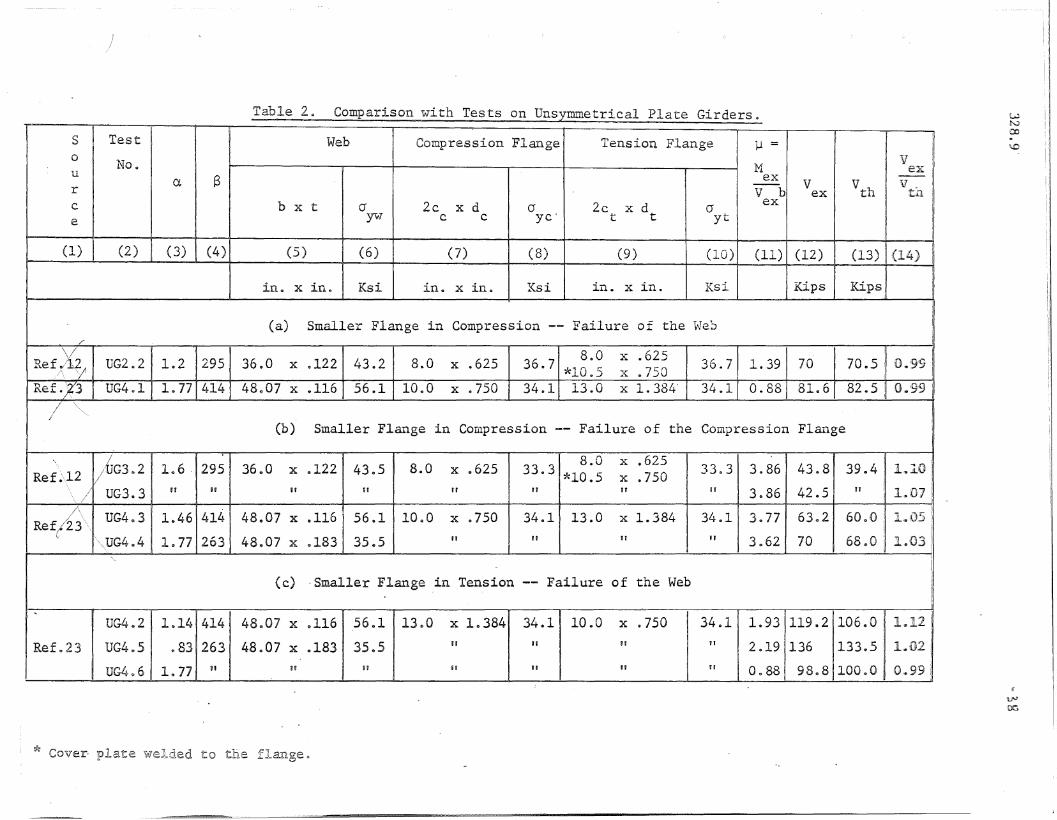
Table 2 Q Comparison with Tests on Unsymmetrical Plate Girders ..--'
S Test Web Compression Flange Tension Flange 11 =0
No .. VM exu
S ex --a V V vr V b ex th t.hc b x t a 2c x d a 2c x d a ex
e yw c c YC' t t yt
(1) (2) (3) (4) (5) (6) (7) (8) (9) (10) (11) (12) (13) (14) i
in .. x in. Ksi in. x in. ~(si in .. x in .. Ksi Kips Kips
(a) Smaller Flange in Compression -- Failure of the We~
/\/ 8.0 x .625\.,
UG2 .. 2 1.2 295 36.0 x 0122 43.2 8 .. 0 x .625 36.7 70 70.5 0,.99Ref(l~ ~'clO .. 5 x .750 36.7 1.39
Refa13 UG4 .. 1 1.77 414 48~07 x .116 56.1 10.0 x .. 750 34.1 13.0 x 1.384' 34 .. 1 0.88 81.6 82.5 0 .. 99/1' \"'-'-"<'
(b) Smaller Flange in Compression -- Failure of the 'Compression Flange
/1.6 . x .122 8 .. 0 8.0 x .625
3.86 43,,8 39.4 ! 1.~ 20Ref.",12 /UG3.2 295 36.0 43.5 x .625 33.3
i~lO .5 x .75033.3
'\. i// UG3.3 IJ tr II it tr " If H 3 .. 86 42.5 tJ i 1~O7
/\UG4e3 1~46 414 48.07 x .116 561»1 10.0 x 9750 34.1 13.0 x 1.384 34.1 3.77 63.2 60.0 1~t()5~' \,
Ref/23 \"\;
"""".,UG4 "4 le77 263 48 .. 07 x 0183 35.5 " " " II 3.62 70 68,,0 l.()]
(c) ,Smaller Flange in Tension -- Failure of the Web
..UG4.2 1.14 414 48.07 x 0116 56.1 13.0 x 10384 34.1 10.0 x .750 34.1 1.93 119.2 106.0 1 .. 12
Ref.23 UG405 (> 83 263 48.07 x .183 35.5 " .. " VI 2.19 136 133 .. 5 1.{j)1
UG406 1.77 " u Vi Of tr " n aI' 88 9888 10000 0.99
* c ., 1 "f d' h r~over· pJ...ate wecj]~de 1:0 tJ.JLe J:-LaA."'1ge IJ
WN00'
\0..
-ll:.}'J'
DC
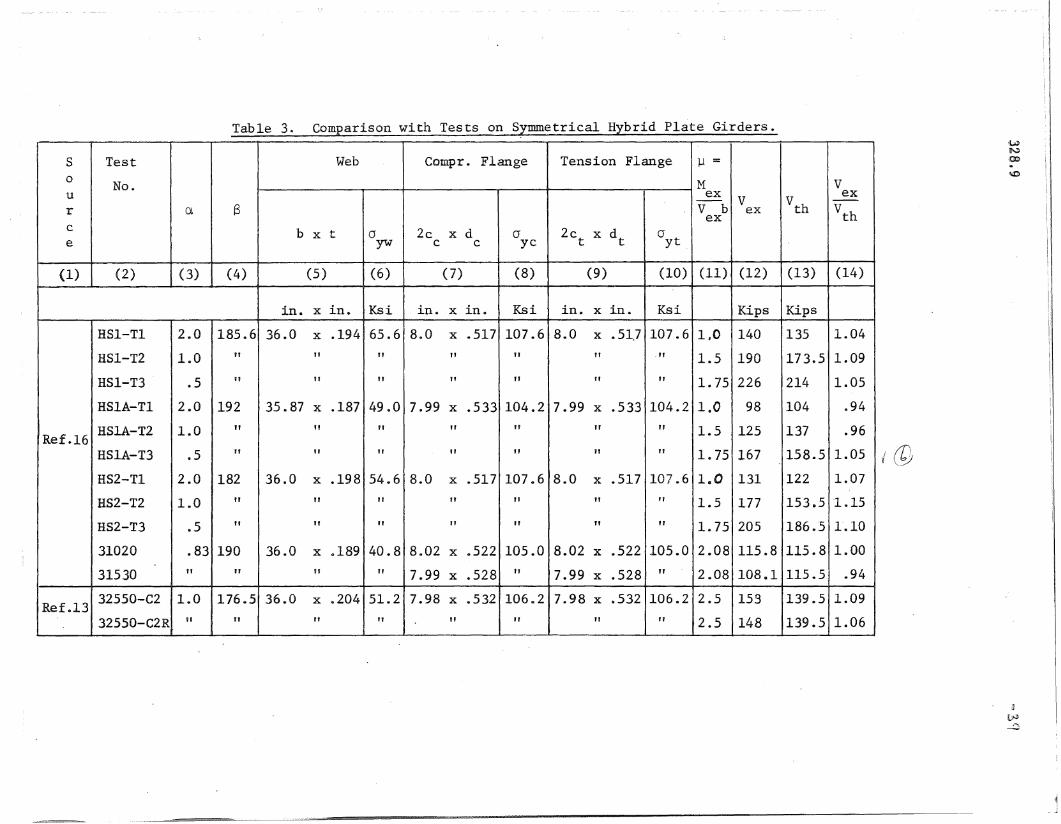
Table 3. Comparison with Tests on Sxmmetrica1 Hybrid Plate Girders.
S Test Web Compr. Flange Tension Flange l-l =0 No. M Vu ex V Vth
ex
r a S V b ex Vthexc b x t a 2c x d 0 2c x d °yte yw c c yc t t
(1) (2) (3) (4) (5) (6) (7) (8) (9) (10) (11) (12) (13) (14)
in. x in. Ksi in. x in. Ksi in. x in. Ksi Kips Kips
HSl-T1 2.0 185.6 36.0 x .194 65.6 8.0 x .517 107.6 8.0 x .51.7 107.6 1,0 140 135 1.04
HSI-T2 1.0 " " " " " " -ff 1.5 190 173.5 1.09
HSI-T3 .5 " " VI " " " " 1.75 226 214 1.05
HSIA-TI 2.0 192 35.87 x .187 49.0 7.99 x .533 104.2 7.99 x .533 104.2 1.0 98 104 .94
HSIA-T2 1.0 " " " " " ff " 1.5 125 137 .96Ref.16
HSIA-T3 .5 " " " II " " fI 1.75 167 158.5 1.05
HS2-Tl 2.0 182 36.0 x .198 54.6 8.0 x .517 107.6 8.0 x .517 107.6 1.0 131 122 1.07
HS2-T2 1.0 " " ff " " " " 1.5 177 153.5 '1.15
HS2-T3 .5 " " " " " " " 1.75 205 186.5 1-.10
31020 .83 190 36.0 x .189 40.8 8.02 x .522 105.0 8.02 x .522 105.0 2.08 115.8 115.8 1.00
31530 " " " If 7.99 x .528 " 7.99 x .528 " 2.08 108.1 115.5 .94
Ref.1332550-C2 1.0 176.5 36.0 x .204 51.2 7.98 x .532 106.2 7.98 x .532 106.2 2.5 153 139.5 1.09
32550-C2R I( I( " fI " Jf " rr 2.5 148 139.5 1.06
,@
!WNtOO
'\0
:]
~
-D
1__ J
Panel~
p
a
x
)( - at 2
max
Moment ~------ptSo--+--~-+------------......--...
/ Mmid- panel
Shear..---__--+-+--+--I--,v,
t
I I
.Fig.·l -Loading Diagram of the Panel Under Investigation
328~9
010-----------0
1c
Fig. 2 Beam Action Model Under Combined Loads
N.A. j r N.A. --TC Te
ubc CTbcii4liliii TCc- C 22First YieldZone
Idealized Tension Field Model Under Combined Loads
328. 9
Ofc
~ Vcrc1Ivcrc b 1 "tc
--j ~pcrtc
~a ..! ~
a --I(a) (b)
Expected Simplified
Fig. 4 Tension Field Stress Distribution Under CombinedALoads
b
Fig. 5 FrameAction Model Under .Combined Loads
(a) Beam Action
t 1~/2:1'c ..... ---x---a-V-2---~-IiIIIIliIIIIa.
(b) Tension Field Action
(r3C...
...
Fig. 6 Reference Stresses in the Flanges
WiN00.'-0
IO"IC+ U2C+0"3C S O"cf ]
Vth
Vu IO"lt + 0"2t+0"3t S 0"yt I
0-, C + 0-2C +u3C >O"cf
O"lt +U2t+0"3t SUyf7 / '\ 0"IC+0"2C+ 0"3C S 0"cf
, 0,1.0 ,°4 • 02 .......----U1C + 0"2C + 0"3C= O"cf- I~- - -Web Failure--~
/ ~ // \Tens. " Compo
Flange ~ / FlangeFailure " / Failure
M \al5 I " / \ "C ~ Mth th- -Mu 1.0 0 1.0 Mu
0"1t +"2t +u3f >0"yt
0"It+02t+U 3t :::uyt
Fig. 7 Schematic Interaction Curve - Stress Inequality Relationships
~
~
(!Jl»
~
m
\ ~O~I +~~~+=[..\ijO
Frame Action 'iD~1~
1_ M p -1_ Mb -1_ M-t -J
+ ..,.~.L
+--44--y
-l--J-MMu1.0o1.0
M Q5
Mu
r3
Fig. 8 Schematic Interaction Curve - Failure MechanismsII....
Ul
-,
32 ae 9
b tT <Ty
(c) Shear Stress
CTyc
cryt
(b) Bending Stress
..-..--.....""'--o-""''''''----'Tac
N.A.
(a) Cross-SectionFig. 9 Stress Distribution of Plastified Cross Section
Neutral Axis in the Web
de-+--+--_-==-L- _
b t
AfeN.A.
Afe
C)tt
T<Ty
(0) Cross Section (b) Bendino Stress (c) Shear Stress
Fig 0 10 Stress Distribution of Plastified Cross Section Neutral Axis in the Flange
o 0.2 04 0.6 0 ..8 1.0M
Mu
o 0.2 0.4 0.6 0.8 1..0M
Mu
o 0.2 0.4 0.6 OB LOMMu
o 0.2 0.4 0.6 0.8 1.0MMu
I.O~ /,..n ~I 1.0-T3 1.0
~I
\O.8~ / 0.8
/ \ 0.8~ / \ ~:~:~/UJ
Y- o.st N~ 0.61 / \ ~U O.S 0--
Vudt0.4
i~'-..J
1.00.2 0.4 0.6 0.8l!tMu
o
0.8
0.2
.::L 0.6Vu
0.4
Interaction Curv~and Test Results HI and H2 Series (Ref. 10)
Fig. l~
o 0.2 0.4 0.6 0.8..At.Mu
1.0
0.8
0.2
::L 0.6Vu
0.4
Lao 0.2 0.4 0.6 0.8M
Mu
Interaction Curv~and Test Results _88,89 and LSI-Tl (Ref. 5 & 9)
0.2 0.4 0.6 0.8 1.0M
Mu
Fig. 11
o
1.0 LO~ /LSI-TI
08 0.8
:::L 0.6 .::L 0.6
Vu 0.4 Vu 0.4
I
J
Interaction Curve~and Test Results - FlO Series(Ref 21)
~ext
o 0:2 0.4 0.6MMu
Interaction Curv~and Test Results - Gl to G4(Ref. 1)
Fig4 14
I.0r- I LIG3-----....,
as
v 0.6
Vu 0.4
0.2
L0 042 0.4 046 048 1.0
MMu
0.2o
loO~ / f'IO- T3
0.8
Y- 0.6
Vu 0.4
Fig4 J.3
j
1.01 , \,;1. 1.0
rIO.8~ dIo.sr I \ \f'!I0'
~ 0.6 V 0.61 / ~ ...'" Vu 0.4u 0.4
0.2
0 0.2 0.4 0.6 0.8 1.0 0 0.2 0.4 0.6 '0.8 LOl!t 14..My Mu
o 0.2 0.4 0.6 0.8 1.0MMu
1.0
0.8
V 0.6
Vu0.4
I~-G
o 0.2 0.4 0.6 0.8 ID.M.-Mu
I.u....r---__
as
0.4
0.2
V 0.6Vu
Fig. 16 Interaction Curv~and Test Results - G1 to G4 s~(Ref. l8)
o 0.2 0.4 0.6 0.8 1.0l!lMU
I.OT'.---
0.8
0.4
0.2
:y.... 0.6Vu
1.0o 0.2 0.4 0.6 0.8
14..Mu
1.0..1"""""----
0.8
V 06
Vu0.4
0.2 0.4 0.6 0.8 1.0
.M.Mu
Fig. 15 Interaction Curveaand Test Results - G5 to G9(Ref. 1)
o
o.
.:iVu
1.0
0.8r- I l fJ3N
~ V'0r- / \ y.. 0.61- / \~
Vuw
0.4
!0 0.2 0.4 0.6 0.8 100 0 0.2 0.4 0.6 0.8 to 0 0.2 0.4 0.6 0.8 to
M M MMy Mu Mu
il
1.01 .J'J U(~2-?
I ~
v :::t / '\V
u,I f \
0.41
L I.
0.8 Q
UG4-30.6 0.6
Y..
VU:"~I 1\"U Q4
0.2
0 0.2 0.4 0.6 0.8 1.0 0 0.2 04 0.6 0 ..8 to.M- .M-Mu Mu
to
0.8I \, /'
V O.6k-UG3-2
Vu
./\ UG3-3
0.4
0.2
o 0.2 0.4 0.6 0.8 1.0MM\IJ
rig~ 17 Interaction Curv~and Test Results -UG2 and UG3 Series (Ref" 12 )
Fig. 18 Interaction Curv~and Test Results - UG4 Series(Ref. 23)
j
01Q
\0
WtVco
{~ 1 ~~~) Il.O
vVu
M, I , , _
i.4 1.2 1.0 0.8 0.6 0.4 0.2 0 0.2 0.4 0,6 0,8 1.0 Mu
(U I~ t) I
~, I I' I I I I I I _ .
Mu L8 1.6
Fig. 19 Complete Interaction Curve and Test Results - UG4.4 and Ui;4. 6(Ref. 23)
1t.-u
_____"""""' """""' _''._. .•. _.••._. "-.0 ••.•__".~._~._.. _====== _ J
1.5
{~. i ~ ~~ I
1.0
xVu
1.0 ~UG2-1
o
{ ~ i ~} I
UG2-3 ..M...ro Mu
~
r">J
(OC
'0
Fig. 20 Complete Interaction Curve and rre s t Results UG2 Series CRef.12)
nrf.F\1(f'G:
~j
1.00.2 0.4 0.6MMu
oo 0.2 0.4 0.6 0.8 1.0
MMu
LO ---I~ 1.0~ w
Y- :~:tt.)
0.8 .,\ Ui
V
\ .::Lu 0.4Vu
0.8
1.0
0.4
::!... 0.6Vu
1.0
0.4
0.8
V 0.6Vu
1.0
0.4
0.2
.::LVu
HSI .. T2
0.2
:LVu
E
0]()J
o 0.2 0.4 0 ..6-M..Mu
0.2
1.0
Interaction Curves and Test Results - HSlA Series(Ref. 16)
Fig. 22
o 0.2 0.4 0.6-M..Mu
0.2 0.4 0.6 0.8 1.0M
Mu
o
Interaction Curv$and Test Results - HSI Series(Ref. 16)
0.2 0.4 0.6 0.8 1.0MMu
Fig. 21
o
J
W1"WI.!JP.0)
o 0.2 0.4 0.6 0.8 LaM
Mu
1.0
0.8
0.2
:y- 0.6
Vu0.4
0.2 0.4 0.6 0.8 1.0MMu
0.4
o
0.2
:i.. 0.6
Vu
_l_'0 0.2 0.4 0.6 0.8 1.0
MMu
0.8
V 0.6
Vu0.4
o 0.2 0.4 0.6 0.8 1.0MMu
0.4
0.2
V 0.6Vu
HS2-T2
V 0.6 V 0.6Vu Vu
0.4 O.
0.2 0.2
0 0.2 0.4 0.6 0.8 1.0 0 0.2 0.4 0.6 0.8 1.0M M.-Mu Mu
Fig. 23 Interaction Curv~and Test Results - ES2 Series(Ref. 16)
Fig. 24 Interaction Curves and Test Results - (Refs.. 13 and 16)01~
J
328.9
IUG2-2(4)
1.0 ( I)
VU(2,3,5)
Vu
V 0.5-Vu
UG2-3( !5)
0.5M/M u0 MU(4, 5) J I. 0 MY(3) Mp-Mu Mu MU
Fig. 25 Comparison of UG2 Series with Various Theories
Recommended