University of Huddersfield Repository
Gandini, Francesca, Achilli, Alessandro, Pala, Maria, Bodner, Martin, Brandini, Sefania, Huber,
Gabriela, Egyed, Balazs, Ferretti, Luca, Gómez-Carballa, Alberto, Salas, Antonio, Scozzari,
Rosaria, Cruciani, Fulvio, Coppa, Alfredo, Parson, Walther, Semino, Ornella, Soares, Pedro,
Torroni, Antonio, Richards, Martin B. and Olivieri, Anna
Mapping human dispersals into the Horn of Africa from Arabian Ice Age refugia using
mitogenomes
Original Citation
Gandini, Francesca, Achilli, Alessandro, Pala, Maria, Bodner, Martin, Brandini, Sefania, Huber,
Gabriela, Egyed, Balazs, Ferretti, Luca, Gómez-Carballa, Alberto, Salas, Antonio, Scozzari,
Rosaria, Cruciani, Fulvio, Coppa, Alfredo, Parson, Walther, Semino, Ornella, Soares, Pedro,
Torroni, Antonio, Richards, Martin B. and Olivieri, Anna (2016) Mapping human dispersals into the
Horn of Africa from Arabian Ice Age refugia using mitogenomes. Scientific Reports, 6 (25472).
ISSN 2045-2322
This version is available at http://eprints.hud.ac.uk/28192/
The University Repository is a digital collection of the research output of the
University, available on Open Access. Copyright and Moral Rights for the items
on this site are retained by the individual author and/or other copyright owners.
Users may access full items free of charge; copies of full text items generally
can be reproduced, displayed or performed and given to third parties in any
format or medium for personal research or study, educational or not-for-profit
purposes without prior permission or charge, provided:
• The authors, title and full bibliographic details is credited in any copy;
• A hyperlink and/or URL is included for the original metadata page; and
• The content is not changed in any way.
For more information, including our policy and submission procedure, please
contact the Repository Team at: [email protected].
http://eprints.hud.ac.uk/
Uncorre
cted
pro
of
1Scientific RepoRts | 6:25472 | DOI: 10.1038/srep25472
www.nature.com/scientificreports
Mapping human dispersals into the Horn of Africa from Arabian Ice Age refugia using mitogenomesFrancesca Gandini1,2, Alessandro Achilli1,3, Maria pala2, Martin Bodner4, stefania Brandini1,
Gabriela Huber4, Balazs egyed5, Luca Ferretti1, Alberto Gómez-Carballa6, Antonio salas6,
Rosaria scozzari7, Fulvio Cruciani7, Alfredo Coppa8, Walther parson4,9, ornella semino1,
pedro soares10, Antonio torroni1, Martin B. Richards2 & Anna olivieri1
Rare mitochondrial lineages with relict distributions can sometimes be disproportionately informative
about deep events in human prehistory. We have studied one such lineage, haplogroup R0a, which uniquely is most frequent in Arabia and the Horn of Africa, but is distributed much more widely, from
Europe to India. We conclude that: (1) the lineage ancestral to R0a is more ancient than previously thought, with a relict distribution across the Mediterranean/Southwest Asia; (2) R0a has a much deeper presence in Arabia than previously thought, highlighting the role of at least one pleistocene glacial
refugium, perhaps on the Red Sea plains; (3) the main episode of dispersal into Eastern Africa, at least concerning maternal lineages, was at the end of the Late Glacial, due to major expansions from one or
more refugia in Arabia; (4) there was likely a minor Late Glacial/early postglacial dispersal from Arabia through the Levant and into europe, possibly alongside other lineages from a Levantine refugium;
and (5) the presence of R0a in Southwest Arabia in the Holocene at the nexus of a trading network that developed after ~3 ka between Africa and the Indian Ocean led to some gene low even further aield, into Iran, Pakistan and India.
Low-frequency mitochondrial (and Y-chromosome) lineages with a relict distribution can be disproportionately informative about deep events in human prehistory. Mitochondrial DNA (mtDNA) haplogroups N1a1a and X, which have both been recovered from prehistoric remains as well as from living people, are good examples1–3. Another such lineage, with a very diferent distribution, is mtDNA haplogroup R0a, although to date it has never been recovered from prehistoric remains so we are entirely reliant on the modern diversity to draw conclusions about its history. R0a is unique in reaching very high frequencies in the Arabian Peninsula, and is also common on the far side of the Bab el-Mandeb strait (or “Gate of Tears”), in the Horn of Africa, along with several other haplogroups of Eurasian origin.
More generally, the Horn of Africa is exceptional in harbouring very high mtDNA haplogroup diversity4, and populations in the Horn have signiicant non-autochthonous African ancestry across the genome5–10. Recent studies of complete human genomes have concluded that this 30–50% of non-African legacy in Cushitic- and Semitic-speaking populations is the result of admixture from Arabia beginning ~3,000 years ago (3 ka)11,12, at a time when common cultural features developed across the Horn and southern Arabia13, suggesting a link with the origin of the Ethiosemitic languages14. However, others have argued that such autosomal dating needs to be
1Dipartimento di Biologia e Biotecnologie “L. Spallanzani”, Università di Pavia, Pavia, italy. 2School of Applied Sciences, University of Huddersfield, Queensgate, Huddersfield, UK. 3Dipartimento di chimica, Biologia e Biotecnologie, Università di Perugia, Perugia, italy. 4institute of Legal Medicine, Medical University of innsbruck, innsbruck, Austria. 5Department of Genetics, eötvös Loránd University, Budapest, Hungary. 6Unidade de Xenética, Departamento de Anatomía Patolóxica e ciencias forenses, and instituto de ciencias forenses, facultade de Medicina, Universidad de Santiago de Compostela, Santiago de Compostela 15782, Galicia, Spain. 7Dipartimento di Biologia e Biotecnologie “charles Darwin”, Sapienza Università di Roma, Rome, italy. 8Dipartimento di Biologia Ambientale, Sapienza Università di Roma, Rome, italy. 9forensic Science Program, the Pennsylvania State University, University Park, Pennsylvania, USA. 10cBMA (centre of Molecular and environmental Biology), Department of Biology, University of Minho, Campus de Gualtar, 4710-057 Braga, Portugal. Correspondence and requests for materials should be addressed to M.B.R. (email: [email protected]) or A.O. (email: [email protected])
Received: 30 January 2016
Accepted: 18 April 2016
Published: xx xx xxxx
opeN

Uncorre
cted
pro
of
www.nature.com/scientificreports/
2Scientific RepoRts | 6:25472 | DOI: 10.1038/srep25472
treated with considerable caution10,15. Moreover, some have also proposed that the source for the Horn lineages was in the Levant rather than Arabia10,11, whilst others have provided further evidence in favour of Arabia15.
Analyses of the uniparental genetic systems, in particular mtDNA, have suggested much more ancient gene low into the Horn, from both the Levant and Arabia, although the timing has not been very clearly deined. Haplogroup M1 is thought to have arrived from the Mediterranean some time since the Last Glacial Maximum (LGM)16. he North African haplogroup U6a is found at lower levels, and with possibly a diferent trajectory16. Haplogroup N1a1a in the Horn also separated from Arabia in the Late Glacial3, and several African subclades of haplogroup R0a and of haplogroup HV1 have been dated to the mid-Holocene17,18. he Y-chromosome19–21 and several genome-wide studies10,15 have recently supplied further evidence supporting the scenario of ancient migrations from the Arabian Peninsula into the Horn of Africa, well before the spread of agriculture into that region. Fernandes et al.15 recently estimated the combined Near Eastern/Arabian genome-wide fraction in Ethiopia at almost 40%, closely matching the West Eurasian fraction of 37% in our Ethiopian mtDNA database.
he most prominent Eurasian mitochondrial lineage that is shared across the Horn and Arabia is R0a, which is found at very low frequencies across west Eurasia, but reaches levels of up to 35% in eastern Yemen and up to 15% in some parts of the Horn of Africa facing the Red Sea9,15,17,18,22–27. It has been thought to have originated in the Near East and to have spread into Arabia at the end of the Pleistocene, albeit with diiculties in deining a source27; others have hypothesized a more ancient ancestry within Arabia28. his question is of great interest because evidence in favour of deeper Arabian ancestry would imply the existence of refugial areas in Arabia span-ning the Last Glacial Maximum, which have been hypothesized but never conirmed29. he timing and mode of its subsequent entry into Eastern Africa also remain to be clariied15,27, as well as its history in Europe30,31. Here we analyse 205 whole mitogenomes from R0a, and its sister clade R0b, alongside 733 R0a and R0b control-region sequences, in order to address these issues.
ResultsDeep ancestry of R0a. R0a’b (of which R0a forms the major part: Fig. 1; Fig. S1), which dates to ~40 ka using ML, is the sole known sister clade to the major West Eurasian haplogroup HV, with the two together com-prising haplogroup R0. R0 branches directly from macro-haplogroup R, which dates to ~59 ka15. Although hap-logroup R predominates amongst West Eurasians, especially Europeans, continent-speciic basal branches are also found amongst South Asians, East Asians, Southeast Asians and Oceanians32. hus whilst haplogroup R is a global non-African founder clade, R0 is primarily West Eurasian.
R0a, dating to ~30 ka using ML (Table 1) falls into at least ive major subclades, three (R0a1, R0a2’3 and R0a4) already known17,33 and two (R0a5 and R0a6) newly deined here (Fig. 1). Two further basal haplotypes (#201 and #202) are seen in Italy and Spain, respectively. Along with a third lineage basal to R0a1 known from control-region data to occur in Egypt (Fig. S1), and the distribution of the very rare R0b, these might suggest a pre-LGM Mediterranean/Near Eastern source for R0a and R0a1, 25–40 ka. Alternatively, they might represent relicts of Late Glacial or postglacial dispersals around the Mediterranean.
R0a4, R0a5 and R0a6 are all rare. A survey of the R0a5’s HVS-I motif indicates a wide distribution across the Near East and Europe (Table S2), and a deep Glacial ancestry (36.9 ± 14.1 ka with HVS-I; the two mitog-enomes diverge at 18.8 ± 6.6 ka). A similar assessment for haplogroup R0a6 is more diicult, because its only control-region mutation is the reversion of the 16126 transition, but its distribution appears to be mainly restricted to Pakistan (mainly but not exclusively Kalash), with Palestinian, Iranian and Italian singletons (see also Fig. S1). Given its prevalence in the Kalash, we may hope that future elucidation of this lineage may help shed light on the origins of the Kalash people.
In contrast, the frequency and distribution for R0a4 cannot be assessed from published datasets because it lacks any diagnostic control-region mutations. With this limitation in mind, Fig. 1 and Table S1 indicate that R0a4 encompasses mainly mitogenomes from Western Europe, Spain in particular, but also Iraq.
An Arabian source for the major R0a lineages. he great majority of R0a mitogenomes cluster within R0a1 and R0a2’3, dating to the LGM (~26 ka and 21 ka, respectively), and each mainly represented by a single star-like subclade, R0a1a and R0a2. hese subclades both coalesce to the Late Glacial: ~13 and 17 ka (Table 1). hese are the two major expansion lineages in R0a, but although widespread, they are both overwhelmingly seen in Arabia, especially Yemen (Fig. 2). However, R0a1 also includes R0a1b, comprising mainly lineages from Arabia, and several possibly related lineages including a Bedouin from Arabia and a Moroccan. Given that the former have an Arabian origin and the latter are also from Arab-speaking populations, that probably spread from Arabia during the Muslim conquests, the whole of R0a1 seems likely to have an Arabian origin, dating back to at least 26 ka and thus spanning the LGM. his implies that the several Iranian lineages and a single Syrian lineage within R0a1a were derived from an Arabian source. his is supported by the HVS-I network, in which Iranian lin-eages broadly represent a small subset of Arabian R0a1a diversity (Fig. S1). his is also the case for the few Syrian and Iraqi lineages, and the single branch shared by two Druze individuals is very recently diverged. Moreover, an overall ρ estimate for Fertile Crescent lineages in the HVS-I network for R0a1a, as a simple, unbiased measure of diversity, is only 64.4% of that for Arabian lineages. hus R0a1 most likely entered Arabia by 26 ka, with the few northern Near Eastern lineages due to recent gene low from Arabia into the Fertile Crescent. We need to recall this when we consider the founder analysis, below.
Similarly, R0a2’3, at ~21 ka, most likely has an Arabian ancestry. R0a3 is a minor Late Glacial Arabian subclade that sits alongside a paraphyletic Iranian lineage (shared with an Egyptian in the HVS-I dataset). As with R0a1a, Iranian HVS-I lineages within the major R0a2 are broadly a subset of Arabian diversity, with a number of ances-tral haplotypes at elevated frequencies (Fig. S1). his may be explained by sporadic gene low across the Gulf, but some Iranian lineages (along with lineages found further east in Pakistan) may also represent gene low along the maritime trading networks which intensiied in the mid- to late Holocene34. here is also a subclade, R0a1a1a,
Uncorre
cted
pro
of
www.nature.com/scientificreports/
3Scientific RepoRts | 6:25472 | DOI: 10.1038/srep25472
dating to ~3.5 ka (part of a larger clade, R0a1a1, that is also largely restricted to Yemen, dating to 10.3 ka), asso-ciated with the settlement of the island of Socotra, which may also have been part of a wider process of increased maritime activity and exchange35.
Similarly to R0a1a, if we examine R0a2 lineages from the Levant as a potential source pool, although some are ambiguous, more than a third of the R0a Druze in the HVS-I network (Fig. S1) belong to a derived largely European subclade (R0a2r), dating to ~12 ka (younger than the Arabian expansions); one belongs to a European cluster; and several to Arabian clusters. Again, of four Syrian lineages in the database, one belongs to the European/Druze R0a2r, one to the diverse Arabian subclade R0a2f (which also includes more than a third of Iraqi lineages at its tip), and one to R0a1a7, the most frequent in Yemen according to the HVS-I network, with derived lineages in Pakistan and possibly also Oman (Fig. S1). his phylogeographic pattern is markedly distinct from that in R0a5, for example. A comparison of overall ρ in HVS-I for putative R0a2 lineages (although much less clearly distinguished in the network) shows that the ρ value for the Fertile Crescent is below (albeit closer: 95.6%) that of the Arabian lineages. Again, the best explanation is an Arabian source for the Levantine lineages, in some cases as a result of sporadic gene low, but for the majority due to Late Glacial expansions through the Levant into Mediterranean Europe, as we discuss further below. his once again suggests a Glacial arrival in Arabia, by 26 ka, although in this case the existence of the Levantine/European R0a2r subclade may suggest that we should not
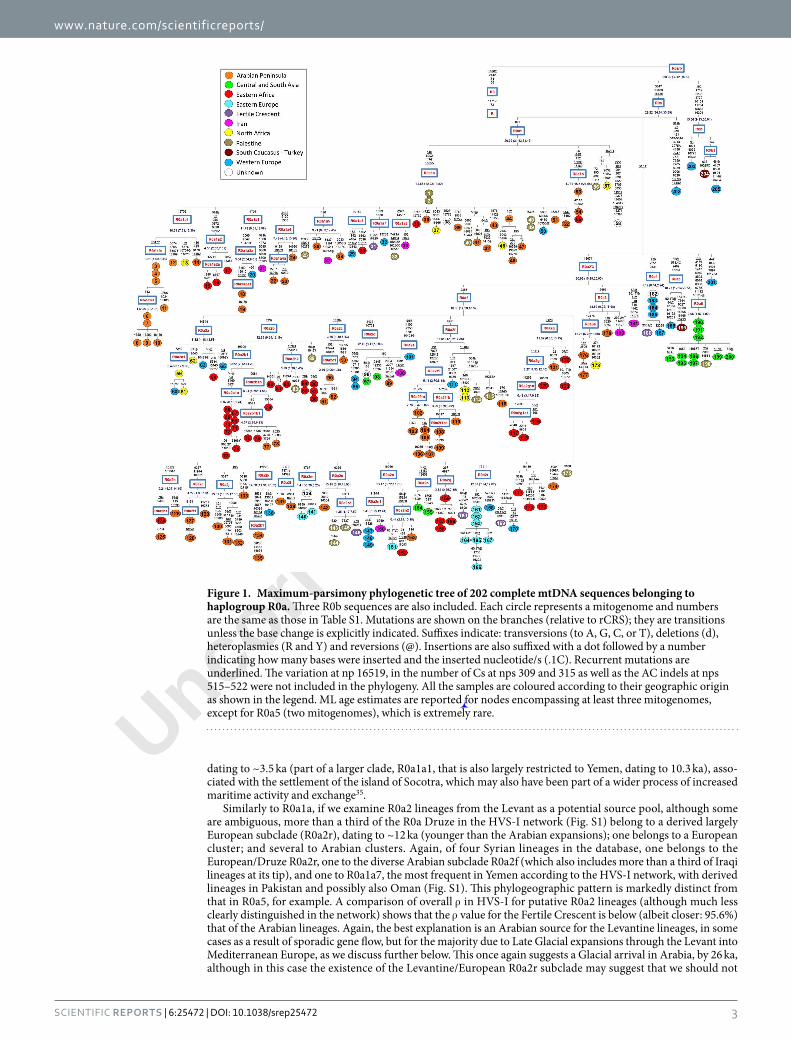
Figure 1. Maximum-parsimony phylogenetic tree of 202 complete mtDNA sequences belonging to haplogroup R0a. hree R0b sequences are also included. Each circle represents a mitogenome and numbers are the same as those in Table S1. Mutations are shown on the branches (relative to rCRS); they are transitions unless the base change is explicitly indicated. Suixes indicate: transversions (to A, G, C, or T), deletions (d), heteroplasmies (R and Y) and reversions (@). Insertions are also suixed with a dot followed by a number indicating how many bases were inserted and the inserted nucleotide/s (.1C). Recurrent mutations are underlined. he variation at np 16519, in the number of Cs at nps 309 and 315 as well as the AC indels at nps 515–522 were not included in the phylogeny. All the samples are coloured according to their geographic origin as shown in the legend. ML age estimates are reported for nodes encompassing at least three mitogenomes, except for R0a5 (two mitogenomes), which is extremely rare.
Uncorre
cted
pro
of
www.nature.com/scientificreports/
4Scientific RepoRts | 6:25472 | DOI: 10.1038/srep25472
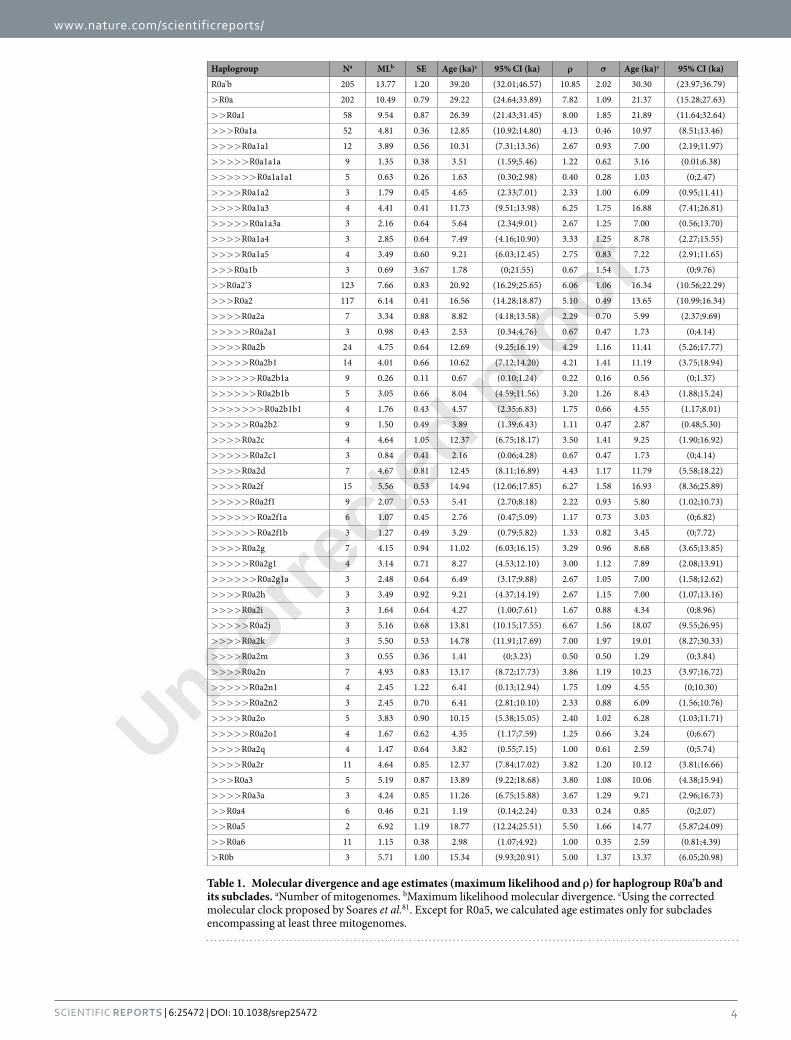
Haplogroup Na MLb SE Age (ka)c 95% CI (ka) ρ σ Age (ka)c 95% CI (ka)
R0a’b 205 13.77 1.20 39.20 (32.01;46.57) 10.85 2.02 30.30 (23.97;36.79)
> R0a 202 10.49 0.79 29.22 (24.64;33.89) 7.82 1.09 21.37 (15.28;27.63)
> > R0a1 58 9.54 0.87 26.39 (21.43;31.45) 8.00 1.85 21.89 (11.64;32.64)
> > > R0a1a 52 4.81 0.36 12.85 (10.92;14.80) 4.13 0.46 10.97 (8.51;13.46)
> > > > R0a1a1 12 3.89 0.56 10.31 (7.31;13.36) 2.67 0.93 7.00 (2.19;11.97)
> > > > > R0a1a1a 9 1.35 0.38 3.51 (1.59;5.46) 1.22 0.62 3.16 (0.01;6.38)
> > > > > > R0a1a1a1 5 0.63 0.26 1.63 (0.30;2.98) 0.40 0.28 1.03 (0;2.47)
> > > > R0a1a2 3 1.79 0.45 4.65 (2.33;7.01) 2.33 1.00 6.09 (0.95;11.41)
> > > > R0a1a3 4 4.41 0.41 11.73 (9.51;13.98) 6.25 1.75 16.88 (7.41;26.81)
> > > > > R0a1a3a 3 2.16 0.64 5.64 (2.34;9.01) 2.67 1.25 7.00 (0.56;13.70)
> > > > R0a1a4 3 2.85 0.64 7.49 (4.16;10.90) 3.33 1.25 8.78 (2.27;15.55)
> > > > R0a1a5 4 3.49 0.60 9.21 (6.03;12.45) 2.75 0.83 7.22 (2.91;11.65)
> > > R0a1b 3 0.69 3.67 1.78 (0;21.55) 0.67 1.54 1.73 (0;9.76)
> > R0a2’3 123 7.66 0.83 20.92 (16.29;25.65) 6.06 1.06 16.34 (10.56;22.29)
> > > R0a2 117 6.14 0.41 16.56 (14.28;18.87) 5.10 0.49 13.65 (10.99;16.34)
> > > > R0a2a 7 3.34 0.88 8.82 (4.18;13.58) 2.29 0.70 5.99 (2.37;9.69)
> > > > > R0a2a1 3 0.98 0.43 2.53 (0.34;4.76) 0.67 0.47 1.73 (0;4.14)
> > > > R0a2b 24 4.75 0.64 12.69 (9.25;16.19) 4.29 1.16 11.41 (5.26;17.77)
> > > > > R0a2b1 14 4.01 0.66 10.62 (7.12;14.20) 4.21 1.41 11.19 (3.75;18.94)
> > > > > > R0a2b1a 9 0.26 0.11 0.67 (0.10;1.24) 0.22 0.16 0.56 (0;1.37)
> > > > > > R0a2b1b 5 3.05 0.66 8.04 (4.59;11.56) 3.20 1.26 8.43 (1.88;15.24)
> > > > > > > R0a2b1b1 4 1.76 0.43 4.57 (2.35;6.83) 1.75 0.66 4.55 (1.17;8.01)
> > > > > R0a2b2 9 1.50 0.49 3.89 (1.39;6.43) 1.11 0.47 2.87 (0.48;5.30)
> > > > R0a2c 4 4.64 1.05 12.37 (6.75;18.17) 3.50 1.41 9.25 (1.90;16.92)
> > > > > R0a2c1 3 0.84 0.41 2.16 (0.06;4.28) 0.67 0.47 1.73 (0;4.14)
> > > > R0a2d 7 4.67 0.81 12.45 (8.11;16.89) 4.43 1.17 11.79 (5.58;18.22)
> > > > R0a2f 15 5.56 0.53 14.94 (12.06;17.85) 6.27 1.58 16.93 (8.36;25.89)
> > > > > R0a2f1 9 2.07 0.53 5.41 (2.70;8.18) 2.22 0.93 5.80 (1.02;10.73)
> > > > > > R0a2f1a 6 1.07 0.45 2.76 (0.47;5.09) 1.17 0.73 3.03 (0;6.82)
> > > > > > R0a2f1b 3 1.27 0.49 3.29 (0.79;5.82) 1.33 0.82 3.45 (0;7.72)
> > > > R0a2g 7 4.15 0.94 11.02 (6.03;16.15) 3.29 0.96 8.68 (3.65;13.85)
> > > > > R0a2g1 4 3.14 0.71 8.27 (4.53;12.10) 3.00 1.12 7.89 (2.08;13.91)
> > > > > > R0a2g1a 3 2.48 0.64 6.49 (3.17;9.88) 2.67 1.05 7.00 (1.58;12.62)
> > > > R0a2h 3 3.49 0.92 9.21 (4.37;14.19) 2.67 1.15 7.00 (1.07;13.16)
> > > > R0a2i 3 1.64 0.64 4.27 (1.00;7.61) 1.67 0.88 4.34 (0;8.96)
> > > > > R0a2j 3 5.16 0.68 13.81 (10.15;17.55) 6.67 1.56 18.07 (9.55;26.95)
> > > > R0a2k 3 5.50 0.53 14.78 (11.91;17.69) 7.00 1.97 19.01 (8.27;30.33)
> > > > R0a2m 3 0.55 0.36 1.41 (0;3.23) 0.50 0.50 1.29 (0;3.84)
> > > > R0a2n 7 4.93 0.83 13.17 (8.72;17.73) 3.86 1.19 10.23 (3.97;16.72)
> > > > > R0a2n1 4 2.45 1.22 6.41 (0.13;12.94) 1.75 1.09 4.55 (0;10.30)
> > > > > R0a2n2 3 2.45 0.70 6.41 (2.81;10.10) 2.33 0.88 6.09 (1.56;10.76)
> > > > R0a2o 5 3.83 0.90 10.15 (5.38;15.05) 2.40 1.02 6.28 (1.03;11.71)
> > > > > R0a2o1 4 1.67 0.62 4.35 (1.17;7.59) 1.25 0.66 3.24 (0;6.67)
> > > > R0a2q 4 1.47 0.64 3.82 (0.55;7.15) 1.00 0.61 2.59 (0;5.74)
> > > > R0a2r 11 4.64 0.85 12.37 (7.84;17.02) 3.82 1.20 10.12 (3.81;16.66)
> > > R0a3 5 5.19 0.87 13.89 (9.22;18.68) 3.80 1.08 10.06 (4.38;15.94)
> > > > R0a3a 3 4.24 0.85 11.26 (6.75;15.88) 3.67 1.29 9.71 (2.96;16.73)
> > R0a4 6 0.46 0.21 1.19 (0.14;2.24) 0.33 0.24 0.85 (0;2.07)
> > R0a5 2 6.92 1.19 18.77 (12.24;25.51) 5.50 1.66 14.77 (5.87;24.09)
> > R0a6 11 1.15 0.38 2.98 (1.07;4.92) 1.00 0.35 2.59 (0.81;4.39)
> R0b 3 5.71 1.00 15.34 (9.93;20.91) 5.00 1.37 13.37 (6.05;20.98)
Table 1. Molecular divergence and age estimates (maximum likelihood and ρ) for haplogroup R0a’b and its subclades. aNumber of mitogenomes. bMaximum likelihood molecular divergence. cUsing the corrected molecular clock proposed by Soares et al.81. Except for R0a5, we calculated age estimates only for subclades encompassing at least three mitogenomes.
Uncorre
cted
pro
of
www.nature.com/scientificreports/
5Scientific RepoRts | 6:25472 | DOI: 10.1038/srep25472
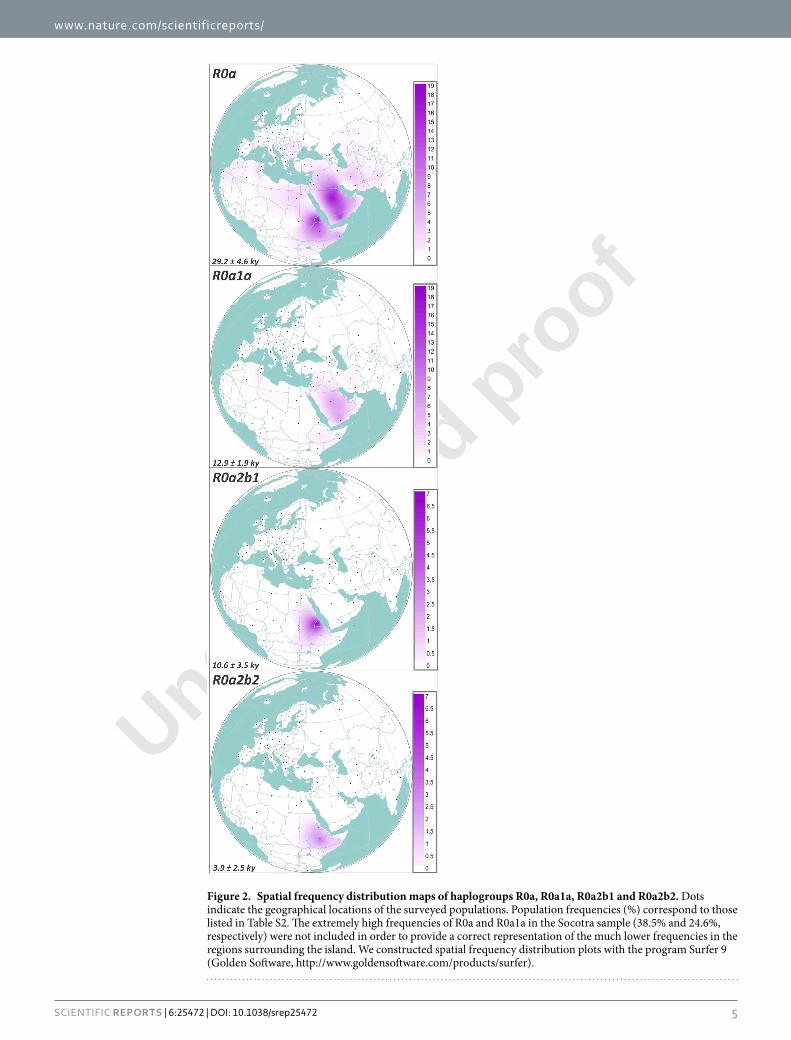
Figure 2. Spatial frequency distribution maps of haplogroups R0a, R0a1a, R0a2b1 and R0a2b2. Dots indicate the geographical locations of the surveyed populations. Population frequencies (%) correspond to those listed in Table S2. he extremely high frequencies of R0a and R0a1a in the Socotra sample (38.5% and 24.6%, respectively) were not included in order to provide a correct representation of the much lower frequencies in the regions surrounding the island. We constructed spatial frequency distribution plots with the program Surfer 9 (Golden Sotware, http://www.goldensotware.com/products/surfer).

Uncorre
cted
pro
of
www.nature.com/scientificreports/
6Scientific RepoRts | 6:25472 | DOI: 10.1038/srep25472
completely rule out a source in a Levantine refugium and Later Glacial expansions into Arabia as an alternative possibility.
With this caveat, this overall pattern strongly suggests that R0a1 and R0a2’3 both entered Arabia before or around the LGM and that the R0a1b/R0a1* and R0a3/R0a2’3* lineages are relicts that were not caught up to the same extent in the Late Glacial expansions that followed the LGM. his conclusion is further supported by the Bayesian skyline plots (BSPs) and reciprocal founder analyses detailed below.
Expansions of R0a1 and R0a2’3 lineages. he conclusion is strengthened by the distribution of the remaining lineages within each subclade. R0a1a encompasses at least eight major subclades (R0a1a1–8; R0a1a5–8 newly reported), and many paraphyletic lineages. Levantine lineages belong mainly to Negev desert Bedouin and Palestinians. he Bedouin have an Arabian Peninsula ancestry, and genome-wide PCA and ADMIXTURE analyses indicate that Palestinians too are more similar to Arabian populations than to other Levantine popula-tions, and likely have substantial Arabian ancestry36,37. here is a single small Ethiopian subclade, R0a1a2, dating to ~5 ka but diverging directly from the R0a1a root, and several sporadic singleton Horn lineages, but the vast majority of African R0a lineages fall within R0a2.
he larger R0a2 dates to ~16 ka, with 18 derived subclades which coalesce mainly to the Late Glacial, ~13 and 15 ka (Table 1). he Bølling-Allerød interstadial began ~14.7 ka38, and is associated with de-glaciation in Europe and a wet phase in the Near East/Arabia, which might have facilitated movements of hunter-gatherers into pre-viously arid areas39. here are two major Eastern African subclades, R0a2b and R0a2g, dating to ~13 and ~11 ka respectively, and several minor ones, one of similar age and another of which dates to ~4 ka but again diverges basally from R0a2. here is also a major Late Glacial subclade, R0a2r, found in southern Europeans but with two basal Druze lineages (from Israel and Lebanon); and several very minor subclades pointing to dispersals into Eastern Europe and Iran/Pakistan.
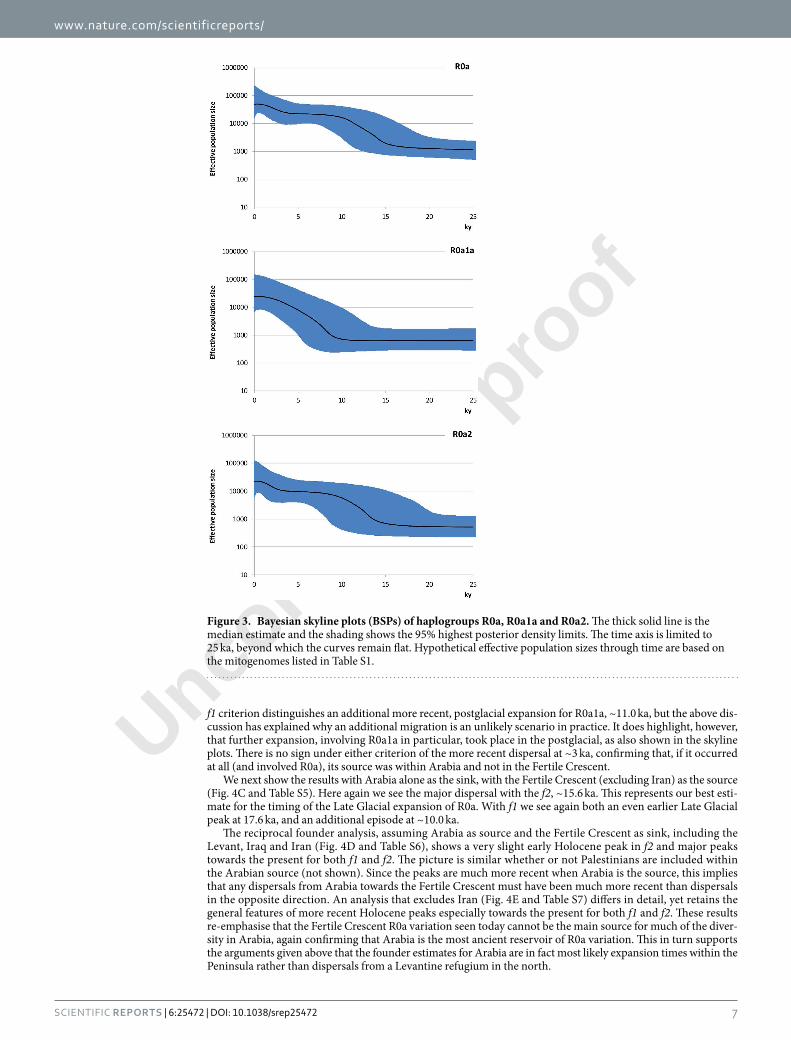
he BSPs (Fig. 3) show that these coalescences correspond to two major phases of population growth amongst R0a lineages in both the Late Glacial – the Bølling-Allerød interstadial (R0a2) – and the immediate postglacial, ater the Younger Dryas (R0a1a). he BSP for R0a as a whole points to a major episode of ~12-fold growth from ~16 ka until ~10 ka, with a more recent episode of ~20-fold growth at ~3 ka. he separate plots show that whilst the growth of R0a2 overlaps with R0a overall, R0a1a was involved in a subsequent population expansion, in the early postglacial warming period following the Younger Dryas glacial relapse, ~11.5 ka. he inding of distinct demographic histories for R0a1a and R0a2 suggests that they may at one time have characterized diferent popu-lations, possibly even dispersing from separate glacial refugial areas.
BSPs based on geographic origin (Fig. S2) conirmed a primary Bølling-Allerød expansion, with an additional expansion restricted to the Arabian Peninsula ~3 ka (shadowed in Eastern Africa). he plots also suggest that the earliest major signal of Late Glacial expansion was in Arabia, beginning ~17 ka, rather than in the Fertile Crescent (~14 ka), once again supporting an Arabian source. here is no independent expansion signature in Eastern Africa.
Major dispersal episodes: founder analysis. In order to date and quantify the main dispersal episodes, we performed a founder analysis on the mitogenome data. his identiies “founder sequences” shared between two populations as potential evidence for gene low between the two populations. In this case, however, this poses a problem, since we have seen above that we cannot uniquely identify a source population, and that most if not all of the Levantine and Iranian lineages in the major subclades are likely due to subsequent gene low. (his is almost certainly the case also for most of the Mediterranean and North African lineages within R0a1 and R0a2’3.) Nevertheless, we performed the analysis assuming a northern source, in order to provide the most conservative estimate for the age of Arabian lineages. Although this assumption almost certainly doesn’t hold for R0a1a and probably also for R0a2, the analysis can still provide a clear picture of the main expansion episodes, to comple-ment the skyline plots.
We therefore assumed a source in the Fertile Crescent, including the Levant and Iraq, both with and without Iran, in order to explore further the pattern in Arabia and to quantify and date subsequent dispersals into the Horn of Africa, Europe and South Asia, including Arabia in the source when assessing dispersals into Eastern Africa (Tables S3–S9, Fig. 4). We included Levantine Bedouin ad Palestinian lineages as part of the Arabian sam-ple, as discussed above.
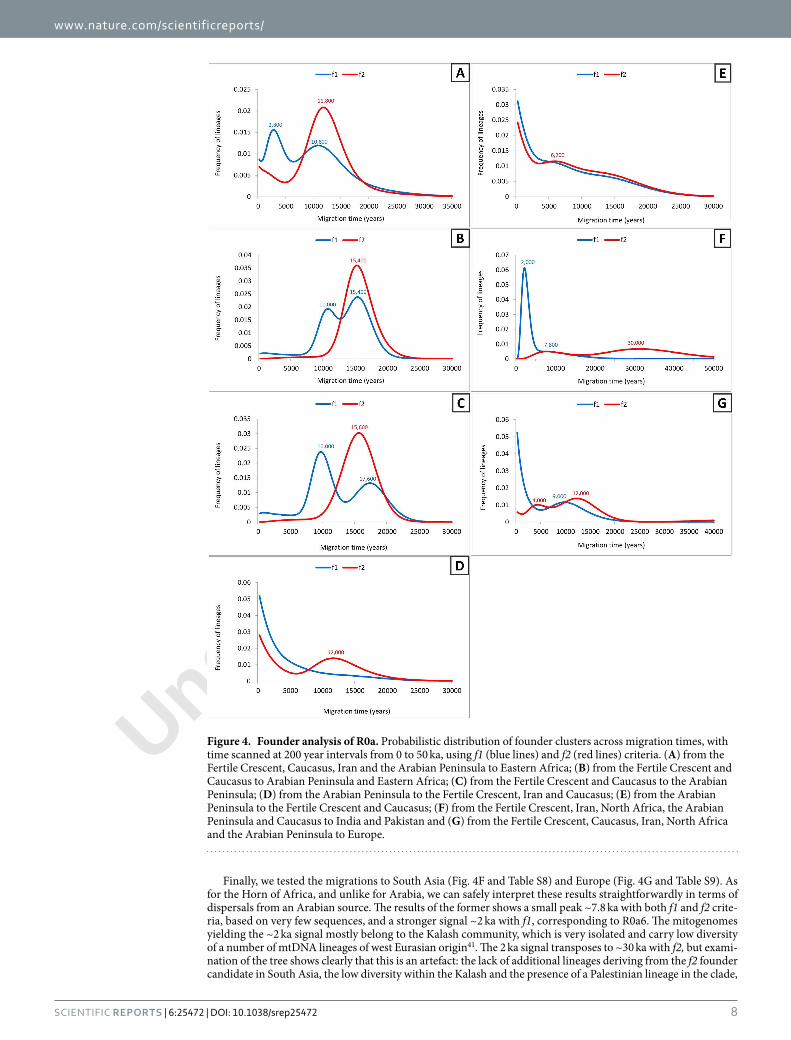
First, we show Eastern Africa alone as the sink (Fig. 4A and Table S3), with the whole of Southwest Asia as the source. Here there is no Late Glacial peak, but rather a clear signal right at the start of the Holocene with both criteria: 11.8 ka with f2 and 10.8 with f1. With f2, this is the sole signal, but with f1 there is a second, more recent peak at 2.8 ka. he diference occurs in R0a2b, which is classed as a single African founder by the f2 criterion, whereas R0a2b2 is classed as a distinct founder dating to 2.9 ka with f1. his lineage has been elevated to high frequency (10.3–12.5%, the most frequent lineage) in Ethiopian Jews against a genome-wide background that is almost identical to other Ethiopians, and it is not seen in Yemeni Jews, where an Arabian lineage within R0a2c is seen at even higher frequency22,40 instead. Because of this, despite the supericial conirmation of the ~3 ka migration inferred from autosomal studies, we should be cautious of taking the f1 result at face value. It may be that this population has subsequently experienced gene low back towards the Levant, and that this is the reason for identifying the migration with f1 that is screened out with the more stringent f2. However, given the inferences of substantial later northwards gene low discussed above, we consider f2 the more plausible criterion for this dataset, at least regarding the settlement of Arabia. Nevertheless, some gene low ~3 ka is possible, especially given the strong growth signal around this time in the Arabian BSP, and may also be indicated by mtDNA haplogroup HV1 (see Discussion).
We next show the results when Eastern Africa and Arabia are combined into a single sink population (Fig. 4B and Table S4). he f2 criterion indicates a single Late Glacial expansion at ~15.4 ka, involving all R0a lineages. he
Uncorre
cted
pro
of
www.nature.com/scientificreports/
7Scientific RepoRts | 6:25472 | DOI: 10.1038/srep25472
f1 criterion distinguishes an additional more recent, postglacial expansion for R0a1a, ~11.0 ka, but the above dis-cussion has explained why an additional migration is an unlikely scenario in practice. It does highlight, however, that further expansion, involving R0a1a in particular, took place in the postglacial, as also shown in the skyline plots. here is no sign under either criterion of the more recent dispersal at ~3 ka, conirming that, if it occurred at all (and involved R0a), its source was within Arabia and not in the Fertile Crescent.
We next show the results with Arabia alone as the sink, with the Fertile Crescent (excluding Iran) as the source (Fig. 4C and Table S5). Here again we see the major dispersal with the f2, ~15.6 ka. his represents our best esti-mate for the timing of the Late Glacial expansion of R0a. With f1 we see again both an even earlier Late Glacial peak at 17.6 ka, and an additional episode at ~10.0 ka.
he reciprocal founder analysis, assuming Arabia as source and the Fertile Crescent as sink, including the Levant, Iraq and Iran (Fig. 4D and Table S6), shows a very slight early Holocene peak in f2 and major peaks towards the present for both f1 and f2. he picture is similar whether or not Palestinians are included within the Arabian source (not shown). Since the peaks are much more recent when Arabia is the source, this implies that any dispersals from Arabia towards the Fertile Crescent must have been much more recent than dispersals in the opposite direction. An analysis that excludes Iran (Fig. 4E and Table S7) difers in detail, yet retains the general features of more recent Holocene peaks especially towards the present for both f1 and f2. hese results re-emphasise that the Fertile Crescent R0a variation seen today cannot be the main source for much of the diver-sity in Arabia, again conirming that Arabia is the most ancient reservoir of R0a variation. his in turn supports the arguments given above that the founder estimates for Arabia are in fact most likely expansion times within the Peninsula rather than dispersals from a Levantine refugium in the north.
Figure 3. Bayesian skyline plots (BSPs) of haplogroups R0a, R0a1a and R0a2. he thick solid line is the median estimate and the shading shows the 95% highest posterior density limits. he time axis is limited to 25 ka, beyond which the curves remain lat. Hypothetical efective population sizes through time are based on the mitogenomes listed in Table S1.
Uncorre
cted
pro
of
www.nature.com/scientificreports/
8Scientific RepoRts | 6:25472 | DOI: 10.1038/srep25472
Finally, we tested the migrations to South Asia (Fig. 4F and Table S8) and Europe (Fig. 4G and Table S9). As for the Horn of Africa, and unlike for Arabia, we can safely interpret these results straightforwardly in terms of dispersals from an Arabian source. he results of the former shows a small peak ~7.8 ka with both f1 and f2 crite-ria, based on very few sequences, and a stronger signal ~2 ka with f1, corresponding to R0a6. he mitogenomes yielding the ~2 ka signal mostly belong to the Kalash community, which is very isolated and carry low diversity of a number of mtDNA lineages of west Eurasian origin41. he 2 ka signal transposes to ~30 ka with f2, but exami-nation of the tree shows clearly that this is an artefact: the lack of additional lineages deriving from the f2 founder candidate in South Asia, the low diversity within the Kalash and the presence of a Palestinian lineage in the clade,
Figure 4. Founder analysis of R0a. Probabilistic distribution of founder clusters across migration times, with time scanned at 200 year intervals from 0 to 50 ka, using f1 (blue lines) and f2 (red lines) criteria. (A) from the Fertile Crescent, Caucasus, Iran and the Arabian Peninsula to Eastern Africa; (B) from the Fertile Crescent and Caucasus to Arabian Peninsula and Eastern Africa; (C) from the Fertile Crescent and Caucasus to the Arabian Peninsula; (D) from the Arabian Peninsula to the Fertile Crescent, Iran and Caucasus; (E) from the Arabian Peninsula to the Fertile Crescent and Caucasus; (F) from the Fertile Crescent, Iran, North Africa, the Arabian Peninsula and Caucasus to India and Pakistan and (G) from the Fertile Crescent, Caucasus, Iran, North Africa and the Arabian Peninsula to Europe.

Uncorre
cted
pro
of
www.nature.com/scientificreports/
9Scientific RepoRts | 6:25472 | DOI: 10.1038/srep25472
all point to the more recent introduction of the rare R0a6, suggesting that it may have been insuiciently sampled in Southwest Asia.
he results for Europe also suggest a primary dispersal into Southeast and Mediterranean Europe at the end of the Pleistocene/early Holocene, mainly involving R0a2r, with the signal a little earlier with f2 than f1. his may have been via a Levantine refugium, given the presence of basal Druze lineages in the cluster (and a Syrian in the HVS-I data). It recalls the patterns detected in a much larger fraction of haplogroup J and T lineages that dis-persed from an inferred Levantine refugium along the Mediterranean ater the LGM42. Some lineages may have dispersed later in the Holocene, but this is unclear given the small sample size (R0a occurs amongst Europeans at a rate of only 0.8%).
Discussionevidence for glacial refugia in Arabia. he earliest settlement of Arabia by modern humans and its role in modern human dispersals out of Africa remains controversial43, although the consensus genetic estimate for the timing remains ~50–60 ka. We have argued for a “southern-route” dispersal out of Africa via Arabia at this time, since a Levantine source for all non-Africans would imply that basal non-African mtDNA diversity should be highest in the Near East, whereas the highest diversity is rather seen in South Asia30,44,45. A model of this kind – albeit, inevitably, with further complexity – is supported by the high productivity of ancient coastlines46–48. Autosomal dating has been used to suggest an earlier date49, and both qualitative arguments50 and simulations51 have been used to propose that the age of non-African mitogenomes might be older than the ~50–60 ka usually estimated52. However, these assertions are based on lines of reasoning that draw their estimates from inappropri-ately old population splits or ignore the phylogenetic and phylogeographic structure of mtDNA, where inferences are made from a hierarchy of nesting relationships, analogous to a stratigraphy, rather than simple haplogroup ages as oten assumed by critics45,53,54. he model of a southern-route dispersal at ~50–60 ka has recently received strong support from an analysis of 104 complete genomes from Arabia55. hese results are congruent with the most comprehensive mitogenome analyses that also stress the complexity of Arabian demographic history15,56, and with recent ancient DNA analyses57,58, although contrary to one rather idiosyncratic reanalysis of mitog-enome data that minimises the role of Arabia59. Potential earlier dispersals identiied from archaeological evi-dence51 therefore seem unlikely to have contributed substantially to the extant gene pool of the region. However, this is a topic that clearly requires much greater discussion, beyond the scope of the present article.
he earliest non-African ancestor of R0a, the root of haplogroup R, dates to ~59 ka, and may (in line with the arguments summarised in the preceding paragraph) have originated in the Gulf Oasis soon ater the dispersal of modern humans from Eastern Africa3. Its more immediate ancestor, R0a’b, dates to ~40 ka and its earliest branches have a relict distribution around the Mediterranean/Near East. We have identiied several new minor sister subclades to the main R0a branches, and these too have a similar distribution.
Nevertheless, multiple lines of evidence suggest that the major R0a subclades had entered Arabia and begun diversifying before the Last Glacial Maximum. his is in accord with evidence from rock art in Northern Arabia that the Neolithic pastoral economy was adopted by hunter–gatherers, rather than introduced by dispersing agri-culturalists from the Near East60. However, there is little archaeological evidence for the presence of human pop-ulations in Arabia across the LGM, when environmental conditions were extremely poor61,62, suggesting that they survived, if at all, in glacial refugia. Rose29 proposed three potential “oases” in Arabia. Most attention has been given to the Gulf Oasis in the east which, as mentioned above, may have incubated early modern humans shortly ater their initial move out of Africa. However, there are two further candidates – the South Arabian refugium in the Dhofar highlands and eastern Yemen-Oman coastal zone, and the Red Sea coastal plain29. It seems likely that one or both of these were refugia for early Arabian hunter-gatherer groups carrying predominantly R0a1 and R0a2’3, and from which R0a1a and R0a2, in particular, expanded ater the LGM. It is tempting to speculate that R0a2’3 may have sheltered in the Red Sea refugium, given the very early postglacial dispersals of R0a2 subclades both into the Horn of Africa and into southern Europe, likely via the Levant. Further work should enable us to test this hypothesis more precisely.
R0a1a began its dramatic expansions ~12 ka and is now seen mainly in the southern part of the Arabian Peninsula, such as Yemen and the island of Socotra, where it displays a more recent frequency peak approaching 40%35. However, the irst major expansions in Arabia were earlier, in the early Late Glacial period, and involved R0a2. Intriguingly, both expansions predate the early Holocene onset of pluvial conditions in the Peninsula63, and perhaps involved coastal regions now under water. Furthermore, R0a2 lineages expanded much further aield, across the Red Sea and into the Horn of Africa, in the immediate postglacial warming period, so that the present-day R0a frequency in parts of the Horn approaches 20%. his supports the pre-agricultural gene low recently inferred from genome-wide data10, and may be linked to the establishment of obsidian exchange networks across the Red Sea in the early Holocene64,65. Both sets of analyses contrast with the previously estab-lished scenario that most of the non-African ancestry in the Horn is the result of admixture ~3 ka11,12. However, Hodgson et al.10 argue cogently that genome-wide dating methods based on linkage disequilibrium are strongly biased in favour of recent admixture events (see also15), and propose a deep Pleistocene ancestry for the Eurasian admixture, dating back as much as 23 ka. On the other hand, they and others11 also propose that the Eurasian admixture in the Horn came from the northeast, rather than from Arabia.
However, the limitations to current genome-wide analyses extend beyond the timing of dispersals to the iden-tiication of source populations, which can oten be clariied on the basis of the phylogenetic nesting relation-ships identiiable with the non-recombining marker systems. In fact, the mtDNA evidence clearly indicates that Eurasian admixture in the Horn indeed occurred several times, and from several distinct sources. In addition to R0a, there are four other potentially Eurasian ancient mtDNA clades in Eastern Africa: M1a, U6a, HV1 and N1a1a, which together with R0a make up 30% of Ethiopian lineages in our control-region database (n = 169).
Uncorre
cted
pro
of
www.nature.com/scientificreports/
1 0Scientific RepoRts | 6:25472 | DOI: 10.1038/srep25472
here is also a smattering of “accidental” lineages (7%) that most likely arrived within the last few centuries, so about 81% of the Eurasian lineages in Ethiopia are potentially ancient.
However, aside from R0a, only one other haplogroup is likely to indicate a Pleistocene dispersal from Arabia: N1a1a3. N1a1a3 dates to ~15.2 ka and N1a1a4 to only 850 years, but both diverge directly from the N1a1a root, which dates to ~25 ka, with the only closely related lineages seen in Arabia – a clearly similar pattern to R0a. HV1b1 in the Horn also has a Yemen source and dates to ~8.2 ka, leading to the suggestion of an early Holocene movement18, but it is interleaved with Yemeni lineages in the tree, suggesting that it may have arrived more recently. A very approximate founder age estimate suggests an arrival ~5 ka.
More frequent even than R0a in the Horn is M1a, thought to have arrived during the Late Glacial16. here are few lineages from which to estimate an arrival time, but M1a1c’d dates to ~12.0 ka. However, M1a probably arrived via Egypt rather than Yemen44. Another North African/Mediterranean lineage, haplogroup U6a, again has a likely source in Egypt/Near East44,66, but U6a2a1 in the Horn dates to ~4.0 ka.
In summary there were several late Pleistocene arrivals, from both North Africa/Levant and from Arabia, and similarly there seem likely to have been several mid-Holocene arrivals, again from both sources. Overall, about 62% of the Eurasian lineages probably arrived in Ethiopia during the Pleistocene (~33% from Arabia and ~29% from the north), with ~19% in the mid-Holocene (but half from Arabia and half from the north), with the remaining ~19% likely very recent. Potentially, all of these diferent ages are conlated into the autosomal admix-ture estimate of 3 ka.
Our results do indicate population growth within Arabia at ~3 ka, which may be implicated in a late Holocene range expansion across the Arabian Sea involving perhaps HV1, and perhaps also of R0a1a1a lineages into the island of Socotra, where the age of the R0a1a1 lineages date to the same timeframe35. Populations survived along the southeast Arabian coast during the extreme aridity of the so-called “Dark Millennium” ater 5.9 ka and may have prospered as climatic conditions improved again in the Arabian Bronze Age. Although there is less evidence from Yemen, this phase saw marked re-settlement of southeast Arabia during the Hait phase of oasis agriculture ater 5.1 ka67, and a similar trajectory seems likely to have taken place to the west.
he return to more pluvial conditions in Eastern Africa appears to have been later, ~4 ka68, matching esti-mates for the establishment of Ethiosemitic languages in the Horn14. It also coincides with the appearance of the poorly-known literate Daamat-Di’amat polity in northern Ethiopia/Eritrea, which extended from roughly 850–350 BC, and has long been thought to show signs of Arabian inluence69. However, some recent archaeo-logical studies have downplayed the extent of Arabian inluence and consider large-scale migration at this time unlikely, more in line with the evidence that we present here70. here may have been some minor gene low due to the intensiication of maritime trading networks that had begun around this time34,69, also indicated by the appearance of R0a lineage around the Indian Ocean as far as India. But the main episodes of Arabian settlement in the Horn occurred much earlier, at the end of the Ice Age.
subjects and MethodsWe identiied candidate R0a mtDNAs by surveying control-region mutational motifs of ~10,000 subjects of var-ious geographic origins (Africa, East and South Asia, the Near East, Caucasus and Europe) whose DNA was available in the laboratories participating in this study. For all subjects, we obtained appropriate written informed consent, and the research was reviewed and approved by the Ethics Committee for Clinical Experimentation of the University of Pavia (Italy), board minutes of April 11th 2013. All experiments were performed in accordance with relevant guidelines and regulations.
We PCR-ampliied 54 candidate R0a mtDNAs, selected on the basis of the presence of the diagnostic R0a control-region motif, and completely sequenced them following a well-established Sanger protocol71. We aligned, assembled, and compared them using Sequencher 5.0 (Gene Codes Corporation) relative to both the Revised Sapiens Reference Sequence (RSRS)33 and the revised Cambridge Reference Sequence (rCRS)72. We also identi-ied and sequenced two candidate R0b mtDNAs, following the same approach.
We furthermore sequenced five additional candidate R0a mtDNAs (from the Csangos and Szekelys of Romania, see73 for sampling) using massively parallel sequencing. We enriched these mitogenomes in 62 midi-sized amplicons, puriied them using AMPure XP beads (Beckman Coulter, Inc., Brea, CA, USA) and obtained MiSeq libraries using the Nextera XT DNA Sample preparation kit74. We performed MPS using the Illumina MiSeq benchtop sequencer (Illumina, San Diego, CA, USA) following the manufacturer’s recommen-dations. We analysed MiSeq-generated sequences using the NextGENe sotware (SotGenetics, State College, PA, USA) and assessed them relative to both the internal MiSeq Reporter results and the corresponding control-region sequences73. We clariied remaining inconsistencies by Sanger sequencing to forensic quality standards75.
We analysed the 61 novel mitogenomes alongside 143 R0a (and one R0b) whole-mtDNA sequences already available in public databases. Geographic and/or ethnic ailiations of the 202 R0a mtDNAs, as well as their acces-sion numbers are listed in Table S1, together with the two novel and one previously reported76 R0b mitogenomes. For the construction of the R0a phylogeny we employed a maximum parsimony approach with the aid of the mtPhyl sotware (http://eltsov.org/mtphyl.aspx), correcting the tree by hand with reference to PhyloTree (Build 17)77. A new haplogroup label was assigned following the established nomenclature only when the candidate haplogroup encompassed at least two haplotypes. We disregarded the unreliable np 60 when identifying clades.
We estimated coalescence times using both maximum likelihood (ML) and the ρ statistic (average distance of the haplotypes of a clade from the respective root haplotype)78 accompanied by a heuristic estimate of the standard error (σ ) calculated from an estimate of the genealogy79. We used PAML 4.580 to obtain ML estimates, assuming the HKY85 mutation model (two parameters in the model of DNA evolution) with γ -distributed rates (approximated by a discrete distribution with 32 categories) and two partitions: coding region (from np 577 to np 16023) and control region (from np 16024 to np 576). We performed these calculations considering all
Uncorre
cted
pro
of
www.nature.com/scientificreports/
1 1Scientific RepoRts | 6:25472 | DOI: 10.1038/srep25472
substitutions except those at np 16519 and the 16182C and 16183C. We converted mutational distances into years using the substitution rate of about one mutation every 3,624 years for the entire mitogenome, and correcting for purifying selection using the calculator provided by Soares et al.81.
We also obtained Bayesian skyline plots (BSPs)82 from BEAST 1.7.483 for haplogroup R0a and its most fre-quent subclades, using a strict molecular clock (lognormal distribution across branches and uncorrelated between them) and a HKY85-type model with γ -distributed rates. BSPs estimate efective population size through time from random sequences of a population. Haplogroups in general do not equate to population data, but the signal associated with a haplogroup might nevertheless signal demographic processes in the populations carrying it, as previously suggested52. To approximate the mutation rate to the one used in previous analyses, we used a U6 sequence (EF064317) as an outgroup44, setting the age of haplogroup R to ~59 ka (95% C.I: 49–69 ka), as an aver-age of previously proposed estimates33,81; plus we considered the age obtained here for R0a as consistent internal calibration points52. Speciically, we ran 50,000,000 iterations, with samples drawn every 10,000 Markov chain Monte Carlo (MCMC) steps, ater a discarded burn-in of 10,000,000 steps, as in Soares et al.52. We considered haplogroup R0a and its major subclades monophyletic in the analyses. We visualized the BSPs obtained in plots with Tracer v1.5 and Excel using a generation time of 25 years.
In order to estimate the times of migrations, we employed founder analysis30. his method assumes a strict division between assumed source and sink populations and two criteria (f1 and f2) for identifying founder sequences to allow as far as possible for homoplasy and back-migrations, by ensuring that sequence matches are not at the tips of the source phylogeny. We thus stipulate that founders must have at least one (f1) or two (f2) derived branches in the source population. We carried out the analysis for R0a using the whole mitogenomes – estimating the age of the migration of each founder using the ρ statistic. However, since the assumptions of the founder method do not allow the use of a time-dependent clock, as usually performed for whole mitogenomes81, we used an approximated linear rate. Given the relatively small diference between the mutation rate for time zero (average 2562 years for a mutation to happen) and the mutation rate for the oldest estimated founder (average 2667 years for a mutation to happen) we used the intermediate value between these (2651 years for a mutation to happen) as an estimate for the overall range, as previously15. We performed the founder analysis in several ways to estimate the arrival times of R0a lineages in diferent continents, in each case performing the analyses with Palestinians included either with Arabian populations, with Fertile Crescent populations or unassigned, and also either including and excluding Iranian lineages from the Fertile Crescent source. We performed the following analyses: (1) from the Near East into Arabia/Eastern Africa; (2) Near East into Arabia; (3) Near East/Arabia into Eastern Africa; (4) Arabia into the Fertile Crescent (a “reciprocal” founder analysis to check the direction of dis-persal: see84; (5) Near East/Arabia into South Asia; (6) Near East/Arabia into Europe. We scanned the distribution of founder ages for each region, deining equally spaced 200-year intervals for each migration from 0 to 50 ka.
We further assessed extant frequencies and geographical distributions of R0a and R0a1a by surveying pub-lished and unpublished datasets (more than 45,000 control-region sequences) for their diagnostic control-region mutational motifs. By searching our in-house database of unpublished sequences, the European DNA Proiling Group Mitochondrial Population Database (EMPOP)85,86, and published control-region sequences (mainly lim-ited to HVS-I), we were able to evaluate a total of more than 100 populations (Table S2). We constructed spatial frequency distribution plots with the program Surfer 9 (Golden Sotware). We extended the search to members of two of the largest subclades restricted mainly to Eastern Africa, R0a2b1 and R0a2b2. Unfortunately, R0a2g, a third essentially African-speciic subclade, does not harbour any diagnostic mutation in the control region, so that its geographic distribution could not be further evaluated. We also constructed a phylogenetic network of the HVS-I variation in R0a’b using the Network package (Fig. S1).
References1. Haak, W. et al. Ancient DNA from the irst European farmers in 7500-year-old Neolithic sites. Science 310, 1016–1018 (2005).2. Perego, U. A. et al. Distinctive Paleo-Indian migration routes from Beringia marked by two rare mtDNA haplogroups. Curr Biol 19,
1–8 (2009).3. Fernandes, V. et al. he Arabian cradle: mitochondrial relicts of the irst steps along the southern route out of Africa. Am J Hum
Genet 90, 347–355 (2012).4. Gomes, V. et al. Mosaic maternal ancestry in the Great Lakes region of East Africa. Human genetics 134, 1013–1027 (2015).5. Levine, D. N. Greater Ethiopia: he Evolution of a Multiethnic Society. (University Of Chicago Press, 2000).6. Cavalli-Sforza, L. L., Menozzi, P. & Piazza, A. he history and geography of human genes. (Princeton University Press, 1994).7. Passarino, G. et al. Different genetic components in the Ethiopian population, identified by mtDNA and Y-chromosome
polymorphisms. Am J Hum Genet 62, 420–434 (1998).8. Ehret, C. he civilizations of Africa: a history to 1800. (University of Virginia Press, 2002).9. Non, A. L., Al-Meeri, A., Raaum, R. L., Sanchez, L. F. & Mulligan, C. J. Mitochondrial DNA reveals distinct evolutionary histories
for Jewish populations in Yemen and Ethiopia. Am J Phys Anthropol 144, 1–10 (2011).10. Hodgson, J. A., Mulligan, C. J., Al-Meeri, A. & Raaum, R. L. Early back-to-Africa migration into the Horn of Africa. PLoS Genet 10,
e1004393 (2014).11. Pagani, L. et al. Ethiopian genetic diversity reveals linguistic stratiication and complex inluences on the Ethiopian gene pool. Am J
Hum Genet 91, 83–96 (2012).12. Pickrell, J. K. et al. Ancient west Eurasian ancestry in southern and eastern Africa. Proc Natl Acad Sci USA 111, 2632–2637 (2014).13. Phillipson, D. W. Ancient Ethiopia: Aksum, Its Predecessors and Successors. (British Museum Press, 1998).14. Kitchen, A., Ehret, C., Assefa, S. & Mulligan, C. J. Bayesian phylogenetic analysis of Semitic languages identiies an Early Bronze Age
origin of Semitic in the Near East. Proc Biol Sci 276, 2703–2710 (2009).15. Fernandes, V. et al. Genetic stratigraphy of key demographic events in Arabia. PloS one 10, e0118625 (2015).16. Pennarun, E. et al. Divorcing the Late Upper Palaeolithic demographic histories of mtDNA haplogroups M1 and U6 in Africa. BMC
Evol Biol 12, 234 (2012).17. Cerný, V. et al. Internal diversiication of mitochondrial haplogroup R0a reveals post-last glacial maximum demographic expansions
in South Arabia. Mol Biol Evol 28, 71–78 (2011).18. Musilová, E. et al. Population history of the Red Sea–genetic exchanges between the Arabian Peninsula and East Africa signaled in
the mitochondrial DNA HV1 haplogroup. Am J Phys Anthropol 145, 592–598 (2011).
Uncorre
cted
pro
of
www.nature.com/scientificreports/
1 2Scientific RepoRts | 6:25472 | DOI: 10.1038/srep25472
19. Cruciani, F. et al. Tracing past human male movements in northern/eastern Africa and western Eurasia: new clues from Y-chromosomal haplogroups E-M78 and J-M12. Mol Biol Evol 24, 1300–1311 (2007).
20. Sanchez, J. J., Hallenberg, C., Børsting, C., Hernandez, A. & Morling, N. High frequencies of Y chromosome lineages characterized by E3b1, DYS19-11, DYS392-12 in Somali males. Eur J Hum Genet 13, 856–866 (2005).
21. Mendez, F. L. et al. Increased resolution of Y chromosome haplogroup T deines relationships among populations of the Near East, Europe, and Africa. Hum Biol 83, 39–53 (2011).
22. homas, M. G. et al. Founding mothers of Jewish communities: geographically separated Jewish groups were independently founded by very few female ancestors. Am J Hum Genet 70, 1411–1420 (2002).
23. Kivisild, T. et al. Ethiopian mitochondrial DNA heritage: tracking gene low across and around the gate of tears. Am J Hum Genet 75, 752–770 (2004).
24. Richards, M. et al. Extensive female-mediated gene low from sub-Saharan Africa into near eastern Arab populations. Am J Hum Genet 72, 1058–1064 (2003).
25. Poloni, E. S. et al. Genetic evidence for complexity in ethnic diferentiation and history in East Africa. Ann Hum Genet 73, 582–600 (2009).
26. Boattini, A. et al. mtDNA variation in East Africa unravels the history of Afro-Asiatic groups. Am J Phys Anthropol 150, 375–385 (2013).
27. Al-Abri, A. et al. Pleistocene-Holocene boundary in Southern Arabia from the perspective of human mtDNA variation. Am J Phys Anthropol 149, 291–298 (2012).
28. Rose, J. I. et al. Tabula rasa or refugia? Using genetic data to assess the peopling of Arabia. Arab Archaeol Epigr 24, 95–101 (2013).29. Rose, J. I. New Light on Human Prehistory in the Arabo-Persian Gulf Oasis. Curr Anthropol 51, 849–883 (2010).30. Richards, M. et al. Tracing European founder lineages in the Near Eastern mtDNA pool. Am J Hum Genet 67, 1251–1276 (2000).31. Richards, M., Macaulay, V., Torroni, A. & Bandelt, H. J. In search of geographical patterns in European mitochondrial DNA. Am J
Hum Genet 71, 1168–1174 (2002).32. Torroni, A., Achilli, A., Macaulay, V., Richards, M. & Bandelt, H. J. Harvesting the fruit of the human mtDNA tree. Trends Genet 22,
339–345 (2006).33. Behar, D. M. et al. A “Copernican” reassessment of the human mitochondrial DNA tree from its root. Am J Hum Genet 90, 675–684
(2012).34. Boivin, N. & Fuller, D. Q. Shell Middens, Ships and Seeds: Exploring Coastal Subsistence, Maritime Trade and the Dispersal of
Domesticates in and Around the Ancient Arabian Peninsula. J World Prehist 22, 113–180 (2009).35. Cerný, V. et al. Out of Arabia-the settlement of island Soqotra as revealed by mitochondrial and Y chromosome genetic diversity. Am
J Phys Anthropol 138, 439–447 (2009).36. Haber, M. et al. Genome-wide diversity in the levant reveals recent structuring by culture. PLoS genetics 9, e1003316 (2013).37. Pala, M., Chaubey, G., Soares, P. & Richards, M. B. he Archaeogenetics of European Ancestry. eLS. doi: 10.1002/9780470015902.
a0024624 (2014).38. hiagarajan, N., Subhas, A. V., Southon, J. R., Eiler, J. M. & Adkins, J. F. Abrupt pre-Bolling-Allerod warming and circulation
changes in the deep ocean. Nature 511, 75–78 (2014).39. Parker, A. G. In he Evolution of Human Populations in Arabia Vertebrate Paleobiology and Paleoanthropology 39–49 (Springer
Netherlands, 2010).40. Behar, D. M. et al. Counting the founders: the matrilineal genetic ancestry of the Jewish Diaspora. PloS one 3, e2062 (2008).41. Quintana-Murci, L. et al. Where west meets east: the complex mtDNA landscape of the southwest and Central Asian corridor. Am J
Hum Genet 74, 827–845 (2004).42. Pala, M. et al. Mitochondrial DNA signals of late glacial recolonization of Europe from near eastern refugia. Am J Hum Genet 90,
915–924 (2012).43. Petraglia, M. D., Parton, A. & Groucutt, H. G. Green Arabia: Human prehistory at the Crossroads of Continents. Quaternary
International 382, 1–7 (2015).44. Olivieri, A. et al. he mtDNA legacy of the Levantine early Upper Palaeolithic in Africa. Science 314, 1767–1770 (2006).45. Mellars, P., Gori, K. C., Carr, M., Soares, P. A. & Richards, M. B. Genetic and archaeological perspectives on the initial modern
human colonization of southern Asia. Proceedings of the National Academy of Sciences of the United States of America 110, 10699–10704 (2013).
46. Bulbeck, D. Where River Meets Sea: A Parsimonious Model for Homo sapiens Colonization of the Indian Ocean Rim and Sahul. Curr Anthropol 48, 315–321 (2007).
47. Bailey, G. N. et al. Blue Arabia: Palaeolithic and underwater survey in SW Saudi Arabia and the role of coasts in Pleistocene dispersals. Quaternary International 382, 42–57 (2015).
48. Erlandson, J. M. & Braje, T. J. Coasting out of Africa: he potential of mangrove forests and marine habitats to facilitate human coastal expansion via the Southern Dispersal Route. Quaternary International 382, 31–41 (2015).
49. Scally, A. & Durbin, R. Revising the human mutation rate: implications for understanding human evolution. Nat Rev Genet 13, 745–753 (2012).
50. Boivin, N., Fuller, D. Q., Dennell, R., Allaby, R. & Petraglia, M. D. Human dispersal across diverse environments of Asia during the Upper Pleistocene. Quaternary International 300, 32–47 (2013).
51. Groucutt, H. S. et al. Rethinking the dispersal of Homo sapiens out of Africa. Evol Anthropol 24, 149–164 (2015).52. Soares, P. et al. he Expansion of mtDNA Haplogroup L3 within and out of Africa. Mol Biol Evol 29, 915–927 (2012).53. Macaulay, V. & Richards, M. B. Mitochondrial Genome Sequences and Their Phylogeographic Interpretation. eLS. doi:
10.1002/9780470015902.20843.pub2 (2013).54. Pala, M., Soares, P., Chaubey, G. & Richards, M. B. In he Cambridge World History Volume 2. A World with Agriculture, 12,000
BCE–500 CE (eds G. Barker & C. Goucher) 26–54 (Cambridge University Press, 2015).55. Rodriguez-Flores, J. L. et al. Indigenous Arabs are descendants of the earliest split from ancient Eurasian populations Mezey, J. G.
Genome Research 26, 151–162 (2016).56. Cerný, V., Cizkova, M., Poloni, E. S., Al-Meeri, A. & Mulligan, C. J. Comprehensive view of the population history of Arabia as
inferred by mtDNA variation. Am J Phys Anthropol 159, 607–616 (2015).57. Posth, C. et al. Pleistocene Mitochondrial Genomes Suggest a Single Major Dispersal of Non-Africans and a Late Glacial Population
Turnover in Europe. Curr Biol 26, 827–833 (2016).58. Richards, M. B., Soares, P. & Torroni, A. Palaeogenomics: Mitogenomes and Migrations in Europe’s Past. Curr Biol 26, R246–R246
(2016).59. Fregel, R., Cabrera, V., Larruga, J. M., Abu-Amero, K. K. & Gonzalez, A. M. Carriers of Mitochondrial DNA Macrohaplogroup N
Lineages Reached Australia around 50,000 Years Ago following a Northern Asian Route. PloS one 10, e0129839 (2015).60. Guagnin, M. et al. Hunters and herders: Exploring the Neolithic transition in the rock art of Shuwaymis, Saudi Arabia. Archaeological
Research in Asia 4, 3–16 (2015).61. Groucutt, H. S. & Petraglia, M. D. he prehistory of the Arabian peninsula: deserts, dispersals, and demography. Evol Anthropol 21,
113–125 (2012).62. Jennings, R. P. et al. he greening of Arabia: Multiple opportunities for human occupation of the Arabian Peninsula during the Late
Pleistocene inferred from an ensemble of climate model simulations. Quaternary International 382, 181–199 (2015).
Uncorre
cted
pro
of
www.nature.com/scientificreports/
13Scientific RepoRts | 6:25472 | DOI: 10.1038/srep25472
63. Preston, G. W. et al. A multi-proxy analysis of the Holocene humid phase from the United Arab Emirates and its implications for southeast Arabia’s Neolithic populations. Quaternary International 382, 277–292 (2015).
64. Khalidi, L. In he Evolution of Human Populations in Arabia (ed M. D. Petraglia, Rose, J. I.) 279–291 (Springer Netherlands, 2010).65. Khalidi, L. et al. Obsidian sources in highland Yemen and their relevance to archaeological research in the Red Sea region. Journal
of Archaeological Science 37, 2332–2345 (2010).66. Macaulay, V. et al. he emerging tree of West Eurasian mtDNAs: a synthesis of control-region sequences and RFLPs. Am J Hum
Genet 64, 232–249 (1999).67. Preston, G. W., PArker, A. G., Walkingtona, H., Leng, M. J. & M.J., H. From nomadic herder-hunters to sedentary farmers: he
relationship between climate change and ancient subsistence strategies in south-eastern Arabia. Journal of Arid Environments 86, 122–130 (2012).
68. Tierney, J. E. & deMenocal, P. B. Abrupt shits in Horn of Africa hydroclimate since the Last Glacial Maximum. Science 342, 843–846 (2013).
69. Fattovich, R. he Development of Ancient States in the Northern Horn of Africa, c. 3. J World Prehist 23, 145–175 (2010).70. Phillipson, L. Lithic Artefacts as a Source of Cultural, Social and Economic Information: the evidence from Aksum, Ethiopia. Afr
Archaeol Rev 26, 45–58 (2009).71. Torroni, A. et al. Do the four clades of the mtDNA haplogroup L2 evolve at diferent rates? Am J Hum Genet 69, 1348–1356 (2001).72. Andrews, R. M. et al. Reanalysis and revision of the Cambridge reference sequence for human mitochondrial DNA. Nat Genet 23,
147 (1999).73. Brandstätter, A. et al. Migration rates and genetic structure of two Hungarian ethnic groups in Transylvania, Romania. Ann Hum
Genet 71, 791–803 (2007).74. Parson, W. et al. Massively parallel sequencing of complete mitochondrial genomes from hair shat samples. Forensic Sci Int Genet.
15, 8–15 (2015).75. Fendt, L., Zimmermann, B., Daniaux, M. & Parson, W. Sequencing strategy for the whole mitochondrial genome resulting in high
quality sequences. BMC Genomics 10, 139 (2009).76. Achilli, A. et al. Mitochondrial DNA backgrounds might modulate diabetes complications rather than T2DM as a whole. PloS one
6, e21029 (2011).77. van Oven, M. & Kayser, M. Updated comprehensive phylogenetic tree of global human mitochondrial DNA variation. Hum Mutat
30, E386–394 (2009).78. Forster, P., Harding, R., Torroni, A. & Bandelt, H. J. Origin and evolution of Native American mtDNA variation: a reappraisal. Am J
Hum Genet 59, 935–945 (1996).79. Saillard, J., Forster, P., Lynnerup, N., Bandelt, H. J. & Norby, S. mtDNA variation among Greenland Eskimos: the edge of the
Beringian expansion. Am J Hum Genet 67, 718–726 (2000).80. Yang, Z. PAML: a program package for phylogenetic analysis by maximum likelihood. Comput Appl Biosci. 13, 555–556 (1997).81. Soares, P. et al. Correcting for purifying selection: an improved human mitochondrial molecular clock. Am J Hum Genet 84,
740–759 (2009).82. Drummond, A. J., Rambaut, A., Shapiro, B. & Pybus, O. G. Bayesian coalescent inference of past population dynamics from
molecular sequences. Mol Biol Evol 22, 1185–1192 (2005).83. Drummond, A. J. & Rambaut, A. BEAST: Bayesian evolutionary analysis by sampling trees. BMC Evol Biol. 7, 214 (2007).84. Soares, P. et al. Climate change and postglacial human dispersals in southeast Asia. Mol Biol Evol 25, 1209–1218 (2008).85. EMPOP. European DNA Proiling Group Mitochondrial Population Database. (2012) Available at: http://empop.online/. (Acessed:
15th October 2012).86. Parson, W. & Dur, A. EMPOP–a forensic mtDNA database. Forensic Sci Int Genet. 1, 88–92 (2007).
Acknowledgementshe authors are grateful to all the donors for providing biological specimens. he authors want to thank Martina Dünser (Dep. of Visceral, Transplantation and horacic Surgery, Tirol Kliniken, Innsbruck) and Bettina Zelger (Dep. of Pathology, Medical University of Innsbruck) for retrieving information on a sample’s origin. This work was supported by the University of Pavia strategic theme “Towards a governance model for international migration: an interdisciplinary and diachronic perspective” (MIGRAT-IN-G), the Italian Ministry of Education, University and Research: Progetti Futuro in Ricerca 2012 (RBFR126B8I) (to A.A. and A.O.) and Progetti Ricerca Interesse Nazionale 2012 (to A.A., F.C., A.T. and O.S.), a Leverhulme Doctoral Scholarship award to M.B.R., a Newton International Fellowship to M.P., the intramural funding program of the Medical University Innsbruck for young scientists MUI-START, Project 2013042025 (to M.B.), an EMBO short-term fellowship (ASTF 70-2014/Award) and a University of Huddersield University Research Fellowship award to F.G. P.S. is supported by FCT, European Social Fund, Programa Operacional Potencial Humano and the FCT Investigator Programme (IF/01641/2013) and acknowledges FCT I.P. for CBMA’s strategic funding UID/BIA/04050/2013.
Author ContributionsF.G., W.P., A.T., M.B.R. and A.O. conceived and designed the experiments. F.G., M.B., S.B., G.H. and A.G.-C. performed the experiments. F.G., A.A., M.P., M.B., L.F., A.S., F.C., P.S. and A.O. analysed the data. A.A., B.E., R.S., A.C., W.P., O.S., P.S., A.T., M.B.R. and A.O. contributed reagents/materials/analysis tools. F.G., A.T., M.B.R. and A.O. wrote the manuscript. All authors reviewed and approved the manuscript.
Additional InformationSupplementary information accompanies this paper at http://www.nature.com/srep
Competing inancial interests: he authors declare no competing inancial interests.
How to cite this article: Gandini, F. et al. Mapping human dispersals into the Horn of Africa from Arabian Ice Age refugia using mitogenomes. Sci. Rep. 6, 25472; doi: 10.1038/srep25472 (2016).
his work is licensed under a Creative Commons Attribution 4.0 International License. he images or other third party material in this article are included in the article’s Creative Commons license,
unless indicated otherwise in the credit line; if the material is not included under the Creative Commons license, users will need to obtain permission from the license holder to reproduce the material. To view a copy of this license, visit http://creativecommons.org/licenses/by/4.0/

Uncorre
cted
pro
of Query Description Author’s Response No.
QUERY FORM
Journal: SREP
Author:- he following queries have arisen during the editing of your manuscript. Please answer queries bymaking the requisite corrections at the appropriate positions in the text.
Nature Publishing Group
srep25472][Art. Id:
SREP
Manuscript ID
Author surnames have been highlighted – please check these carefully and indicate
if the irst name or surname have been marked up incorrectly. Please note that this
will afect indexing of your article, such as in PubMed.
Please check and ensure that the licence type at the end of the paper matches the
version on the Licence to Publish form submitted.
author surnames have been highlighted properly
The two licence types are identical
Recommended