Trends in OrthopedicsTrends in OrthopedicsBrady R. Shirley
IntroductionIntroduction
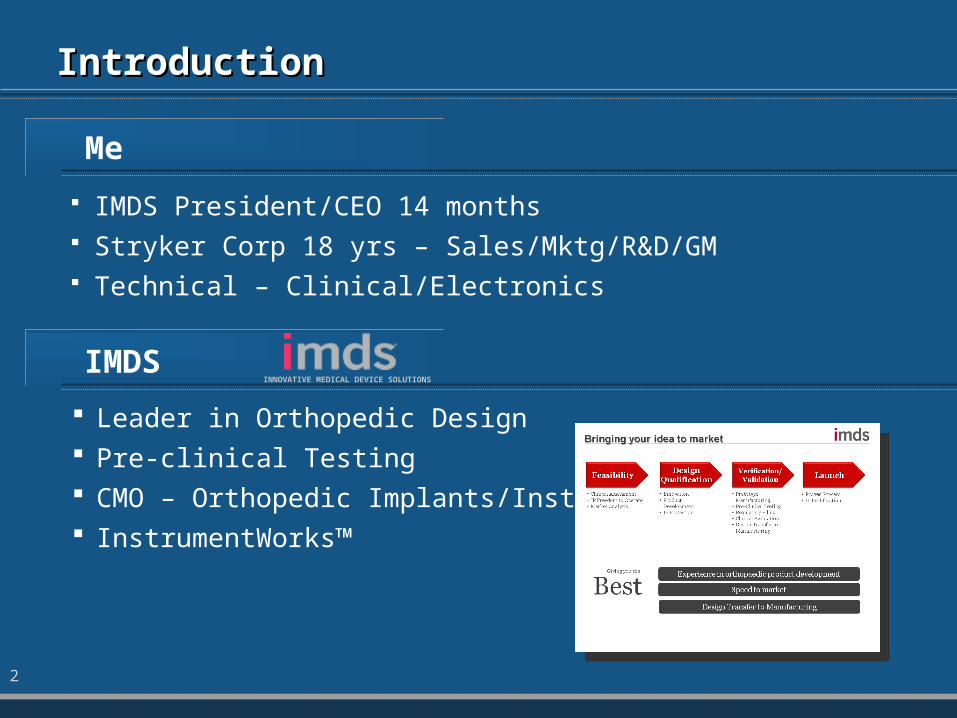
IMDS President/CEO 14 months Stryker Corp 18 yrs – Sales/Mktg/R&D/GM Technical – Clinical/Electronics
IMDS
Me
Leader in Orthopedic Design Pre-clinical Testing CMO – Orthopedic Implants/Instruments InstrumentWorks™
INNOVATIVE MEDICAL DEVICE SOLUTIONS
2
HistoricalHistorical
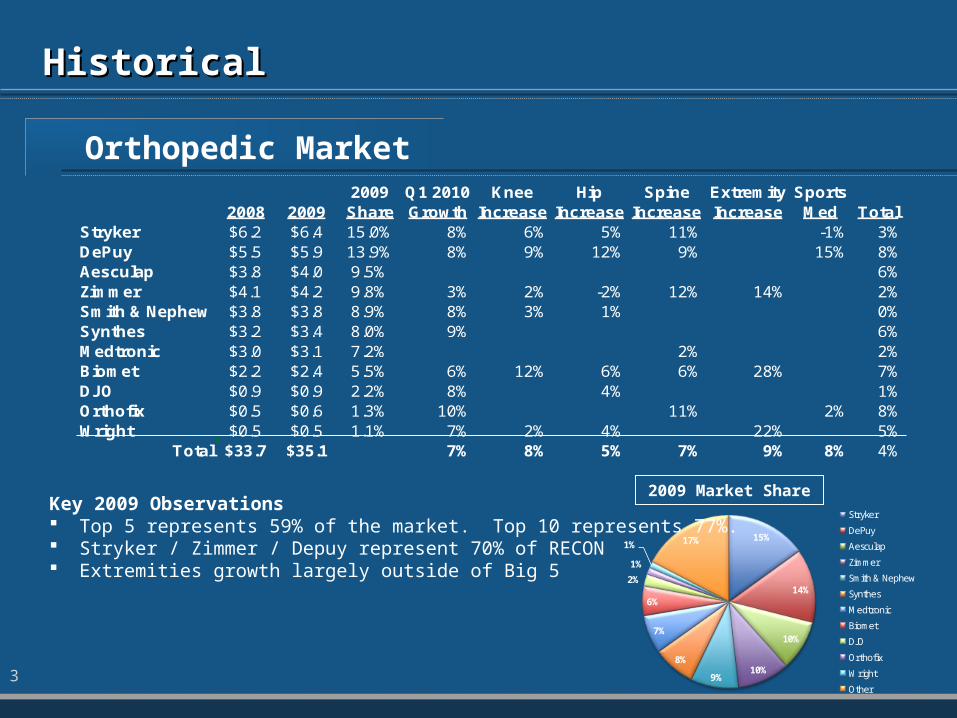
Orthopedic Market
3
15%
14%
10%
10%9%
8%
7%
6%
2%
1%
1% 17%
Stryker
DePuy
Aesculap
Zimmer
Smith & Nephew
Synthes
Medtronic
Biomet
DJO
Orthofix
Wright
Other
Key 2009 Observations Top 5 represents 59% of the market. Top 10 represents 77%. Stryker / Zimmer / Depuy represent 70% of RECON Extremities growth largely outside of Big 5
2009 Q1 2010 Knee Hip Spine Extremity Sports2008 2009 Share Growth Increase Increase Increase Increase Med Total
Stryker $6.2 $6.4 15.0% 8% 6% 5% 11% -1% 3%DePuy $5.5 $5.9 13.9% 8% 9% 12% 9% 15% 8%Aesculap $3.8 $4.0 9.5% 6%Zimmer $4.1 $4.2 9.8% 3% 2% -2% 12% 14% 2%Smith & Nephew $3.8 $3.8 8.9% 8% 3% 1% 0%Synthes $3.2 $3.4 8.0% 9% 6%Medtronic $3.0 $3.1 7.2% 2% 2%Biomet $2.2 $2.4 5.5% 6% 12% 6% 6% 28% 7%DJO $0.9 $0.9 2.2% 8% 4% 1%Orthofix $0.5 $0.6 1.3% 10% 11% 2% 8%Wright $0.5 $0.5 1.1% 7% 2% 4% 22% 5%
Total $33.7 $35.1 7% 8% 5% 7% 9% 8% 4%
2009 Market Share
The Current Landscape…2010The Current Landscape…2010
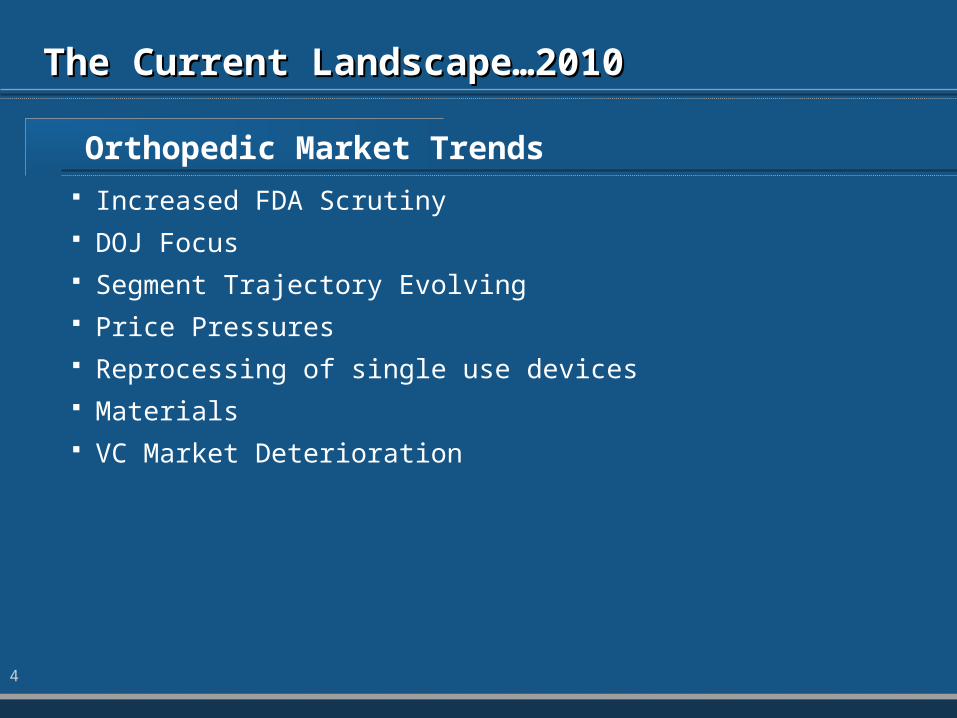
Increased FDA Scrutiny DOJ Focus Segment Trajectory Evolving Price Pressures Reprocessing of single use devices Materials VC Market Deterioration
Orthopedic Market Trends
4
The Current Landscape…2010The Current Landscape…2010
Increased FDA Scrutiny
5
6
NewsNews
The Current Landscape…2010The Current Landscape…2010
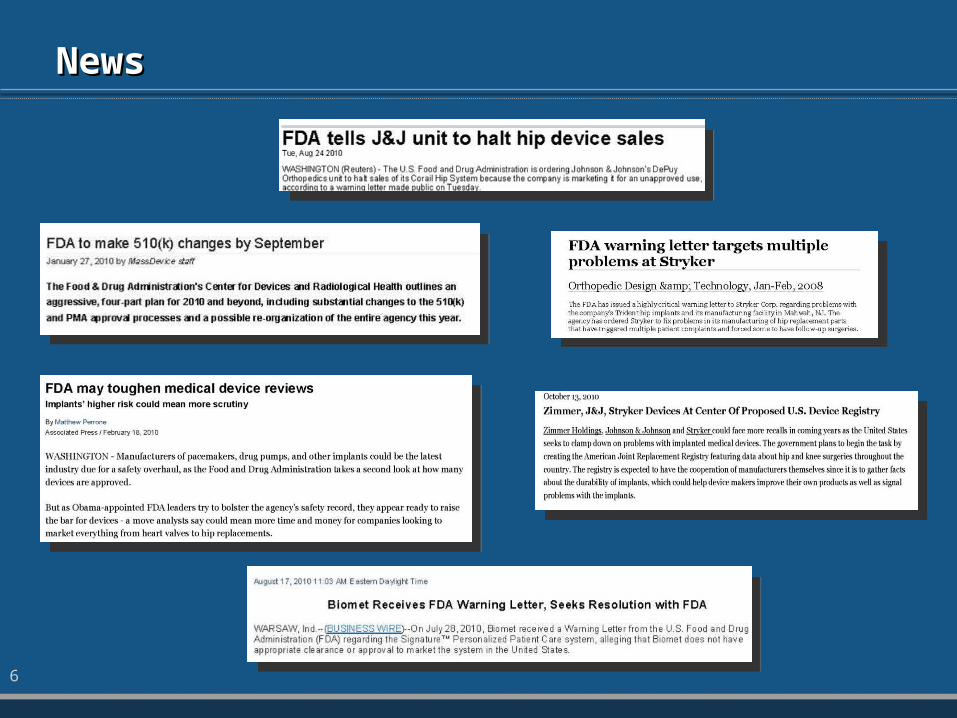
Increased Audit Frequency/Intensity 4 of Big 5 received warning letters in 2009-10 Manufacturing Supplier Consolidation R&D focus on remediation
Expanding 510k Approval Timelines 2005=87 days 2008=113 days 2010=130 days 510k moving towards PMA
Increased costs Increased development time
Registration Requirements Escalating Clinical outcomes tracking
Increased FDA Scrutiny
7
The Current Landscape…2010The Current Landscape…2010
Big 5 Companies Settlement $350m in 2007 Consulting practices challenged…anti-kickback
Limited interaction between HCP and OEM Massachusetts Senate Bill No. 2863
Code of Conduct Meals Entertainment Grants Cash
Sunshine Act Documentation Eight states, including Massachusetts, Vermont, Maine, Minnesota, and Washington, DC…42 to
follow
DOJ Focus
8
$0
$1,000
$2,000
$3,000
$4,000
$5,000
$6,000
2005 2006 2007 2008 2009 2010
US Spine Sales
$0
$1,000
$2,000
$3,000
$4,000
$5,000
$6,000
2005 2006 2007 2008 2009 2010
US Spine Sales
The Current Landscape…2010The Current Landscape…2010
Segment Trajectory Evolving
9
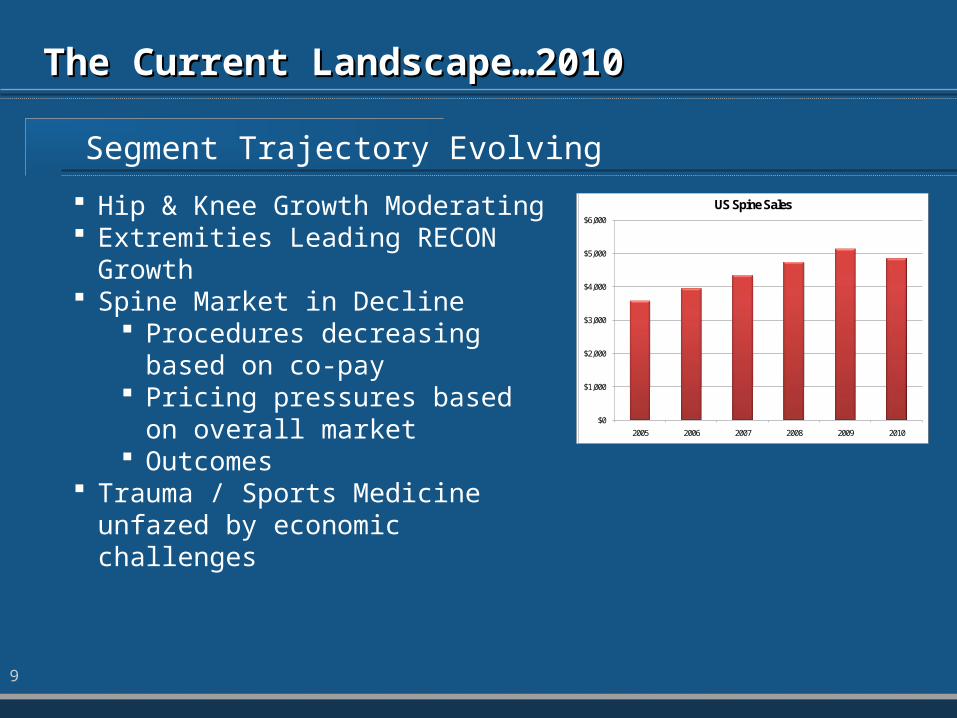
Hip & Knee Growth Moderating Extremities Leading RECON Growth Spine Market in Decline
Procedures decreasing based on co-pay Pricing pressures based on overall
market Outcomes
Trauma / Sports Medicine unfazed by economic challenges
The Current Landscape…2010The Current Landscape…2010
Employee Orthopedic HCPs have opened the door for C Level “control” of product selection
OUS Market Adjustments/Climates making a US impact Japan China/India
Low cost offerings in Asia are providing opportunity to expand consolidated market Focus of In China/For China versus “low cost country” approach based on IP challenges and
rising labor costs Obama Care
Stifle innovation Expand Consolidation Expedite OUS strategies
Price/Cost Pressures
10
The Current Landscape…2010The Current Landscape…2010
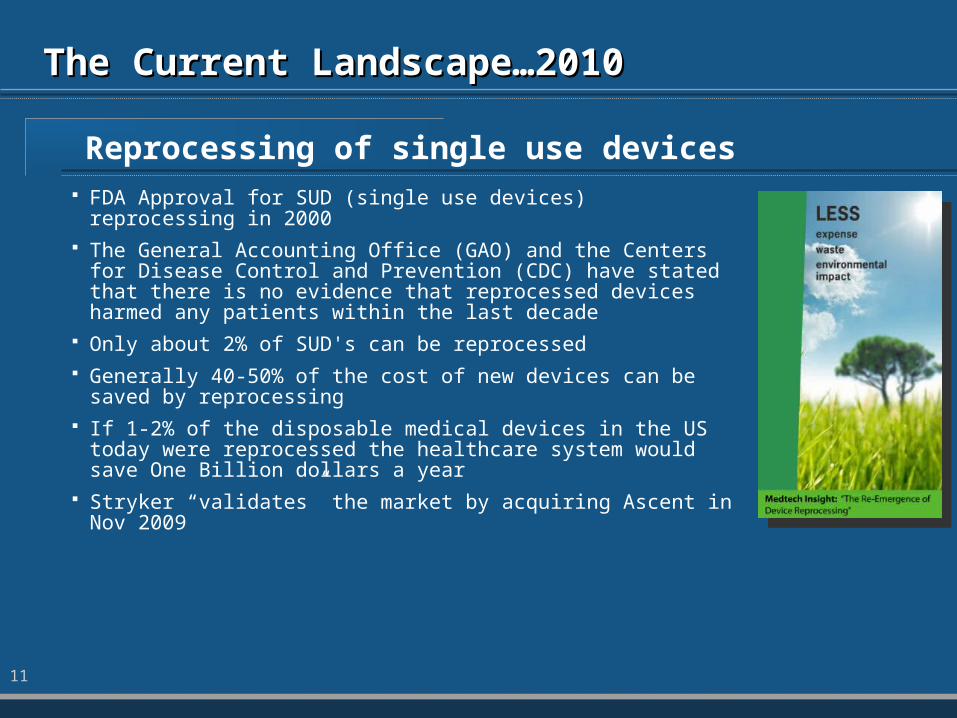
FDA Approval for SUD (single use devices) reprocessing in 2000 The General Accounting Office (GAO) and the Centers for Disease
Control and Prevention (CDC) have stated that there is no evidence that reprocessed devices harmed any patients within the last decade
Only about 2% of SUD's can be reprocessed Generally 40-50% of the cost of new devices can be saved by
reprocessing If 1-2% of the disposable medical devices in the US today were
reprocessed the healthcare system would save One Billion dollars a year
Stryker “validates” the market by acquiring Ascent in Nov 2009
Reprocessing of single use devices
11
The Current Landscape…2010The Current Landscape…2010
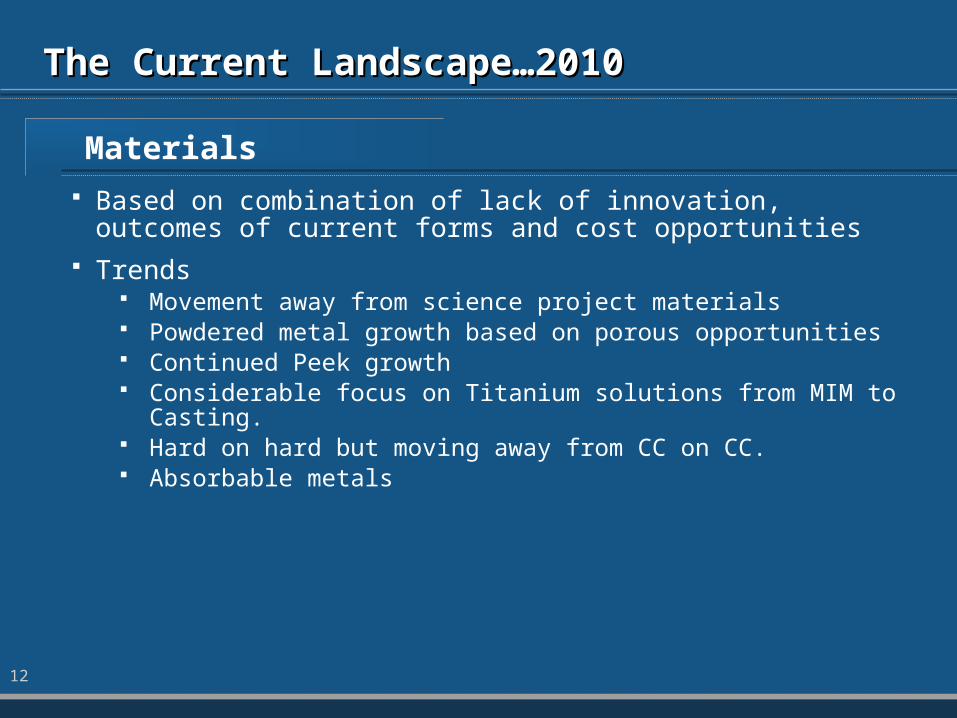
Based on combination of lack of innovation, outcomes of current forms and cost opportunities
Trends Movement away from science project materials Powdered metal growth based on porous opportunities Continued Peek growth Considerable focus on Titanium solutions from MIM to Casting. Hard on hard but moving away from CC on CC. Absorbable metals
Materials
12
The Current Landscape…2010The Current Landscape…2010
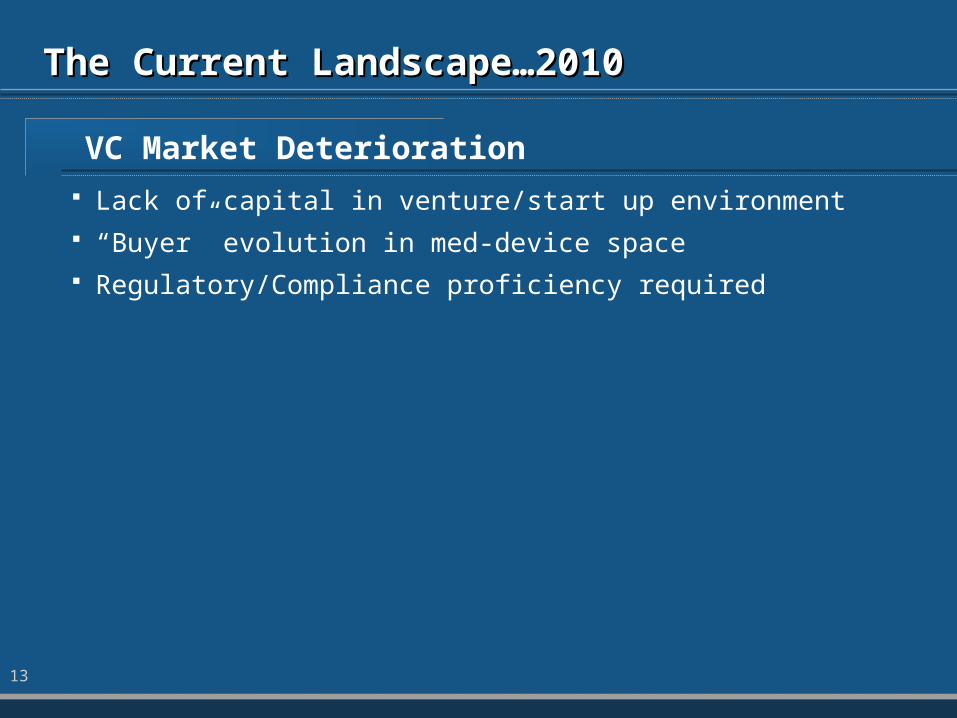
Lack of capital in venture/start up environment “Buyer” evolution in med-device space Regulatory/Compliance proficiency required
VC Market Deterioration
13
What Next?What Next?
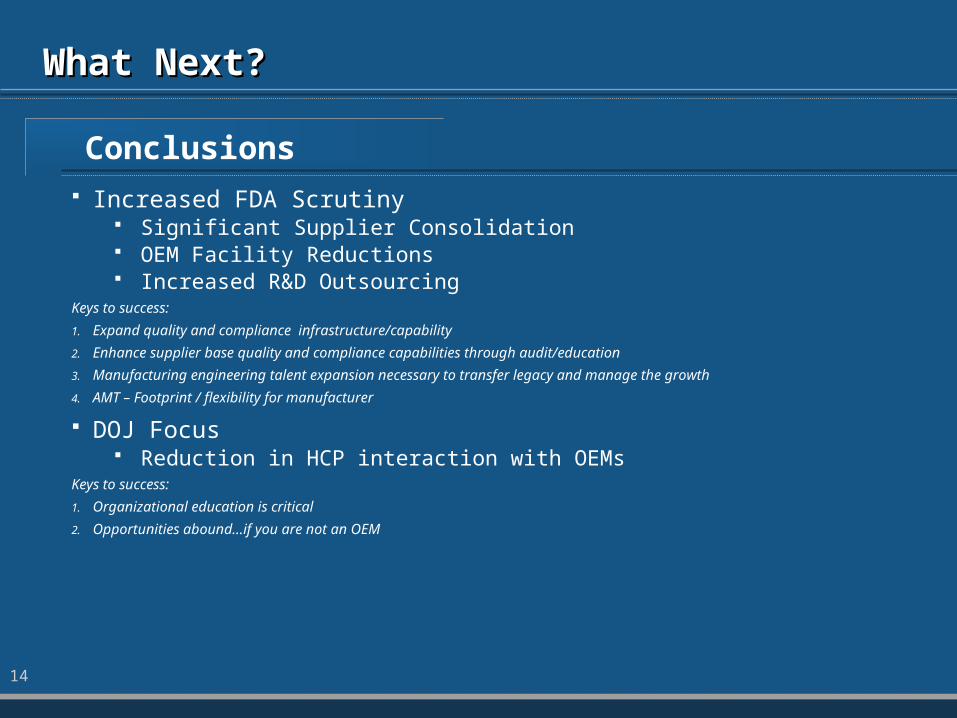
Increased FDA Scrutiny Significant Supplier Consolidation OEM Facility Reductions Increased R&D Outsourcing
Keys to success:
1. Expand quality and compliance infrastructure/capability
2. Enhance supplier base quality and compliance capabilities through audit/education
3. Manufacturing engineering talent expansion necessary to transfer legacy and manage the growth
4. AMT – Footprint / flexibility for manufacturer
DOJ Focus Reduction in HCP interaction with OEMs
Keys to success:
1. Organizational education is critical
2. Opportunities abound…if you are not an OEM
Conclusions
14
What Next?What Next?
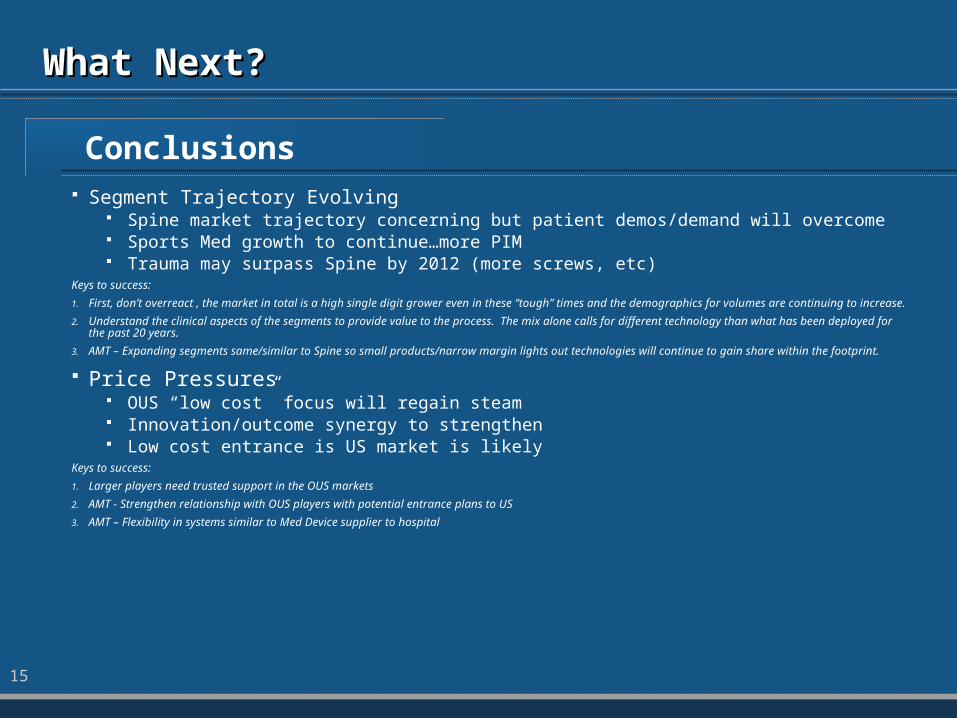
Segment Trajectory Evolving Spine market trajectory concerning but patient demos/demand will overcome Sports Med growth to continue…more PIM Trauma may surpass Spine by 2012 (more screws, etc)
Keys to success:
1. First, don’t overreact , the market in total is a high single digit grower even in these “tough” times and the demographics for volumes are continuing to increase.
2. Understand the clinical aspects of the segments to provide value to the process. The mix alone calls for different technology than what has been deployed for the past 20 years.
3. AMT – Expanding segments same/similar to Spine so small products/narrow margin lights out technologies will continue to gain share within the footprint.
Price Pressures OUS “low cost” focus will regain steam Innovation/outcome synergy to strengthen Low cost entrance is US market is likely
Keys to success:
1. Larger players need trusted support in the OUS markets
2. AMT - Strengthen relationship with OUS players with potential entrance plans to US
3. AMT – Flexibility in systems similar to Med Device supplier to hospital
Conclusions
15
What Next?What Next?
Reprocessing of single use devices Growth of 40%+ for foreseeable future Opportunities abound for technology/process
Opportunities:
1. Business segment opportunity
2. AMT - Technology to displace largely manual process of today
Materials Proven materials will largely dominate the landscape New approaches to same (PM, MIM, Casting) will be next evolutionary step Drug eluding options of great interest
Opportunities:
1. Win the Ti race in MIM/Casting
2. AMT - Automate powdered metals processes to enable volume
VC Market Deterioration Proceed with caution!
Conclusions
16
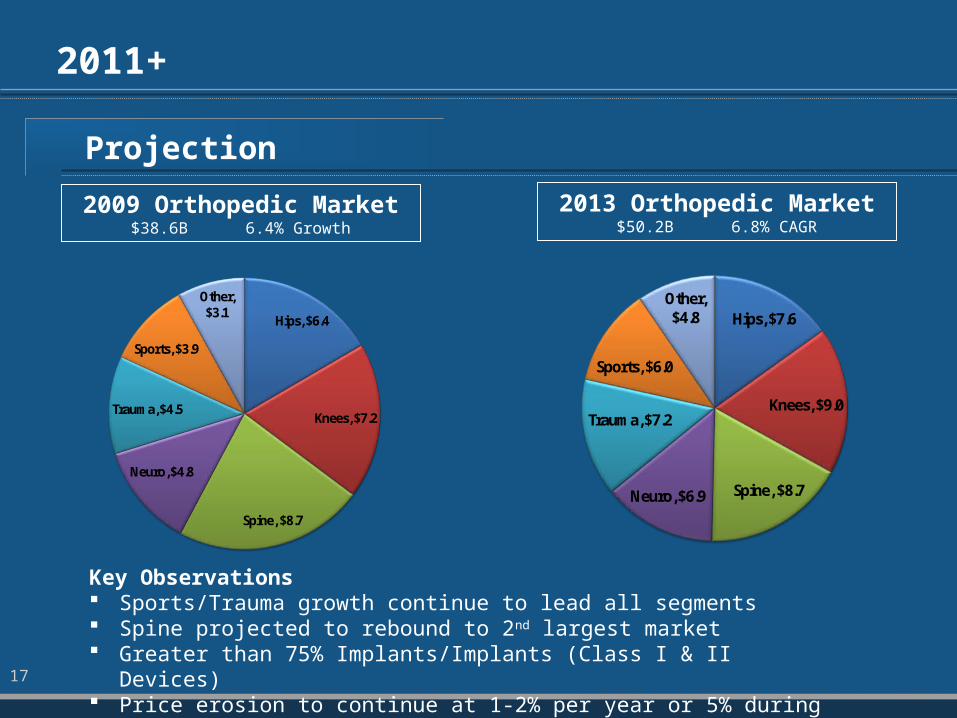
Projection
2011+
17
Hips, $7.6
Knees, $9.0
Spine, $8.7Neuro, $6.9
Trauma, $7.2
Sports, $6.0
Other, $4.8Hips, $6.4
Knees, $7.2
Spine, $8.7
Neuro, $4.8
Trauma, $4.5
Sports, $3.9
Other, $3.1
2009 Orthopedic Market$38.6B 6.4% Growth
2013 Orthopedic Market$50.2B 6.8% CAGR
Key Observations Sports/Trauma growth continue to lead all segments Spine projected to rebound to 2nd largest market Greater than 75% Implants/Implants (Class I & II Devices) Price erosion to continue at 1-2% per year or 5% during period

Questions
18
Recommended