
That’s more than healthcare. That’s smartcare.
Transforming Care Delivery by Moving from Episodic to
Coordinated Payment
Kenneth E. Berkovitz, M.D. Bob Hunter, M.B.A., M.A.
System Medical Director System Administrative Director
Robert A. Gerberry, J.D.
Associate General Counsel

2
Presentation Overview
I. Summa Story
II. Evolution of Physician Alignment Models
III. Population Health Initiatives
• Accountable Care Organization (“ACO”)
• Patient-Centered Medical Home (“PCMH”)
IV. Bundled Payment
• Overview of Model
• Evaluation of Models
• Business Case
• Lessons Learned

3
Who Is Summa?
Summa is…
An Integrated Delivery System
Tertiary, Community and Physician-Owned Hospitals, Multi-Specialty Physician Group, Research Division, Health Plan and Foundation
Located in a 5-County Area in Northeast Ohio
Working to…
• Enhance the patient and member experience
• Create value through a collaborative focus
• Provide high quality care at low cost
• Serve the community as the largest employer in our service area

4
The Integrated Delivery System
Hospitals
Inpatient Facilities • Tertiary/Academic Campus
• 3 Community Hospitals
• 1 Affiliate Community Hospital
• 2 JV Hospitals with Physicians
Outpatient Facilities • Multiple ambulatory sites
• Locations in 3 Counties
Service Lines • Cardiac, Oncology, Neurology,
Ortho, Surgery, Behavioral
Health, Women’s, Emergency,
Seniors
Key Statistics • 2,000+ Licensed Beds
• 62,000 IP Admissions
• 45,000 Surgeries
• 660,000 OP Visits
• 229,000 ED Visits
• 5,000 Births
• Over 220 Residents
Multiple
Alignment Options • Employment
• Joint Ventures
• EMR
• Clinical Integration
• Health Plan
Summa Physicians, Inc. • 300 Employed Physician
Multi-Specialty Group
Summa Health Network • PHO with over 1,000
physician members
• EMR/Clinical Integration
Program
Geographic Reach • 17 Counties for
Commercial
• 18 Counties for Medicare
• 55-hospital Commercial
provider network
• 41-hospital Medicare
provider network
• National Accounts in 2
States
155,000
Total Members • Commercial Self Insured
• Commercial Fully Insured
• Group BPO/PSN
• Medicare Advantage
• Individual PPO
Physicians Health Plan Foundation
System Foundation
Focused On: • Development
• Education
• Research
• Innovation
• Community Benefit
• Diversity
• Government Relations
• Advocacy
Net Revenues: Over $1.6 Billion
Total Employees: Nearly 11,000

Summa Health System
5

Summa Akron City Hospital St. Thomas Hospital
Summa Wadsworth-Rittman
Summa Western Reserve Hospital Robinson Memorial Hospital
Summa Barberton Hospital
6
Crystal Clinic Orthopaedic Center
Summa Rehab Hospital

7
Summa’s Delivery Network: Selected Outpatient Centers
Crystal Clinic
Surgery Center
Specialty Health
Center/ Heart and
Lung Center
Jean & Milton
Cooper Cancer
Center
Summa Health
Center at Lake
Medina
Summa Health Center
at Western Reserve
Summa Barberton
Hospital Parkview
Center

8
Two of the System Hospitals Are Joint Ventures with Our Physicians
Summa Western Reserve Hospital
(“SWRH”) Joint venture started in June 2009 between Summa
Health System and Western Reserve Hospital
Partners (a local group of approximately 220
physicians)
Commenced operations in June 2009 at the prior
Hospital location (conversion of underperforming
asset)
Crystal Clinic Orthopedic Center
(“CCOC”) Orthopaedic Hospital Joint Venture between Summa
Health System and Crystal Clinic (a local group of
approximately 30 orthopedic surgeons)
Commenced operations in May 2009 on the Summa
St. Thomas Hospital (Hospital w/in a Hospital)

9
SummaCare
Health Insurance Company
Provider Owned
Four Product Lines
Total Membership – 150,000 +
18 County Northern Ohio
Service Area
Multi-State, National Accounts
Annual Revenue $400 million
300+ Employees
Large Credentialed Provider Network

Physician Alignment Models

11
Physician Alignment Options
First plank – Develop Primary Care Network
Second plank – Offer Fully-employed and Physician-Managed Employment Models
Third plank – Joint Ventures
Fourth plank – Clinical and Financial Integration through SHN
Fifth plank – Managed Services Organization
A Multi-Pronged Approach

12
Summa Physicians-Employed Group
Summa Physicians, Inc. (300 physicians)
Internal Medicine
(45)
Family Medicine
(47)
OB/Gyn
(21)
Geriatrics
(11)
Cardiology
(28)
Surgery
(35)
Ortho/Sports
(8)
Oncology
(7)
Behavioral Health
(25)
Infectious Disease
(7)
Endocrinology
(4)
Critical Care
(11)
Palliative Care
(6)
Others
(41)
Gastroenterology
(4)

Development of The Common Ground
13
300
~ 900
SPI Independent
# of Physicians
Employed
Physicians
Independent
Private
Practice
Shared
practice
standards,
service
standards,
information
systems
Salaried Independent
Shared
practice
standards,
service
standards,
information
systems
Salaried Independent

Per
form
ance
Time
Strategic planning must address
how to optimize performance in
the current environment while
also preparing the organization to
“jump” from
Curve #1 to Curve #2
Natural
Trajectory
Curve #1: FEE-FOR-SERVICE
All about volume
Reinforces work in silos
Little incentive for real integration
Curve #2:
VALUE-BASED PAYMENT
Shared Savings Programs
Bundled / Global Payments
Value-based Reimbursement
Rewards integration, quality,
outcomes and efficiency
Our Challenge: Jumping to “Curve 2”
14

Combining Parts into an ACO

Why Change How We Provide Care?
Specialty
Care
Everyone is working in their own silos…, which impedes coordinated care
Primary
Care
Ambulatory Hospital
and ED
Skilled
Nursing
Nursing
Home
Home
Health
21
ACO
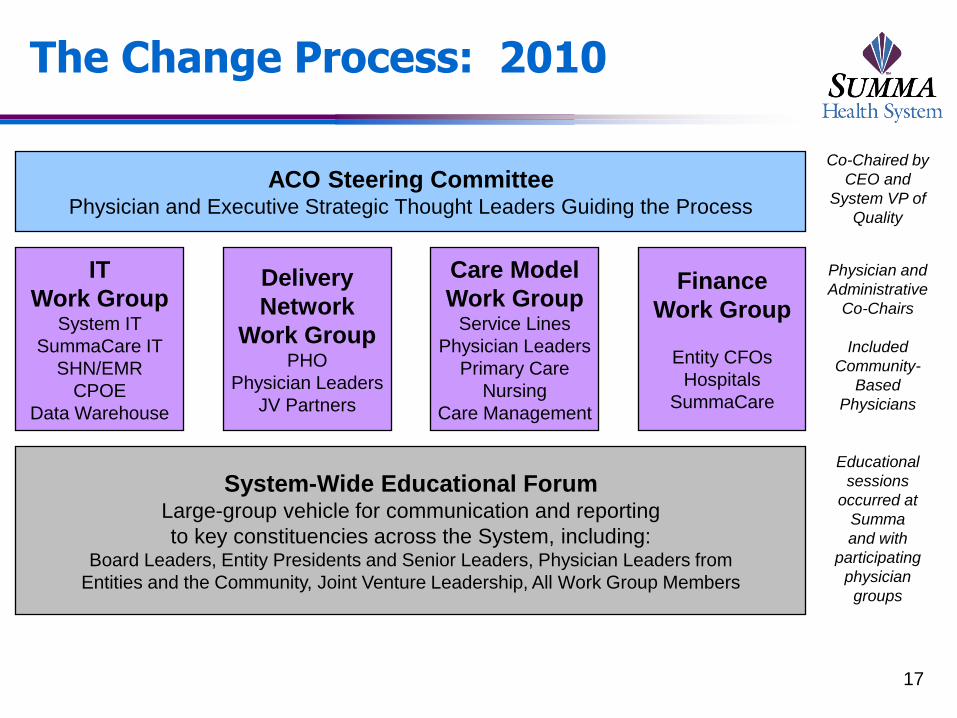
The Change Process: 2010
17
ACO Steering Committee Physician and Executive Strategic Thought Leaders Guiding the Process
IT
Work Group System IT
SummaCare IT
SHN/EMR
CPOE
Data Warehouse
Delivery
Network
Work Group PHO
Physician Leaders
JV Partners
Care Model
Work Group Service Lines
Physician Leaders
Primary Care
Nursing
Care Management
Finance
Work Group
Entity CFOs
Hospitals
SummaCare
Physician and
Administrative
Co-Chairs
Included
Community-
Based
Physicians
System-Wide Educational Forum Large-group vehicle for communication and reporting
to key constituencies across the System, including: Board Leaders, Entity Presidents and Senior Leaders, Physician Leaders from
Entities and the Community, Joint Venture Leadership, All Work Group Members
Educational
sessions
occurred at
Summa
and with
participating
physician
groups
Co-Chaired by
CEO and
System VP of
Quality

18
What is the Summa ACO?
Vision Statement: “Summa ACO” is a Clinician-Led
Organization that Partners with Communities to
Compassionately Care for and serve in an Accountable,
Value and Evidence-based manner
Organizational Facts
Start Date – Began operations January 1, 2011
Initial Pilot Population – Approximately 12,000 SummaCare Medicare
Advantage members that currently see a participating primary care physician
Legal Entity – Non-profit taxable structure allows for physician majority on
the Board
Board Composition – 4 community primary care physicians, 1 medical
specialist, 1 surgical specialist, 3 Summa representatives

19
How Summa Views Accountable Care
The concept of Accountable Care creates a
Burning Platform for Hospitals, Physicians and
other Providers along the Care Continuum to work
Collaboratively to deliver High-Quality,
Coordinated and Cost-effective Care
Paradigm Shift from Fee-for-Service Medicine to
comply with Dr. Berwick’s Triple Aim-Better Care,
Better Population Health and Lower Costs

20
How Summa Views Accountable Care (cont.)
Accountable Care continues the following transitions:
Move away from the current fee-for-service payment system to a
new model that incentivizes primary care, wellness and population
health
Providers become clinically and fiscally accountable for the
populations they serve (consistent with our Joint Ventures)
Patients become actively engaged to take responsibility for their
health
Hospitals and physicians build upon their relationships with each
other and partner in a deeper way with patients, populations and
payers
Improve the health of our communities while, at the same time,
reduce costs by anticipating health needs and proactively managing
chronic care

Future Goals Drive Change
Future Goals include:
Enhance Physician Engagement and System Integration
Expand Market Penetration (selectively and strategically) and Increase our Patient Population
Replace Episodic Care with Coordinated Care
Improve Population Health through ACO and Medical Homes
Seek to move from independent silos to group culture by evolving to full connectivity on common IT platform
21

Inclusive, not exclusive
View the ACO as a community collaboration
Engage both employed and independent providers
Expand to all segments along the care continuum
Inclusive of all physicians that want to participate as long as they
meet ACO quality and utilization standards as defined in Conditions
of Participation in Membership Agreement
Initial partners include about 200 PCPs, more than 200
specialists and 6 hospitals
4 large independent primary care groups
2 employed multi-specialty groups
All Summa hospitals
SummaCare as the payer partner 22
ACO Membership Strategy

ACO Conditions of Participation
Sample provisions:
Have capacity to exchange clinical and demographic
information through secure transaction sets
Provide patient data to develop care plans consistent
with patient choice
Adhere to ACO protocols to promote improvement in
patient outcomes and patient satisfaction
Make Referrals to other ACO providers when medically
necessary and consistent with patient choice
Protect privacy of patient PHI as required under HIPAA
23

Care Model Development

25
Care Model Workgroup
Care Model Concept
Review High-cost and High-utilization Clinical Conditions
Start with Transitions of Care as a way to approach all Care Models-
Better Hand-Off of Patients
Initial Care Model – Heart Failure
Identified as a Leading Cost and Utilization Driver for the Pilot
Population
Will serve as an example for how to develop additional Care Models
Create Evidenced-based Protocols which are followed by all
Providers
Target preventable readmissions through better follow-up and
monitoring of the patient

Transformation of Care Clinical Practice Guidelines
7 Clinical Practice Guidelines
Adopted from best practice clinical pathways currently in use by
SummaCare
Endorsed by Clinical Value Committee
• Hypertension
• Asthma
• Diabetes
• Chronic Obstructive Pulmonary Disease
• Congestive Heart Failure
• Cardiovascular Disease
• Chronic Kidney Disease
Next Steps – Electronic Integration
Process measures to be proposed to CVC in February
Clinical Informatics Council to lead decision making on location
within EMR 26

PCMH
• Teamwork is essential in the PCMH
• Pre-Visit Team Planning (a.k.a. huddles):
• Increase Team Unity
• Minimize potential clinic bottlenecks
• Increase communication
• Implemented daily huddles in Phase 1 PCMH practices in 2012
• Introduce “Huddle” workflow not only PCP offices, but also specialists in ACO in 2013
• Developed “Tasks for Staff, Decisions for Physicians” approach to workflows
• Worked with offices to identify chronic disease management, with the goal of standardizing workflows 27

PCMH NCQA Recognition
2
5
11
15
1
5
9
15
0
2
4
6
8
10
12
14
16
Q1, 2012 Q2, 2012 Q3, 2012 Q4, 2012
# o
f p
racti
ces c
om
ple
ted
NCQA Application Progress, 2012
Goal
Actual
-4 practices received Level 3 (Highest) NCQA Recognition
First Patient-Centered Medical Homes in Summit, Medina, and Stark counties
-9 additional practices have submitted their NCQA Level 3 application
Remaining results are expected 1 Qtr 2013
-10 practices are planned to complete by 1 Qtr 2013
*Graph includes 2 corporate applications
28

Disease-Specific Care Models: CHF as a Use Case
29
0
100
200
300
400
500
600
700
79 80 85 90 95 00 06
Years
Dis
ch
arg
es
in T
ho
us
an
ds
Male Female
Source: NHDS/NCHS and NHLBI
Hospital discharges for heart failure (US: 1979-2006)

Heart Failure Care Model: Current Elements
Focus on Transitions from Hospital to Home
Focus on Patient-Centered Medical Home Management
Focus on Patients’ Ability to Self-Manage
30

New Heart Failure Transitional Processes (Hospital to Home)
Improved notification of PCP at the point of admission
and discharge from hospital, with transfer of pertinent
clinical information and establishment of a follow-up
visit
Expansion of Transitional Care Nurse Case
Management Program across all System Hospitals
Clinical Guidelines for Post-Discharge Care with
utilization of Electronic Health Record where possible
31

HF Medical Home Management
Development of visit-based ambulatory guidelines
incorporated into the Electronic Health Record
Enhanced Management of patients with highest risk
factors
Ongoing support with integrated care plan via
assignment of case managers to primary care offices
Proactive identification of patients for home
monitoring, other supportive services
32
HF Patient Activation
Restructure patient education materials to allow for an
individualized, staged approach to patient activation
Shift in delivery of materials from an “education”
perspective to a “coaching” mode with the objective of
patient engagement
Develop and incorporate materials focused on
enhancing patients’ self management and emphasize
the patient’s role within the health care team
33

Financial Model

ACO Surplus Payment Criteria: PCP
35
Incentive Performance Measure Benchmarks
50% PCP Number of Enrollees 10 Enrollees per PCP
12.5% PCP Patient Outcomes evidenced by HEDIS
measures (e.g. Diabetes A1c control >9),
Blood Pressure Control >140/90,
Diabetes Cholesterol Control (LDL <100)
Improve on existing % by
10% or exceed 75% of
HEDIS regional threshold
12.5% Advance Care Model development by
integration of Care Model templates into
practice and timely completion of Health
Risk Assessments (“HRA”)
Complete 50% of HRAs by
end of year
12.5% Attend 1 education session on patient
care process improvement
Documented Attendance
12.5% CG CAHPS Survey (e.g. getting appts,
Dr. communication, helpful office staff,
Dr. rating, f/u test results)
Exceed benchmark in 3 of
5 categories

ACO Surplus Payment Criteria: Specialist
36
Incentive Performance Measure Benchmarks
50%
Specialist
Number of Enrollees 5 Enrollees per Specialist
12.5%
Specialist
Patient Outcomes evidenced by Timely
Consultation to PCP, and Standard
Consult Report
20% of consultation
reports received by PCP
within 7 days
12.5%
Specialist
Advance Care Model development by
integration of Care Model templates into
EMR
Introduction of charting
templates into EMR
12.5%
Specialist
Attend 1 education session on patient
care process improvement
Documented Attendance
12.5% CG CAHPS Survey (e.g. getting appts,
Dr. communication, helpful office staff,
Dr. rating, f/u test results)
Exceed benchmark in 3 of
5 categories

Financial Model
Projected Total Cost
of Medical Care
Actual Cost of Care for
the Defined Population
Surplus
(or Deficit)
- Paid to Providers
on a FFS Basis
Based on
Actuarial Analysis of
Historical Data
Provider Bonus Available
ONLY if Surplus Exists
at Year End
Outpatient
Ancillary
Shared Savings Pools
Outpatient
Diagnostics
Other
Outpatient
Hospital, SNF,
Inpatient
Rehab
Outpatient
Retail
Pharmacy
Different Provider Types Participate in Pools Based on
an Estimated Ability to Impact Associated Costs
37

Evolution of ACO

Opportunity: Total Admits
373 373
395
354 351
334
352
332
281
Q3 09 Q4 09 Q1 10 Q2 10
Inpatient Admission Countper 1,000 member
ACO Medicare (Total) Benchmark
39
Note: Benchmark is based on Moderately Managed Midwest Utilization Targets – Milliman

Medical Expenditures Total Medical Spend for ACO Pilot Population (8,500 members)
40
Potential
Surplus
*Target based on Moderately Managed Midwest Utilization Targets – Milliman
Summa ACO Lessons Learned
To truly achieve Care Delivery redesign, ACO needs to
be Physician-Led
Need to navigate carefully the balance between
PCPs/Specialists and their respective contributions to
the ACO
Design achievable Conditions of Participation and
enforce these requirements in order to ensure behavior
modification
To ensure compliance with metrics, need to create
dashboards or other measures to keep Physicians
informed of progress
41

Evolving Population Health Models

43
Preparing for Shifting Incentives
Slide courtesy of the Advisory Board Company

44
Payment At Risk
2010 2011 2012 2013 2014 2015 2016 2017
Inpatient Quality Reporting Requirement (IQR, Formerly RHQDAPU) 2% at risk
Value-Based Purchasing (VBP) 2 % at Risk
Meaningful Use 5% at risk
Readmission 3% at risk
HAC 1% at risk
VBP VBP
Hospital Acquired Conditions (HAC)
Readmission
Charles S. Lauer, Hospital Executive Summit – January 28, 2012
13% of payment at risk will private insurers may follow suit!

45 Hussey P., et al. New England Journal of Medicine 2009;361:2109-2111
Greatest Opportunity to Bend the Cost Curve

46
Bundled Payment – A Simple Illustration
Inpatient and Post-Acute Episodes of Care
Fee-for-Service
Payer
Hospital
Anesthesiologist
Consulting
Physician
Hospitalist
Surgeon
$ $ $ $ $ $
Post-acute
Services
Bundled Payment
Payer
Hospital Inpatient Physicians
$
Payer provides
single payment
intended to cover
costs of entire
patient
hospitalization &
30, 60 or 90 days
Post-acute
Services
Slide courtesy of the Advisory Board Company

47
$0
$10,000
$20,000
$30,000
$40,000
$50,000
$60,000
$70,000
$80,000
$90,000
Historic Payment Discount Bundled Payment Bundled Payment withReadmission
$63,160 $60,755
$60,755
$10,850 $2,405 $10,850 $10,850
$10,741
Hospital Payment Physician Payment Bundled Pmt Readmission (15%)
$74,010 $71,605 $82,346
Payment amounts are for demonstration purposes and do not reflect actual payments.
MS-DRG = Medical severity diagnosis-related group.
Bundled Payment – A Simple Illustration

Evaluation Process - Bundled Payment

CMMI Program-4 Models
Section 115A of SSA authorized CMS to test innovative
payment and service delivery models to potentially
reduce program expenditures while improving quality of
care
Model 1
Retrospective Acute Care-Hospital Only
Model 2
Retrospective Acute Care Hospital Stay Plus Post-Acute Care
Model 3
Retrospective Post-Acute Care Only
Model 4
Acute Care Hospital Stay Only
49

Current and Future Proposed Models
Payment of Bundle
Acute Care Hospital Stay
Only
Acute Care Hospital Stay plus Post-acute Care
Post-acute Care Only
Chronic Care
“Retrospective”
(Traditional FFS
payment with
reconciliation
against a
predetermined
target price after the
episode is
complete)
Model #1 Model #2 Model #3 Model #7
“Prospective”
(Single prospective
payment for an
episode in lieu of
traditional FFS
payment)
Model #4 Model #5 Model #6 Model #8
Current
Future (projected announcement 1/2013)
Bundled Payment – CMMI Approach
50
Slide courtesy the Camden Group

51
Eligible Awardees Model 2 Model 3 Model 4
Physician group practices
Acute care hospitals paid under the IPPS
Health Systems
Long-term care hospitals
Inpatient rehabilitation facilities
Skilled nursing facilities
Home health agency
Physician-hospital organizations
Post acute providers
Conveners of participating healthcare providers
Types of Services Included in Bundle Model 2 Model 3 Model 4
Inpatient hospital services
Physician services
Related post-acute care services
Post-acute care services
Related readmissions
Other services defined in the bundle
Model Differences – Models 2 -4
Slide courtesy the Camden Group

52
Bundled
Payment Readiness
Assessment
EFFICIENCY
Capacity
Efficiency Index
Integrated Care Delivery
Effective Care Transitions
Readmission Exposure
FINANCIAL IMPACT AND
MARKET OPPORTUNITY
Market Size and Opportunity
Impact of Medicare Discount
Commercial Plan Strategy
Readmission Exposure
VBP Impact
PEOPLE/CULTURE
Physician Leadership Competency
Institute Leadership
Culture of Collaboration
Cultural Preparedness for Co-
management
Ease of Change Acceptance
PHYSICIAN ALIGNMENT
Interest in Participation
Willingness to Lead
Employed vs. Independent
Alignment of Incentives (top to
bottom)
Readiness for Clinical Integration
QUALITY
Quality Oversight and Infrastructure
Clinical Performance Measurement
Embedded Best Practice Care
Protocols
Competence in Change Management
Summa Cardiovascular Institute
Slide courtesy the Camden Group

Key Questions
Does the Organization have the cultural commitment to
develop new model of care?
Which model and what DRGs should be included?
Episode Definition?
What will be the financial impact to the Organization
from discount on Cardiac Services to Medicare?
How does the Organization currently perform on clinical
performance benchmarks?
Does the Organization have willing partners in its
Providers to reduce costs and improve efficiency of
care delivery?
53

Key Questions (cont.)
Do we need to partner with our Cardiologists through a
Clinical Co-Management Agreement?
Will our Providers agree to standardization without
substantial Gainshare or other incentives?
What are the risks of not adopting Bundled Payment
model? Likelihood of CMS moving to implement model
for both acute and post-acute care?
Will the Organization have the growth necessary to
make participation in the Bundled Payment program
successful?
54

55
SACH
Assessment of Readiness for Cardiac Bundled Payments - Summary of Findings
Criteria Rating Rationale
Quality ◑ Quality outcomes consistent with existing ACE sites with some room for
improvement; however, processes can be inconsistent and result in
underperformance.
Efficiency ◕ Adequate capacity to accommodate incremental volume of Medicare fee-for-
service beneficiaries. Medical directors demonstrate knowledge of current
performance on aggregate efficiency measures and have done significant
work in the area of implantable devices; however, there is a history of
resistance to standardization.
People and Culture ◑ Leadership is supportive and encouraged by the potential of bundled
payment; lack of clarity and inconsistent knowledge sharing across SCI stifles
development of a culture of accountability and sustained best-practices.
Physician Alignment ◑
Siloed SCI organizational structure contributes to physician perception that
they do not have an ability to effectively influence care delivery; some
physicians are anxious about level of standardization required to succeed in
bundled payment.
Financial Impact/
Market Opportunity ◕ SCI has adequate volume and market share to ensure economies of scale
and generate additional volume, and there is opportunity for positive
operational and financial results under bundled payment.
Summary of Findings
Readiness Assessment
Slide courtesy the Camden Group

56
Summa Akron City Hospital Quality Performance Compared to Current Demonstration Sites
https:/ /sharepoint.thecamdengroup.com/Clients/Summa/Bundled_Payment_Assessment/ [ACE_Cardiac_Comparisons.xlsx]Graphs https:/ /sharepoint.thecamdengroup.com/Clients/Summa/Bundled_Payment_Assessment/ [ACE_Cardiac_Comparisons.xlsx]Graphs
Source: Akron City Hospital and The Camden Group
Notes: ACE Demonstration site data represents CY 2007 experience
Premier 90th percentile benchmarks are not available for Pacemaker data
* Indicates that data represents experience from Q4 2010 - Q3 2011
0.0%
5.0%
10.0%
15.0%
20.0%
25.0%
30.0%
35.0%
40.0%
45.0%
PCI Defibrillator Pacemaker * CABG Valve
Akron City Performance on Cardiac ACE Measure 17 (30-Day Readmission Rate) in Comparison to Five ACE Demonstration
Sites and Premier 90th Percentile BenchmarksQ3 2010 - Q2 2011
Akron City Hospital Premier 90th Percentile Benchmark Range of Current ACE Sites
Note: Lower percentages are better
Akron City: 13.1%Premier 90th %ile:
0.7%
Akron City: 6.9%Premier 90th %ile:
0.6%
Akron City: 13.5%
Akron City: 12.0%Premier 90th %ile:
7.0%
Akron City: 14.7%Premier 90th %ile:
9.5%
Readiness Assessment - Quality
Slide courtesy the Camden Group

57
Opportunity – Decrease In Length of Stay
Opportunity – Decrease In Supply Cost
Opportunity – Decrease In Readmission Rate
Gain Sharing – Up To 50 of Savings
Gainsharing: Opportunity to Partner with Physicians

58
17.6%
18.1%
20.2%
22.0%
18.4%
21.9%
18.0%
19.8%
18.2%
20.7%
21.3%
20.2%
21.7%
20.8%
20.3%
21.9%
21.1%
18.8%
18.5%
18.1%
19.1%
19.0%
19.5%
19.8%
17.7%
19.9%
19.7%
19.4%
18.2%
19.6%
17.0%
17.3%
19.2%
20.1%
19.4%
19.5%
19.0%
16.3%
16.2%
16.6%
16.5%
13.3%
15.7%
16.4%
17.4%
14.2%
17.6%
19.5%
16.2%
17.1%
20.2% to 23.2%
19.2% to 20.1%
17.6% to 19.1%
13.0% to 17.5% Source: New England Journal of Medicine. April 2009
U.S. Hospital Readmission Prevalence
Opportunity – Reduce Readmission Rate
Slide courtesy the Camden Group

59
Assign Responsibilities and Due Dates to
Client and Camden
Establish SharePoint Site
(Application Documents, Draft
Templates)
Identify The Camden Group’s
Finance Lead
Identify Project Liaison
Identify Preliminary Application
Model
Section A: Applicant
Organization Information
Executive Summary (Q:8)
Applicant Organization Information
(Q:1-5)
Summary of Organization
(Q:7)
Complete Table A6
(Q:6)
Attachments
CEO Letter of Financial
Commitment
Physician Gainshare
Letters
Physician Letters of Support
Administration Review
Final Review
First Review
Ongoing Section Review
Review
Second Review
Section B: Model Design
Section C: Financial Model
Section D: Quality of Care and
Patient Centeredness
Section E: Organizational Capabilities
Section F: Certification
Identify Models (Q:1)
Complete Table C1 Historical Payments
(Q:1)
Quality Improvement
(Q:1-7)
Financial Arrangements
(Q:1-8)
Certification of Application
Episode Definitions
(Q2-5)
Complete Table C2: Summarizing
Payment(Q:2)
Complete Table D2 Proposed Measures
(Q:2)
Complete Table E8 Payer Mix
(Q:8)
Complete Table B2
(Q:2)
Define Risk Adjustment Approach
(Q:3)
Quality Assurance (Q:8-14)
History and Experience (Q:9-17)
Complete Table B4 Propose
Readmission Exclusions (Q4)
Historical Payments and Cost
Savings (Q:4- 6)
Complete Table D12:
Certifications (Q:12)
Readiness and
Partnership (Q:18-29)
Complete Table B5 Proposed ICD9 Exclusions (Q:5)
Beneficiary Protection (Q:15-18)
Implementation Plan (Q:27)
Provider Engagement
(Q:6-10)
Care Improvement
(Q:11-14)
Gainsharing (Q:15-19)
CMMI Application Process
Slide courtesy the Camden Group

Business Case Assumptions

61
Updated baseline projections Summa Akron City Hospital
Business Case Update
Business Case Projection Period (1) Business Case
Year 1 Year 2 Year 3 Update
Assumptions
Number of Cases 616 628 642 1,886
Payment Discount of 3.25% Applied ($348,631) ($355,489) ($362,919) ($1,067,038)
Incremental Program Costs
Marketing ($100,000) ($100,000) ($100,000) ($300,000)
Cost of Administering Claims (2) ($15,402) ($15,710) ($16,040) ($47,152)
Subtotal Program Costs ($115,402) ($115,710) ($116,040) ($347,152)
Cost Saving Opportunities
Reduction in Average Length-of-Stay $136,279 $208,491 $283,804 $628,573
Reduction in Implant Costs $44,072 $44,910 $45,808 $134,790
Reduction in Readmissions $131,182 $133,805 $136,615 $401,603
Subtotal Cost Savings $311,532 $387,206 $466,227 $1,164,966
Estimated Gainsharing Bonus (3) ($155,766) ($193,603) ($233,114) ($582,483)
Net Financial Impact ($308,266) ($277,596) ($245,845) ($831,707)
Gainshare Bonus per Case $253 $308 $363 $309
Maximum Gainshare Bonus
(50% of Part B) ($897,403) ($915,351) ($934,574) ($2,747,328)
C:\Users\amedlin.CONSULTING\Documents\Summa\[Summa_Akron_Model_HRC_Analysis_Tables_Convergence_v2.xlsx]BCase_Update
(1) Based on Summa Akron CY 2010 Medicare FFS volume and financial performance of selected MS-DRGs(2) Used $25 per case assumption from original Business Case.(3) Estimated Gainsharing Bonus was calculated as 50% of Cost Savings Opportunities. Does not include Discount or Programs Costs.
Business Case Summary – Summa Akron City Hospital

Business Case Assumptions-New Developments
CMMI changes the discount rate from 3.1 to 3.25
percent for Acute Care Episode (“ACE”) MS-DRGs
CMMI also imposed new definitions of related
readmissions (standard readmissions within 30 days of
discharge from anchor admission) which adds risk for
additional MS-DRG readmissions
CMMI to provide claims data during Phase I period to
include beneficiary level claims specific to participant
62

63
1. Ability to gain share with physicians: 50 percent over Medicare FFS rates
2. Discount to CMS with no promise of incremental volume
3. Defining the Episode of Care
•Readmission risk
•Elective procedures are well tested under this payment methodology
4. Physician Leadership and Engagement
•Improve and ensure high quality
•Reduce costs and provide healthcare value
5. Organizational Readiness
Use of standardized best practice care protocols
IT infrastructure
Access to cost and quality data at provider and patient level
Strategic Decisions

Summa Health System
Bundled Payment for Care Improvement Initiative Model 4
SCI Operations Group
Bundled Payment Steering Committee
Final Decision Making Authority
Ensure Highest Level of Quality is Maintained
Political and Strategic Considerations
System Knowledge Transfer
Implementation Oversight Monitoring
Physician Alignment
Executive Team
Quality and PI
• Care Redesign Initiatives
• Quality Reporting
• Report Card
• Effectiveness Monitoring Plan
• Management and Staffing Roles and Responsibilities
Gainsharing
• Participation Criteria
• Participation Agreement
• Metric Development
• Compliance
• Monitoring
• Evaluation
Financial and Audit Process
• TPA
• Beneficiary Identification
• Reporting
• Protocol Template
• List of Enrolled Practitioners
• Evaluation and Monitoring Plan
Communications and Marketing
• Beneficiary Education and Notification
• Physician
• Communications
• Marketing to Consumers
• Messaging to Internal Stakeholders
Information Technology
• Shared Portal and Email Distribution List
• EMR Interface
• Reports
• Patient Identification and Notice of Admission
Legal
• Contracting
• Compliance
• Regulatory
• Gainshare Agreement
• Provider Agreement
• TPA Contract
• PSA Considerations
64

65
Phase I “No Risk” Period
1/1/2013
Review Contract Agreement 3/31/2013
Implementation Protocols to CMS
4/30/2013
CMS Deadline to Review
Protocols5/30/2013
Phase II “At Risk” Period 7/0113
Time Line for Implementation
Slide courtesy the Camden Group

Lessons Learned

Lessons Learned
Bundled Payment will develop core organizational
competencies in the Hospital and its Physicians
through advancing Clinical Integration
Establish a Model of Cardiac Bundled Payments that
can be replicated in other Service Lines and with both
Commercial and Governmental Payers
Build a foundation to grow market share through
delivering higher value care (better clinical outcomes,
lower cost and higher patient satisfaction)
Utilize synergies that exist among other Population
Health models to allow for most effective jump from
Fee-For-Service to Value-Based Payments
67

Lessons Learned (cont.)
Focus on key drivers of readmission and build
evidenced-based care pathways to prevent avoidable
readmissions.
Involve Process Improvement staff to drive redesign of
care delivery system while building team based-
approach through inclusion of providers, business,
staff and care managers
Develop scorecards to foster accountability through
dissemination of Provider performance data
68

Questions?
Recommended


